guidelines for utah's corrective action process for … for utah's corrective action...
TRANSCRIPT

Guidelines for Utah's
Corrective Action Process
for
Leaking Underground
Storage Tank Sites
prepared by the Leaking Underground Storage Tank Program
Division of Environmental Response and Remediation Utah Department of Environmental Quality
THIRD EDITION FINAL DRAFT
October 30, 2005
Updated March 2015

i
TABLE OF CONTENTS Page List of Figures .............................................................................................................................................. iii List of Tables ............................................................................................................................................... iii Acknowledgments......................................................................................................................................... v List of Terms and Definitions ...................................................................................................................... vi List of Acronyms and Abbreviations ......................................................................................................... xiv 1.0 Introduction...................................................................................................................................1-1 1.1 Organization of this Document........................................................................................1-1 1.2 Use of Alternative Cleanup Standards in Utah’s UST Program......................................1-4 1.3 Optional Tier 2 Risk-Based Evaluation ...........................................................................1-6 1.4 Risk Management Requirements .....................................................................................1-6 1.5 Confirmation Sampling and Compliance Monitoring Requirements ..............................1-7 1.6 Institutional Control .........................................................................................................1-8 1.7 No Further Action Letter .................................................................................................1-9 2.0 Utah’s LUST Corrective Action Process ......................................................................................2-1 3.0 Tier 1 Screening Process...............................................................................................................3-1
3.1 Overview of Tier 1 Screening Process.............................................................................3-1 3.2 Site Assessment Information ...........................................................................................3-1 3.3 Tier 1 Screening Levels ...................................................................................................3-1 3.4 Tier 1 Worksheet .............................................................................................................3-2 3.5 Completing the Tier 1 Worksheet....................................................................................3-5 Facility Information ....................................................................................................3-5 Site Assessment Information ......................................................................................3-5 Contaminant Source Information...........................................................................3-5 Land Use Information ............................................................................................3-5 Soil Information .....................................................................................................3-6 Groundwater Information ......................................................................................3-6 Distance from Source to Nearest Potential Receptors ...........................................3-6 Facility Site Map.........................................................................................................3-7 Supplemental Information...........................................................................................3-7 Tier 1 Screening Level Evaluation..............................................................................3-7 Recommended Tier 1 Actions.....................................................................................3-7
4.0 Risk Assessment Process ..............................................................................................................4-1 4.1 Overview of the Tier 2 Risk Assessment Process............................................................4-1 4.2 Required Procedures for All Tier 2 Options ....................................................................4-4 Preliminary Exposure Pathway Evaluation and Required Response Actions.............4-4 Tier 2 Exposure Assumptions and Evaluation Procedures .........................................4-7 Type of Receptor.........................................................................................................4-7 On-Site Exposure Locations .......................................................................................4-7 Off-Site Exposure Locations.......................................................................................4-7 Point of Exposure........................................................................................................4-7 Exposure Factors.........................................................................................................4-7 Cleanup Criteria and Applicable Monitoring Locations .............................................4-8

ii
TABLE OF CONTENTS, continued Page
On-Site Exposures ......................................................................................................4-8 Off-Site Exposures....................................................................................................4-12 Alternate Monitoring Points......................................................................................4-12 Target Excess Risk Limits ........................................................................................4-13 Land Use Assumptions and Applicable Exposure Factors .......................................4-13 Constituents of Concern............................................................................................4-13 Development of RBSL or SSCL Values...................................................................4-14 General Procedures for Deriving Tier 2 NAF Values...............................................4-14 Empirical Analysis....................................................................................................4-15 Fate and Transport Modeling....................................................................................4-15 4.3 Tier 2 Options 1 through 4 Data Requirements and Calculation Methods ....................4-15 Option 1 Site-Specific Cleanup Levels .....................................................................4-16 Option 2 Site-Specific Cleanup Levels .....................................................................4-16 Option 3 Site-Specific Cleanup Levels .....................................................................4-17 Option 4 Site-Specific Cleanup Levels .....................................................................4-17 4.4 Tier 2 Step-By-Step Procedures and Documentation ....................................................4-18 5.0 Procedures and Format for the Tier 2 Risk Assessment Report ...................................................5-1 5.1 Introduction......................................................................................................................5-1 5.2 Tier 2 Risk Assessment Report Format for all Options ...................................................5-1 5.3 Option 1 Procedures.........................................................................................................5-3 5.4 Option 2 Procedures.........................................................................................................5-4 5.5 Option 3 Procedures.........................................................................................................5-5 5.6 Option 4 Procedures.........................................................................................................5-7 6.0 References Cited ...........................................................................................................................6-1 Appendix A Screening Levels for Petroleum- Contaminated sites .....................................................A-1 A-1 Introduction.....................................................................................................................A-1 A-2 Excess Risk .....................................................................................................................A-2 A-3 Chemical Specific Properties..........................................................................................A-2 A-4 Exposure Scenarios.........................................................................................................A-5 A-5 Groundwater and Soil Parameters ..................................................................................A-6 Appendix B Tier 2 Risk Assessment Worksheets............................................................................... B-1 General Instructions for Completing the Tier 2 Risk Assessment Worksheets .......................... B-2 Worksheet #1: Risk Assessment Report ................................................................................. B-3 Worksheet #2: Data Requirements ....................................................................................... B-22 Worksheet #3: Site Conceptual Exposure Model ................................................................. B-58 Worksheet #4a: Plume Stability Results................................................................................. B-62 Worksheet #4b: Mass Calculations for Initial and Ending Dissolved Phase .......................... B-64 Worksheet #4c: Mass Calculations for Initial and Ending Adsorbed Phase........................... B-64 Worksheet #4d: Determining Percent Reduction in Dissolved COC Concentrations in Contaminant Plumes..................................................................................... B-65 Worksheet #4e: Statistical Evaluation of Plume Stability ...................................................... B-66

iii
TABLE OF CONTENTS, continued
Page Appendix C Site-Specific Data Requirements and Attachments ........................................................ C-1 Appendix D Calculations for Site-Specific Cleanup Levels ...............................................................D-1 LIST OF FIGURES Section 2 Figure 2-1 Utah’s LUST Corrective Action Process ..................................................................2-2 Section 4 Figure 4-1 Utah’s RBCA Tier 2 Risk Assessment Process ........................................................4-3 Figure 4-2 Compliance Monitoring Locations and Applicable Concentration Limits ............4-10 Figure 4-3 Definition of Source Term for Use in the Domenico Solute Transport Model .......4-11 Figure 4-4 Risk Management Options for Complete Exposure Pathways................................4-30 Appendix B Figure B-1 Hypothetical Exposure Pathways and Initial Screening Criteria............................ B-59 Appendix C
Figure C-1 Site Map ................................................................................................................... C-3 Figure C-2 Vicinity Map ............................................................................................................ C-4 Figure C-3 Groundwater Elevation Maps................................................................................... C-5 Figure C-4 Contaminant Iso-Concentration Maps...................................................................... C-6 Figure C-5 Electron Acceptor and Metabolic By-Product Iso-Concentrations Maps ................ C-7 Figure C-6 Example Graph of Groundwater Elevation and Contaminant Concentrations Over
Time ......................................................................................................................... C-8 Figure C-7 Example Graph of Groundwater Elevation and Free Product Thickness Over
Time ......................................................................................................................... C-9
Appendix D Figure D-1 Procedures for Locating Alternate Monitoring Points (AMPs) and
Calculating Action Levels (ALs) ...........................................................................D-25 Figure D-2 Example of Graphic Modeling Results ..................................................................D-27 Figure D-3 Example of BIOSCREEN Modeling Results .........................................................D-28
LIST OF TABLES Section 1
Table 1-1 Comparison of Risk-Based Corrective Action Methods ...........................................1-3 Table 1-2 Initial Screening Levels.............................................................................................1-5 Table 1-3 Tier 1 Screening Criteria ...........................................................................................1-5

iv
TABLE OF CONTENTS, continued LIST OF TABLES, continued Page Section 3
Table 3-1 Utah’s Tier 1 Screening Worksheet ..........................................................................3-3 Section 4
Table 4-1 Applicable Point of Compliance (POC) and Point of Exposure (POE) Locations for Tier 2 SSCL Calculations ...................................................................4-6
Section 5 Table 5-1 Exposure Evaluation Chart for Residential and Commercial/Industrial Land Uses..................................................................................................................5-1 Appendix A Table A-1 Input Parameter Data for ISLs and Tier 1 SLs .........................................................A-8 Appendix B
Table B-1 Site-Specific Cleanup Levels for Surface Soil ....................................................... B-17 Table B-2 Site-Specific Cleanup Levels for Subsurface Soil.................................................. B-18 Table B-3 Site-Specific Cleanup Levels for Groundwater...................................................... B-19 Table B-4 Example of Action Levels for Alternate Monitoring Points for the
Groundwater Exposure Pathway ............................................................................ B-20 Table B-5 Guide for Evaluating Exposure .............................................................................. B-60
Appendix C
Table C-1 Data Requirements Checklist ................................................................................... C-2 Table C-2 Soil Closure and Confirmation Sample Analytical Results.................................... C-10 Table C-3 Groundwater Closure Sample Analytical Results .................................................. C-11 Table C-4 Groundwater Monitoring Analytical Results ......................................................... C-12 Table C-5 Groundwater Monitoring Analytical Results for Contaminants and
Electron Acceptors ................................................................................................. C-13 Table C-6 Logs of Monitoring Wells, Borings, Drive Points and Test Pits ............................ C-14 Table C-7 Hydraulic Testing ................................................................................................... C-15 Table C-8 Cross-Section Requirements .................................................................................. C-16
Appendix D
Table D-1 Exposure and Cross-Media Transport Equations .....................................................D-4 Table D-2 TPH Fraction-Specific and Chemical-Specific Property and Toxicity
Values.....................................................................................................................D-16 Table D-3 Determination of RBSL and SSCL Values for Total Petroleum Hydrocarbons
(TPH)......................................................................................................................D-22

v
ACKNOWLEDGMENTS This document was originally completed on July 30, 1999. The completion of this document would not have been possible without the hard work and dedication of individuals and organizations involved with the Partners in RBCA Implementation (PIRI). Specifically, we would like to acknowledge the following members of Utah’s PIRI Committee: Craig Anderson, Sinclair Oil Corporation Steve Canning, Utah Division of Fleet Operations John Christensen, EnviroSearch International John Connor, Groundwater Services, Inc. Scott Everett, Utah Division of Environmental Response and Remediation David Friz, EWP Geoffrey Gilman, Amoco Corporation Kent P. Gray, Utah Division of Environmental Response and Remediation Kathy Harris, Delta Environmental Consultants John Hill, Utah Petroleum Marketers Association Gene Inglesby, Western Petroleum Marketers Association Robin V. Davis, Utah Division of Environmental Response and Remediation Rolf Lange, EnviroSearch International Ron Love, Salt Lake City Corporation Tom Meyer, Roy F. Weston, Inc. Dianne Nielson, Utah Department of Environmental Quality Lee Peacock, Utah Petroleum Association Jenny Phillips, RETEC Dave Rickers, Kleinfelder Lori Robison, SECOR International Incorporated Victor Scherer, Utah Division of Environmental Response and Remediation Jan Snyder, Parsons Engineering Science, Inc. Dale Urban, Utah Division of Environmental Response and Remediation Holly Welsh, ROCS Bryan D. Whitaker, Utah Divison of Environmental Response and Remediation Steve Woodhead, Chevron Products Company Gene Wright, Parsons Engineering Science, Inc. Paul Zahn, Utah Division of Environmental Response and Remediation In October of 2005, a rule change to Utah Admin. Code R311-211 Corrective Action Clean-Up Standards Policy – UST and CERCLA Sites, made it necessary to edit, update and modify this document. It was also determined that the “Guidelines for Utah’s Tier 1 Risk-Based Corrective Action, 2004” should be incorporated into this document. The workgroup assigned to complete this task included Morgan Atkinson, Robin Davis, Scott Everett, Huong (Sylvia) Tran, and Paul Zahn. In November 2010, the surrogate for the C22-C35 hydrocarbon fraction was changed to heptadecane. In March 2015, corrections were made to the titles of Equations D.11 and D.12.

vi
LIST OF TERMS AND DEFINITIONS (Please see Utah Admin. Code R311-200 for definitions of other important terms not found in the following list) • Action Levels (ALs) - Contaminant concentrations that must be met at an Alternative Monitoring
Point (AMP). ALs are calculated by first determining the distance between the AMP and the receptor, then applying that distance to the exposure and cross-media transport equations (same as those for calculating Risk-Based Screening Levels (RBSLs) and SSCLs) to determine the contaminant concentration required at the AMP to meet the RBSL at the receptor.
• Active Remediation - Actions taken to reduce the concentrations of COC. • Air Dispersion Factor (ADF)- Attenuation of contaminants due to transport in air. • Alternate Monitoring Points (AMPs) - Contaminant monitoring points at which contaminated
media must be monitored and in which Action Levels (ALs) must be met. AMPs ensure that receptors will not be impacted by contaminant concentrations greater than the RBSL. AMPs are located at some site-specific distance between the source of contamination (point of compliance) and the receptor (point of exposure, POE). AMP locations are required, at a minimum, along the plume centerline, and are based on the site-specific contaminant transport regime and on a contaminant travel time of one year from the AMP to a receptor (POE).
• American Society for Testing and Materials (ASTM) - ASTM is a not-for-profit organization that
writes standard test methods, specifications, practices, terminologies, guides and classifications for materials, products, systems and services that encompass metals, paints, plastics, textiles, petroleum, construction, energy, the environment, consumer products, medical services and devices, computerized systems, electronics and many other areas.
• Attenuation - The reduction in concentrations of COC in the environment with distance and time
due to processes such as diffusion, dispersion, adsorption, chemical degradation and biodegradation.
• Board - The Utah Solid and Hazardous Waste Control Board. • Cleanup Levels (CLs) - see Site-Specific Cleanup Levels. • Complete Exposure Pathway - An exposure pathway for which a transport mechanism is actively
placing receptors at risk of exposure to the contamination being transported, as shown below:
1. For the Risk Assessment Proposal only, an exposure pathway is considered complete when a contaminant concentration in the source zone exceeds the applicable Tier 1 criteria (Utah Tier 1 screening levels and distance to receptors), and if one or both of the following conditions exist at the site:
a. The mechanism for contaminant transport would be active in the absence of any
existing or future control measures, or;

vii
LIST OF TERMS AND DEFINITIONS (Continued)
b. Receptors (POEs) could be potentially in contact with the affected media.
“Potential” means anticipated changes in site conditions within 5 to 10 years.
2. For the Risk Assessment Report, an exposure pathway is considered complete when all of the following conditions are present at the site:
a. A contaminant concentration in the source zone exceeds the applicable Tier 1
criteria (Utah Tier 1 screening levels and distance to receptors);
b. The mechanism for contaminant transport would be active in the absence of any existing or future control measures, and
c. Receptors (POEs) could be potentially in contact with the affected media.
“Potential” means anticipated changes in site conditions within 5 to 10 years. • Confirmation Sample - Environmental samples that are collected during or after corrective action
activities to verify compliance with applicable standards. • Constituents of Concern (COC) - Also called Contaminants of Concern. Specific constituents or
chemicals that are identified for evaluation in the risk assessment process. For the purpose of this document, COCs may include benzene, toluene, ethylbenzene, xylenes, naphthalene, MTBE, total petroleum hydrocarbons, oil and grease, total recoverable petroleum hydrocarbons, and other regulated substances.
• Corrective Action - Activities conducted to protect human health, safety, and the environment.
These may include but are not limited to, recovering free product, designing and operating cleanup equipment and actions, conducting sampling and monitoring to monitor progress of cleanup actions, implementing environmental controls, evaluating risks, and making no further action decisions.
• Corrective Action Plan (CAP) - A document prepared by an Owner/Operator pursuant to Utah
Code Ann. § 19-6-420 that evaluates all hydro geologic data, compares all available cleanup technologies for their technical and economic feasibility, and proposes corrective actions which may consist of source abatement or removal, monitoring, cleanup using various methods, or other methods of protecting receptors.
• Critical Distance - Distances between the highest measured concentration of any contaminant that
is greater than the initial screening levels but less than or equal to the Tier 1 screening levels and receptors, as described in the Tier 1 Screening Process.
• Data Entry Field - A location on the Worksheets where information is input. • Dilution Attenuation Factor (DAF) - Attenuation due to occurrence and transport of a dissolved
contaminant phase.
viii
LIST OF TERMS AND DEFINITIONS (Continued)
• DERR - The Utah Division of Environmental Response and Remediation, a division of the Utah
Department of Environmental Quality. • Direct Exposure Pathway - An exposure pathway where the point of exposure is at the source
area, without an impact to any other medium. • Engineering Controls - Physical measures to keep contamination away from a receptor.
Examples include fences, paving, vapor extraction and vapor barriers. • Established Levels - Established levels of contamination that, depending on site-specific
conditions, may be MCLs, ISLs, Tier 1 SLs or Tier 2 SSCLs. • Evaluation Criteria - Criteria used by the Utah Department of Environmental Quality, DERR to evaluate
the closure of LUST case files. These criteria are contained in Utah’s Cleanup Rules and include: (1) elimination of a contaminant source by removal or control, (2) evaluation of current and potential impacts to public health, (3) evaluation of current and potential impacts to the environment, (4) economic considerations and cost-effectiveness of cleanup options, and (5) technology available for use in cleanup.
• Executive Secretary - Executive Secretary (UST) of the Utah Solid and Hazardous Waste Control
Board. • Exposure - Contact of a human or other ecological organism with COCs. • Exposure Assessment - The determination or estimation (qualitative or quantitative) of the
magnitude, frequency, duration and route of exposure. • Exposure Medium - The environmental medium through which an organism may be exposed to
COC. Exposure media include the following: ambient air and indoor air that may be impacted by contaminant volatilization; groundwater that may be impacted by dissolved contaminants or contaminants leaching from soil to groundwater, and; soil that may be impacted by adsorbed contaminants.
• Exposure Pathway - The course or route COCs take from a contaminant source area to an
exposed organism. An exposure pathway describes a unique mechanism by which an individual or population is exposed to COCs. Each exposure pathway includes a source or release from a source, an exposure point, and an exposure route. If the exposure point differs from the source, a transport/exposure media (e.g., groundwater) is included. Exposure pathways involve transport of contamination through exposure media (air, groundwater and soil).
• Exposure Route - The course and manner in which COCs come in contact with an organism via
ingestion, inhalation or dermal contact. • Hazard Index - The sum of more than one hazard quotient for multiple substances and/or multiple
exposure pathways. The hazard index is calculated separately for chronic, sub-chronic and shorter-duration exposures.

ix
LIST OF TERMS AND DEFINITIONS (Continued)
• Hazard Quotient - The ratio of a single substance exposure level over a specified period of time to
a reference dose for that substance derived from a similar exposure period. • Impacted Medium - The environmental media (i.e., air, soil, water) that has been impacted by
COCs. • Initial Screening Levels (ISL) – A set of screening values developed using Federal/State
Maximum Contaminant Levels (MCLs) to determine if soil and/or groundwater is contaminated with petroleum constituents. ISLs would be protective of all exposure scenarios, exposure pathways and land use.
• Institutional Controls – Utah Code Ann.§§ 19-10-101 to –108, Environmental Institutional
Control Act. Measures taken to keep receptors away from contamination. Typically, they involve restrictions on use or access to a site or facility to eliminate or minimize potential exposure to COCs, and may include, deed restrictions, restrictive land use, and/or engineering controls (measures to keep contamination away from a receptor such as fences, paving, vapor extraction and vapor barriers).
• Interim Corrective Actions - The course of action to mitigate fire and safety hazards and to
prevent further migration of hydrocarbons in their vapor, dissolved or liquid phase. • Maximum Contaminant Level (MCL) - Also known as Maximum Contaminant Limit (Utah
Admin. Code R311-211). A standard for drinking water established by the EPA under the Safe Drinking Water Act. The MCL is the maximum permissible level of COCs in water, which is used as a drinking water supply. MCLs are recognized statewide by the Divisions of Water Quality, Solid and Hazardous Waste, Drinking Water, and Environmental Response and Remediation.
• Monitoring - Conducting multiple sampling and other measurement rounds of environmental
media at regularly spaced intervals over a period of time. A minimum of one, two and five years of quarterly monitoring are required for Tier 2 Options 2, 3 and 4, respectively.
• Natural Attenuation - The verifiable natural reduction of a COC that occurs during transport away
from the source area. It is the result of natural mechanisms such as microbial activity, diffusion, dispersion, adsorption, and chemical degradation. Natural attenuation, also known as Intrinsic Remediation, is usually verified through monitoring.
• Natural Attenuation Factor (NAF) - Represents the sum effect of various natural attenuation
mechanisms. It is expressed as the ratio of the COC concentration at the source area divided by the COC concentration at the receptor or POE. The NAF includes Dilution Attenuation Factor (DAF) and Air Dispersion Factor (ADF).
• Other Applicable Standards – Other standards as determined by the Utah Solid and Hazardous
Waste Control Board.

x
LIST OF TERMS AND DEFINITIONS (Continued)
• Owner/Operator - Refers to the definition found in Utah Code Ann., § 19-6-403 (18). Operator
means any person in control of or who is responsible on a daily basis for the maintenance of an underground storage tank that is in use for the storage, use, or dispensing of a regulated substance. "Owner" means: (a) in the case of an underground storage tank in use on or after November 8, 1984, any person who owns an underground storage tank used for the storage, use, or dispensing of a regulated substance and (b) in the case of any underground storage tank in use before November 8, 1984, but not in use on or after November 8, 1984, any person who owned the tank immediately before the discontinuance of its use for the storage, use, or dispensing of a regulated substance.
• Parameter Input Data - Data values used for each parameter, such as “depth to groundwater.” • Permissible Exposure Limit (PEL) - An Occupational Safety and Health Administration (OSHA)
limit of contaminant concentrations; from Title 29 of the Code of Federal Regulations, Part 21910, Subpart Z, General Industry Standards for Toxic and Hazardous Substances. PELs are based on 8-hour time-weighted average concentrations. The OSHA PELs are intended for acute rather than chronic exposure scenarios. They also apply to working conditions in which workers are knowingly exposed to contamination and must be OSHA-trained. The use of OSHA PELs is not permissible for Utah’s Tier 2 risk assessments because exposure due to underground storage tank-related contamination is chronic. The PELs may be considered valid for use for sites, which are currently under OSHA regulations for petroleum products.
• Point of Compliance (POC) - A location(s) selected within the source area where concentrations
of the COCs must be at or below the determined target levels in media (e.g., soil, groundwater, air).
• Point of Exposure (POE) - The point at which an individual or population may come in contact
with a COC originating from a site. For the purpose of this document, the Executive Secretary has determined that POEs shall include: water supply wells, surface water bodies, structures, and underground utilities. For risk management purposes, the Executive Secretary has determined that the first down-gradient property line is to be considered a POE.
• Reasonably Achieved - As used in Utah’s Cleanup Rules, Utah Admin. Code R311-211-5,
reasonableness is based on consideration of impact or potential impact to public health and the environment, cost of cleanup and the available technology.
• Reasonably Anticipated Future Land Use - Likely future land use of a property or adjacent
property given current use, local government planning, zoning, and representations by the current Owner/Operator.
• Receptors - Persons, other ecological organisms such as fish and wildlife, water supply wells,
surface water, and sensitive habitats that are, or may be affected by a release. For the purpose of this document regarding risk management, the terms “receptor” and “Point of Exposure” may be used interchangeably.

xi
LIST OF TERMS AND DEFINITIONS (Continued)
• Reference Dose (RfD) - The toxicity value for evaluating non-carcinogenic effects resulting from
exposures to chemicals of concern. • “Regulated substance" means any substance defined in section 101(14) of the Comprehensive
Environmental Response, Compensation and Liability Act "CERCLA" of 1980, but not including any substance regulated as a hazardous waste under subtitle C, and petroleum, including crude oil or any fraction thereof that is liquid at standard conditions of temperature and pressure, 60 degrees Fahrenheit and 14.7 pounds per square inch absolute. The term "regulated substance" includes petroleum and petroleum-based substances comprised of a complex blend of hydrocarbons derived from crude oil through processes of separation, conversion, upgrading, and finishing, and includes motor fuels, jet fuels, distillate fuel oils, residual fuel oils, lubricants, petroleum solvents, and used oils.
• Risk Assessment - An analysis of the potential for adverse health effects caused by COCs to
determine the need for remedial action. Also used to develop target levels where remedial action is required.
• Risk-Based Corrective Action (RBCA) - A decision-making process for the assessment and
response to subsurface COCs from leaking underground storage tanks with the purpose of protecting human health and the environment.
• Risk-Based Screening Levels (RBSL) - Contaminant concentrations of chemical compounds for
which toxicity data are available, and are formulated from the standard exposure and cross-media transport equations. RBSLs represent contaminant levels that are expected to be protective of receptors. RBSLs must be met at receptors, or points of exposure. Because RBSLs represent receptor concentrations, a Natural Attenuation Factor is not applied.
• Risk Reduction - The lowering or elimination of the level of risk posed to human health or the
environment through initial response action, corrective action or environmental controls. • Risk Management Goals - Measures or actions taken to ensure that exposure to COCs in excess
of the TER does not occur.
• Sensitive Habitat - Surface waters, wetlands, and habitats of threatened or endangered species. • Site – The area, including soil, water or groundwater, where a release has come to be located
irrespective of facility boundaries. • Site Assessment - The collection of data on groundwater quality and potential receptors,
subsurface geology, hydrology, and site characteristics to determine the levels and extent of migration of the COC to support corrective action decisions.
xii
LIST OF TERMS AND DEFINITIONS (Continued)
• Site-Specific Cleanup Levels (SSCLs) - Risk-based levels for COCs at the source that are
expected to be protective of receptors at some distance off-site or away from the source that are developed for a particular site under the Tier 2 Risk Assessment. Utah’s SSCLs are equivalent to ASTM’s SSTLs. For Utah’s Options 2 through 4, where the point of exposure may be at some distance from a point of compliance, the SSCLs equal the RBSL multiplied by a NAF. The SSCLs represent the source area (POC) contaminant concentrations that, when affected by a NAF, are expected to attenuate to the RBSL at the POE.
• Site-Specific Target Levels (SSTLs) - Concentrations of the constituents of concern that, if
achieved throughout the source zone, will prevent applicable risk limits exceeding potential points of exposure (GSI, 1995). The SSTLs are equivalent to Utah’s SSCLs.
• Slope Factor - A plausible upper-bound estimate of the probability of a response per unit of intake
of a chemical over a lifetime of exposure to a particular level of a potential carcinogen. • Source - The source of the COC, such as an UST system or contaminated environmental media,
which could lead to exposure, or the occurrence of increasing contaminant concentrations or mass of COCs within or between environmental media. Sources may include USTs, product lines, dispensers, service bays, other UST appurtenances, free-product, or soil or groundwater with COC concentrations above Initial Screening Levels, Tier 1 criteria, calculated Tier 2 SSCLs or other applicable standards.
• Source Area - The location of the source (see above). • Subsurface Investigation - The required investigation of a site to determine the extent and degree
of the COCs, location of on-site and off-site receptors, and the potential for the COC to spread or cause an exposure to receptors.
• Surface Soil - Soil occurring between 0 feet and 3 feet below land surface. NOTE: Surface soil
may also include subsurface soil that is or has the potential to be excavated or is otherwise accessible.
• Subsurface Soil - Soil occurring at depths below 3 feet below land surface. NOTE: Subsurface
soil may also be considered surface soil if it is or has the potential to be excavated or is otherwise accessible.
• Target Excess Risk (TER) Limit - The probability of exceeding a 10-6 excess cancer risk for
carcinogenic compounds or a hazard quotient of 1.0 for non-carcinogenic compounds. • Tier 1 Criteria - Utah’s Tier 1 screening levels as define in Utah Admin. Code R311-211-6 for
COCs that are based on: (1) general conservative regional site data that are characteristic of Utah’s intermontane basins, established chemical property and chemical toxicity data; and (2) a critical distance of 30 feet from the highest measured concentration of any contaminant to subsurface utility lines, buildings and property lines, and a critical distance of 500 feet from the source area to water production wells and surface water bodies.

xiii
LIST OF TERMS AND DEFINITIONS (Continued)
• Tier 1 Screening Levels (SLs) - A set of screening values for specific petroleum contaminants for
soil and groundwater that were developed using a risk-based approach for non-site-specific exposure scenarios, potential exposure pathways and land use. The use of the Tier 1 SLs is limited to situations when the highest measured concentration of any contaminant is within the specified critical distances to receptors and remains on-site.
• Tier 2 Risk Assessment - A risk-based analysis applying RBSLs at the exposure point,
development of the SSCL for potential exposure pathways based on site-specific conditions, and establishment of points of compliance.
• Transport Mechanism - The method of movement of COCs through the environment. The
transport mechanisms for contaminants include: volatilization and dust transport of surface soils in the air exposure pathway; volatilization for subsurface soil and groundwater in the air exposure pathway; leaching to groundwater and groundwater flow in the soil-leaching-to groundwater pathway; groundwater flow in the groundwater pathway, and; direct dermal contact in the soil exposure pathway.
• 95% Upper Confidence Limit (UCL) - 95% of the UCL of the arithmetic mean.

xiv
LIST OF ACRONYMS AND ABBREVIATIONS ADF Air Dispersion Factor AFCEE Air Force Center for Environmental Excellence AL Action Level AMP Alternate Monitoring Point ASTM American Society for Testing Materials Board Utah Solid and Hazardous Waste Control Board BTEXN Benzene, Toluene, Ethylbenzene, Xylenes, Naphthalene CAP Corrective Action Plan CAS Chemical Abstract Service CERCLA Comprehensive Environmental Response, Compensation, and Liability Act cm centimeter(s) cm3 cubic centimeter COC Constituent of Concern or Contaminant of Concern CFR Code of Federal Regulations DAF Dilution-Attenuation Factor DERR Utah Division of Environmental Response and Remediation EPA United States Environmental Protection Agency ft Feet ft2 square feet ft3 cubic feet g gram(s) GSI Groundwater Services, Incorporated GW Groundwater HEAST Health Effects Assessment Summary Table

xv
LIST OF ACRONYMS AND ABBREVIATIONS (Continued)
HI Hazard Index HQ Hazard Quotient
ID Identification IRIS Integrated Risk Information System ISL Initial Screening Level kg kilogram(s) L Liter(s) LEL Lower Explosive Limit LUST Leaking Underground Storage Tank m meter(s) m3 cubic meter(s) MCL Maximum Contaminant Level or Maximum Contaminant Limit mg milligram(s) mL milliliter(s) MTBE Methyl-tert-butyl-ether NAF Natural Attenuation Factor NAPL Non-Aqueous Phase Liquid NFA No Further Action No. Number O/O Owner/Operator OSHA Occupational Safety and Health Administration

xvi
LIST OF ACRONYMS AND ABBREVIATIONS (Continued)
OSWER Office of Solid Waste and Emergency Response PEL Permissible Exposure Limit PIRI Partners in RBCA Implementation POC Point of Compliance POE Point of Exposure PST Petroleum Storage Tank RAP Risk Assessment Proposal RBCA Risk-Based Corrective Action RBSL Risk-Based Screening Level
RfC Reference Concentration RfD Reference Dose RME Reasonable Maximum Exposure ROW Right of Way SCEM Site Conceptual Exposure Model sec Second SF Slope Factor SIR Subsurface Investigation Report SL Screening Level SSCL Site-Specific Cleanup Levels SSTL Site-Specific Target Levels SW Surface Water TER Target Excess Risk THQ Target Hazard Quotient

xvii
LIST OF ACRONYMS AND ABBREVIATIONS (Continued)
TPH Total Petroleum Hydrocarbons TRPH Total Recoverable Petroleum Hydrocarbons ug microgram(s) 95% UCL 95% of the Upper Confidence Limit Unann. Unannotated UST Underground Storage Tank yd3 cubic yards # Number

1-1
1.0 Introduction The following guidelines are intended to assist owners/operators and the Division of Environmental Response and Remediation (“DERR”) in the management of leaking underground storage tank (“LUST”) sites in Utah. These guidelines provide a framework for incorporating risk-based decisions in LUST site management. These guidelines are subject to and intended to be consistent with Utah Admin. Code R311-211, Corrective Action Utah’s Cleanup Rules - UST and CERCLA Sites (Utah’s Cleanup Rules) and with EPA policy as set forth in Emergency Standard Guide for Risk-Based Corrective Action Applied at Petroleum Release Sites, OSWER Directive 9610.17 (February 24, 1995) (“EPA Directive”).
The EPA Directive states that the American Society for Testing and Materials’ Emergency Standard Guide for Risk-Based Corrective Action Applied at Petroleum Release Sites, (ASTM) E 1739-95 (“ASTM Guide”) is “one possible starting point for development of a process using risk-based approaches described in this policy statement.” The ASTM Guide was used as the starting point for the development of the following guidelines for Utah LUST sites, which are intended to be consistent with the ASTM Guide. Understanding the relationship between the following guidelines and Utah’s Cleanup Rules is critical. Utah’s Cleanup Rules recognize that cleanup to generally applicable standards is not always reasonable for petroleum releases from underground storage tanks (see Utah Admin. Code R311-211-5(c). Utah’s Cleanup Rules allow a risk-based analysis to determine a site-specific cleanup standard when the generally applicable cleanup standards are not reasonable (Utah Admin. Code R311-211-3 and -5(c). Reasonableness is based on consideration of impact or potential impact to public health and the environment, the cost of the cleanup, and the available technology (Utah Admin. Code R311-211-3). Before a site-specific cleanup standard may be considered the source of contamination must be removed (Utah Admin. Code R311-211-3). Finally, in determining cleanup standards, levels of contamination in groundwater, surface water, soils, or air will not be allowed to degrade beyond the existing contamination levels as determined through appropriate monitoring or the use of other data accepted by the Utah Solid and Hazardous Waste Control Board or the Executive Secretary as representative (Utah Admin. Code R311-211-4). The ASTM document provides guidance for evaluating risks at petroleum release sites using a three-tiered approach. The first tier (Tier 1) is a screening process that uses only general hydrogeologic information and conservative assumptions to ensure protection of potential receptors. The second and third tiers require increasingly more detailed site-specific data, as well as increasingly sophisticated contaminant fate and transport modeling to achieve greater accuracy and certainty in evaluating risks to receptors. The ASTM (1995) document contains the mathematical exposure equations for calculating risk-based screening levels (RBSLs) for a specified target excess risk (TER) limit. Utah has generally adopted the ASTM (1995) method but has modified it into a two-tiered approach for performing risk-based evaluations. Utah’s method is designed to provide systematic and consistent determinations of risk to potential receptors in accordance with the Utah’s Cleanup Rules. Like the ASTM (1995) approach, Utah’s two-tiered approach requires increasingly more detailed site-specific data and increasingly complex transient contaminant fate and transport modeling with each option upgrade in order to achieve greater accuracy and certainty in evaluating risks to receptors. Groundwater Services, Inc. worked closely with the State of Utah to develop a Utah-specific spreadsheet system for use with the ASTM RBCA approach for petroleum release sites (GSI, 1995). Table 1-1 compares Utah’s RBCA approach to ASTM’s, and to Groundwater Services, Inc.’s spreadsheet system.

1-2
1.1 Organization of this Document This introduction provides a background and an overview of Utah’s LUST corrective action process. The remaining sections and appendices in this document include the following:
• Section 2: Step-by-step guidelines for implementing Utah’s LUST corrective action process.
• Section 3: Tier 1 screening process. • Section 4: Step-by-step guidelines for implementing Utah’s optional Tier 2 Risk Assessment. • Section 5: Data evaluation and reporting procedures to be employed in the optional
Tier 2 Risk Assessment. • Section 6: References cited within this document. • Appendix A: Development of Initial Screening Levels and Tier 1 Screening Levels • Appendix B: Tier 2 Risk Assessment worksheets. • Appendix C: Tier 2 Risk Assessment site-specific data requirements and attachments. • Appendix D: Tier 2 Risk Assessment calculations and modeling results.
Current DERR policy, procedures and guidance documents for conducting subsurface
investigations, corrective action and risk assessments for LUST sites are available on the DERR LUST website.

1-3
Table 1-1: Comparison of Risk-Based Corrective Action Terminology
Tier 2 Tier 1
Option 1 Option 2 Option 3 Option 4
Utah DERR/ LUST
• Non-site-specific SLs for select exposure pathways.
• Required TER at receptors.
• Allowable 10-4 SLs when receptors are >30 feet from the highest measured concentration of any contaminant.
• Exposure equations pre-solved; SLs based on general conservative assumptions.
• Site-specific cleanup levels (SSCLs) = RBSL with no NAF.
• Required TER at receptors.
• Solve exposure/ transport equations.
• On-site receptors evaluated.
• Site-specific cleanup levels (SSCLs) = RBSL X NAF.
• Required TER at receptors.
• Solve exposure/ transport equations.
• On-site & off-site receptors evaluated.
• Site-specific cleanup levels (SSCLs) = RBSL X NAF.
• Required TER at receptors.
• Solve exposure/ transport equations.
• On-site & off-site receptors evaluated.
• Transient analytical modeling required
• Site-specific cleanup levels (SSCLs) = RBSL X NAF.
• Required TER at receptors.
• Solve exposure/ transport equations.
• On-site & off-site receptors evaluated.
• Transient analytical & numerical modeling required.
Tier 1 Tier 2 Tier 3
ASTM (1995)
• Non-site-specific RBSLs for receptors a for applicable exposure pathways.
• TER risk management decision and agency-specific.
• Exposure equations pre-solved; RBSLs based on general conservative assumptions.
• Site-specific target levels (SSTLs). • TER for receptors is agency-specific. • Cost of achieving Tier 1 RBSLs compared to cost of
performing Tier 2.
• Site-specific target levels (SSTLs).
• TER for receptors is agency-specific.
• Cost of achieving Tier 2 SSTLs compared to cost of performing Tier 3.
• May require complex modeling.
Tier 1 Tier 2 Tier 3
GSI (1995)
• Non-site-specific RBSLs for receptors b for applicable exposure pathways.
• TER risk management decision and agency-specific.
• Exposure equations pre-solved; RBSLs based on general conservative assumptions.
• Site-specific screening levels (SSSLs) = RBSL with no NAF.
• On-site receptors evaluated.
• Site-specific target levels (SSTLs) = RBSL X NAF.
• On-site & off-site receptors evaluated.
• Site-specific target levels (SSTLs) = RBSL X NAF.
• Cumulative effects may be evaluated.
• On-site & off-site receptors evaluated.
• Site-specific target levels (SSTLs) = RBSL X NAF.
• May require complex modeling.
• On-site & off-site receptors evaluated.
Differences are shown in italics a receptors or POE are at the highest measured concentration of any contaminant.
1-4
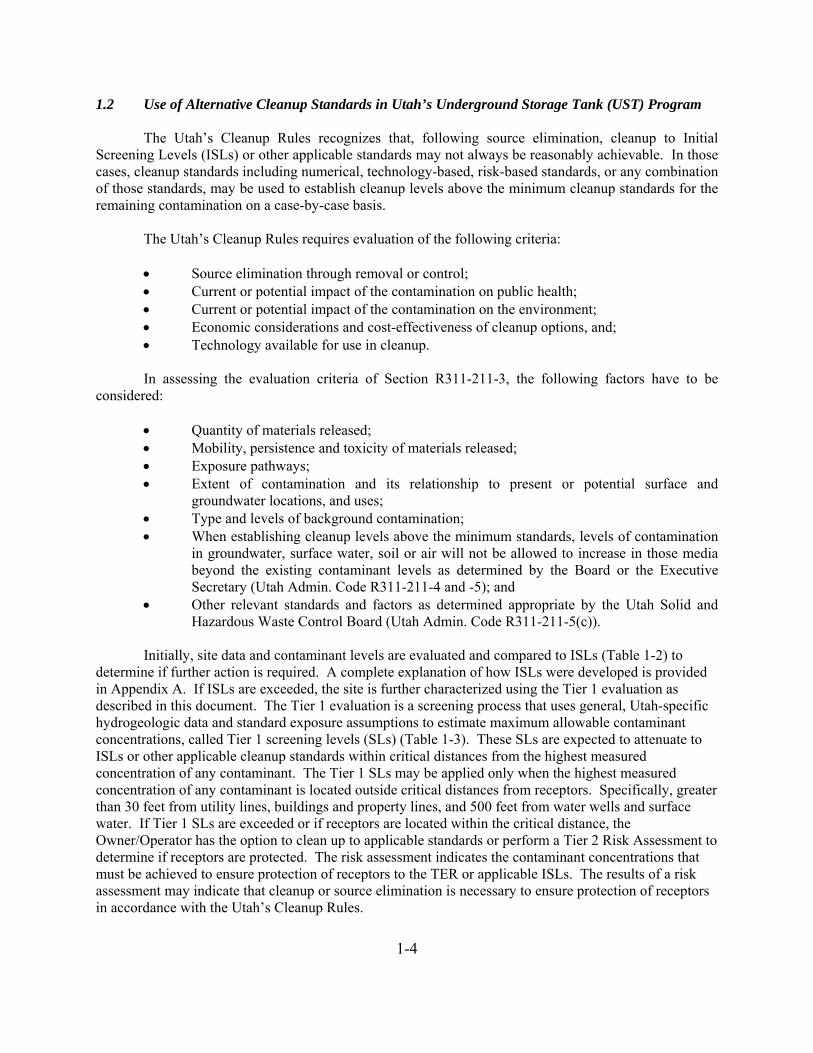
1.2 Use of Alternative Cleanup Standards in Utah’s Underground Storage Tank (UST) Program The Utah’s Cleanup Rules recognizes that, following source elimination, cleanup to Initial Screening Levels (ISLs) or other applicable standards may not always be reasonably achievable. In those cases, cleanup standards including numerical, technology-based, risk-based standards, or any combination of those standards, may be used to establish cleanup levels above the minimum cleanup standards for the remaining contamination on a case-by-case basis. The Utah’s Cleanup Rules requires evaluation of the following criteria:
• Source elimination through removal or control; • Current or potential impact of the contamination on public health; • Current or potential impact of the contamination on the environment; • Economic considerations and cost-effectiveness of cleanup options, and; • Technology available for use in cleanup.
In assessing the evaluation criteria of Section R311-211-3, the following factors have to be considered:
• Quantity of materials released; • Mobility, persistence and toxicity of materials released; • Exposure pathways; • Extent of contamination and its relationship to present or potential surface and
groundwater locations, and uses; • Type and levels of background contamination; • When establishing cleanup levels above the minimum standards, levels of contamination
in groundwater, surface water, soil or air will not be allowed to increase in those media beyond the existing contaminant levels as determined by the Board or the Executive Secretary (Utah Admin. Code R311-211-4 and -5); and
• Other relevant standards and factors as determined appropriate by the Utah Solid and Hazardous Waste Control Board (Utah Admin. Code R311-211-5(c)).
Initially, site data and contaminant levels are evaluated and compared to ISLs (Table 1-2) to determine if further action is required. A complete explanation of how ISLs were developed is provided in Appendix A. If ISLs are exceeded, the site is further characterized using the Tier 1 evaluation as described in this document. The Tier 1 evaluation is a screening process that uses general, Utah-specific hydrogeologic data and standard exposure assumptions to estimate maximum allowable contaminant concentrations, called Tier 1 screening levels (SLs) (Table 1-3). These SLs are expected to attenuate to ISLs or other applicable cleanup standards within critical distances from the highest measured concentration of any contaminant. The Tier 1 SLs may be applied only when the highest measured concentration of any contaminant is located outside critical distances from receptors. Specifically, greater than 30 feet from utility lines, buildings and property lines, and 500 feet from water wells and surface water. If Tier 1 SLs are exceeded or if receptors are located within the critical distance, the Owner/Operator has the option to clean up to applicable standards or perform a Tier 2 Risk Assessment to determine if receptors are protected. The risk assessment indicates the contaminant concentrations that must be achieved to ensure protection of receptors to the TER or applicable ISLs. The results of a risk assessment may indicate that cleanup or source elimination is necessary to ensure protection of receptors in accordance with the Utah’s Cleanup Rules.

1-5
Table 1-2: Initial Screening Levels
Contaminants * Groundwater (mg/L)
Soil (mg/kg)
Benzene 0.005 0.2 Toluene 1.0 9
Ethylbenzene 0.7 5 Xylenes 10.0 142
Naphthalene 0.7 51 Methyl t-butyl ether (MTBE) 0.2 0.3
Total Petroleum Hydrocarbons (TPH) as gasoline 1 150
Total Petroleum Hydrocarbons (TPH) as diesel 1 500
Oil and Grease or Total Recoverable Petroleum Hydrocarbons (TRPH)
10 1000
*Environmental samples which have been collected to determine levels of contamination from underground storage tanks shall be analyzed using appropriate laboratory analytical methods as referenced in Utah Admin. Code R311-205-2(d)(1).
Table 1-3: Tier 1 Screening Criteria
Tier 1 Screening Levels are applicable only when the following site conditions are met: 1.) No buildings, property boundaries or utility lines within 30 feet of the highest measured concentration of any contaminant that is greater than the initial screening levels but less than or equal to the Tier 1 screening levels AND, 2.) No water wells or surface water within 500 feet of highest measured concentration of any contaminant that is greater than the initial screening levels but less than or equal to the Tier 1 screening levels.
Contaminants * Groundwater (mg/L)
Soil (mg/kg)
Benzene 0.3 0.9 Toluene 3 25
Ethylbenzene 4 23 Xylenes 10 142
Naphthalene 0.7 51 Methyl t-butyl ether (MTBE) 0.2 0.3
Total Petroleum Hydrocarbons (TPH) as gasoline 10 1500
Total Petroleum Hydrocarbons (TPH) as diesel 10 5000
Oil and Grease or Total Recoverable Petroleum
Hydrocarbons (TRPH) 10 10000
*Environmental samples which have been collected to determine levels of contamination from underground storage tanks shall be analyzed using appropriate laboratory analytical methods as referenced in Utah Admin. Code R311-205-2(d)(1).

1-6
A flow chart of Utah’s LUST corrective action process is shown in Figure 2-1. A flow chart of Utah’s Tier 2 risk assessment process is shown in Figure 4-1. Each step in Figures 2-1 and 4-1 is described in detail to provide users with consistency and accuracy when managing LUST sites and when conducting a risk assessment. The procedures and format for the Tier 2 Risk Assessment are provided in Section 3 of this document. 1.3 Optional Tier 2 Risk-Based Evaluation If Tier 1 criteria are exceeded or are not applicable (Figure 2-1, Step 1.7), the DERR will require the Owner/Operator to complete a Subsurface Investigation to determine soil and groundwater impacts and associated exposure pathways. Following submittal of the Subsurface Investigation Report (Figure 2-1, Step 1.9), the Owner/Operator may choose to either: (1) prepare a Corrective Action Plan (CAP) and proceed with corrective action measures subject to DERR approval of the CAP; or (2) submit a Risk Assessment Proposal (RAP) and propose to conduct a Tier 2 Risk Assessment to further define corrective action requirements. For sites proceeding directly with the CAP (Figure 2-1, Steps 2.15 through 2.22), the Owner/Operator must address requirements for CAP implementation, environmental monitoring, verification and confirmation sampling, and other requirements for achieving no further action. If a RAP is approved by the DERR, the Owner/Operator must complete the additional site evaluation steps identified on Figure 2-1 or Figure 4-1 and the procedures described in Section 4 of this document. As shown on Figure 4-1, the Tier 2 Risk Assessment involves four optional assessment levels, designated Options 1 through 4, for developing Site-Specific Cleanup Levels (SSCLs) for the source area. Each successively higher option requires more detailed site-specific data, and the use of increasingly sophisticated modeling methods to refine the SSCL calculations. The Owner/Operator chooses how far to proceed through Tier 2 Options 1 through 4 based on technical and economic considerations, and concludes the Tier 2 Risk Assessment after deriving appropriate and protective SSCL values. These SSCL values are then compared to constituent concentrations measured in site soils and groundwater to define the scope of any necessary corrective actions. Should SSCL values be exceeded for any complete exposure pathways, the Owner/Operator must submit a CAP identifying appropriate cleanup methods for the affected media. 1.4 Risk Management Requirements If the Owner/Operator elects to conduct a Tier 2 Risk Assessment, a CAP may need to be developed and implemented to achieve applicable risk management goals. If the Owner/Operator chooses to proceed directly with the CAP submittal (see Step 2.10), the CAP must target specific areas of soil and groundwater contamination found to exceed Tier 1 criteria (if applicable), or soil and groundwater ISLs (if Tier 1 screening levels are not applicable). If a Tier 2 Risk Assessment is completed, the CAP should address affected media exceeding the calculated SSCLs. The Tier 2 Risk Assessment, as described in this document, does not represent a baseline assessment of actual risks posed to public health or the environment. Rather, given the conservative nature of the Tier 2 Risk Assessment, exceedance of Tier 2 SSCLs serves only to trigger evaluation of necessary corrective action measures. If affected soils or groundwater do not exceed the applicable risk-based SSCLs, corrective action may not be necessary. While the SSCLs are considered protective of current exposure pathways, Institutional Controls may be necessary to minimize potential exposure if significant land use changes occur.

1-7
For each exposure pathway posing a potential concern (as identified in the Site Conceptual Exposure Model), the proposed CAP (Figure 2-1, Step 2.22) must achieve minimum performance standards. These standards are protective criteria that will reduce risk posed to current and potential receptors. For underground utilities, such performance standards entail practical measures to prevent property damage, explosion or off-site contaminant migration. For human exposure pathways, the remedy must serve to prevent human exposure to harmful levels of COCs. In accordance with Utah Admin. Code R317-1-1.32 and Utah Code Ann. 19-5-101 et. seq., the State of Utah must protect all groundwaters of the state. Therefore, for the purpose of risk management, the Executive Secretary has determined that all groundwater, including currently non-potable sources, be considered a potential receptor or point of exposure that must be adequately protected as a potential resource of future drinking water. Appropriate measures to achieve the applicable cleanup standards will depend on the immediacy of the potential exposure. For example, engineering controls involving active removal or treatment measures may be required for current on-going exposure scenarios, whereas passive, natural attenuation remedies may suffice for potential future exposure. Further discussion of corrective action evaluation and selection procedures for the CAP is provided in Section 2 of this guidance document (Figure 2-1, Step 2.22). 1.5 Confirmation Sampling and Compliance Monitoring Requirements Upon completion of the Tier 2 Risk Assessment or CAP, the Owner/Operator must submit information verifying that applicable corrective action standards have been achieved, as follows:
• For corrective action involving soil or groundwater removal and/or treatment, verification sampling and testing is required to confirm that constituent concentrations remaining in place do not exceed applicable cleanup standards;
• For corrective measures involving use of environmental controls, information must demonstrate that the completed controls are adequate to prevent human exposure to harmful levels of COCs;
• For soils, confirmation sampling may involve sampling and testing episodes as needed to confirm corrective action completion and to confirm remaining levels of contamination; and
• For all groundwater corrective actions, confirmation sampling and compliance monitoring may involve multiple sampling episodes to verify stable contaminant plume conditions and satisfactory cleanup prior to receiving a “no further action” letter. As discussed in Steps 2.21 and 4.26 in this document, to demonstrate completion of groundwater remediation efforts, the DERR may require multiple consecutive quarterly monitoring episodes confirming that constituent concentrations are less than or equal to applicable standards at specified monitoring points. The length of this monitoring period shall be based on site-specific conditions.

1-8
1.6 Institutional Controls In accordance with the Utah Environmental Institutional Control Act, Utah Code Ann,. Sections 19-10-101, et. seq., institutional controls may be used to mitigate the risk posed to the public health, safety, or welfare, or the environment. An Owner/Operator may propose the use of voluntary institutional controls when the source of contamination has been eliminated by removal or control and applicable cleanup standards cannot be reasonably achieved. The institutional controls proposed should limit or reduce the likelihood of receptors being exposed to the contamination to meet the intent of the cleanup standards policy (Utah Admin. Code R311-211). Subsequent to source elimination, cleanup standards for remaining contamination which may include numerical, technology-based or risk-based standards or any combination of those standards, shall be determined on a case-by-case basis, taking into consideration the following criteria:
• The impact or potential impact of the contamination on the public health; • The impact or potential impact of the contamination on the environment; • Economic considerations and cost effectiveness of clean-up options; and, • The technology available for use in cleanup.
In the case of contamination above the MCL or other applicable water, soil or air quality standards, if, after evaluation of all alternatives, it is determined that applicable minimum standards cannot reasonably be achieved, cleanup levels above these minimum standards may be established on a case-by-case basis utilizing the following factors as evaluation criteria:
• Quantity of materials released; • Mobility, persistence, and toxicity of materials released; • Exposure pathways; • Extent of contamination and its relationship to present and potential surface and ground
water locations and uses; • Type and levels of background contamination; and, • Other relevant standards and factors as determined appropriate by the Board.
Typically, institutional controls must be a legally recorded environmental notice, and involves
restrictions on the use or access to real property, groundwater, or surface water. Examples of institutional controls may include, but not limited to:
• Imposing restrictions on use of land, groundwater and surface water, and retaining access
to the property for monitoring and cleanup purposes: o deed restriction; o restrictive covenant; o easement; and, o reservation.
• Installing and maintaining engineering controls to reduce exposure to the contamination: o vapor barriers; o vapor extraction; o fencing; and, o paving.

1-9
1.7 No Further Action Letter If the DERR’s review of information provided by the Owner/Operator confirms that performance standards and relevant cleanup levels have been satisfied, the Executive Secretary will issue a "no further action” letter to the site Owner/Operator. This "no further action” letter specifies that, based on the current site conditions and land use reported by the Owner/Operator, no further environmental site investigations or corrective actions will be required. However, if future evidence indicates the occurrence or spread of contamination at or emanating from the site which may cause a threat to human health and the environment, further corrective action may be required.

2-1
2.0 Utah’s LUST Corrective Action Process The following procedures describe Utah’s general corrective action process for LUST sites and correspond to the numbered steps shown in Figure 2-1. Step 2.1: Release Reported to the DERR
The Owner/Operator is required to report to the DERR (phone 801-536-4100) petroleum releases from their facility within 24 hours of discovery, in accordance with Utah Admin. Code R311-202 (UST Technical Standards). The DERR completes a Release Report form to record important information concerning the release and its impacts. The DERR project manager receiving the Release Report obtains as much information about the release as possible from the reporting party to assist the Owner/Operator in expediting abatement and cleanup of the contamination and proceeding with the Tier 1 screening process. The Release Report information includes the following:
• Owner information; • Site location; • Current land use at the site and surrounding neighborhood; • The cause, source and detection methods of the release; • Type and amount of contaminant released; • Details concerning soil and groundwater contamination (concentrations and locations); • Type and location of receptors; • Measures taken to abate the release; and • The Owner’s/Operator’s PST Fund eligibility status.
GO TO STEP 2.2 to determine the regulatory status of the reported release.

2-2
Step 2.1O/O (a) Reports
Release to DERR.
Step 2.2Is this a LUST or
other site regulated by DERR?
Site is referred to proper agency.
Figure 2-1: Utah's LUST Corrective Action Process
Step 2.3O/O Submits ClosureNotice, sampling &site data to DERR.
Step 2.4Is the Submitted
InformationComplete?
Step 2.5Are ISLs or other
standardsexceeded?
Step 2.6DERR evaluates
Tier 1 Worksheet.
No
No
Yes
Yes Yes
Step 2.10 Exec. Sec. issues O/Oletter w/ 2 choices:1) Submit CAP to cleanup to established levels,;or2) Submit RAP to conduct Tier 2 Risk Assessment.
Step 2.9Subsurface
InvestigationReport Complete?
Step 2.8Exec. Sec. issues O/O
Subsurface InvestigationGuide or Other
Required Information
Step 2.7Are Tier 1 Criteria
exceeded?
Step 2.11O/O submitsCAP or RAP.
Step 2.15Is O/O's CAP
acceptable based on all site data?
Step 2.16Exec. Sec. issues
O/O CAP approvalletter for Cleanup.
Step 2.17O/O implements
CAP to achieve cleanup levels and
Submits Progress &Monitoring Reports.
Step 2.18O/O Requests NoFurther Action.
Step 2.12Is O/O's Tier 2 RiskAssessment Proposal
Acceptable?
Step 2.13Exec. Sec. issues O/ORAP approval letter to
conduct aRisk Assessment.
Step 2.14O/O conducts Risk
Assessment.Go to Figure 4-1.
Step 2.22
No Further ActionExec. Sec. issues O/O letter
stating thatno further action is required.
Step 2.21O/O completedwork, controls,
monitoring?
Step 2.19DERR Evaluation:
Are theCleanup Criteria
met?
Step 2.20Exec. Sec. issues O/Oletter identifying work
needed (cleanup, environmental controls,
monitoring).
(a) Acronyms and abbreviations
CAP Corrective Action PlanDERR Utah Division of Environmental Response and RemediationExec. Sec. Executive SecretaryLUST Leaking Underground Storage TankMCLs Meximum Contaminant LevelsO/O Owner or operator of a LUSTRAP Risk Assessment Proposal(b) DERR issues O/O correspondence identifying information needed.
Yes Yes No
Yes
Yes
No
No
Yes
No
Yes
No(b)
(b)
(b)
(b)
RAP
CAP
(b)
No

2-3
Step 2.2: Is the Release from a LUST or Other Site Regulated by the DERR?
The DERR determines if a reported petroleum release is caused by a LUST that is subject to regulation by the Utah Underground Storage Tank Act, Utah Code Ann. § 19-6-402(20) and § 19-6-402(29). The LUST program currently provides oversight of aboveground storage tank and heating oil UST releases in accordance with “Memorandum of Understanding with the Utah Division of Water Quality (Utah Department of Environmental Quality, DERR, 1999).
Yes: GO TO STEP 2.3 if the release is regulated under the UST program. No: If the release is not regulated under the UST program, the DERR refers the site to the proper
regulatory agency. These may include the Utah Division of Water Quality (phone 801-538-6146), Utah Division of Solid and Hazardous Waste (phone 801-538-6170), local health department or other appropriate agency.
Step 2.3: Owner/Operator Submits Closure Notice, Sampling Data and Site Data
When the Owner/Operator has closed an UST system (removal or in-place closure), they are required to submit a Closure Notice within 90 days of the UST closure. The Closure Notice contains information regarding on-site contaminant concentrations, location and depth of closure samples, analytical results of closure samples, distance to receptors and land use. This information enables the DERR to determine if ISLs, for soil and groundwater are exceeded. Other important site data may be obtained from the Closure Plan, Closure Inspection Report, sampling and monitoring data, historical data, site maps, and other related reports.
GO TO STEP 2.4 where the DERR determines if the submitted information is complete.
Step 2.4: Is the Submitted Information Complete?
The DERR determines if the submitted information is complete and sufficient for determining if ISLs are exceeded. Incomplete or deficient information may result in processing delays. Deficiencies in Closure Notices include failure to provide properly scaled site maps, distances to and locations of receptors, all subsurface utility lines, buildings and property lines depth to groundwater.
Yes: GO TO STEP 2.5 if the information submitted by the Owner/Operator is complete. No: GO TO STEP 2.3 if the Owner/Operator submits incomplete or insufficient data. The Executive
Secretary will contact the Owner/Operator and identify what additional information is required. Step 2.5: Are the Initial Screening Levels Exceeded?
The DERR reviews all information submitted and determines if the ISLs for soil and groundwater (Table 1-2) are exceeded.
Yes: GO TO STEP 2.6 if the DERR determines that the ISLs for soil and/or groundwater are
exceeded. No: GO TO STEP 2.22 for the no further action process if the DERR determines that the ISLs for soil
and groundwater are not exceeded.

2-4
Step 2.6: The DERR Evaluates the Tier 1 Worksheet
If the ISLs are exceeded, the DERR completes a Tier 1 Worksheet (Section 3) using the information in the Closure Notice or other reports. The Tier 1 Worksheet may be completed by the Owner/Operator or owner’s representative. The Tier 1 Worksheet provides a format to simplify, standardize and expedite the process for reporting and evaluating the nature of the release, locations of receptors and exposure pathways to determine potential impact to receptors.
The DERR completes and/or evaluates the Tier 1 Worksheet to ensure that it is accurate and provides sufficient information to evaluate the site, locate all receptors, and compare the highest measured concentration of any contaminant to Tier 1 SLs (Table 1-3). The Tier 1 SLs may only be used if the worksheet is completed and all Tier 1 criteria are met.
GO TO STEP 2.7 where the DERR determines if Tier 1 criteria are exceeded.
Step2.7: Are the Tier 1 Criteria Exceeded?
The DERR determines if Tier 1 criteria are exceeded based on the completed Tier 1 Worksheet. Tier 1 criteria consist of the Tier 1 SLs and the critical distances from the highest measured concentration of any contaminant to receptors. The Tier 1 SLs represent contaminant concentrations in soil and groundwater that are expected to be protective of human health and the environment to the applicable ISLs or other applicable standards if there are no receptors within the critical distances. The Tier 1 SLs may be applied only when the Tier 1 criteria are met and documented by a completed Tier 1 Worksheet.
Yes: GO TO STEP 2.8 if the Tier 1 criteria are exceeded. The Executive Secretary issues the
Owner/Operator a Subsurface Investigation Report guide to help the Owner/Operator characterize the site and define the extent and degree of contamination.
No: GO TO STEP 2.22 if Tier 1 criteria are not exceeded. The DERR may initiate the ”no further action” procedure and, if approved by the Executive Secretary, the Executive Secretary will issue the Owner/Operator a “no further action” letter.
Step 2.8: Executive Secretary Issues the Owner/Operator a Subsurface Investigation Report
Guide
The Executive Secretary issues the Owner/Operator a Subsurface Investigation Report guide, a copy of which is available on the DERR LUST website. The Subsurface Investigation Report guide outlines the requirements and schedules for completing a subsurface investigation. The Owner/Operator completes the subsurface investigation by defining the extent and degree of the subsurface soil and/or groundwater petroleum contamination, locating and evaluating receptors and exposure pathways, and conducting abatement of the release, as needed. The information gained from a subsurface investigation is used to determine current and potential exposure pathways and risks to receptors, and to determine cleanup levels that are expected to be protective of receptors.
The Owner/Operator submits the Subsurface Investigation Report to the DERR within 90 days of being issued the Subsurface Investigation Report guide.
GO TO STEP 2.9 for the DERR's review of the Subsurface Investigation Report.
2-5
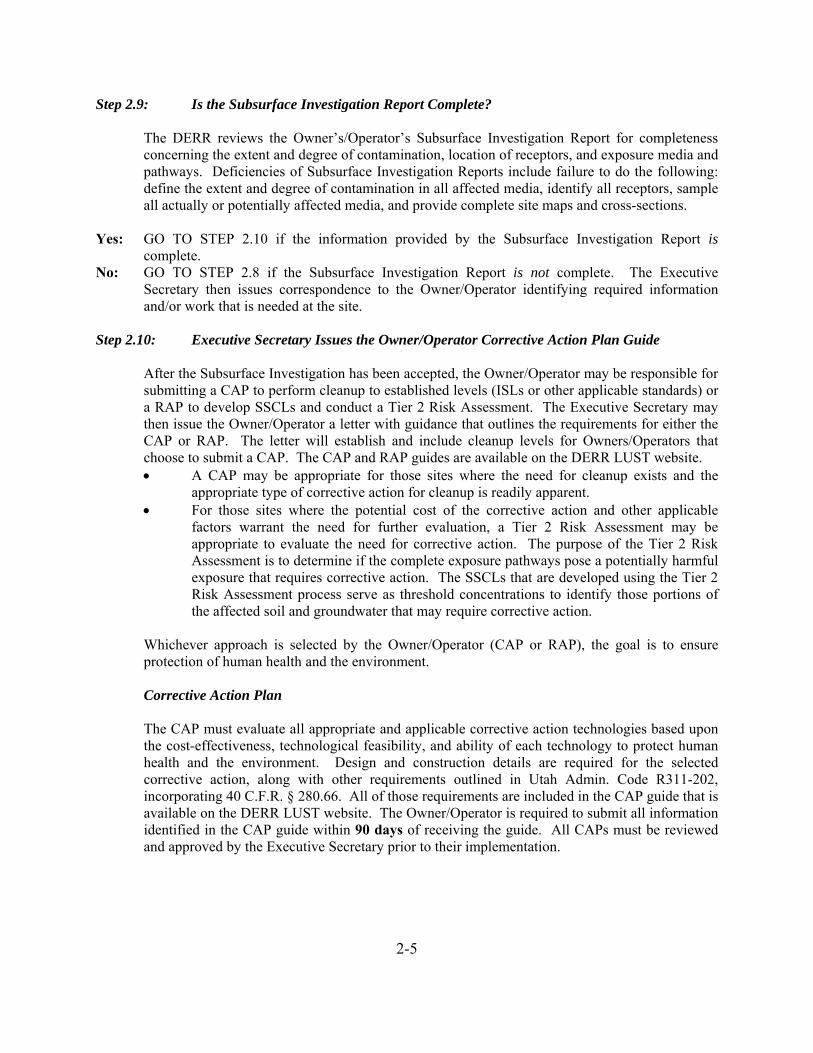
Step 2.9: Is the Subsurface Investigation Report Complete?
The DERR reviews the Owner’s/Operator’s Subsurface Investigation Report for completeness concerning the extent and degree of contamination, location of receptors, and exposure media and pathways. Deficiencies of Subsurface Investigation Reports include failure to do the following: define the extent and degree of contamination in all affected media, identify all receptors, sample all actually or potentially affected media, and provide complete site maps and cross-sections.
Yes: GO TO STEP 2.10 if the information provided by the Subsurface Investigation Report is
complete. No: GO TO STEP 2.8 if the Subsurface Investigation Report is not complete. The Executive
Secretary then issues correspondence to the Owner/Operator identifying required information and/or work that is needed at the site.
Step 2.10: Executive Secretary Issues the Owner/Operator Corrective Action Plan Guide
After the Subsurface Investigation has been accepted, the Owner/Operator may be responsible for submitting a CAP to perform cleanup to established levels (ISLs or other applicable standards) or a RAP to develop SSCLs and conduct a Tier 2 Risk Assessment. The Executive Secretary may then issue the Owner/Operator a letter with guidance that outlines the requirements for either the CAP or RAP. The letter will establish and include cleanup levels for Owners/Operators that choose to submit a CAP. The CAP and RAP guides are available on the DERR LUST website. • A CAP may be appropriate for those sites where the need for cleanup exists and the
appropriate type of corrective action for cleanup is readily apparent. • For those sites where the potential cost of the corrective action and other applicable
factors warrant the need for further evaluation, a Tier 2 Risk Assessment may be appropriate to evaluate the need for corrective action. The purpose of the Tier 2 Risk Assessment is to determine if the complete exposure pathways pose a potentially harmful exposure that requires corrective action. The SSCLs that are developed using the Tier 2 Risk Assessment process serve as threshold concentrations to identify those portions of the affected soil and groundwater that may require corrective action.
Whichever approach is selected by the Owner/Operator (CAP or RAP), the goal is to ensure protection of human health and the environment.
Corrective Action Plan
The CAP must evaluate all appropriate and applicable corrective action technologies based upon the cost-effectiveness, technological feasibility, and ability of each technology to protect human health and the environment. Design and construction details are required for the selected corrective action, along with other requirements outlined in Utah Admin. Code R311-202, incorporating 40 C.F.R. § 280.66. All of those requirements are included in the CAP guide that is available on the DERR LUST website. The Owner/Operator is required to submit all information identified in the CAP guide within 90 days of receiving the guide. All CAPs must be reviewed and approved by the Executive Secretary prior to their implementation.
2-6
Following the DERR’s review of the CAP, but prior to the Executive Secretary’s final approval, the Owner/Operator is required to notify the potentially affected public of the proposed corrective action in accordance with Utah Admin. Code R311-202, incorporating 40 C.F.R. § 280.67. Detailed guidance for public notice requirements can be found in the CAP guide.
Risk Assessment Proposal
As an alternative to performing cleanup to established standards, the Owner/Operator may propose to conduct a Tier 2 Risk Assessment to develop SSCLs at the source area for soil and groundwater. The first step of this approach is the preparation of a RAP. The RAP is due within 90 days of receiving the guide.
The purpose of the RAP is to ensure that a Tier 2 Risk Assessment appears to be the most feasible and cost-effective approach for Owners/Operators to meet the criteria outlined in Utah’s Cleanup Rules (Utah Admin. Code R311-211). If the RAP is approved, the Owner/Operator may proceed with the Tier 2 Risk Assessment as outlined in Figure 3-1, Section 3 and Section 4 of this document. Upon completion of the Tier 2 Risk Assessment, a CAP must be provided for those areas of affected soil and/or groundwater that exceed the SSCLs. If the RAP is not approved, the Owner/Operator is required to submit a CAP to meet previously established cleanup levels or other applicable standards.
For the RAP, the Owner/Operator must submit information confirming compliance with the following requirements:
• Source elimination: The source of the contamination must be eliminated by removal or
control as needed to prevent any further release into the environment. • Data requirements: Site-specific information needs to be collected and documented to
meet the Tier 2 Risk Assessment data requirements specified in Worksheet #2 of Appendix B.
• Exposure control: A site exposure evaluation must be made by completing a Site Conceptual Exposure Model (SCEM) (Appendix D) and implementing interim measures as needed to address any actual or short-term human or ecological exposure to contaminants at the release site. The SCEM is useful for identifying sources of contamination, contaminant transport mechanisms, exposure pathways, potential receptors and cleanup options for complete exposure pathways. The SCEM identifies the combination of factors that could result in complete exposure pathways and potential routes of exposure that could result in uptake of the contaminants. Upon completion of the SCEM, if an exposure pathway is considered incomplete, the Owner/Operator must provide a brief written explanation that describes why the pathway is not complete.
• Corrective action technology and cost evaluation: The Owner/Operator must document that corrective action based on Tier 2 SSCLs is likely to be significantly more cost-effective and reasonable than cleanup to established standards. This evaluation is based on consideration of initial capital costs, sampling costs, operating and maintenance costs, for technically feasible corrective action methods.
GO TO STEP 2.11 for the CAP or RAP submittal.

2-7
Step 2.11: The Owner/Operator Submits a Corrective Action Plan or a Tier 2 Risk Assessment Proposal.
• GO TO STEP 2.12 if the Owner/Operator submits a RAP. • GO TO STEP 2.15 if the Owner/Operator submits a CAP.
Step 2.12: Is the Owner’s/Operator's Risk Assessment Proposal Acceptable?
The DERR evaluates RAPs based on the RAP guidelines. Specifically, this includes the appropriateness and accuracy of the SCEM, the RAP’s discussion and comparison of all appropriate and applicable cleanup methods, the technical and economic feasibility of each cleanup method, the current and potential impact of the contamination to public health and the environment, exposure pathways, and the locations of receptors.
• If the RAP indicates that conducting a risk assessment is reasonable and capable of
ensuring that receptors are adequately protected to applicable ISLs, the TER or other applicable standards in accordance with the Utah’s Cleanup Rules, the Executive Secretary may then approve the RAP.
• If the RAP is deficient in providing the required information, the Executive Secretary will issue the Owner/Operator correspondence identifying the deficient information. Deficiencies in RAPs include failure to adequately identify, evaluate and document all contaminated media, and failure to identify and describe current and potential complete exposure pathways and receptors.
Yes: GO TO STEP 2.13 if the Executive Secretary approves the RAP. No: GO TO STEP 2.10 the Executive Secretary issues the Owner/Operator a letter that identifies
deficiencies in the RAP or specify that a CAP is required. Step 2.13: Executive Secretary Issues RAP Approval Letter to Owner/Operator to Conduct a Tier
2 Risk Assessment
The Executive Secretary issues the Owner/Operator a letter that approves the RAP to conduct a risk assessment. The approval letter may identify any contingencies or information needed, and a schedule for submitting progress and monitoring reports.
GO TO STEP 2.14 for the Tier 2 Risk Assessment Process.
Step 2.14: Owner/Operator Conducts a Tier 2 Risk Assessment
Owners/Operators may conduct a Tier 2 Risk Assessment by following the procedures shown in Figure 3-1 and described in Section 3 and Section 4 of this document.
GO TO SECTION 3 AND SECTION 4 OF THIS DOCUMENT.

2-8
Step 2.15: Is the Owner’s/Operator’s Corrective Action Plan Acceptable?
CAPs are reviewed and evaluated by the DERR and approved based on the CAP’s discussion and comparison of all applicable and appropriate cleanup methods, the technical and economic feasibility of each method, and the ability of the cleanup method selected to adequately protect current and potential receptors to ISLs, the TER or other applicable standards in accordance with the Utah’s Cleanup Rules. If the submitted CAP is deficient in detailing the required information, the Executive Secretary will issue the Owner/Operator correspondence identifying the deficient information. Deficiencies include permit issues, public notification, technical specifications and engineering designs, provisions for analyzing specific constituents of concern, and confirmation sampling and monitoring plans.
Yes: GO TO STEP 2.16 if the Owner/Operator submits an acceptable CAP for the DERR’s review.
The Executive Secretary will issue a letter to the Owner/Operator approving implementation of the CAP.
No: GO TO STEP 2.10 if the requirements for preparing a CAP have not been met. The Executive Secretary will issue the Owner/Operator correspondence identifying deficiencies in the submitted CAP.
Step 2.16: Executive Secretary Issues Letter to Owner/Operator Approving the Corrective Action
Plan
The Executive Secretary issues the Owner/Operator a letter that approves the CAP. The CAP approval letter may identify any contingencies or information needed, required cleanup levels, and a schedule for submitting progress and monitoring reports. GO TO STEP 2.17 to implement the CAP and submit progress and monitoring reports.
Step 2.17: Owner/Operator Implements the Corrective Action Plan to Achieve Established
Cleanup Levels and Submits Progress and Monitoring Reports
The Owner/Operator is responsible for implementing the CAP for the approved cleanup technology and for submitting progress and monitoring reports to the DERR in accordance with the approved CAP. Progress and monitoring reports enable the DERR to determine the progress and effectiveness of cleanup.
GO TO STEP 2.18 for the no further action request.
Step 2.18: Owner/Operator Requests No Further Action
After cleanup levels are achieved, the Owner/Operator may request that no further action be taken. Progress and monitoring reports and other documentation must be submitted to the DERR outlining how cleanup levels were achieved.
GO TO STEP 2.19 where the Executive Secretary determines if further action is required based on the Utah’s Cleanup Rules.

2-9
Step 2.19: DERR Evaluation: Are the Evaluation Criteria in the Utah’s Cleanup Rules Met?
The DERR evaluates the progress and monitoring reports based on the Evaluation Criteria required by the Utah’s Cleanup Rules. Those criteria are:
• Source elimination through removal or control; • Current or potential impact of the contamination on public health; • Current or potential impact of the contamination on the environment; • Economic considerations and cost-effectiveness of cleanup options, and; • Technology available for use in cleanup.
Yes: GO TO STEP 2.22 if cleanup has been completed, and the Executive Secretary issues the
Owner/Operator a “no further action letter.” No: GO TO STEP 2.20 if cleanup has not been completed, the Executive Secretary issues the
Owner/Operator a letter identifying further work needed such as continued cleanup, monitoring, or options for implementing voluntary institutional controls.
Step 2.20: Executive Secretary Issues the Owner/Operator a Letter Identifying Further Work
Needed
If the requirements of the Evaluation Criteria have not been met, the Executive Secretary issues the Owner/Operator a letter identifying work needed to meet those requirements. The letter identifies the options available for closing the case file and achieving no further action. Available options generally include continuing cleanup to applicable standards, on-going monitoring, conducting a risk assessment, or implementing voluntary institutional controls.
The Owner/Operator may choose to submit a RAP to conduct a Tier 2 Risk Assessment to establish new cleanup levels if the approved CAP is no longer cost-effective or technically capable of achieving the original cleanup levels. See Step 2.10 for RAP requirements. The Cleanup Criteria again must be evaluated and must demonstrate that new cleanup levels are protective of all receptors to ISLs or other applicable standards.
GO TO STEP2.21 for the evaluation of whether activities at the site are complete.
Step 2.21: Has the Owner/Operator Completed Cleanup, Environmental Controls or Monitoring?
The Owner/Operator is responsible for completing appropriate work for achieving the cleanup levels and meeting the requirements of the Evaluation Criteria (see Step 2.19). The DERR evaluates all data to determine if the work performed is successful in meeting the requirements of the Evaluation Criteria. See Step 3.26 of this document for details concerning soil and groundwater compliance monitoring and confirmation sampling requirements.
Yes: GO TO STEP 2.22 if the Owner/Operator has completed the required work and the Evaluation
Criteria are satisfied. No: GO TO STEP 2.20 if the Owner/Operator has not completed the required work and the
Evaluation Criteria are not satisfied in accordance with Step 2.19. The Executive Secretary issues the Owner/Operator correspondence stating that the case file cannot be closed out until the required work for achieving no further action is complete.

2-10
Step 2.22: No Further Action: Executive Secretary Issues Owner/Operator a No Further Action Letter
If the cleanup levels have been met and the Evaluation Criteria have been satisfied, the Executive Secretary will issue a “no further action” letter to the Owner/Operator based on the current land use at the site. However, if future contamination is found at or emanating from the site, or if the use of the property changes such that there is an increased risk from the contamination left in place, further corrective action may be required.

3-1
3.0 Tier 1 Screening Process 3.1 Overview of Tier 1 Screening Process
The Tier 1 evaluation is a screening process that uses general, Utah-specific hydrogeologic data and standard exposure assumptions to estimate maximum allowable contaminant concentrations, called Tier 1 SLs (Table 1-3) at the highest measured concentration of any contaminant. These SLs are expected to attenuate to ISLs or other applicable cleanup standards within critical distances from the highest measured concentration of any contaminant. The Tier 1 SLs may be applied only when the highest measured concentration of any contaminant is located outside critical distances from receptors. Specifically, the highest measured concentration of any contaminant must be greater than 30 feet from utility lines, buildings and property lines, and 500 feet from water wells and surface water. If Tier 1 SLs are exceeded or if receptors are located within the critical distance, the Owner/Operator has the option to clean up to applicable standards or perform a Tier 2 Risk Assessment to determine if receptors are protected.
The Tier 1 Worksheet (Table 3-1) is used to evaluate the Site Assessment Information and screening levels. If the Tier 1 criteria are met (contamination levels for all constituents are found to be below the screening levels and there are no receptors within critical distances) the DERR may issue a no further action letter. 3.2 Site Assessment Information The Tier 1 process can only be applied to a LUST site when Site Assessment Information (see Tier 1 Worksheet, Table 3-1) is obtained from the release report, Closure Plan (including site map), Closure Inspection Report, Closure Notice, or other reports. This required information for the Site Assessment must include, at a minimum, the following: product type and amount released, cause of the release, source removal information, land use and surrounding neighborhood information, soil and groundwater information, distance to receptors, and contaminant concentrations at the source area. 3.3 Tier 1 Screening Levels
The DERR will review the site assessment information for the Tier 1 Worksheet. If there are no receptors or exposure pathways within the critical distances, the contaminant concentrations at the highest measured concentration of any contaminant are compared to the Tier 1 SLs (Table 1-3) to determine if further actions are required. Tier 1 SLs represent contaminant concentrations that are expected to be protective of human health and the environment, provided there are no exposure pathways or receptors. The SLs (Table 1-3) were derived using conservative assumptions, Utah-specific conditions, known or recognized toxicological parameters, and contaminant migration and fate equations (see Appendix D). The screening level values were rounded to the first significant figure.
The scenarios used to develop the Tier 1 screening levels found in Table 1-3 are based on a residential exposure. This conservative scenario is used because information concerning the migration of the contamination from the highest measured concentration of any contaminant is commonly not known at this level of data collection and analysis. Other exposure scenarios may be considered during the Tier 2 evaluation.
3-2
The development of Total Petroleum Hydrocarbon (TPH) risk-based screening levels for Tier 1 presents a unique challenge. Risk-based screening levels for TPH were not derived using the same equations for other chemicals because petroleum products are a mixture of many chemical compounds. There is very little specific toxicological information for petroleum products (diesel fuel, gasoline, oils and grease); however, there are toxicological parameters for some specific chemicals within these petroleum mixtures. Rather than the individual fractions in the Tier 1 process, the DERR has opted to focus on TPH for gasoline, diesel and oil and grease or total recoverable petroleum hydrocarbons (TRPH). Representative screening values have been selected because the DERR recognizes that the TPH constituents have toxic characteristics when released and pose a hazard to human health and the environment. The TPH screening levels were derived using general principles of the composition, fate, and transport of TPH, and aesthetic impacts to the environment. 3.4 Tier 1 Worksheet
The Tier 1 Worksheet is a tool used to evaluate the site assessment information, and determine if Tier 1 screening criteria have been met. Upon completion of the Tier 1 process, the DERR project manager uses the Worksheet to recommend if any additional actions are needed.
The Tier 1 Worksheet is used to evaluate site assessment information and can be completed by the DERR project manager, the owner/operator, or the owner’s representative. If the owner/operator or representative completes the Worksheet, the DERR will review the Worksheet to verify the information and provide an independent recommendation. If the DERR's recommendation is different than the owner/operator, the DERR will notify the Owner/Operator and outline the circumstances by which the recommendation was made and why they differ.

3-3
Table 3-1: Utah’s Tier 1 Worksheet
FACILITY INFORMATION Facility Name Location/Address (no Box Numbers) Facility Owner Name Address (City/State/Zip Code) Facility Owner Phone # Area Code Phone Number
(For DERR Use Only) Facility ID. # Release ID Notification Date Release Reported By DERR Project Manager: Person Completing Worksheet: ______________________________
SITE ASSESSMENT INFORMATION (For DERR Use Only)
Impacts:_______________ ______________________ Required Response Actions: ____________________________________________
b. Contaminant Source Information Product Amount Released Released (gal) Cause of Release (if known) Gasoline ______ ___tank ___piping ___dispenser ___overfill/spill Diesel ______ ___tank ___piping ___dispenser ___overfill/spill Waste Oil ______ ___tank ___piping ___dispenser ___overfill/spill Unknown ______ ___tank ___piping ___dispenser ___overfill/spill Other ______ ___tank ___piping ___dispenser ___overfill/spill Sources Removed: __tank __piping __dispenser __free product __contaminated soil
c. Land Use Information Current Land Use at the Site: residential commercial industrial Surrounding Neighborhood: residential commercial industrial (Note: Surrounding land use is Residential if one or more residences share a common property line with the Facility) d. Soil Information Depth to Contaminated Soil (feet below land surface): ________ Soil Type(s): Depth (below land surface):_________ Method of Soil Type Identification (check applicable): ____Unified Soil Classification _____Geologist’s description e. Groundwater Information Was groundwater present? Yes No Thickness of Free Product: ________________________ Depth to groundwater (feet below land surface): Is groundwater impacted at any concentration: Yes No Groundwater flow direction (circle applicable): E, W, N, S, SE, SW, NE, NW ____Inferred? ___Measured? Slope direction of surface topography (circle applicable): E, W, N, S, SE, SW, NE, NW
f. Distance from Highest Measured Concentration of Any Contaminant to Nearest Potential Receptor (If any receptors are within 30 feet you must go to Tier 2) Receptors (enter distance to each in feet) Subsurface Utilities: Water line Sewer line Natural Gas _____Storm Drain Telephone
____Electrical Other (specify) ____Property Line ____Buildings (specify type: Residence Commercial other, specify) For DERR Use Only Distance to Other Receptors (If any receptors are within 500 feet you must go to Tier 2) Receptors Within 500 feet (enter distance to each in feet and attach water well data sheets and maps; show facility location on each) _______Municipal Well _______Domestic Well _______Irrigation Well _______Surface water (specify type: lake, stream, creek, river, wetland):_____________________________________

3-4
FACILITY SITE MAP The owner/operator must submit a facility site map, as close as possible to scale, indicating the north direction, and shows locations of the following properly labeled features:
- Current and/or former UST systems (indicate product type for each) - Utility lines (underground) - Location of the release and known contamination - Buildings or other structures - Property lines - Excavations - Monitoring wells - Soil stockpiles - Sample locations
SUPPLEMENTAL INFORMATION
Owner/Operator Must Submit Copies of Laboratory Analytical Data
RBCA TIER 1 SCREENING LEVEL EVALUATION
(For DERR Use Only) Groundwater (mg/L) Soil (mg/kg)
Constituent Screening Level Highest
Concentration at Source
Screening Level Highest
Concentration at Source
Benzene 0.3 0.9
Toluene 7 62
Ethylbenzene 4 23
Xylenes 10 142
Naphthalene 0.7 51
Methyl t-butyl ether (MTBE) 0.2 0.3
TPH-gasoline 10 1500
TPH-diesel 10 5000
Oil and Grease/TRPH 10 10000
RECOMMENDED TIER 1 ACTIONS (For DERR Use Only) All contaminant concentration levels are below Tier 1 screening levels, and no receptors are within the critical
distances. Recommendation - No further action.
Contaminant concentration(s) exceed Tier 1 screening levels, or receptors are within applicable critical distances. Recommendation - Perform a Tier 2 risk assessment or cleanup to applicable levels.
All contaminant concentrations are below Tier 1 screening levels but receptors are within the critical distances. Recommendation - Clean up to applicable levels.
Evaluation Completed by: Date: Signature
Date: Signature of Person Completing Tier 1 Worksheet if different from DERR Project Manager

3-5
3.5 Completing the Tier 1 Worksheet
The Tier 1 Worksheet provides a short but comprehensive format to simplify and expedite the process for reporting and evaluating the nature of the release, exposure pathways, and potential impact to receptors to determine if the release poses a threat to human health or the environment. The Worksheet must be completed in its entirety by marking the applicable spaces provided. If at any time the DERR’s evaluation of the Worksheet reveals that insufficient information is supplied or that exposure pathways are complete and receptors are at risk, additional site-specific information must be obtained, and appropriate response actions must be taken. Also, incomplete or deficient information may result in processing delays.
The Worksheet may be completed by the owner/operator, owner’s representative, or the DERR by entering all pertinent information that is supplied by the owner/operator, or owner’s representative. The owner/operator completes only the unshaded portions of the worksheet; the DERR project manager will complete the shaded portions. The information necessary for the Worksheet can be obtained from the Release Report, Closure Notice, Closure Plan, Closure Inspection Report, other reports, sampling data, historical information, and detailed site maps. The following details specific information required for completing the Tier 1 Worksheet: Facility Information
The owner/operator provides this portion of the Worksheet information by providing the facility name, location, and the owner’s name, address, and phone number. The DERR completes the shaded portion of the form by providing the facility identification number, release identification number, notification date and reporting party, the DERR project manager, and name of person completing the Worksheet.
Site Assessment Information
• Contaminant Source Information: The product type released at the site, such as
gasoline, diesel, waste oil, or unknown substance, must be identified in the spaces provided. If known, provide the amount of product released in the spaces provided. Mark the applicable spaces provided for the portion of the UST system that caused the release (if known), such as the tank, the piping, the dispenser, and/or overfills/spills. Unknown product types usually require sampling for additional constituents and the need for historical information (Utah Admin. Code R311-205-2(d)). The source of contamination must be removed in accordance with Utah’s Cleanup Policy (Utah Admin. Code R311-211). Mark the applicable spaces provided to indicate that contaminant sources that caused the release have been removed. The source of the petroleum contamination may include, but is not limited to the tank basin, product piping runs, dispensers, free product, or contaminated soil that leaches excessive contaminant concentrations to groundwater or other receptors.
• Land Use Information: Land use of the site and the surrounding neighborhood must be identified in order to determine the potential for exposure to contamination and to ensure adequate protection of human health and the environment. Residential, commercial, and industrial land use information is considered in Tier 1 Worksheet. Land use information can be supplied in the Closure Plan, Closure Notice, other reports, and site maps.
3-6
The current land use at the site is considered residential if a residence is located on the site property. The surrounding neighborhood is considered residential if a residence is located on any property adjacent to the site. Commercial land use is defined as land used for the sale of pre-made products. Industrial land use is that devoted to manufacture of commercial goods.
• Soil Information: The Worksheet provides spaces for identifying the soil type and depth
at which contaminated soil occurs. Soil samples must be collected in accordance with Utah Admin. Code R-311-205 (Site Assessment Protocol), which includes proper sample collection by a Utah Certified Groundwater and Soil Sampler, and sample analysis by a Utah Certified Laboratory of all media affected by the release (groundwater, subsurface soil, etc.)
The contaminated soil type is identified using the Unified Soil Classification method. Other observations concerning the soil type and characteristics may be explained here or in the “Supplemental Information” category.
• Groundwater Information: Groundwater is a valuable and protected natural resource
in the State of Utah and a large percentage of LUST sites in Utah impact groundwater. Because groundwater is the primary contaminant transport mechanism there is subsequently a greater potential for contamination to be transported off-site to other receptors.
When completing the Worksheet mark the appropriate space if groundwater is or was present in the excavation and indicate the thickness of free product, if present. Also, when completing the Worksheet indicate whether or not the groundwater is impacted to any level of contamination, and identify the depth to groundwater and the approximate groundwater flow direction. Knowledge of the approximate groundwater flow direction will help determine the probability of a petroleum release adversely impacting nearby receptors. Groundwater flow direction can be estimated from the slope direction of the local topography. This information can be obtained from a topographic map.
Groundwater information can be determined from site-specific or nearby site data, such as monitoring wells, water supply wells, open excavations and test pits, and the slope direction of local topography. Other informational resources include the DERR Geographic Information System, local health departments, the DEQ district engineer, Utah Division of Water Rights and local and regional groundwater studies.
• Distance from Highest Measured Concentration of any Contaminant to Nearest
Potential Receptors: When completing the Worksheet enter the distance, in feet, to all receptors in the spaces provided. The distance to receptors is used in the Worksheet to determine if there are any receptors that may be threatened by the contamination.
Receptors that must be identified within a 30-foot radius of the highest measured concentration of any contaminant and plotted on the Facility Site Map (below) include subsurface utility corridors (water lines, sewer lines, etc), buildings, and the property lines. The owner/operator can obtain much of this information from a visual inspection of the site.
The shaded “Other Receptor Information” section of the worksheet will be completed by the DERR project manager. The DERR project manager will identify receptors within a

3-7
500-foot radius of the highest measured concentration of any contaminant, which include water wells (municipal or residential) and surface water (rivers, lakes, streams, wetlands, irrigation or other ditches). The DERR project manager will obtain the water well and surface water maps and data sheets from the Utah Department of Natural Resources, Division of Water Rights (DNR). The DERR project manager will also use topographic maps to determine distance to nearest surface water. If the owners/operators choose to obtain this information from the DNR and topographic maps then all data sheets and maps must be attached to the Worksheet. All submitted maps and data sheets must show the location of the facility.
Facility Site Map A site map of the facility must be included with the Worksheet. The map must show a north arrow and be appropriately scaled showing the locations and distances from the contamination to the following features: (1) current and/or former UST systems (tanks, piping, dispensers, other); (2) buildings or other structures (identify residential or commercial structures); (3) underground utility lines; (4) all property boundaries; (5) excavations; (6) soil stockpiles; (7) sample locations; (8) monitoring wells; and, (9) any other pertinent features. A facility site map from the closure plan may be attached to the Worksheet if it provides the features and distances identified above.
Supplemental Information
The DERR project manager evaluates additional information provided by the owner/operator and enters that information on page 2 of the Worksheet. The supplemental information may influence the recommended Tier 1 actions and may contain elements of a Tier 2 evaluation.
Supplemental information may aid in expediting the Tier 1 evaluation process and may
include the following: (1) information concerning the nature, extent and degree of contamination; (2) additional soil and groundwater information; (3) exposure pathway and receptor information; (4) amount of contaminated media remaining; (5) rate of release; and, (6) other site-specific data that are used for reducing risk to potential receptors.
Tier 1 Screening Level Evaluation
The owner/operator provides copies of the laboratory analytical data and the DERR project manager compares those data to the screening levels by entering the highest observed concentrations for each constituent (regardless of sample location) in the spaces provided for groundwater and for soil. The owner/operator may fill in the spaces for highest observed levels but analytical data must also be attached to the Worksheet. The DERR project manager compares the highest observed concentrations to the corresponding screening levels to determine if any levels are exceeded.
Recommended Tier 1 Actions The DERR project manager completes this shaded portion of the Worksheet by checking the appropriate recommendation to document whether the screening levels and Tier 1 criteria have been satisfied. After the DERR project manager has completed and evaluated the Worksheet, a recommendation is made to the Executive Secretary. The Executive Secretary will determine if further action is necessary.

4-1
4.0 Risk Assessment Process 4.1 Overview of Tier 2 Risk Assessment Process
Utah's Cleanup Rules (Utah Admin. Code R311-211) provides Owners/Operators with the opportunity to derive site-specific, risk-based petroleum cleanup levels for LUST sites when:
● The source of contamination has been eliminated by removal or control, and; ● Initial Screening Levels (ISLs) or other applicable standards cannot be reasonably
achieved.
The risk-based cleanup levels must ensure that all receptors are protected to applicable ISLs, the TER or other applicable standards. Owners/Operators may derive risk-based SSCLs by evaluating all exposure pathways, identifying all complete exposure pathways, and solving the standard exposure and transport equations set forth in EPA (1989), ASTM (1995) and Appendix D.
Owners/Operators are advised that risk assessments do not necessarily secure the issuance of a no further action letter, and may actually indicate that cleanup is necessary. Owners/Operators are cautioned that conducting a Tier 2 Risk Assessment inherently includes a willingness by those affected by the contamination to accept the possibility that land use at a LUST site may be limited because of potentially complete exposure pathways.
Utah has developed the Tier 2 Risk Assessment process shown in Figure 4-1 to provide Owners/Operators with a systematic and standardized approach to conducting a site-specific risk assessment. The Tier 2 Risk Assessment process is modified from the ASTM (1995) document, and is a useful tool to help Owners/Operators derive risk-based SSCLs and meet the requirements of the Utah’s Cleanup Rules.
Utah’s Tier 2 Risk Assessment process includes four options that, with each increasing option, increase in complexity and site-specific data requirements. The increased detail associated with each option increases the degree of certainty for protecting human health and the environment. Most Tier 2 Risk Assessment options require rigorous subsurface investigations to achieve increasing levels of confidence in deriving the risk-based SSCLs.
The Tier 2 Risk Assessment is a more complex process than a Tier 1 evaluation because Tier 2 is based on site-specific data and modeling rather than the general, conservative assumptions of Tier 1. Site-specific parameter values for Tier 2 are determined from the results of subsurface investigations. Parameters for which site-specific values are necessary are shown in Appendix B Worksheet #2 of this document. Site-specific parameter values may be based on field measurements or the permissible values listed in Worksheet #2 of Appendix B. Non-site-specific parameters that may not be varied from the default values are also shown in Worksheet #2, and include exposure parameters such as ingestion and inhalation rates, and enclosed space parameters. Chemical property and toxicity values are shown in Appendix D, Tables D-2 through D-5. The exposure and transport equations necessary for calculating SSCLs are shown in Appendix D, Table D-1.
To begin the Tier 2 Risk Assessment, the Owner/Operator uses site-specific parameter values (Appendix B, Worksheet #2) as input for the equations to calculate SSCLs (Appendix D, Table D-1). Tier 2 SSCLs are calculated by the Owner/Operator using the equations shown in Appendix D or commercially available spreadsheets.

4-2
The DERR accepts a 95% Upper Confidence Limit (UCL) or the maximum contaminant concentrations, whichever is lowest, for comparison to SSCLs. The 95% UCL depends on sample variability and number of samples collected.

4-3
Figure 4-1: Utah's RBCA Tier 2 Risk Assessment Process
In from Figure 2-1, Step 2.14
Step 4.1Are Groundwater
Tier 1 SLs Exceeded?
Step 4.2Option 1: Are Site-SpecificData Sufficent to Calculate
Option 1 SSCLs?
Step 4.7Take Interim
Action.
Step 4.3O/O Conducts Additional
Investitations.
Step 4.4O/O Calculates
Option 1 SSCLs: AreSSCLs Exceeded?
Step 4.5Is Cleanup to Option 1SSCLs Reasonable?
Step 4.6Is Response Action
Necessary?
Step 4.10O/O Calculates
Option 2 SSCLs: AreSSCLs exceeded?
Step 4.8Option 2: Are Site-SpecificData Sufficient to Calculate
Option 2 SSCLs?
Step 4.9O/O Conducts Additional Investitations.
Step 4.11Is Cleanup to Option 2SSCLs Reasonable?
Step 4.12Is Response Action
Necessary?
Step 4.13Option 3: Are Site-Specific
Data Sufficient to DeriveOption 3 SSCLs?
Step 4.15O/O Derives
Option 3 SSCLs & ALs: AreSSCLs or ALs Exceeded?
Step 4.16Is Cleanup to Option 3SSCLs Reasonable?
Step 4.17Is Response Action
Necessary?
Step 4.14O/O Conducts Additional Investitations.
Step 4.18Option 4: Are Site-Specific
Data Sufficient to DeriveOption 4 SSCLs?
Step 4.20O/O Derives
Option 4 SSCLs & ALs: AreSSCLs or ALs Exceeded?
Step 4.21Is Response Action
Necessary?
Step 4.19O/O Conducts Additional Investitations.
Step 4.23O/O Requests
No FurtherAciton.
Step 4.22O/O Submits Tier 2
Risk AssessmentReport and CAP.
Step 4.25Exec. Sec. issues O/Oletter identifying work
needed (cleanup, controls,monitoring).
Step 4.24DERR Evaluation: Are the
Cleanup Criteria Met?
Step 4.26O/O Completes Work,Controls, Monitoring?
Step 4.27
No Further ActionExec. Sec. Issues O/o letter staingthat no further action is required.
No
Yes
Yes
Yes
Yes
Yes
Yes
Yes
Yes
No
No
No
No
No
No
No
No
Yes
Yes
No
Yes
Yes Yes No
YesNo
No
Yes
No Yes
YesYes
No
No
No
No
4-4
If the on-site contaminant concentrations exceed the calculated cleanup levels, the Owner/Operator may either perform cleanup to the SSCLs or move to higher options in the Tier 2 Risk Assessment process to increase the level of accuracy of the risk assessment. The higher options require increasingly rigorous site data, but provide greater accuracy in deriving protective SSCLs and evaluating risk to receptors. The greater accuracy is largely achieved by using transient contaminant fate and transport modeling under Options 3 and 4 to further evaluate the calculated SSCLs and derive final SSCLs. The DERR uses the RBCA spreadsheet (GSI, 1995) to verify the calculations for deriving SSCLs. The DERR uses the following transient contaminant fate and transport models to verify the modeling results for Options 3 and 4:
● SOLUTE (Beljin, 1991). ● BIOSCREEN (Newell, et al., 1996). ● VLEACH (Ravi and Johnson, 1995). and; ● BIOPLUME (Rifai, et al., 1987).
The Owner/Operator may begin the Tier 2 Risk Assessment after the Executive Secretary approves
the Owner’s/Operator’s Risk Assessment Proposal (RAP) which was discussed in Section 2, Steps 2.12 through 2.14. The Owner/Operator then follows the steps outlined in Figure 4-1 and described in detail in Sections 4 and 5 of this document. 4.2 Required Procedures for All Tier 2 Options
The goal of the Tier 2 Risk Assessment is to identify soil and groundwater source areas that could pose an unacceptable risk to public health or the environment under current or future land use conditions. The Tier 2 Risk Assessment is based on mandatory exposure assumptions involving exposure pathways, receptors, points of exposure, exposure factors, and others. Tier 2 Option 1 through Option 4 vary with regard to the contaminant fate-and-transport modeling methods to be employed for derivation of soil and groundwater SSCLs. However, all Tier 2 evaluations must conform to the general procedures and exposure assumptions summarized below.
Preliminary Exposure Pathway Evaluation and Required Response Actions
The goal of the corrective action process is to protect public health and the environment from impacts associated with exposure to harmful levels of constituents of concern (COCs). The Tier 2 Risk Assessment addresses several possible exposure pathways for contaminant migration from the source to a receptor via air, soil or groundwater under typical land use conditions. Exposure pathways are summarized in Table 4-1 of Section 4, and are illustrated on Figure B-1 of Appendix B. For the Tier 2 Risk Assessment, the Owner/Operator evaluates the potential for each of the exposure pathways to be complete by evaluating the SCEM (Worksheet #3 of Appendix B). For each complete exposure pathway identified in Worksheet #3, SSCLs must be derived and compared to measured COC concentrations to determine the need for corrective action.
Pathways may be designated as incomplete only if site conditions meet the criteria
specified in Worksheet #3, in Appendix B. For example, the surface soil exposure pathway (dermal contact, vapor/particulate inhalation) is considered incomplete if subsurface soil is so deep that it is not likely to be excavated and brought to the surface.

4-5
For exposure pathways that indicate either potential or current exposure, the Owner/Operator may need to implement interim measures to abate or control the exposure to human health and the environment. The Owner/Operator must evaluate the need for interim abatement measures when the contaminants are at levels that may be hazardous to human health and the environment. Abatement measures will commonly be needed to control near-term impacts while the site evaluation effort proceeds. Abatement measures should be practical and reliable control actions, which can be promptly implemented by the Owner/Operator. Examples of abatement measures may include placement of interim soil covers, installation of a vapor extraction system to control vapors, or installation of limited groundwater recovery wells to achieve hydraulic control of off-site plume migration.

4-6
Table 4-1: Applicable Point of Compliance (POC) and Point of Exposure (POE) Locations for Tier 2 SSCL Calculations Point of Exposure Location Exposure Pathway Point of Compliance
(source zone) On-Site Receptor Type and POE Off-SITE Receptor Type and POE
Groundwater Exposure Pathways • GW Ingestion Concentration in zone of affected GW plume
> applicable Tier 1 criteria or > SSCLs. • Option 1: Hypothetical well in plume
area. Match receptor type to land use • Options 2-4: For C/I property, no on-site
POE unless existing water supply well located on site. For residential property, hypothetical residential well located in plume area.
• Options 2-4: Hypothetical residential well located at first downgradient off-site property (across downgradient ROW if ROW present at property line).
• Soil-to-GW Impact Concentrations in affected soil zone > applicable Tier 1 criteria or > SSCLs.
• Option 1: Hypothetical well in plume area. Match receptor type to land use.
• Options 2-4: For C/I property, no on-site POE unless existing water supply well located on site. For residential property, hypothetical residential well located in plume area.
• Options 2-4: If hypothetical residential well located at first downgradient off-site property (across downgradient ROW if ROW present at property line).
• GW Dermal Contact: Construction Worker in ROW
Concentrations in zone of affected GW plume > applicable Tier 1 criteria or > SSCLs.
• All Options: Construction worker in direct contact with affected GW within 1-15 ft below ground surface.
• Options 2-4: If hypothetical off-site well has been assumed to be located across ROW and depth to GW less than 15 ft. assume Const. Worker contacts affected GW at midpoint of ROW.
Soil Exposure Pathways • Soil Direct Contact: Ingestion,
Dermal, Inhalation by Construction Worker
Concentrations in affected soil Zone > applicable Tier 1 criteria or > SSCLs.
• All Options: Construction worker in direct contact with affected soils within 0-15 ft below ground surface.
• All Options: No off-site POE unless affected soil zone extends off-site.
Air Exposure Pathways • Soil to Ambient Air Concentrations in affected soil Zone >
applicable Tier 1 criteria or > SSCLs. Affected soil zone.
• All Options: Site resident or site worker (depending on land use) at downwind edge of source zone.
• Options 2-4: Resident located at first off site structure.
• GW to Ambient Air Maximum concentration zone of affected GW plume.
• All options: Site resident or site worker (depending on land use) at downwind edge of source zone
• Options 2-4: Resident located at first off-site structure.
• Soil to Indoor Air Affected soil zone beneath or immediately adjacent* to building.
• All Options: Site resident or site worker (depending on land use), in existing structure (if any) located atop source zone.
• Options 2-4: No off-site POE access affected soil zone extends off-site beneath existing structure.
GW to Indoor Air Affected GW Plume beneath or immediately adjacent* to building.
• All Options: Site resident or site worker (depending on Land use), in existing structure (if any) located atop source zone.
• Options 2-4: Resident in existing structure (if and) located atop off-site portion of GW plume.
* “Immediately adjacent” to a building means the area within a one foot lateral perimeter of a structure. 1) For each complete exposure pathway, hypothetical receptors and POE locations specified above must be assumed for purpose of Tier 2 Option 1-4 SSCL calculations. On-site land use should be classified based on current conditions. off site land use is assumed to be residential unless existing ordinance or other legal restriction mandates commercial/Industrial use. Options 1, 2, 3, and 4 refer to Tier 2 SSCL calculation options, as described in this guide. 2) C/I = Commercial/Industrial, GW = Groundwater, POC = Point of Compliance, POE = Point of Exposure, ROW = Right of Way (roadway, drainage, structure, etc.), SSCL = Site Specific Cleanup Level

4-7
Tier 2 Exposure Assumptions and Evaluation Procedures
Under Options 1 through 4, SSCLs for complete exposure pathways must be derived on the basis of the mandatory Tier 2 exposure assumptions specified in this document. For each exposure pathway, these mandatory exposure assumptions are designed to be protective of current and future land use conditions and consist of the following: (1) the type of receptor (resident, commercial/industrial site worker, or construction worker); (2) the point of exposure ( i.e., the receptor location), and; (3) standard exposure factors defining the degree and duration of the exposure. Requirements applicable to cleanup level calculations under Tier 2 Options 1 through 4 are as follows:
• Type of Receptor: For each exposure pathway to be addressed in the Tier 2 Risk
Assessment, the applicable receptor type for both on-site and off-site exposure locations is specified in Table 4-1. In general, the receptor types are designated as follows:
On-Site Exposure Locations: Match receptor type (either residential or commercial/industrial) to the current and anticipated future (e.g., projected for five to 10 years) land use. For groundwater dermal contact and soil direct contact pathways, assume the receptor is a construction worker in all cases.
Off-Site Exposure Locations: Assume residential land use and residential receptors for all off-site adjoining properties, unless zoning or other legally enforceable land use restrictions indicate commercial/industrial development and no one is living on the property. For the groundwater dermal contact pathway (if applicable), assume the receptor is a construction worker in all cases.
• Point of Exposure: The point of exposure (POE) represents the physical location where
the pathway receptor is assumed to come into contact with an affected environmental medium (air, soil or groundwater). Table 4-1 specifies the POEs that are to be applied for complete exposure pathways under Tier 2 Options 1 through 4. Tier 2 Option 1 applies only to sites where no off-site soil or groundwater impacts are present or likely to occur. Consequently, under Option 1, SSCLs are equivalent to risk-based screening levels (RBSLs) because they are derived for on-site POEs only.
For Tier 2 Options 2 through 4, which address both on-site and off-site exposure conditions, the Owner/Operator must derive SSCLs for both on-site POEs and off-site POEs, as applicable. Under Options 2 through 4 for groundwater exposure pathways, hypothetical water supply wells must be assumed to be present at the first down-gradient off-site property (or across the down-gradient right-of-way if a right-of-way is present at the site property line). This POE location ensures that the calculated SSCLs will be protective of potential future off-site groundwater users.
• Exposure Factors: For each receptor type (resident, commercial/industrial site worker, or
construction worker), standard exposure factors such as exposure duration, exposure frequency, intake rate and body weight are employed to calculate RBSLs and SSCLs. These exposure factors are specified on Worksheet #2 in Appendix B. For residential and commercial/industrial receptors, these values correspond to Reasonable Maximum Exposure (RME) scenarios established under EPA guidelines (U.S. Environmental Protection Agency, 1989). For each complete exposure pathway, the exposure factors from Worksheet #2 should be selected according to the receptor type specified for that pathway on Table 4-1.

4-8
Cleanup Criteria and Applicable Monitoring Locations
Tier 2 SSCLs represent COC concentration limits to be achieved at the source zone, or point of compliance (POC) such that TER limits will not be exceeded at an associated point of exposure (POE). For example, for the soil vapor-to-ambient air exposure pathway, reducing contaminant concentrations in the affected soil zone (i.e., the POC) to the applicable SSCL prevents exceeding of chronic risk levels for persons breathing ambient site air (i.e., POE).
POC and POE locations, as defined for the purpose of the Tier 2 Risk Assessment, are
illustrated on Figure 4-2. Applicable POC and POE locations for each of the potential exposure pathways to be addressed in the Tier 2 Risk Assessment are summarized on Table 4-1. Further discussion of these measurement locations and the applicable Tier 2 cleanup criteria are provided below.
• On-Site Exposures: As shown in Table 4-1 for on-site POEs, exposure is assumed to
occur in the immediate proximity of the soil or groundwater source area and the POE is effectively equal to the POC.
For contaminated soils, the source area corresponds to the full lateral and vertical extent of soils containing COCs in excess of Tier 1 criteria. For contaminated groundwater plumes, the source area corresponds to the zone of highest concentration above Tier 1 criteria, as detailed on Figure 4-3. For each COC, upper-bound soil and groundwater concentration limits, termed risk-based screening levels (RBSLs), are derived such that TER limits will not be exceeded at the relevant on-site POE. The RBSL represents a conservative contaminant concentration limit that is safe for human exposure at the source area such as direct ingestion of groundwater, or inhalation of dust or vapors from on-site soils.
RBSLs equations for each of the potential on-site exposure pathways to be addressed in the Tier 2 Risk Assessment are provided as Equations D.1 through D.8 in Appendix D, Table D-1. These expressions are to be used under Tier Options 1 and 2 to derive RBSL values protective of the applicable on-site POEs as specified on Table 4-1.
As discussed in further detail below, under Tier 2 Options 3 and 4, alternate methods may be employed to estimate the cross-media transfer factors incorporated in these RBSL equations, such as volatilization factor, particulate emission factor and leaching factor. These are addressed in Equations D.9 through D.21 in Appendix D, Table D-1. However, all other terms in the RBSL expressions that are provided in Equations D.1 through D.8, such as risk limits and exposure factors, are fixed for all Tier 2 Options. For groundwater exposure pathways, including groundwater ingestion and soil-to-groundwater leaching, in which a federal or state MCL value has been promulgated for a COC, the MCL must be used in place of the RBSL number that is derived from Equation D.2
For each complete exposure pathway and COC, RBSL values must be derived for the applicable on-site POEs. These values are compared to measured soil and groundwater source concentrations to determine the need for corrective action.
The applicability of an on-site POE depends on the exposure pathway and the on-site land use, as specified on Table 4-1. For example, if the on-site land use is commercial/ industrial:

4-9
No on-site POE is assumed for the groundwater for ambient air exposure pathways (soil-to-ambient air, groundwater-to-ambient air);
● On-site exposure is assumed to occur in all other exposure pathways, and; ● An RBSL must be derived for the designated receptor type and POE.

4-10
Figure 4-2: COMPLIANCE MONITORING LOCATIONS AND APPLICABLE CONCENTRATION LIMITS

4-11
FIGURE 4-3: DEFINITION OF SOURCE TERM FOR USE IN DOMENICO SOLUTE TRANSPORT MODEL (EQUATIONS D-22 OR D-23)
SELECTION OF GROUNDWATER MODEL INPUT PARAMETERS For use of Domenico groundwater solute transport model (see Equations D-22 and D-23), select source term location, dimensions, and concentration as follows: 1) Groundwater Source Term Location
The source term corresponds to a vertical source plane, normal to the direction of groundwater flow, located at the downgradient limit of the area serving as the principal source of constituent release to groundwater (e.g., affect unsaturated zone soils, NAPL plum, spill area, etc.). If the point of maximum plume concentration is significantly displaced from the initial suspected point of release, this plume “hot spot” should be used as the source point for the groundwater ingestion pathway. However, the downgradient edge of the affected soil zone should be retained as the source location for the soil-to-groundwater leaching pathway. Distances to downgradient points of exposure (POEs) should then be measured from the applicable source location along the principal direction of groundwater flow.
2) Groundwater Source Term Width, Sw
The width of the source term should be matched to the greater of the following dimensions: i) the measured groundwater plume width, (as defined by Tier 1 criteria), perpendicular to the principal direction
of groundwater flow at the designated source term location. ii) The maximum width of the affected soil zone (as defined by Tier 1 criteria), perpendicular to the principal
groundwater flow direction. 3) Groundwater Source Term Thickness, Sd
The thickness of the source term should be determined by one of the following methods: i) measure the vertical extent of the affected groundwater plume at the designated source term location, based on
depth-specific groundwater sampling and testing; or ii) for unconfined water-bearing unit, estimate mixing zone depth at the source location based on the observed
magnitude of water table fluctuation. 4) Groundwater Source Term Thickness, Cs
To calculate baseline risk levels, the user must also provide a groundwater source concentration for each constituent of concern (COC). The vertical plane source acts as a constant source term, applying these input concentrations to all groundwater flowing through the source location. Under a Tier 2 evaluation, the source concentration of each COC may be defined as follows:
i) use the maximum concentration of each COC detected at the source location; or ii) if multiple sampling locations are available to characterize plume concentrations across the source term width
Sw use either 95% UCL or maximum source concentration (whichever is lowest) for each constituent across this plume transect based on time-consistent measurements. For this purpose, a minimum of 3 to 4 wells should be sampled across the plume transect. Non-detect values should not be used in calculation of the source concentration.

4-12
• Off-Site Exposures: For soil exposure pathways, applicable POEs are limited to the on-
site soil source area, unless the contaminated soil zone extends off-site to another property. However, for air and groundwater exposure pathways, constituents can migrate downwind or down-gradient of the initial on-site source area to impact potential off-site POE locations. Therefore, for these exposure pathways, both on-site and off-site POEs must be addressed, as specified on Table 4-1.
For off-site POEs, exposure is assumed to occur at some distance from soil or groundwater source areas (i.e., the POE does not equal the POC). In these cases, a SSCL is derived for the on-site source area such that TER limits will not be exceeded at the off-site POE. The SSCL value differs from the RBSL value because a natural attenuation factor (NAF) is applied to the RBSL to account for the natural reduction in constituent concentrations that occurs in the distance between the source and the POE. The NAF equals the concentration in the exposure medium at the source divided by the concentration in the same exposure medium at the POE. To develop appropriate NAF values, see the section entitled “General Procedures for Deriving Tier 2 NAF Values” below.
For each complete exposure pathway and COC, the general equation for each individual constituent SSCL is:
SSCL = RBSL x NAF where: RBSL = Risk-Based Screening Level for the COC at POEs for the
selected exposure pathway, and; NAF = Natural Attenuation Factor, characterizing COC concentration
reduction from the source to the POE. SSCL = Site-Specific Cleanup Level for the COC at POCs for the
selectedexposure pathway.
When the POE is located at the POC (e.g., on-site exposures), no attenuation occurs between the POC and the POE. In this case, the NAF is 1.0 and the SSCL equals the RBSL. However, when exposure occurs at some distance from the source, the NAF is greater than 1.0 due to various dilution-attenuation processes occurring during lateral transport, and the SSCL is therefore greater than the RBSL. If measured COC concentrations in the soil or groundwater source area exceed SSCL values for a complete exposure pathway, corrective measures are addressed as needed to prevent TER exceeding at the off-site POE location.
• Alternate Monitoring Points: If COC concentrations in the source area exceed
applicable SSCLs for complete exposure pathways, corrective measures must be addressed to prevent TER exceedance at the relevant POE locations. In addition, for sites where the contaminant plumes may be expanding, protection of down-gradient receptors must be demonstrated by sampling at Alternate Monitoring Points (AMPs). As shown in Figure 4-2, AMPs are locations between the POC (source) and the POE (receptor) along the potential pathway of constituent transport. Measurements at AMPs are essential for determining compliance with the TERs at the POE by providing information regarding the attenuation of contamination between the POC and the POE.

4-13
To protect down-gradient receptors at the POE, monitoring at an AMP must show that the rate of COC release from the source is less than or equal to a site-specific action level (AL). This concept is illustrated in the graph in the middle of Figure 4-2. The AL value is determined from the same transport model(s) and same site data used for the SSCL calculation. AL concentration limits will decrease with increasing distance from the source area to the specified AMP location. When AMP ALs are exceeded, the Owner/Operator may be required to implement corrective action measures to ensure protection of down-gradient receptors. See Appendix D, Figure D-1 for procedures for determining AMP locations and ALs for the AMPs.
Target Excess Risk Limits
The target excess risk (TER) limits to be employed in development of Tier 2 RBSL and
SSCL values for individual constituents correspond to a target excess cancer risk of 10-6 (i.e., a one in one million chance of getting cancer) and a hazard quotient of 1.0 for non-carcinogenic effects. However, for the groundwater ingestion pathway, if a federal or state MCL has been promulgated for the constituent of concern, it must be used as the RBSL value at the POE. Source zone SSCLs are designed to prevent exceeding the RBSL concentrations at applicable POEs, and thereby incorporate these same TER limits.
Land Use Assumptions and Applicable Exposure Factors
For each complete exposure pathway and each COC, the Tier 2 RBSL and SSCL values
are intended to serve as conservative concentration limits that are protective of current and future land use activities. Usually future land use is assumed to be the same as current land use for five to 10 years. Therefore, in Worksheet #2 of Appendix B, the DERR has specified default exposure assumptions for both residential and commercial/industrial land use conditions. Off-site property should be assumed to be subject to residential use.
Standard exposure factors such as intake rate, body weight, exposure duration and
exposure frequency used in the RBSL and SSCL calculations are specified on Worksheet #2. These values compare to the RME scenarios established under EPA guidelines (U.S. Environmental Protection Agency, 1989). For each complete exposure pathway, the exposure factors from Worksheet #2 should be selected according to the receptor type (i.e., resident, commercial/industrial site worker, or construction worker) specified for that pathway on Table 4-1.
Constituents of Concern
For releases from USTs, the COCs to be addressed in the Tier 2 Risk Assessment may
include benzene, toluene, ethylbenzene, total xylenes and naphthalene (BTEXN); methyl-tert-butyl ether (MTBE), and; total petroleum hydrocarbons (TPH). Analysis of other COCs may be based on product type, and other substances stored, if applicable, as determined by the Executive Secretary.

4-14
Development of RBSL or SSCL Values
For BTEXN and MTBE, SSCL calculations must be based on the toxicological dose-response parameters (i.e., slope factor, reference dose and reference concentration) specified in the most recent EPA Integrated Risk Information System (IRIS, www.epa.gov/iris), or other resource approved by the DERR. Toxicity data are provided in Table D-2, Appendix D of this document. For TPH, site-specific, dose-response parameter values for non-carcinogenic effects are to be derived using the procedures established by the DERR, as specified below. In the Tier 2 Risk Assessment process, SSCL values for TPH in soil or groundwater must be derived for any relevant exposure pathways determined to be complete in the SCEM. These include all of the exposure pathways listed in the first column of Table 4-1 (i.e., soil dermal/ingestion/inhalation; soil-to-air; or soil-to-groundwater and groundwater ingestion).
The DERR requires use of standard EPA analytical methods to determine concentrations
of TPH fractions and other important COCs in petroleum products. The DERR’s method of TPH fraction evaluation is derived and modified from the TPH Criteria Working Group (TPHCWG) method described in Edwards et al. (1997) and Gustafson et al. (1997). The DERR’s method differs from the TPHCWG method mainly in the laboratory methods that are used to analyze TPH fractions. The TPHCWG method employs modified EPA Method 8015 to evaluate 13 TPH fractions. The DERR’s method, however, employs EPA analytical methods 8260B and 8270B (EPA SW-846) to evaluate 10 TPH fractions. These latter EPA methods are less expensive to perform, and they are capable of achieving lower detection limits and creating more reproducible results and consistency between laboratories and sampling events.
The DERR’s TPH fraction evaluation method uses the same fraction-specific reference
doses (RfDs), reference concentrations (RfCs), and fate-and-transport parameters that are provided in the TPHCWG method (Edwards et al., 1997, and Gustafson et al., 1997). Appendix D, Table D-2 of this document summarizes these toxicity and fate and transport parameters. These parameter values can be used in the exposure equations provided in Table D-1 to calculate fraction-specific RBSL or SSCL values for complete exposure pathways. Measured concentrations of each TPH fraction are then compared to their calculated SSCL values to determine the need for corrective action. Appendix D, Table D-3 provides summary guidelines regarding sample collection and testing for TPH fractions.
In the Tier 2 Risk Assessment, TPH RBSL or SSCL values that are calculated using the
DERR method will be required to achieve LUST case file closure for complete pathways with TPH-contaminated source media. The DERR evaluation method can be conducted during the Tier 2 Risk Assessment to facilitate development of relevant SSCL values for use in evaluation of the CAP. Alternatively, if the Owner/Operator anticipates corrective action for the complete pathway(s) due to the presence of other contaminants such as BTEXN or MTBE, the DERR method of analysis may be postponed until just prior to the Owner’s/Operator’s request for LUST case file closure, when it will be needed to demonstrate completion of the approved corrective action.
General Procedures for Deriving Tier 2 NAF Values
In the Tier 2 Risk Assessment, SSCL values for each complete exposure pathway and
COC can be calculated by first solving the RBSL equations for the appropriate receptor type, and then by multiplying the RBSL by the lateral transport NAF to derive the corresponding SSCL. NAF values can be calculated by either of the two following methods:
• Empirical Analysis: Calculate a NAF based on the actual measured concentration ratio
between the source medium and the POE and/or points in between, such as AMPs.

4-15
• Fate and Transport Modeling: Estimate a NAF based upon fate and transport modeling to predict concentration reductions between the source area and the POE.
Appropriate NAF values must be determined from a minimum of three, four and six
sampling points located along the dissolved plume centerline for Option 2, Option 3 and Option 4, respectively. Analytical expressions for deriving NAF values for lateral contaminant transport in air and groundwater are provided by Equations D.22, D.23, D.24 and D.25 in Table D-1.
If the contaminant plume is shown to be stable or diminishing in size and concentration,
empirical measurements can be employed to calculate the NAF value based on the ratio of COC concentrations in the exposure medium (i.e., air or groundwater) at the source to the COC concentration in the same medium at the POE. Equation D.25 in Appendix D, Table D-1 is used for this calculation. If the contaminant plume cannot be shown to be stable or diminishing, a conservative estimate of the NAF must be derived using fate and transport modeling methods based on site-specific data.
• For groundwater exposure pathways, the NAF value is commonly referred to as a
Dilution Attenuation Factor (DAF), which may be estimated using Equations D.22 or D.23 and site-specific input parameters.
• For air exposure pathways, natural attenuation of air contaminant concentrations
downwind of a source area is characterized by a lateral Air Dispersion Factor (ADF), which is calculated using Equation D.24.
For any given pathway, an SSCL value protective of a specific off-site POE location can
be derived by multiplying the RBSL for the applicable exposure pathway by the NAF value. For example, to derive an on-site groundwater SSCL that is protective of an off-site water well user to the TER or RBSL, multiply the RBSL for on-site groundwater (i.e., RBSLwing; see Equation D.2) by the NAF value for lateral groundwater transport (i.e., groundwater DAF from Equations D.22 or D.23) between the on-site groundwater source area and the off-site POE location. The RBSL value must be calculated for the appropriate off-site receptor type (e.g., resident) in accordance with Table 4-1.
Equations D.22, D.23, D.24 and D.25 are intended to provide conservative (lower-bound)
estimates of NAF values for air and groundwater transport based on use of appropriate, site-specific values. However, as discussed in further detail below, alternate modeling methods for estimation of site-specific NAFs can be employed under Tier 2 Options 3 or 4.
4.3 Tier 2 Options 1 through 4 Data Requirements and Calculation Methods
Site-specific data requirements for each option in Tier 2 are identified in Appendix B, Worksheet #2. The site-specific data include, at a minimum:
• Nature, type, extent and degree of contamination; • Hydrogeologic data, and; • Location of all receptors.
The site-specific data provide the essential input parameter values for deriving risk-based SSCLs,
and aid in determining if exposure pathways are currently complete and whether there is a risk to receptors.
Utah’s Tier 2 Risk Assessment process provides four options described below for solving the exposure equations and deriving SSCLs. Each successively higher option requires increasingly more

4-16
accurate site-specific data, and increasingly sophisticated contaminant fate and transport modeling to achieve greater accuracy and certainty in evaluating risks to receptors. Upgrading to the next option is recommended if DERR and Owner/Operator determine the following:
• Cleanup to calculated SSCLs is not reasonable; • There is reason to believe that the costs of collecting additional data and performing
additional calculations may be offset by lower cleanup costs; and; • Higher options may achieve greater accuracy in evaluating the nature and fate of
contamination, and in deriving cleanup levels.
The four options of Tier 2 are described below:
• Option 1 Site-Specific Cleanup Levels (Option 1 SSCLs): Option 1 is the simplest form of the Tier 2 Risk Assessment and generally pertains to only soil or small groundwater plumes. Utah’s Option 1 SSCLs are equivalent to “screening levels” in ASTM (1995) because, like Tier 1 SLs, they represent contaminant concentrations that are estimated to be protective of on-site receptors to the TER in situations without any off-site receptors.
- Option 1 is for on-site receptors only, with no off-site contamination. Therefore,
the SSCL equals the RBSL and NAFs are not applicable. - Contaminant plumes must be stable or decreasing in contaminant mass and
plume size, and must not extend off-site. However, because Option 1 is the only option that does not require long-term monitoring, plume stability may not be possible to determine and option upgrade may be necessary.
- Option 1 SSCLs are calculated for individual constituents using the minimum site-specific parameter data and the exposure equations identified in Appendices B, C and D.
• Option 2 Site-Specific Cleanup Levels (Option 2 SSCLs) are determined for the source
area that are estimated to be protective of both on-site and, if applicable, off-site receptors. Option 2 SSCLs are equivalent to “site-specific target levels” (SSTLs) in ASTM (1995).
- Because off-site receptors may be present in Option 2, NAFs for groundwater
can therefore be applied (i.e., SSCLs = RBSLs X NAF). Groundwater NAFs may be derived empirically based on field-measured concentrations and distance between measurement points.
- Contaminant plumes must be stable or diminishing. At least one year of quarterly monitoring is required to determine plume stability.
- Option 2 SSCLs are calculated for individual constituents using a relatively small amount of site-specific data and the exposure and cross-media transport equations (i.e., calculated RBSLs).
For the soil and air exposure pathways, Option 2 SSCLs are directly calculated using the equations in Appendix D, Table D-1. For groundwater exposure pathways, the user may first evaluate the plume stability condition using Worksheets #4a through #4e in Appendix B. For stable or diminishing groundwater plumes, an empirical NAF calculation should be obtained. For plumes that cannot be shown to be diminishing or stable, Option 2 does not apply. For such plumes, the Owner/Operator may elect to submit a CAP in accordance with Step 2.10 in Section 2 of this document. In this case, cleanup to applicable standards will be required. Alternatively, the Owner/Operator may proceed to the more detailed evaluations in Option 3.
4-17
• Option 3 Site-Specific Cleanup Levels (Option 3 SSCLs) are individual COC concentrations for the source area that are estimated to be protective of on-site and, if applicable, off-site receptors. Because off-site receptors may be present in Option 3, NAFs can be applied (i.e., SSCLs = RBSLs X NAF).
Contaminant plumes may be stable, decreasing or increasing in plume size. At least two years of quarterly monitoring are required to determine plume stability. Option 3 SSCLs and ALs for AMPs are derived by first solving the exposure and cross-media transport equations provided in Appendix D, Table D-1. For any exposure pathway or COC for which the initial SSCLs or ALs are exceeded, transient models are employed to improve the certainty of the SSCL and AL calculations. The transient modeling produces a two-fold result:
• The allowable SSCL for exposure pathways and COCs; and; • The duration and fate of the COCs if their applicable preliminary SSCLs are
exceeded.
• Option 4 Site-Specific Cleanup Levels (Option 4 SSCLs) are equivalent to ASTM (1995) Tier 3 SSTLs and are determined when Options 2 and 3 SSCLs cannot be reasonably achieved. Owners/Operators must demonstrate significant cost savings before proceeding with an Option 4 Risk Assessment.
Option 4 SSCLs are COC concentrations determined for individual constituents for the source area that are protective of on-site and, if applicable, off-site receptors. Because off-site receptors may be present in Option 4, NAFs can be applied (i.e., SSCLs = RBSLs X NAF).
Like Option 3, Option 4 may be performed for contaminant plumes that are stable, decreasing or increasing in plume size. At least five years of monitoring are required to determine plume stability.
Option 4 requires rigorous subsurface investigation, contaminant characterization, and sophisticated analytical and numerical chemical fate and transport modeling for each medium of concern. Option 4 initial SSCLs for the source area and ALs for AMPs are derived by first solving the exposure and cross-media transport equations provided in Appendix D, Table D-1. For any exposure pathway or COC for which the initial SSCLs or ALs are exceeded, transient models are employed to improve the certainty of the SSCL and AL calculations. The transient modeling produces a two-fold result:
4-18
• The allowable SSCL for exposure pathways and COC, and; • The duration and fate of the COCs if their applicable preliminary SSCLs are
exceeded.
4.4 Tier 2 Step-By-Step Procedures and Documentation The following step-wise Utah Tier 2 Risk Assessment process corresponds to the numbered Steps 4.1 through 4.27 on Figure 4-1 “Flow Chart of Utah’s RBCA Tier 2 Risk Assessment Process.” Each step provides instructions to Owners/Operators for conducting the site-specific risk assessment. The instructions identify data requirements and reporting formats for each step. The completed Tier 2 Risk Assessment report for any option to be submitted to the DERR must contain the following elements:
• Appendix B: Completed Tier 2 Worksheets #1, #2, #3, and #4a through #4e, if applicable.
• Appendix C: Site-specific raw data, including maps, cross-sections, graphs, boring test pit logs monitoring well construction diagrams, pump or slug test data and results, and analytical data.
• Appendix D: Calculations, parameter input values and solutions to the equations that are used to derive Tier 2 SSCL and ALs for AMPs. Modeling input, output and graphics.
The DERR encourages all Owners/Operators to contact their UST certified consultant and the
DERR project manager with questions regarding the DERR’s Tier 2 Risk Assessment process. Step 4.1: Are Applicable Tier 1 Groundwater Screening Levels Exceeded?
The Owner/Operator is responsible for determining if the Tier 1 SLs for groundwater are exceeded based on the data collected.
Yes: GO TO STEP 4.8 if the Tier 1 SLs for groundwater are exceeded. The Owner/Operator conducts
a Tier 2 Option 2 risk assessment. No: GO TO STEP 4.2 if the Tier 1 SLs for groundwater are not exceeded. The Owner/Operator
conducts Tier 2 Option 1 risk assessment. Step 4.2: OPTION 1: Are the Site-Specific Data Sufficient to Calculate Option 1 Cleanup
Levels?
The Owner/Operator needs site-specific data to calculate Option 1 SSCLs and to ensure a sufficient degree of certainty in assessing the risk to receptors. Because site-specific data are generally not available from UST closure results, the Owner/Operator often needs to collect the site-specific data by conducting additional subsurface investigations. The site-specific data required for Option 1 are identified in Worksheet #2 of Appendix B, and Appendices C and D.
Option 1 is the simplest form of the Tier 2 Risk Assessment. It is beneficial because it requires only a small amount of site-specific data, usually gathered during the initial Subsurface Investigation, and does not require long-term monitoring or transient contaminant fate and transport modeling. Option 1, however, requires that contaminant plumes be stable or diminishing. It may not be possible to confirm this condition without monitoring data or an upgrade to a higher option.
Option 1 SSCLs represent on-site concentrations of individual contaminant constituents at the source area in soil and groundwater that are expected to be protective of on-site receptors to

4-19
applicable MCLs, the TER, or other applicable standards, for all exposure media and pathways. Because the receptor is assumed to be at the source area in Option 1, there is no NAF. Therefore, the Option 1 SSCL is equal to the RBSL. If the contamination is off-site or if there are off-site receptors, go to Step 4.8 and upgrade to Option 2.
The differences between Tier 1 SLs and Tier 2 Option 1 SSCLs include the following:
• Tier 1 SLs are for screening purposes only, consider only selected exposure pathways,
and are based on limited, general and conservative assumptions characteristic of Utah's intermontane basins.
• A Tier 2 Option 1 risk assessment allows the use of site-specific data collected from
subsurface investigations to evaluate the risks to on-site receptors for all three exposure pathways (air, groundwater and soil).
• Tier 1 groundwater SLs are based on ingestion of the groundwater which must meet the
MCL standards (approximately 10-6 TER). In contrast, Tier 2 allows for the evaluation of all exposure pathways, such as the vapor-intrusion-to-indoor air inhalation pathway. Therefore, depending on the site-specific conditions, Tier 2 Option 1 soil SSCLs may be higher or lower than the Tier 1 SLs.
Yes: GO TO STEP 4.4 to calculate Option 1 SSCLs and determine if SSCLs are exceeded. No: GO TO STEP 4.3 and conduct additional subsurface investigations to gather the necessary site-
specific data for calculating Option 1 SSCLs. Step 4.3: Owner/Operator Conducts Additional Investigations
If site-specific data are not sufficient for calculating Option 1 SSCLs, the Owner/Operator must conduct additional investigations. These may include collecting samples to characterize and define the extent and degree of contamination, characterize hydrogeologic conditions, locate all on-site receptors, and identify and evaluate all exposure media and exposure pathways. Additional investigation usually involves collecting representative environmental samples and gathering other data required by Worksheet #2 through such activities as digging, drilling or direct-push methods, laboratory analysis and aquifer testing.
GO TO STEP 4.2 to ensure there are sufficient site-specific data to calculate Option 1 SSCLs.
Step 4.4: OPTION 1: Owner/Operator Calculates Option 1 Site-Specific Cleanup Levels:
Are the Option 1 SSCLs Exceeded?
After meeting the Option 1 data requirements (Worksheet #2 in Appendix B, and Appendices C and D of this document), Option 1 SSCLs are calculated by solving the equations in Table D-1 of Appendix D for individual constituents and for all complete exposure pathways. Commercially available electronic spreadsheets may also be used to calculate SSCLs. Option 1 SSCLs are equal to the RBSLs because receptors are assumed to be located at the source area and there is therefore no NAF.

4-20
The Owner/Operator then determines if the contaminant concentrations exceed the calculated SSCLs by comparing the maximum observed contaminant concentrations to the calculated Option 1 SSCLs for all complete exposure pathways. The final Option 1 SSCLs are the lowest concentrations that are calculated for any of the complete exposure pathways.
Detailed procedures and reporting formats for calculating Option 1 SSCLs and presenting the Option 1 Risk Assessment are shown in Section 5 and Appendices B, C and D of this document.
Yes: GO TO STEP 4.5 if the contaminant concentrations are greater than the lowest concentrations
calculated for any complete exposure pathway. No: GO TO STEP 4.23 if the contaminant concentrations are less than the lowest concentrations
calculated for any complete exposure pathway. Step 4.5: Is Cleanup to Option 1 SSCLs Reasonable?
The Owner/Operator determines if cleanup measures are reasonable by comparing the costs of collecting additional site-specific data to support higher levels of the risk assessment using Options 2 through 4 with the costs of performing cleanup to achieve lower-tier cleanup levels (e.g. Option 1 or Tier 1 criteria). Owners/Operators can use the information contained in their original RAP to compare the costs of performing further risk assessment to conducting cleanup. The Owners/Operator may find that conducting additional subsurface investigations to perform higher option requirements are more costly than cleaning up the contamination.
An example of a cleanup that may be considered reasonable because it is economically and technologically feasible where receptors are not immediately at risk may include the following:
• Contaminated soil occurs at a shallow depth and can be removed for a reasonable cost.
An example of conditions that may render cleanup not reasonable because it is not economically and technologically feasible may include the following:
• Contaminated soil is located from 35 to 40 feet below land surface and groundwater is
not expected to be impacted. The soil cannot be removed for a reasonable cost and receptors are expected to be protected.
If any remaining contamination has the potential to threaten receptors or impact future land use, cleanup and/or institutional controls may be necessary. See Step 4.25 for examples of institutional controls.
Yes: GO TO STEP 4.22 if cleanup to Option 1 SSCLs is reasonable. The Owner/Operator then
submits a CAP in accordance with Figure 2-1, Step 2.10. The Owner/Operator identifies cleanup options and proposes the most reasonable method to clean up the contamination to applicable cleanup standards.
No: GO TO STEP 4.6 if cleanup to Option 1 SSCLs is not reasonable. The Owner/Operator determines if response action is necessary based on all of the data collected.
Step 4.6: Is Response Action Necessary?
Response action may be necessary for protecting receptors due to changing site conditions or land use that indicate that receptors are at risk. This may include either current receptors, or receptors that could be affected following changes in land use. The Executive Secretary may require response action if contaminant sources are not eliminated by removal or control (e.g., if secondary sources remain, or have the potential to further degrade natural resources or to threaten

4-21
receptors). See Step 4.7 for examples of response actions. Yes: GO TO STEP 4.7: The Owner/Operator takes necessary response actions. No: GO TO STEP 4.8 to implement Option 2. Step 4.7: Take Interim Response Action
Owners/Operators must take appropriate response actions. Response actions may include providing partial or continued source removal, implementing contaminated soil or groundwater removal, providing alternative water supply, evacuating vapors from structures, or other actions necessary to reduce risks to receptors.
GO TO Figure 2-1, Step 2.10: The Executive Secretary may require the Owner/Operator to submit a Corrective Action Plan for the appropriate response actions. After response actions have been satisfactorily completed, the Owner/Operator may proceed with the Tier 2 Risk Assessment process again.
Step 4.8: OPTION 2: Are the Site-Specific Data Sufficient to Calculate Option 2 Cleanup
Levels?
The Owner/Operator needs site-specific data to calculate Option 2 SSCLs for the source area and to ensure a sufficient degree of certainty in assessing the risk to receptors. Site-specific data requirements are greater for Option 2 than for Option 1, and the Owner/Operator needs to collect the required data by conducting additional subsurface investigations. The additional investigations are used to help further define the extent and degree of contamination in soil and groundwater, identify on-site and off-site receptors, and better define the nature and migration potential of the contamination relative to receptors, exposure pathways and exposure media.
The site-specific data required for Option 2 are identified in Worksheet #2 of Appendix B, and Appendices C and D. Option 2 is more complex than Option 1 because it requires more data points and one year of quarterly monitoring. The monitoring must include analysis of BTEXN/MTBE/TPH, or other constituents based on product type, and the analysis of natural attenuation parameters to ensure the contaminant plume is stable or diminishing.
Option 2 provides for the evaluation of off-site as well as on-site receptors. Like Option 1, Option 2 does not require transient modeling. The additional data and complexity of Option 2 can be beneficial because the data add a greater degree of certainty in assessing risk to receptors.
Option 2 SSCLs represent concentrations of individual contaminant constituents in soil and groundwater that are expected to be protective of on-site and off-site receptors to applicable ISLs, the TER or other applicable standards for all exposure media and pathways.
Yes: GO TO STEP 4.10 to calculate Option 2 SSCLs and to determine if the calculated Option 2
SSCLs are exceeded. No: GO TO STEP 4.9 and conduct additional subsurface investigation to gather the necessary site-
specific data.

4-22
Step 4.9: Owner/Operator Conducts Additional Investigation
If site-specific data are not sufficient for calculating Option 2 SSCLs, the Owner/Operator must conduct additional investigations. These may include collecting samples to characterize and define the extent and degree of contamination, characterize hydrogeologic conditions, locate all on-site receptors, and identify and evaluate all exposure media and exposure pathways. Additional investigation usually involves collecting representative environmental samples and gathering other data required by Worksheet #2 through such activities as digging, drilling or direct-push methods, laboratory analysis and aquifer testing.
GO TO STEP 4.8 to ensure that the site-specific data are sufficient for calculating Option 2 SSCLs.
Step 4.10: OPTION 2: Owner/Operator Calculates Option 2 Cleanup Levels for Soil and
Groundwater: Are the Option 2 SSCLs exceeded?
After meeting the Option 2 data requirements (see Section 3, Worksheet #2 in Appendix B, and Appendices C and D of this document), Option 2 SSCLs are calculated by solving the equations in Table D-1 of Appendix D for individual constituents of concern for all complete exposure pathways. Commercially available electronic spreadsheets may be used to calculate SSCLs.
Option 2 may include evaluation of off-site receptors, or receptors that are located some distance from the source area. In those cases, a NAF can be calculated to derive final Option 2 SSCLs. NAFs can be calculated using Equations D.22, D.23, D.24 and D.25.
The Owner/Operator then determines if the contaminant concentrations exceed the calculated SSCLs by comparing the maximum observed contaminant concentrations of individual constituents to the calculated Option 2 SSCLs for all complete exposure pathways. The final Option 2 SSCLs are the lowest concentrations that are calculated for any of the complete exposure pathways.
Detailed procedures and reporting formats for calculating Option 2 SSCLs and presenting the Option 2 Risk Assessment are shown in Section 5 of this document.
Yes: GO TO STEP 4.11 if the contaminant concentrations are greater than the lowest concentrations
calculated for any complete exposure pathway. No: GO TO STEP 4.23 if the contaminant concentrations are less than the lowest concentrations
calculated for any complete exposure pathway. Step 4.11 Is Cleanup to Option 2 SSCLs Reasonable?
The Owner/Operator determines if the cleanup measures are reasonable by comparing the costs of collecting additional site-specific data to support higher levels of the Tier 2 Risk Assessment using Options 3 or 4 with the costs of performing cleanup to achieve lower-option cleanup levels (e.g. Option 1 or Tier 1 criteria). Owners/Operators can use the information contained in their original RAP to compare the costs of performing further risk assessment to conducting cleanup. Owners/Operators may find that conducting rigorous additional subsurface investigations and performing contaminant fate and transport modeling are more costly than cleaning up the contamination.
An example of cleanup under Option 2 that may be considered reasonable when receptors are not immediately at risk is the following:
• Contaminated soil has not been removed and groundwater monitoring wells installed.

4-23
Groundwater sampling and hydraulic gradient monitoring indicate that contaminant concentrations are decreasing. Because the remaining soil contamination is above the calculated SSCLs, protective measures may need to be implemented. These protective measures are determined to be less costly than proceeding to Option 3.
An example of conditions that may render cleanup to Option 2 SSCLs unreasonable may include:
• A known area of soil contamination is located beneath a building and cannot be removed.
Site-specific data indicate that the contamination occurs in clayey sediment beneath the building. Excavation is not reasonable because of the depth and location of the contamination beneath the building, and in situ soil treatment is not reasonable due to the low permeability of the fine-grained sediment. Further risk assessment is determined to be a reasonable method of ensuring protection of receptors to applicable levels.
Yes: GO TO STEP 4.22 if cleanup to Option 2 SSCLs is reasonable. The Owner/Operator submits a
CAP in accordance with Figure 2-1, Step 2.10. The Owner/Operator identifies cleanup options and proposes the most reasonable method to clean up the contamination to applicable cleanup standards.
No: GO TO STEP 4.12 if cleanup to Option 2 SSCLs is not reasonable. The Owner/Operator determines if response action is necessary based on all of the data collected.
Step 4.12 Is Response Action Necessary?
Response action may be necessary for protecting receptors due to changing site conditions or land use that indicate that receptors are at risk. This may include either current on-site and off-site receptors, or receptors that could be affected following changes in land use. The Executive Secretary may require response action if contaminant sources are not eliminated by removal or control (e.g., if secondary sources remain, or have the potential to further degrade natural resources or to threaten receptors). See Step 4.7 for examples of response actions.
Yes: GO TO STEP 4.7 where the Owner/Operator takes necessary response actions. No: GO TO STEP 4.13 to implement Option 3. Step 4.13: OPTION 3: Are the Site-Specific Data Sufficient to Derive Option 3 SSCLs?
The Owner/Operator needs sufficient site-specific data to calculate Option 3 SSCLs for the source area, and ALs for AMPs, to ensure a high degree of certainty in assessing the risk to receptors. Site-specific data requirements are greater for Option 3 than those for Options 1 and 2, and the Owner/Operator needs to collect the required data by conducting additional subsurface investigations. The additional subsurface investigations helps further define the extent and degree of contamination in soil and groundwater, identify on-site and off-site receptors, and collect increasingly more precise data needed for modeling the nature and migration potential of the contamination relative to receptors, exposure pathways and exposure media.
The site-specific data required for Option 3 are identified in Worksheet #2 of Appendix B, and Appendices C and D. Option 3 is more complex than Option 2 because it requires more data points, two years of quarterly monitoring, and transient contaminant fate and transport modeling. The monitoring must include analysis of BTEXN/MTBE/TPH, or other constituents based on product type, and the analysis of natural attenuation parameters. The complexity and increased data requirements of Option 3 can be beneficial because of the greater degree of certainty in assessing risk to receptors.
Unlike Option 2, Option 3 contaminant plumes may be expanding. Transient modeling is therefore required to better understand the nature of the contamination and risk to receptors in

4-24
space and time. Like Option 2, Option 3 requires that off-site and on-site receptors be evaluated.
Like the Option 2 SSCLs, Utah's Option 3 SSCLs represent concentrations of individual contaminant constituents in soil and groundwater that are expected to be protective of current and future exposure pathways and of on-site and off-site receptors to applicable ISLs, the TER or other applicable standards for all complete exposure pathways. The additional data and complexity of Option 3 can be beneficial because the greater degree of certainty in assessing risk to receptors may result in higher SSCLs and less costly cleanup.
Yes: GO TO STEP 4.15 to calculate Option 3 SSCLs and ALs and to determine if the calculated
Option 3 SSCLs and ALs are exceeded. No: GO TO STEP 4.14 and conduct additional investigation to gather the necessary site-specific data. Step 4.14: Owner/Operator Conducts Additional Investigation and/or Monitoring
If site-specific data are not sufficient for deriving Option 3 SSCLs, the Owner/Operator must conduct additional investigations and/or monitoring. Additional investigations may include collecting samples to characterize and define the extent and degree of contamination, characterize hydrogeologic conditions, locate all on-site and off-site receptors, and identify and evaluate all complete exposure pathways. Additional investigation usually involves collecting representative environmental samples and gathering other data required by Worksheet #2 through such activities as digging, drilling or direct-push methods, laboratory analysis and aquifer testing. Two years of quarterly monitoring are required for Option 3 to estimate plume stability and contaminant mass balance, and to facilitate the use of transient analytical contaminant fate and transport models and derive Option 3 SSCLs and ALs for AMPs.
GO TO STEP 4.13 to ensure there are sufficient site-specific data to calculate Option 3 SSCLs Action Levels.
Step 4.15: OPTION 3: Owner/Operator Derives Option 3 Soil and Groundwater SSCLs and ALs
for Individual Constituents: Are the Option 3 SSCLs or ALs Exceeded?
After meeting the Option 3 data requirements (Worksheet #2 of Appendix B, and Appendices C and D), Option 3 SSCLs and ALs for AMPs are calculated for individual constituents by solving the equations shown in Table D-1 and Figure D-1 of Appendix D. Placement of AMPs and calculation of associated ALs are required if the contaminant plume is not stable or is expanding. The Owner/Operator first calculates preliminary Option 3 SSCLs for all complete exposure pathways. Commercially available electronic spreadsheets may be used to solve the exposure and transport equations and calculate preliminary SSCLs. Transient analytical modeling is then performed to evaluate the effects and location of the contamination and the calculated SSCLs in space and time (i.e. transient conditions) to derive the final SSCLs.

4-25
The Owner/Operator compares the maximum observed contaminant concentrations of individual constituents to the calculated preliminary Option 3 SSCLs for all complete exposure pathways. If the calculated preliminary SSCLs are exceeded, the Owner/Operator may perform transient analytical contaminant fate and transport modeling to derive final SSCLs.
The final SSCLs and ALs are the contaminant concentrations that will be protective of receptors to the TER in space and time. The final Option 3 SSCLs and ALs are the lowest concentrations that are derived for any of the complete exposure pathways.
Detailed procedures and reporting formats for calculating and deriving Option 3 SSCLs and ALs, and for presenting the Option 3 Risk Assessment are shown in Section 5 and Appendix D of this document.
Yes: GO TO STEP 4.16 if the contaminant concentrations in the source area exceed the derived Option
3 SSCLs and ALs, and if the contaminant concentrations are greater than the lowest concentrations calculated for a complete exposure pathway.
No: GO TO STEP 4.23 if the contaminant concentrations in the source area do not exceed the derived Option 3 SSCLs and ALs.
Step 4.16: Is Cleanup to Option 3 SSCLs Reasonable?
The Owner/Operator determines if the cleanup measures are reasonable by comparing the costs of collecting additional site-specific data to support an Option 4 Risk Assessment with the costs of performing cleanup to achieve lower-option cleanup levels (i.e., Option 1 or 2, or Tier 1 criteria). Owners/Operators can use the information contained in their original RAP to compare the costs of performing further risk assessment to conducting cleanup. The Owner/Operator may find that conducting additional subsurface investigations and collecting additional data necessary for performing Option 4 contaminant fate and transport modeling are more costly than cleaning up the contamination.
An example of conditions under Option 3 where cleanup may be considered reasonable is the following:
• A large dissolved contaminant plume cannot be captured, contained or treated for a
reasonable cost. Contaminated soil occurs at a shallow depth and appears to be leaching to groundwater and causing a dissolved contaminant plume. Quarterly monitoring of contaminant concentrations, depth to groundwater, hydraulic gradient, and dissolved oxygen and other natural attenuation parameters are used in transient analytical modeling. The monitoring and modeling results indicate that the plume is not migrating, but will continue to persist for many years. The modeling also indicates that if contaminated soil in the source area is removed, the contaminant mass currently leaching to the groundwater will be significantly reduced and the dissolved plume would be sufficiently degraded in three years. In addition, the property is being sold for development and any proposed buildings would be at risk of vapor intrusion. The most reasonable method of controlling the contaminant plume, expediting achievement of “No Further Action”, and ensuring protection of receptors is removal of the contaminated soils.
An example of conditions under which cleanup to Option 3 SSCLs and ALs may not be considered reasonable is the following:

4-26
• A large dissolved contaminant plume occurs in a non-potable aquifer. The plume cannot be captured, contained or treated for a reasonable cost. Monitoring is no longer feasible due to changes in land use. Receptors are not currently or potentially at risk as a result of the land use change and as determined by transient analytical modeling. Long-term quarterly monitoring of the contaminant concentrations, depth to groundwater, hydraulic gradient, and dissolved oxygen indicates that the plume is stable and is decreasing in size and contaminant mass relatively quickly. Transient analytical modeling of individual constituents accurately reflects the quarterly monitoring data, and predicts that the plume will be sufficiently degraded within a short time. Further risk assessment using numerical modeling according to Option 4 is therefore determined to be the most cost-effective and feasible technology for ensuring protection of receptors to the applicable standards.
Yes: GO TO STEP 4.22 if the Owner/Operator determines that cleanup is reasonable. No: GO TO STEP 4.17 if the Owner/Operator determines that cleanup is not reasonable. Step 4.17: Is Response Action Necessary?
Response action may be necessary for protecting receptors due to changing site conditions or land use that indicate that receptors are at risk. This may include either current receptors, or receptors that could be affected following changes in land use. The Executive Secretary may require response action if contaminant sources are not eliminated by removal or control (e.g., if secondary sources remain, or have the potential to further degrade natural resources or to threaten receptors). See Step 4.7 for examples of response actions.
Yes: GO TO STEP 4.7 where the Owner/Operator takes necessary response actions. No: GO TO STEP 4.18 to implement Option 4. Step 4.18: OPTION 4: Are the Site-Specific Data Sufficient to Derive Option 4 SSCLs?
Option 4 is the most complex form of the Tier 2 Risk Assessment, but it provides the greatest accuracy in deriving SSCLs for the source area, establishing ALs for AMPs, and determining risk to receptors. Option 4 may be performed when the contaminant plume is diminishing, stable or expanding. Option 4 evaluations should be performed only when an Owner/Operator can demonstrate that performing an Option 4 risk assessment will result in significant cost savings compared to site cleanup for equal levels of protection.
Like Options 2 and 3, Option 4 requires the evaluation of on-site and off-site receptors for all exposure pathways and media. Option 4 is the most difficult because it requires more data points and site-specific data, a minimum of five years of quarterly monitoring for the COCs and for natural attenuation parameters, and transient analytical and transient numerical contaminant fate and transport modeling. The rigorous modeling is required to accurately evaluate the site conditions and the ability of the calculated SSCLs to be protective of current and future exposure pathways for both on-site and off-site receptors. Site-specific data requirements for Option 4 are shown in Worksheet #2 of Appendix B.
Additional investigation may be necessary to gather the necessary site-specific data. The additional subsurface investigations help further define the extent and degree of contamination in soil and groundwater, identify on-site and off-site receptors, and provide the precise data needed to support modeling of the nature and migration potential of the contamination relative to receptors, exposure pathways and exposure media. The large volume of data required for Option 4 is required to ensure a high degree of accuracy in characterizing the contamination, and ability to offer greater confidence in estimating risks to receptors.

4-27
Option 4 SSCLs represent concentrations of individual contaminant constituents in soil and groundwater that are expected to be protective of on-site and off-site receptors to applicable ISLs, the TER or other applicable standards for all exposure media and pathways.
Yes: GO TO STEP 4.20 to calculate Option 4 SSCLs and ALs and to determine if the calculated
Option 4 SSCLs and ALs are exceeded. No: GO TO STEP 4.19 and conduct additional investigations to gather more precise site-specific data. Step 4.19: Owner/Operator Conducts Additional Investigation
If site-specific data are not sufficient for deriving Option 4 SSCLs, the Owner/Operator must conduct additional investigations and/or monitoring. Additional investigations may include collecting samples to characterize and define the extent and degree of contamination, characterize hydrogeologic conditions, locate all on-site and off-site receptors, and identify and evaluate all complete exposure pathways. Additional investigations usually involve collecting representative environmental samples, laboratory analysis or aquifer tests through activities such as excavating, drilling or direct-push methods. Five years of quarterly monitoring are required for Option 4 to estimate plume stability and contaminant mass balance, and to facilitate the use of transient analytical contaminant fate and transport models and derive Option 4 SSCLs and ALs for AMPs.
GO TO STEP 4.18 to determine if the site-specific data are sufficient to perform a Tier 2 Option 4 Risk Assessment.
Step 4.20: OPTION 4: Owner/Operator Derives Option 4 Soil and Groundwater SSCLs and ALs
for Individual Constituents: Are the Option 4 SSCLs or ALs Exceeded?
After meeting the Option 4 requirements (Worksheet #2 of Appendix B, and Appendices C and D), Option 4 SSCLs for the source area, and ALs for AMPs are calculated by solving the equations in Table D-1 and in Figure D-1 of Appendix D, respectively. Placement of AMPs and calculation of associated ALs are required for Option 4 if the contaminant plume is not stable or if it is expanding.
The Owner/Operator first calculates preliminary Option 4 SSCLs for all complete exposure pathways. Commercially available electronic spreadsheets may be used to solve the exposure and transport equations and calculate preliminary SSCLs. Transient analytical and numerical modeling is then performed to evaluate the effects and location of the contamination and the calculated SSCLs in space and time (i.e. transient conditions) to derive the final SSCLs.
The Owner/Operator then determines if the contaminant concentrations exceed the calculated preliminary SSCLs. To determine if the preliminary SSCLs are exceeded, the Owner/Operator compares the maximum observed contaminant concentrations of individual constituents to the calculated preliminary Option 4 SSCLs for all complete exposure pathways. If the calculated preliminary SSCLs are exceeded, or if the contaminant plume is increasing in size, or if the contamination is observed to be partitioned in various phases (e.g., adsorbed, dissolved, vapor) in space and time, the Owner/Operator may perform transient analytical and transient numerical contaminant fate and transport modeling to derive final SSCLs.

4-28
The final Option 4 SSCLs and ALs are the lowest concentrations that are derived for any of the complete exposure pathways. The final SSCLs and ALs are the contaminant concentrations that will be protective of receptors to the TER in space and time.
Detailed procedures and reporting formats for deriving Option 4 SSCLs and ALs, and for presenting the Option 4 Risk Assessment are shown in Section 5 of this document.
Yes: GO TO STEP 4.21 if the contaminant concentrations in the source area exceed the derived Option
4 SSCLs and ALs and if the contaminant concentrations are greater than the lowest concentrations calculated for a complete exposure pathway.
No: GO TO STEP 4.23 if the contaminant concentrations in the source area do not exceed the derived Option 4 SSCLs and ALs.
Step 4.21: Is Response Action Necessary?
Response action may be necessary for protecting receptors due to changing site conditions or land use that indicate that receptors are at risk. This may include either current on-site or off-site receptors, or receptors that could be affected following changes in land use. The Executive Secretary may require response action if contaminant sources are not eliminated by removal or control (e.g., if secondary sources remain, or have the potential to further degrade natural resources or to threaten receptors). See Step 4.7 for examples of response actions.
Yes: GO TO STEP 4.7 where the Owner/Operator takes necessary response actions. No: GO TO STEP 4.22 for submittal of the Tier 2 Risk Assessment and CAP. Step 4.22: Owner/Operator Submits Tier 2 Risk Assessment Report and a Corrective Action Plan
For all of the options, after the Owner/Operator completes a Tier 2 Risk Assessment, they must submit the Tier 2 Risk Assessment report. The contents of the Tier 2 Risk Assessment report are specified in Section 5 of this document. The Tier 2 Risk Assessment report documents all findings, conclusions and recommendations.
A CAP must be submitted for all affected areas where the Owner/Operator determines that cleanup to appropriate levels is reasonable, or if any SSCL values are exceeded for a complete exposure pathway. The Executive Secretary must review and approve the CAP prior to its implementation.
The Owner/Operator must submit the CAP in a format specified in the CAP guide issued by the DERR. The CAP:
• Evaluates, identifies, and describes all appropriate or applicable cleanup technologies for
their ability to achieve the applicable performance standard for the exposure pathway(s) of concern, and;
• Provides detailed design and construction information regarding the selected corrective
action method.

4-29
For each complete exposure pathway for which a SSCL is exceeded, the selected corrective action must achieve minimum performance standards. Performance standards, which are identified in Figure 4-4, are protective criteria that serve to reduce risk posed to current and future receptors. For the pathways listed on Figure 4-4, these performance standards fall into two general categories:
• Human Health Protection: For human health exposure pathways, including air, soil, or
groundwater exposures, the applicable performance standard involves reduction of contaminant concentrations at the POE to safe levels, as defined by the applicable TER limits. Reduction to safe levels can be achieved by removal or treatment of affected soil and/or groundwater exceeding the applicable pathway SSCL values, or by use of appropriate exposure control measures (e.g., environmental controls) to prevent contaminant migration to the POE at levels exceeding the specified TER limits.
• Subsurface Utility Protection: For subsurface utilities such as sewer lines, water mains
and telephone lines, practical measures must be applied to prevent physical damage to the utility by soil or groundwater contaminants, including non-aqueous phase liquids (NAPL); accumulation of explosive vapors at a level exceeding 20% of the lower explosive limit (LEL) in the utility air space, and (3) migration of contaminated fluids or vapors via the utility line or associated backfill. In all cases, NAPLs present in the groundwater system must be removed to the extent practicable. For protection of subsurface utilities, SSCL values cannot be derived or applied. Rather, direct inspections and/or measurements such as soil vapor surveys are conducted to identify potential impacts, and appropriate measures are implemented as needed to meet the applicable performance standards.
The corrective action strategy selected to achieve these performance standards will depend in part on the relative immediacy of the potential impact associated with each pathway of concern, as shown in Figure 4-4. For current exposures, active removal/treatment measures or installation of engineering controls may be required to achieve immediate reduction of exposure concentrations. Examples of response actions for both current and potentially complete exposure pathways are provided on Figure 4-4.
The CAP submittal must evaluate the relative performance and feasibility of available cleanup technologies and justify selection of the proposed remedy.
GO TO STEP 4.23 to submit a request for no further action.

4-30
Figure 4-4: Risk Management Options for Complete Exposure Pathways
EXAMPLES OF RESPONSE ACTIONS FOR:
Exposure Pathway and Remedy Performance Standard
Current Exposure
Potential Exposure
Air Exposure
Prevent exceedance of applicable risk limits resulting from vapor or dust inhalation.
· Soil Removal or Treatment: Remove and/or treat affected soils to achieve applicable Tier 1 Criteria or Tier 2 SSCLs.
· Engineering Controls: Control vapor or dust release by soil stabilization, encapsulation, or surface cover measures.
· Engineering Controls: Maintain or augment existing surface cover to prevent soil vapor and dust release; install fencing to restrict access.
Soil Exposure
Prevent exceedance of applicable risk limits resulting from human exposure via incidental soil ingestion or dermal contact
· Soil Removal or Treatment: Remove and/or treat affected
soils to achieve applicable Tier 1 Criteria or Tier 2 SSCLs.
· Engineering Controls: Prevent soil ingestion or dermal contact by soil encapsulation of surface cover measures.
· Engineering Controls: Maintain or augment existing surface cover to prevent soil contact.
Groundwater Ingestion Prevent exceedance of drinking water limits in water supply wells completed within underlying water-bearing strata.
· GW Removal or Treatment: Remove and/or treat affected
GW to achieve applicable Tier 1 Criteria or Tier 2 SSCLs. · Engineering Controls: Install physical or hydraulic barrier
to prevent GW plume migration to POE.
· GW Natural Attenuation: Conduct natural attenuation
monitoring as needed to confirm plume stability or reduction.
Subsurface Utilities
Prevent property damage, explosive vapor condition, and contaminant migration via subsurface utility corridor. Remove non-aqueous phase liquids (NAPLs) to extent practicable.
· Soil or GW Removal or Treatment: Remove and/or treat affected soils and GW impacting subsurface utility.
· Engineering Controls: Use physical barrier, vapor control measures, etc., to prevent impacts on subsurface utilities.
· Construction Notice: Define zone subject to special construction measures.
· GW Natural Attenuation: Conduct natural attenuation
monitoring as needed to confirm plume stability or reduction.
NOTES:
1) For all current or potentially complete exposure pathways identified in the initial pathway screening and in Tier 2 Options 1 through 4, response actions will be required to protect public health and the environment. Appropriate remedial measures must be developed on a site-specific basis in accordance with CAP requirements. As noted in above examples, effective risk management may involve more frequent use of active removal or treatment measures for current exposures than for potential future exposures. Response measures listed above are for example purposes only. 2) Current Exposure: Pathway is complete and may pose current, ongoing exposure in excess of applicable limits.
Potential Exposure: Pathway is complete, but exposure is not presently occurring because of current site use and/or existing control measure such as pavement or fencing.
3) GW = Groundwater SW = Surface water POE = Point of Exposure Tier 1 Criteria = Utah’s Tier 1 Screening Levels and distance to receptors criteria NAPL = Non-Aqueous Phase Liquid SSCL = Site-Specific Cleanup Level

4-31
Step 4.23: Owner/Operator Requests No Further Action
After the Owner/Operator completes a Tier 2 Risk Assessment, they must submit a risk assessment report, if not previously submitted as part of Step 4.22. The Tier 2 Risk Assessment Report documents their findings, conclusions and recommendations. If a corrective action plan was submitted, then the Owner/Operator needs only to submit the corrective action report that details the cleanup results by providing appropriate progress, monitoring or confirmation reports. The Owner/Operator may request that no further action be taken based on achieving SSCLs and ALs for AMPs, if applicable. Owners/Operators should submit a written request for no further action to the Executive Secretary.
GO TO STEP 4.24 where the DERR determines if further action is required based on the Utah’s Cleanup Rules.
Step 4.24: DERR Evaluation: Are the Cleanup Criteria Met?
The DERR evaluates the progress and monitoring reports based on the Cleanup Criteria required by the Utah’s Cleanup Rules. Those criteria are:
• Source elimination through removal or control. • Current or potential impact of the contamination on public health. • Current or potential impact of the contamination on the environment. • Economic considerations and cost-effectiveness of cleanup options, and; • Technology available for use in cleanup.
Public notification is required for any CAP prior to actual implementation. However, in the case of Tier 2 Risk Assessments, these public notification requirements are postponed until after the risk assessment is completed and the final Risk Assessment report is reviewed by the Executive Secretary. The public notification requirements in the case of Tier 2 Risk Assessments are made by the Executive Secretary on a site-specific basis and must be completed prior to site closure considerations. The Owner/Operator is required to notify the potentially affected public of the preliminary acceptance of the conclusions and recommendations of the risk assessment. All relevant comments received during the public comment period will be considered, and addressed as needed, on a case-by-case basis by the Executive Secretary.
Yes: GO TO STEP 4.27 where the Executive Secretary issues the Owner/Operator a no further action
letter. No: GO TO STEP 4.25 where the Executive Secretary issues the Owner/Operator a letter identifying
further work needed.
Step 4.25: Executive Secretary Issues the Owner/Operator Letter Identifying Further Work Needed
If the requirements of the Cleanup Criteria have not been met, the Executive Secretary issues the Owner/Operator a letter identifying work needed to meet those requirements. The letter identifies the options available to the Owner/Operator that are necessary to enable the DERR to close the case file and require no further action. Available options generally include continued cleanup to applicable contaminant levels, performing environmental monitoring, performing a risk assessment, and/or implementing institutional controls.

4-32
The Owner/Operator may propose new cleanup levels if the approved CAP is no longer cost-effective or technically capable of achieving the original cleanup levels. The Cleanup Criteria again must be evaluated and must demonstrate that new cleanup levels are protective of receptors via all exposure pathways to applicable ISLs, the TER or other applicable standards.
GO TO STEP 4.26 if the SSCLs and ALs for AMPs, if applicable, are not achieved, or if receptors are at risk of exposure to concentrations greater than ISLs, the TER or other applicable standards, cleanup according to an approved CAP must continue or be implemented until the SSCLs are achieved.
Step 4.26: Has the Owner/Operator Completed the Additional Work, Institutional Controls and/or
Monitoring?
The Owner/Operator is responsible for completing appropriate work for achieving the cleanup levels and meeting the requirements of the Cleanup Criteria (see Step 4.24). The DERR evaluates all data to determine if the work performed is successful in meeting the requirements of the Cleanup Criteria.
To confirm satisfactory completion of the corrective action, a compliance monitoring program may be required for all affected media that were addressed by the CAP. Compliance monitoring, or confirmation sampling, typically involves sampling and testing of a representative number of locations on an established schedule to identify either:
• Any remaining contaminant levels exceeding established SSCLs or ALs, if applicable, or; • New site conditions that may require additional corrective action.
For soils, confirmation sampling at representative locations and depths will be required. For groundwater, multiple sampling episodes may be required to demonstrate the effectiveness of the groundwater corrective action effort.
General guidelines for design and implementation of compliance monitoring for soil and groundwater cleanups are provided below. Once sufficient data have been provided to demonstrate satisfactory completion of the corrective action program, the Owner/Operator may request no further action at the site. See Step 2.22 and Step 4.23 for the procedures leading to this request.

4-33
Soil Compliance Monitoring Specifications
Soil confirmation sampling is required upon completion of soil removal or other treatment actions to confirm attainment of specified cleanup goals throughout the affected soil source zone. For corrective actions involving containment measures, compliance monitoring must address possible migration pathways (e.g., air or groundwater impacts at the POE or at AMPs) rather than the affected soil zone itself.
• Duration and Frequency: Soil confirmation sampling typically involves one or more
sampling events to confirm compliance with cleanup goals. If data evaluation indicates an exceedance of applicable concentration limits, sampling must be repeated following further cleanup activities.
• Number and Location of Soil Sampling Points: A sufficient number of soil samples
should be collected from representative locations and depths to confirm compliance with applicable cleanup goals throughout the area of affected soils. As needed, sampling should be conducted at the perimeter of the engineering control zone (in soil, air, or groundwater) to confirm compliance with applicable action levels. The number of samples will depend on the size of the source area and the observed variability of constituent concentrations. On a case-by-case basis, DERR may increase the minimum number of samples based on the size and nature of the soil removed or treated.
• Soil Analytical Methods: Soil samples should be analyzed in the laboratory for all
COCs potentially associated with the UST release. Typically, these will include BTEXN, MTBE and TPH. For a complete list of required COCs based on product type, see “Table of Analytical Methods for Sampling” in the CAP guide.
On a case-by-case basis, DERR may allow analysis for only selected constituents from this list if prior analyses have shown certain constituents to be absent or at concentrations below applicable cleanup standards in the affected soil zone. Analytical methods should conform to applicable EPA protocols and must provide method detection limits that are lower than the applicable cleanup goal or AL for each COC analyzed.
Groundwater Compliance Monitoring Specifications
Groundwater sampling and testing in the plume source area (POC) and/or down-gradient POE and AMP locations will be required to confirm the effectiveness of groundwater remedies. Figure 4-2 illustrates optional groundwater monitoring locations and applicable concentration limits.
• Duration and Frequency: The groundwater compliance monitoring program must be
sufficiently long to confirm that applicable concentration limits will not be exceeded at any future time. The program duration is determined by the DERR on a case-by-case basis. For this purpose, COC concentrations in the groundwater at the selected monitoring locations must be shown to have reached stable (maximum) levels or to be diminishing over time. The time required to reach maximum levels will be a function of the mobility of the COCs in the groundwater system (constituent seepage velocity), the distance of the compliance monitoring point from the source area, and the age of the release.

4-34
Current DERR guidelines generally require a minimum of two consecutive quarterly monitoring episodes confirming compliance with cleanup standards. However, on a case-by-case basis, the DERR may require that the minimum compliance monitoring period be extended to ensure measurement of stable plume conditions.
• Number and Location of Groundwater Sampling Points: For CAPs implemented
without a Tier 2 Risk Assessment, the entire affected groundwater area must meet applicable Tier 1 criteria or groundwater ISLs. For CAPs based on a Tier 2 Risk Assessment, the groundwater SSCL represents a source-area COC concentration that, if left in place, will be protective of water usage at down-gradient POEs. These SSCL values must be achieved at the groundwater POC, corresponding to the groundwater source area (i.e., point of plume release or current maximum concentrations; see Figure 4-2).
To confirm adequate contaminant plume corrective action at the POC, groundwater sampling points should monitor the source area of the plume. The measured concentrations should be compared to the applicable cleanup goals. These include Tier 1 criteria or ISLs if no Tier 2 Risk Assessment is conducted, or SSCL values if a Tier 2 Risk Assessment has been conducted. For sites where groundwater monitoring directly at the POC is impractical, monitoring of only down-gradient points may suffice.
AMPs must be established down-gradient of the POC, at a location that is at least one-year of plume travel time upstream of the applicable POE. AMPs are used to confirm remediation of the down-gradient portion of the plume and to provide an early warning of any potential impacts on a down-gradient receptor.
• For CAPs not based on a Tier 2 Risk Assessment, COC levels measured at the AMPs
must be less than applicable Tier 1 criteria or ISLs.
• If a Tier 2 Risk Assessment has been conducted, COC concentrations at AMPs must be shown to be less than applicable ALs established as discussed in Figure D-1 of Appendix D of this document.
The number of groundwater sampling locations should be sufficient to account for the variability of COC concentrations within the groundwater flow regime and the variability in vertical groundwater fluctuation, groundwater flow direction, hydraulic gradient, depth to groundwater, and groundwater elevation down-gradient of the source point. For evaluation of concentrations at the source area, one sampling location often is adequate to detect maximum plume concentrations. Down-gradient monitoring points should be located near the centerline of the plume because two or more monitoring locations may be required to define the plume centerline and representative COC concentrations in the plume.
• Groundwater Analytical Methods: Groundwater samples should be analyzed in the
laboratory for all COCs potentially associated with the UST release. Typically, these will include BTEXN, MTBE and TPH. For a complete list of required COCs based on product type, see “Table of Analytical Methods for Sampling” in the CAP guide.
On a case-by-case basis, the DERR may allow analysis for only selected constituents from this list if prior analyses have shown certain constituents to be absent or at concentrations below applicable cleanup standards in the affected groundwater area.

4-35
Analytical methods should conform to applicable EPA protocols and must provide method detection limits that are lower than the applicable cleanup goal or action level for each COC analyzed.
Yes: GO TO STEP 4.27 if the Owner/Operator completes the required work and the Cleanup Criteria
are satisfied. The Executive Secretary will issue a no further action letter. No: GO TO STEP4.25 if the Owner/Operator does not complete the required work and the Cleanup
Criteria are not satisfied in accordance with Step 4.25. The Executive Secretary issues the Owner/Operator correspondence identifying the required work for achieving no further action.
Step 4.27: No Further Action
If the cleanup levels have been met and the Cleanup Criteria have been satisfied, the Executive Secretary will issue a no further action letter to the Owner/Operator based on the current land use at the site. However, if future evidence indicates contamination at, or emanating from a site, further corrective action may be required.

5-1
5.0 Procedures and Format for the Tier 2 Risk Assessment Report
5.1 Introduction This section provides the procedures and format for performing and presenting a Tier 2 Risk Assessment for each of the four options available for Utah’s Tier 2 Risk Assessment process. This format is intended to provide consistency and help expedite Tier Risk Assessment reviews by the DERR. Table 5-1 shows the exposure media and transport mechanisms that must be evaluated for each complete exposure pathway and for each option. Complete the Site Conceptual Exposure Model (Worksheet #3 of Appendix B). Follow the procedures outlined in this section to calculate and derive SSCLs for each complete exposure pathway.
Table 5-1: Exposure Evaluation Chart for Residential and Commercial/Industrial Land Uses
EXPOSURE PATHWAYS AND TRANSPORT MECHANISMS
AIR EXPOSURE PATHWAY GROUNDWATER
EXPOSURE PATHWAY
SOIL
EXPOSURE PATHWAY
Exposure Medium
Vapor Intrusion to Indoor Air
Vapor Intrusion
to Outdoor Air
Vapor Inhalation &
Dust Ingestion
Groundwater Ingestion
Soil Leaching to
Groundwater (Ingestion)
Ingestion and Dermal Contact
Construction Worker a Dermal
Contact and Ingestion
Groundwater na na na na
Subsurface Soil na na na na
Surface Soil na na na a Subsurface soil excavated during construction is considered surface soil. 5.2 Tier 2 Risk Assessment Report Format for All Options Submit the final Tier 2 Risk Assessment report to the DERR in the order shown below. Complete each of the risk assessment worksheets found in Appendix B, data requirements in Appendix C, and the calculations from Appendix D. Electronic versions of all of the worksheets and forms are available on the DERR’s Internet site. All Tier 2 Risk Assessment reports must be submitted to the DERR in hard (paper) copy. Electronically transferred submittals or handwritten reports will not be accepted. If the Owner/Operator chooses to prepare the Tier 2 Risk Assessment report from the electronic forms, the length of each item can be increased or decreased, based on the amount of information presented. However, none of the items may be deleted. If a particular item does not apply, enter “Not Applicable” in the response space. Similarly, extra pages can be added if the report is prepared using the paper versions of the forms included in the appendices, and items that do not apply should be marked “Not Applicable” but must not be deleted.

5-2
Appendix B
• Worksheet #1, Risk Assessment Report. Indicate what option is used. Use Worksheet #1 to:
- Discuss site history, cause(s) of release(s), the contaminant source control
measures, and the abatement measures taken.
- Show calculated SSCLs and compare them to source concentrations. Show and discuss NAFs for Options 2 through 4.
- Describe and discuss all current and potentially complete exposure pathways, and
potential risks to receptors.
- Ensure all other requirements of the Utah’s Cleanup Rules are met.
• Worksheet #2, Data Requirements. Worksheet #2 shows the permissible values for site-specific parameters and the permissible exposure parameter values. Enter the site-specific value for each parameter shown in the spaces provided in the worksheet. Site-specific supporting raw data such as soil boring logs, analytical results are to be included in Appendix C.
• Worksheet #3, Site Conceptual Exposure Model. Follow the instructions to complete
this worksheet.
• Worksheets #4a through 4e. Complete these worksheets, as needed, if determined that the plume stability and mass balance are applicable.
- Worksheet #4a, Plume Stability Results. Discuss the results of the plume
stability and mass balance calculations.
- Worksheet #4b, Mass Calculations for Initial and Ending Dissolved Phases. Calculate contaminant mass in the dissolved plume for different sampling events over time.
- Worksheet #4c, Mass Calculations for Initial and Ending Adsorbed Phases.
Calculate contaminant mass in the adsorbed plume for different sampling events over time.
- Worksheet #4d, Determining Percent Decrease in Dissolved COC
Concentrations in Contaminant Plumes. Calculate the average reduction or increase of dissolved contaminant concentrations for different sampling events over time.
- Worksheet #4e, Statistical Evaluation of Plume Stability. Statistically
determine the reduction or increase of dissolved contaminant concentrations for different sampling events over time.

5-3
Appendix C
● Attach the specified required data in the order shown in Appendix C. Data include site maps, cross-sections, graphs, tabulated laboratory analytical data of all measured parameters, hydrographs, boring logs, soil types, and other site-specific data required for the applicable option. Applicable portions of other reports may be attached to Appendix C.
Appendix D
Calculations for SSCLs for Options 1 through 4, and SSCLs and ALs for AMPs for Options 3 and 4:
● Attach calculation results to Appendix D. For transient modeling (Options 3 and 4 only) attach input, output, graphics, and other modeling-related items to Appendix D.
5.3. Option 1 Procedures Option 1 may be appropriate when the Tier 1 criteria for soil are exceeded at a site. The Owner/Operator may perform an Option 1 risk assessment by using site-specific data to calculate Option 1 SSCLs. Performing an Option 1 Risk Assessment and calculating Option 1 SSCLs are permissible if all of the following conditions are met:
● Source has been eliminated by removal or control. ● The extent and degree of contamination are defined. ● The contaminant plume (soil and/or groundwater) is stable or diminishing. ● No off-site receptors are impacted or threatened via complete exposure pathways. ● Appendix B Worksheets #1, #2 and #3, and Appendices C and D are completed
according to their specified requirements.
PROCEDURES FOR CALCULATING OPTION 1 SSCLs Data requirements for Option 1 are shown in Worksheet #2 of Appendix B. Option 1 is a two-step process that involves the Owner/Operator calculating Option 1 SSCLs and presenting the Option 1 Risk Assessment. Step 1. Solve the exposure and cross-media transport equations in Table D-1 of Appendix D for each
complete exposure pathway (air, soil and groundwater). Determine complete exposure pathways by reviewing the SCEM in Worksheet #3. Calculate the SSCLs for individual COCs, such as BTEXN, MTBE, and other contaminants of concern if applicable. To solve the equations, use the site-specific and exposure parameter values for Option 1 shown in Worksheet #2 of Appendix B, and the chemical property and toxicity values shown in Tables D-2 through D-5 of Appendix D. Commercially available electronic spreadsheets may also be used to solve the equations.
NOTE: It is not permissible to compare the calculated SSCLs to the Permissible Exposure Limits (PELs) because PELs are intended for acute rather than chronic exposure scenarios. In addition, PELs apply to working conditions in which workers are knowingly exposed to contamination and have been OSHA-trained.
a. Solve the equations for RBSLs for the applicable on-site land use setting and for on-site
receptors only for all complete exposure pathways. The calculated Option 1 SSCLs are equal to the RBSLs because, for Option 1, only on-site receptors are present and there is therefore no NAF.
5-4
Step 2. Determine if the highest on-site contaminant concentrations exceed the calculated SSCLs. To determine if the SSCLs are exceeded, compare the maximum observed on-site contaminant concentrations of individual constituents to the calculated or final Option 1 SSCLs for all exposure pathways. The lowest contaminant concentrations that are calculated for a complete exposure pathway represent the final Option 1 SSCLs. If the Option 1 SSCLs are exceeded, go to Option 2 or submit a CAP to clean up the contamination to the calculated Option 1 SSCLs or other applicable standards.
5.4. Option 2 Procedures Option 2 may be appropriate when the Tier 1 criteria for soil and/or groundwater are exceeded. Option 2 is useful when on-site or off-site receptors are present, or if on-site receptors are some distance from the source area. The Owner/Operator may perform an Option 2 risk assessment by using site-specific data to calculate SSCLs. Performing an Option 2 Risk Assessment and calculating Option 2 SSCLs are permissible if all of the following conditions are met:
● The source has been eliminated by removal or control. ● The extent and degree of soil and groundwater contamination are defined. ● The contaminant plume is stable or diminishing. ● One year of quarterly monitoring data have been collected and adequately support
evaluation of whether the contaminant plume is stable or diminishing, and the estimation of an empirical NAF and/or contaminant half-lives, if applicable.
● Appendix B Worksheets #1, #2, #3 and #4a through #4e, and Appendices C and D are completed according to their specified requirements.
PROCEDURES FOR CALCULATING OPTION 2 SSCLs
Site-specific data requirements for Option 2 are shown in Worksheet #2 of Appendix B. Option2 is a three-step process that involves the Owner/Operator calculating Option 2 SSCLs and presenting the Option 2 Risk Assessment. Step 1. Evaluate the stability condition of the groundwater plume using Worksheets #4a through #4e. If
the groundwater plume is stable or diminishing, derive final groundwater SSCLs according to Step 2 below using an empirical NAF. If the plume is not stable or diminishing, Option 2 does not apply and the user should submit a CAP to clean up the contamination to applicable standards, or proceed to Option 3 or 4.
Step 2. Solve the exposure and cross-media transport equations in Table D-1 of Appendix D for the
applicable on-site and off-site land use settings, and for each complete exposure pathway (air, soil and groundwater). Determine complete exposure pathways by reviewing the SCEM in Worksheet #3. Calculate the SSCLs for individual COCs, such as BTEXN, MTBE, and other contaminants of concern if applicable. To solve the equations, use the site-specific and exposure parameter values for Option 2 shown in Worksheet #2 of Appendix B, and the chemical property and toxicity values shown in Tables D-2 through D-5 of Appendix D. Commercially available electronic spreadsheets may also be used to solve the equations.
NOTE: It is not permissible to compare the calculated SSCLs to the PELs because PELs are intended for acute rather than chronic exposure scenarios. In addition, PELs apply to working conditions in which workers are knowingly exposed to contamination and have been OSHA-trained.
a. For on-site receptors only, the SSCLs are equal to the RBSLs. b. For off-site receptors or receptors located some distance from the source, calculate the
NAF using Equation D.25 in Appendix D Table D-1. Multiply NAF by the calculated

5-5
RBSLs to derive final Option 2 SSCLs. Information on NAFs and their derivation is provided Section 4.2.
Step 3: Determine if the highest on-site contaminant concentrations exceed the calculated SSCLs. To
determine if the SSCLs are exceeded, compare the maximum observed on-site contaminant concentrations of individual constituents to the calculated or final Option 2 SSCLs for all exposure pathways. The lowest contaminant concentrations that are calculated for a complete exposure pathway represent the final Option 2 SSCLs. If the Option 2 SSCLs are exceeded, go to Option 3 or submit a CAP to clean up the contamination to the calculated Option 2 SSCLs.
5.5. Option 3 Procedures
Option 3 may be appropriate for cases where Option 2 SSCLs are exceeded, or at sites where contaminant plumes are not stable or expanding. The benefits of performing an Option 3 Risk Assessment may be realized if Owners/Operators cannot achieve cleanup to Option 2 SSCLs for a reasonable cost, and if there is sufficient site-specific data for deriving Option 3 SSCLs for the source area and Action Levels (ALs) for Alternate Monitoring Points (AMPs).
The Owner/Operator may perform an Option 3 Risk Assessment by using site-specific data to calculate preliminary SSCLs and performing transient modeling to derive final Option 3 SSCLs. Deriving Option 3 SSCLs and ALs is possible when the site-specific data requirements shown in Worksheet #2 (Appendix B) are met, when the transient modeling accurately reflects site conditions, and when the transient modeling indicates when SSCLs will be achieved.
Utah has modified the ASTM (1995) method for deriving Option 3 SSCLs. Utah's method excludes evaluation of the cumulative effects of contamination on receptors because of the highly conservative nature of the exposure and cross-media transport assumptions that are used in the standard equations (see Appendix D, Tables D-1, D-2 and D-3). The DERR’s decision to exclude cumulative effects is also supported by the conservative requirements of the Utah’s Cleanup Rules that all receptors be protected to applicable ISLs, the TER or other applicable standards.
Option 3 is more complex than Options 1 and 2 because it includes provisions for performing analytical transient contaminant fate and transport modeling. A minimum of two years of quarterly environmental monitoring is required to enable Owners/Operators to perform accurate and representative mass balance calculations and transient contaminant fate and transport modeling.
Performing an Option 3 Risk Assessment and deriving Option 3 SSCLs are permissible if all of the following conditions are met:
● The source has been eliminated by removal or control. ● The extent and degree of soil and groundwater contamination are defined. ● Two years of quarterly monitoring have been performed and are sufficient to define the
contaminant plume as stable, diminishing or expanding. ● Appendix B Worksheets #1, #2 #3 and #4a through #4e, and Appendices C and D are
completed according to their specified requirements. ● Transient analytical modeling is performed and produces results that are reasonable and
are able to match the actual contaminant plume configuration during the monitoring period.

5-6
PROCEDURES FOR DERIVING OPTION 3 SSCLs
Data requirements for Option 3 are identified in Worksheet #2 and must be met prior to beginning the Option 3 Risk Assessment. The Option 3 SSCLs and ALs represent contaminant concentrations that must be achieved for any complete exposure pathway. If the preliminary SSCLs are exceeded or if the plume is expanding, final SSCLs may be derived using transient analytical modeling to estimate the transport and fate of the contamination in space and time. The Owner/Operator derives Option 3 SSCLs and ALs for soil and groundwater to protect on-site and off-site receptors using the following three-step process: Step 1: Calculate preliminary Option 3 SSCLs for all complete exposure pathways according to the
SCEM in Worksheet #3 of Appendix B. Calculate the SSCLs using the RBSL equations shown in Table D-1 of Appendix D. Commercially available electronic spreadsheets may also be used to solve the exposure and transport equations and calculate preliminary SSCLs. To solve the equations, use the site-specific parameter values for Option 3 and the exposure parameter values shown in Worksheet #2 of Appendix B, and the chemical property and toxicity values shown in Tables D-2 through D-5 of Appendix D.
NOTE: It is not permissible to compare the calculated SSCLs to the PELs because PELs are intended for acute rather than chronic exposure scenarios. In addition, PELs apply to working conditions in which workers are knowingly exposed to contamination and have been OSHA-trained.
a. Calculate preliminary Option 3 SSCLs by solving the exposure and cross-media transport
equations in Table D-1 for the applicable on-site and, if applicable, off-site land use settings and receptors.
b. For off-site receptors, or receptors located some distance from the source, calculate the NAF using Equations D.22 through D.25 in Table D-1. Multiply the NAF by the calculated SSCLs to derive preliminary Option 3 SSCLs. Information on the NAF is provided in Section 4.
c. Calculate the locations for AMPs and the ALs required for the AMPs using Figure D-1 in Appendix D.
Preliminary SSCLs are used to determine appropriate SSCLs if all of the contaminant mass is available for each exposure pathway. Preliminary SSCLs are conservative because they assume that all of the contaminant mass is applied to each equation. If there is reason to believe that contamination is distributed through more than one medium and/or exposure route. Option 3 SSCLs may be derived using transient modeling to more accurately determine SSCLs that are protective of receptors to the TER.
Step 2: Determine if the contaminant concentrations exceed the calculated preliminary SSCLs for the
source area, or ALs for AMPs. This involves comparing the maximum observed contaminant concentrations of individual constituents to the calculated Option 3 SSCLs and ALs for all complete exposure pathways.
Step 3: For each exposure pathway and COC that exceeds a preliminary SSCL or AL that was calculated
from the Table D-1 equations, perform transient analytical modeling to derive final SSCLs. The final SSCLs may be more accurate for determining exposure to human health and the environment because they consider effects resulting from contaminant partitioning in space and time, and consider the potential for multiple exposure pathways and receptors. The results of the Option 3 Risk Assessment include:
● The allowable SSCLs for each exposure pathway and COC, and; ● The duration and fate of the COCs if their applicable preliminary SSCLs are exceeded.

5-7
The final SSCLs and ALs are the contaminant concentrations that are expected to be protective of POEs to the TER. The modeling must show that the SSCLs will achieve the ALs at the AMPs and TER concentrations at the POE. The DERR uses the transient models listed in Section 2 for Option 3 analyses. However, other models also are appropriate and may be used. 5.6. Option 4 Procedures Option 4 may be appropriate for cases where Option 3 SSCLs are exceeded. Refer to the introduction to Section 2 for the criteria to be used to determine if an upgrade to Option 4 is recommended. The Owner/Operator may perform an Option 4 Risk Assessment by using site-specific data to calculate SSCLs and performing transient modeling to derive final Option 4 SSCLs. Deriving Option 4 SSCLs and ALs is possible when the site-specific data requirements shown in Worksheet #2 (Appendix B) are met, when the transient modeling accurately reflects site conditions, and when the transient modeling indicates when SSCLs will be achieved. Utah has modified the ASTM (1995) method for deriving Option 4 SSCLs. Utah's method excludes evaluation of the cumulative effects of contamination on receptors because of the highly conservative nature of the exposure and cross-media transport assumptions that are used in the standard equations (see Appendix D, Tables D-1, D-2 and D-3). The DERR’s decision to exclude cumulative effects is also supported by the conservative requirements of the Utah’s Cleanup Rules that all receptors be protected to applicable ISLs, the TER or other applicable standards. Option 4 is more complex than Options 1 through 3 because it includes provisions for performing transient analytical and transient numerical contaminant fate and transport modeling. A minimum of five years of quarterly environmental monitoring is required to enable Owners/Operators to perform accurate and representative mass balance calculations and transient contaminant fate and transport modeling. Performing an Option 4 Risk Assessment and deriving SSCLs are permissible if all of the following conditions are met:
● The source has been eliminated by removal or control. ● The extent and degree of soil and groundwater contamination are defined. ● Five years of quarterly monitoring have been performed and are sufficient to the
contaminant plume as stable, diminishing or expanding. ● Appendix B (Worksheets #1, #2 #3 and #4a through #4e), and Appendices C and D are
completed according to their specified requirements. ● Transient analytical modeling is performed and produces modeling results that are
reasonable and are able to match the actual contaminant plume configuration during the monitoring period.
PROCEDURES FOR DERIVING OPTION 4 SSCLs
Data requirements for Option 4 are identified in Worksheet #2 and must be met prior to beginning the Option 4 Risk Assessment. The Option 4 SSCLs and ALs represent contaminant concentrations that must be achieved for any complete exposure pathway. If the preliminary SSCLs are exceeded or if the plume is expanding, final SSCLs may be derived using transient analytical modeling to estimate the transport and fate of the contamination in space and time. The Owner/Operator derives Option 4 SSCLs and ALs for soil and groundwater to protect on-site and off-site receptors using the following three-step process: Step 1: Calculate preliminary Option 4 SSCLs for all complete exposure pathways according to the
SCEM in Worksheet #3 of Appendix B. Calculate the SSCLs using the RBSL equations shown in Table D-1 of Appendix D. Commercially available electronic spreadsheets may also be used

5-8
to solve the exposure and transport equations and calculate preliminary SSCLs. To solve the equations, use the site-specific parameter values for Option 4, the exposure parameter values shown in Worksheet #2 of Appendix B, and the chemical property and toxicity values shown in Tables D-2 through D-5 of Appendix D.
NOTE: It is not permissible to compare the calculated SSCLs to the PELs because PELs are intended for acute rather than chronic exposure scenarios. In addition, PELs apply to working conditions in which workers are knowingly exposed to contamination and have been OSHA-trained.
a. Calculate preliminary Option 4 SSCLs by solving the exposure and cross-media transport
equations in Table D-1 for the applicable on-site and, if applicable, off-site land use settings.
b. For off-site receptors, or receptors located some distance from the source, calculate the NAF using Equations D.22 through D.25 in Table D-1. Multiply the NAF by the calculated SSCLs to derive preliminary Option 4 SSCLs. Information on NAFs and their derivation is provided in Section 4.
c. Calculate the locations for AMPs and the ALs required for the AMPs using Figure D-1 in Appendix D.
Preliminary SSCLs are used to determine appropriate SSCLs if all of the contaminant mass is available for each exposure pathway. Preliminary SSCLs are conservative because they assume that all of the contaminant mass is applied to each equation. If there is reason to believe that contamination is distributed through more than one medium and/or exposure route, Option 4 SSCLs may be derived using transient modeling to more accurately determine SSCLs that are protective of receptors to the TER.
Step 2: Determine if the contaminant concentrations exceed the calculated preliminary SSCLs for the
source area, or ALs for AMPs. This involves comparing the maximum observed contaminant concentrations of individual constituents to the calculated Option 4 SSCLs and ALs for all complete exposure pathways.
Step 3: For each exposure pathway and COC that exceeds a preliminary SSCL or AL that was calculated
from the Table D-1 equations, perform transient analytical and transient numerical modeling to derive final SSCLs. The final SSCLs may be more accurate for determining exposure to human health and the environment because they consider effects resulting from contaminant partitioning in space and time, and consider the potential for multiple exposure pathways and receptors. The results of an Option 4 Risk Assessment include:
● The allowable SSCLs for each exposure pathway and COC, and; ● The duration and fate of the COCs if their applicable preliminary SSCLs are exceeded.
The final SSCLs and ALs are the contaminant concentrations that are expected to be protective of POEs to the TER. The modeling must show that the SSCLs will achieve the ALs at the AMPs and TER concentrations at the POE. The DERR uses the transient models listed in Section 4 for Option 4 analyses. However, other models also are appropriate and may be used.

6-1
6.0 REFERENCES Air Force Center for Environmental Excellence (AFCEE), 1996, Technical Protocol for Implementing the Intrinsic Remediation with Long-Term Monitoring Option for Natural Attenuation of Dissolved-Phase Fuel Contamination in Ground Water, prepared by Weidemeier, T.H., Downey, D.C., Wilson, J.T., Kampbell, D.H., Miller, R.N., and Hansen, J.E. American Society of Testing Materials (ASTM), 1995, Standard Guide for Risk-Based Corrective Action Applied at Petroleum Release Sites, E 1739-95, December. Beljin, M.S., 1991, SOLUTE: Analytical Models for Solute Transport. International Ground Water Modeling Center, Colorado School of Mines, Golden, Colorado. Bossert, I. and Bartha, R., 1984, The Fate of Petroleum in Soil Ecosystems, in Petroleum Microbiology, editor R.M. Atlas, MacMillan Publishing Company, New York. Brady, N.C, 1974, The Nature and Properties of Soil, 8th Edition, MacMillan Publishers, Inc., New York, New York. California Leaking Underground Fuel Tank Task Force, 1989, Leaking Underground Fuel Tank (LUFT) Manual: Guidelines for Site Assessment, Cleanup, and Underground Storage Tank Closure. Connor, J.A., Newell, C.J., and Malander, M.W., 1996, Parameter Estimation Guidelines for Risk-Based Corrective Action (RBCA) Modeling, in the Proceedings of the NGWA Petroleum Hydrocarbons Conference, Houston, Texas, November, 1996. Dragun, J., 1988, The Soil Chemistry of Hazardous Materials, publisher Hazardous Materials Control Research Institute, Silver Spring, Maryland. Dunlap, L.E., and Beckmann, D.D., 1988, Soluble Hydrocarbons Analysis from Kerosene/Diesel Type Hydrocarbons, in Proceedings of the Conference on Petroleum Hydrocarbons and Organic Chemicals in Groundwater: Prevention, Detection and Restoration, Houston, Texas, November 9-11, 1988, publisher National Water Well Association. Edwards, D.A, Andriot, M.D., Amoruso, M.A., Tummey, A.C., Bevan, C.J., Tveit, A., Hayes, L.A. (Exxon Biomedical Sciences, Inc.), Youngren, S.H., and Nakles, D.V. (Remediation Technologies, Inc.), 1997, Total Petroleum Hydrocarbons Working Group (TPHCWG), Volume 6: Development of Fraction-Specific Reference Doses (RfDs) and Reference Concentrations (RfCs) for Total Petroleum Hydrocarbons (TPH). Prepared for Chevron, British Petroleum and the TPHCWG. Internet address, http://voyager.wpafb.af.mil/ Freeze, R.A. and Cherry, J.A., 1979, Groundwater, publisher Prentice-Hall, Inc., Englewood Cliffs, New Jersey. Gilbert, C.E. and Calabrese, E.J., 1990, A Critical Evaluation of Indicator Compound Methodologies for No. 2 Fuel Oil, in Petroleum-Contaminated Soils, volume 3, editors Paul T. Kostecki and Edward J. Calabrese, Lewis Publishers, Chelsea, MI. Groundwater Services, Inc. (GSI) 1995, RBCA Tier 1 and Tier 2 Spreadsheet System (for use with ASTM ES-38-94, Risk-Based Corrective Action Applied at Petroleum Release Sites). Internet address,

6-2
http://www.gsi-net.com/ Groundwater Services, Inc. (GSI), 1996, Soil-Attenuation Model (SAM) for Derivation of Risk-Based Soil Remediation Standards, Houston, Texas. Gustafson, J.B., Tell, J.G., and Orem, D., 1997, Selection of Representative TPH Fractions based on Fate and Transport Considerations, prepared for the Association of American Railroads, United States Air Force, and the Total Petroleum Hydrocarbon Criteria Working Group. Internet address, http://voyager.wpafb.af.mil/ Hess, L.Y., 1979, Processing and Disposal of Waste Petroleum Oils, publisher Noyes Data Corporation, Park Ridge, New Jersey. Jenkins, R. D., 1995, Transport and Fate Modeling at a Gasoline Fueling Facility: Tools to Demonstrate Natural Attenuation of Benzene, Utah Geological Association 1995 Symposium and Field Conference: Environmental and Engineering Geology of the Wasatch Front Region. Johnson, P.C., Kemblowski, M.W., Colthart, J.D., Byers, D.L., and Stanley, C.C., 1990, A Practical Approach to the Design, Operation, and Monitoring of In-Situ Soil Venting Systems, in Groundwater Monitoring Review, volume 10, number 2, pp. 159-178. Knox, R.C., Sabatini, D.A., and Canter, L.W., 1993, Subsurface Transport and Fate Processes, Lewis Publishers. Kostecki, P.T. and Calabrese, E.J., 1989, Petroleum-Contaminated Soil: Remediation Techniques, Environmental Fate, Risk Assessment, volume I, Lewis Publishers, Inc. Kreamer, D.K and Stetzenbach, K.J., 1990, Development of a Standard, Pure-Compound Base Gasoline Mixture for Use as Reference in Field and Laboratory Experiments, in Groundwater Monitoring Review, volume 10, number 2, pp. 135-145. Lyman, W.J., Noonan, D.C., and Reidy, P.J., 1990, Cleanup of Petroleum-Contaminated Soils at Underground Storage Tanks, publisher Noyes Data Corporation. Lyman, W.J., Reidy, P.J., Levy, B., 1992, Mobility and Degradation of Organic Contaminants in Subsurface Environments, Camp Dresser & McKee, Inc., Chi-Yuan Fan, EPA Project Officer, publishers C.K. Smoley, Inc. Newell, C.J., McLeod, R.K., and Gonzales, J.R., 1996, BIOSCREEN: Intrinsic Remediation Decision Support System, Version 1.4, Air Force Center for Environmental Excellence Technology Transfer Division, April 1996. Internet address, http://www.epa.gov/ada/models.html Nyer, E.K. and Skladany, G.J., 1989, Relating the Physical and Chemical Properties of Petroleum Hydrocarbons to Soil and Aquifer Remediation, in Groundwater Monitoring Review, Winter 1989, volume 9, number 1. Oakridge National Laboratory (ORNL), 1989, The Installation and Restoration Program Toxicology Guide, prepared and published by Biomedical Environmental Information Analysis, Health and Safety Division, Oakridge National Laboratory for Aerospace Medical Division, Air Force Systems Command, Wright-Patterson Air Force Base, OH.
6-3
Ravi, V. and Johnson, J.A., 1995, VLEACH: A One-dimensional Finite Difference Vadose Zone Leaching Model, version 2.2a, Dynamac Corporation, Center for Subsurface Modeling Support, Robert S. Kerr Environmental Research Laboratory, Ada, Oklahoma. Internet address Rifai, H.S., Bedient, P.B., Borden, R.C., and Haasbeek, J.F., 1987, BIOPLUME II: Computer Model of Two-Dimensional Contaminant Transport under the Influence of Oxygen Limited Biodegradation. National Center for Ground Water Research, Rice University, Houston, Texas. Internet address, http://www.epa.gov/ada/models.html Spitz, K. and Moreno, J., 1996, A Practical Guide to Groundwater and Solute Transport Modeling, publisher John Wiley and Sons, Inc. U.S. Environmental Protection Agency (EPA), 1988, Cleanup of Petroleum Releases from Petroleum USTs, Office of Underground Storage Tanks, Washington, D.C., EPA/530/UST-88/001, April 1988. U.S. Environmental Protection Agency (USEPA), 1989, Supplemental Risk Assessment Guidance for the Superfund Program EPA/901/5-89/001. U.S. Environmental Protection Agency (USEPA), 1995, Office of Solid Waste and Emergency Response (OSWER), Office of Underground Storage Tanks Directive 9610.17: Use of Risk-Based Decision-Making in UST Corrective Action Programs, March 1. U.S. Environmental Protection Agency (USEPA), 2005, Integrated Risk Information System (IRIS). Utah Department of Environmental Quality (UDEQ), Division of Environmental Response and Remediation (DERR), Utah Administrative Code R311- 211, Corrective Action Utah’s Cleanup Rules. Utah Department of Environmental Quality (UDEQ), Division of Environmental Response and Remediation (DERR), 2000 Memorandum of Understanding Between the Division of Water Quality and the Division of Environmental Response and Remediation Regarding Petroleum Product Releases to the Environment from Sources Other Than Leaking Underground Storage Tanks, Salt Lake City, Utah. Utah Department of Environmental Quality (UDEQ), Division of Environmental Response and Remediation (DERR), Leaking Underground Storage Tank (LUST) Program, Corrective Action Plan Guide and Risk Assessment Proposal Guide, Salt Lake City, Utah.

- A-1
APPENDIX A Development and Formulation of Screening Levels
for Petroleum-Contaminated Sites

- A-2
Development and Formulation of Screening Levels for Petroleum-Contaminated Sites
A.1 Introduction The Utah Department of Environmental Quality (UDEQ) Leaking Underground Storage Tank (LUST) Program has developed risk-based screening levels (RBSLs) for petroleum-contaminated soil and groundwater. The RBSLs were developed using the exposure equations found in American Society for Testing and Materials (ASTM) Emergency Standard E 1739-95 (ASTM, 1995). The LUST program has developed two sets of regulatory screening levels (SLs) that are useful in accelerating LUST site reviews. These include the Initial Screening Levels (ISLs) and the Tier 1 SLs. The LUST program uses an initial process to determine the presence of contamination by applying ISLs. If the ISLs are exceeded, the LUST program then uses the Tier 1 SLs because these levels are expected to be protective of on-site receptors provided that the critical distance criteria are met. The ASTM guide presents default parameter values to derive RBSLs. The LUST program chose to vary the ASTM default values to reflect representative climatologic, geologic and hydrologic characteristics of Utah's intermontane basins. The ASTM default values reflect a geographical setting different from Utah's values: one of high rainfall and infiltration, highly transmissive aquifer sediment, and high groundwater velocities. Screening levels for total petroleum hydrocarbons (TPH), total recoverable petroleum hydrocarbons (TRPH), and oil and grease are based on both RBSLs and risk-management decisions. The decisions are based on qualitative and quantitative criteria that include aesthetic impacts and fate and transport modeling of indicator chemicals in TPH. Utah-specific parameter values are compared to ASTM default values in Table A-1. Chemical-specific properties and toxicity values are shown in Table D-2. The equations for the ISLs and Tier 1 exposure pathways are based on the groundwater ingestion exposure pathway (Table D-1, equations D.2) and the soil leaching to groundwater pathway (Table D-1, equations D.5, D.17 and D.29). The following sections describe the LUST program’s development of Utah-specific values ISLs and Tier 1 SLs. A.1.1 Initial Screening Levels vs. Tier 1 Screening Criteria
The ISLs and Tier 1 SLs are shown in Table 1-3. The ISLs were developed to provide a mechanism for pre-screening sites potentially contaminated with petroleum substances. Contaminant levels at or below ISLs are considered to be protective for practically all exposure scenarios. ISLs were developed using the same exposure and risk scenarios used to develop the Tier 1 Screening levels. The difference between the two sets of standards is that the groundwater ISLs were adopted from Federal/State maximum contaminant levels (MCLs) for constituents most prevalent in petroleum products. MCL values were available for benzene, toluene, ethylbenzene and xylene. If there was not a MCL available for a particular chemical (i.e., naphthalene and MtBE) an RBSL was calculated using the Tier 1 screening methodology. The TPH screening numbers for the “Initial Screening Levels” are based on Tier 1 SLs but have been reduced by a factor of 10, with the exception of the groundwater screening level for oil and grease. The ISL for oil and grease in groundwater was not reduced due to constraints in laboratory analytical methods. Soil ISLs were developed using an exposure scenario of contamination in soil leaching to groundwater such that the contaminant would

- A-3
exceed the MCL. The formulations of the screening levels are presented in this Appendix. The “Tier 1 Screening Criteria” table (Table 1-3) presents risk-based (i.e., benzene, toluene, ethylbenzene, xylene, naphthalene and MtBE) and non-risk based (i.e., TPH) screening levels for groundwater and soil that were developed using the methodology presented in this Appendix.
A.2 Excess Risk Utah’s Cleanup Policy requires that receptors be protected to MCLs or other applicable standards. The Executive Secretary has determined that other applicable standards may include a range of target excess risks (TER) of 10-6 to 10-4 for petroleum contamination left in place. For Tier 1 screening purposes, the UDEQ has determined that contaminant levels representing a TER of 1 X 10⁻⁴ at the highest measured concentration of any contaminant will generally attenuate to a 10-6 level within 30 feet. The only compound considered in petroleum contamination that has known carcinogenic potential is benzene. Thus, the screening levels are based on conservative assumptions that are built in at the lowest level of the RBCA process. Specifically, the parameters used for risk evaluation are conservative conditions for exposure rates and duration for the most sensitive exposure scenario, residential land use settings. A.3 Chemical-Specific Properties
A.3.1 Methyl tertiary butyl ether (MTBE), Benzene, Toluene, Ethylbenzene, Xylenes, and Naphthalene (MBTEXN): Specific chemical properties and toxicity values for the constituents of concern, MBTEXN, are shown in Table D-2. Those properties and values can also be found in ASTM (1995).
A.3.2 Total Petroleum Hydrocarbons (TPH): TPH has toxic characteristics and, when released
into the environment, requires further evaluation by regulatory agencies. There are several approaches to evaluate risks associated with TPH, and generally two accepted methods can be used to derive screening levels (site-specific and non-site-specific). Because screening processes rely on minimal data to quickly evaluate LUST sites, the use of a site-specific risk-based evaluation for TPH is not cost effective or efficient. Therefore, the DERR has made a risk management decision to use a non-site-specific approach for developing ISLs and Tier 1 SLs for TPH. The TPH screening levels were derived from the methods described below.
A.3.2.1 General Nature of TPH: The behavior, fate, and transport of TPH in the
environment are uncertain and unpredictable due to the complex composition of petroleum fuels. Petroleum fuels are comprised of up to 500 chemical compounds (API, 1989) which are primarily hydrocarbons with total number of carbon atoms between 3 and 24 (C3 to C24). The majority of compounds in gasoline range from C3 to C13 (California, 1989; Nyer and Skladany, 1989; Johnson, et al., 1990; Kreamer and Stetzenbach, 1990; Lyman et. al, 1990), and between C10 and C24 for diesel fuels (Hess, 1979; Dunlap and Beckmann, 1988; California, 1989; Nyer and Skladany, 1989; ORNL, 1989). Each compound has different and sometimes uncertain properties of solubility, adsorption, vapor pressure, toxicity, and other properties.
Weathering generally removes compounds less than C8 from a gasoline mixture, which results in an accumulation of C8 and C9 compounds (Johnson, et al., 1990). Because compounds less than or equal to C9 are considered toxic (Bossert and

- A-4
Bartha, 1984), TPH as a whole contains compounds that may be individually or collectively hazardous to human and environmental health. Limited risk and toxicity data for TPH exists as a whole.
In general, residual TPH remaining from weathered fuels is comprised of low-mobility compounds with higher molecular weight (>C8), higher adsorption coefficients, and lower solubility relative to the C3 to C6 compounds (Dragun, 1988; Kostecki and Calabrese, 1989; Nyer and Skladany, 1989; Johnson, et. al., 1990). Therefore, many uncertainties exist that make determining screening levels for TPH a difficult task, requiring careful consideration and research.
A.3.2.2 TPH in Groundwater: Because of the uncertainties concerning the toxicity and
associated risk of TPH, the UDEQ/LUST evaluated different methods for determining appropriate TPH SLs. The UDEQ/LUST decision for the TPH SL of 10 mg/L is based on the following conservative assumptions: (1) The TPH as gasoline represents weathered fuel and contains 3% benzene; (2) The TPH as diesel contains an average of 1.5% alkyl aromatics (California, 1989; Nyer and Skladany, 1989; ORNL, 1989; Lyman et. al., 1990); and (3) Motor oil degrades very slowly and is enriched in C20 to C60 compounds.
Using the above assumptions, the following methods were used for determining Tier 1 SLs for TPH in groundwater.
Equation A.1. gasoline-TPH mg/L 10 = 0.03
mg/L 0.3 = % WeightSLTier
solinebenzene/ga
GW-benzene1
Equation A.2. diesel-TPH mg/L 10 = 0.01
mg/L 0.1 = % Weight
SLTier
ieselaromatic/dakyl
GW-aromaticakyl
551
The resulting TPH screening levels are considered conservative because contaminant attenuation due to biodegradation or dispersion is not factored in.
A.3.2.3 Analytical Modeling: Analytical modeling experiments were performed by UDEQ/LUST
(1995) using the groundwater modeling program SOLUTE (Beljin, 1991) to observe the extent and degree of a plume containing 10 mg/L dissolved TPH. For consistency, the conservative fate and transport conditions used in the equations for developing the Tier 1 SLs were also used in the model. The only chemical-specific parameter required by the SOLUTE model is retardation, for which a conservative adsorption coefficient of 1200 mL/g (EPA, 1988; Lyman, et. al., 1990) was used. No degradation due to contaminant decay is assumed. The model predicted that due to the relatively high adsorption and retardation of the constituents that comprise TPH, a localized plume of dissolved TPH forms and gradually dissolves and attenuates near the source. The model output data indicate that a continuous source concentration of TPH of 10 mg/L directly entering groundwater for 10 years decreases within the source area by 2 orders of magnitude.
A.3.2.4 Total Petroleum Hydrocarbons (TPH) in Soil: The soil Tier 1 SLs for TPH as
gasoline and diesel, and TRPH/Oil and Grease (1500, 5000, 10000 mg/kg, respectively) were derived using equations in Table D-1 The soil Tier 1 SL for TPH as gasoline was determined using the following two
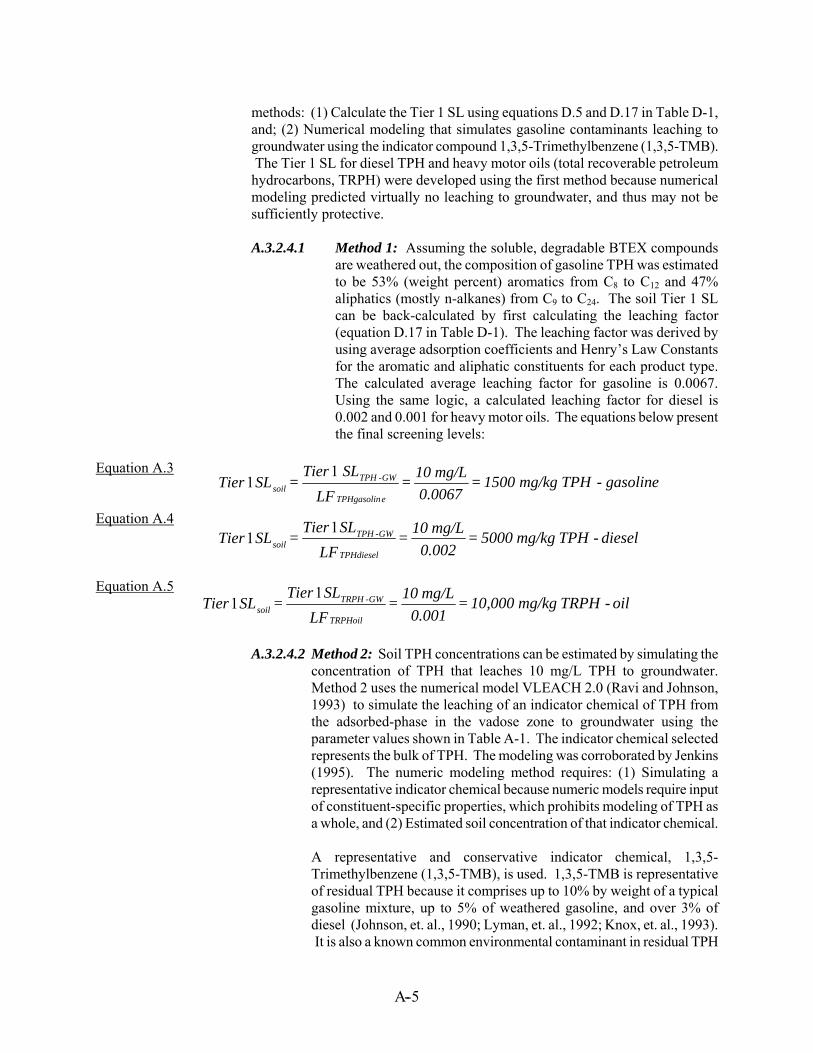
- A-5
methods: (1) Calculate the Tier 1 SL using equations D.5 and D.17 in Table D-1, and; (2) Numerical modeling that simulates gasoline contaminants leaching to groundwater using the indicator compound 1,3,5-Trimethylbenzene (1,3,5-TMB). The Tier 1 SL for diesel TPH and heavy motor oils (total recoverable petroleum hydrocarbons, TRPH) were developed using the first method because numerical modeling predicted virtually no leaching to groundwater, and thus may not be sufficiently protective.
A.3.2.4.1 Method 1: Assuming the soluble, degradable BTEX compounds
are weathered out, the composition of gasoline TPH was estimated to be 53% (weight percent) aromatics from C8 to C12 and 47% aliphatics (mostly n-alkanes) from C9 to C24. The soil Tier 1 SL can be back-calculated by first calculating the leaching factor (equation D.17 in Table D-1). The leaching factor was derived by using average adsorption coefficients and Henry’s Law Constants for the aromatic and aliphatic constituents for each product type. The calculated average leaching factor for gasoline is 0.0067. Using the same logic, a calculated leaching factor for diesel is 0.002 and 0.001 for heavy motor oils. The equations below present the final screening levels:
Equation A.3 Equation A.4 Equation A.5
A.3.2.4.2 Method 2: Soil TPH concentrations can be estimated by simulating the
concentration of TPH that leaches 10 mg/L TPH to groundwater. Method 2 uses the numerical model VLEACH 2.0 (Ravi and Johnson, 1993) to simulate the leaching of an indicator chemical of TPH from the adsorbed-phase in the vadose zone to groundwater using the parameter values shown in Table A-1. The indicator chemical selected represents the bulk of TPH. The modeling was corroborated by Jenkins (1995). The numeric modeling method requires: (1) Simulating a representative indicator chemical because numeric models require input of constituent-specific properties, which prohibits modeling of TPH as a whole, and (2) Estimated soil concentration of that indicator chemical.
A representative and conservative indicator chemical, 1,3,5-Trimethylbenzene (1,3,5-TMB), is used. 1,3,5-TMB is representative of residual TPH because it comprises up to 10% by weight of a typical gasoline mixture, up to 5% of weathered gasoline, and over 3% of diesel (Johnson, et. al., 1990; Lyman, et. al., 1992; Knox, et. al., 1993). It is also a known common environmental contaminant in residual TPH
gasoline-TPH mg/kg 1500 = 0.0067
mg/L 10 = LF
SLTier = SLTier
eTPHgasolin
GW-TPHsoil
11
diesel-TPH mg/kg 5000 = 0.002
mg/L 10 = LF
SLTier = SLTier
TPHdiesel
GW-TPHsoil
11
oil-TRPH mg/kg 10,000 = 0.001
mg/L 10 = LF
SLTier = SLTier
TRPHoil
GW-TRPHsoil
11

- A-6
based on data in UDEQ/LUST case files. 1,3,5-Trimethylbenzene is a C9 hydrocarbon (alkylbenzene) with potentially high solvent membrane toxicity (Bossert and Bartha, 1984), and high volatility and explosive potential. The suggestions found in Gilbert and Calabrese (1990) were considered when selecting 1,3,5-TMB as an indicator compound of TPH.
The objective to determine what TPH concentration in soil will leach 10 mg/L to groundwater begins with the indicator chemical. First, the most conservative value of 10% 1,3,5-TMB in gasoline is assumed and the following relationship is established:
Equation A.6 TMB-1,3,5 mg/L 1 = TPH mg/L 10 x TMB-1,3,5 10%
Equation A.6 implies that 1 mg/L 1,3,5-TMB will be present when TPH is 10 mg/L. The next step is to determine what concentration of 1,3,5-TMB in the soil will leach 1 mg/L 1,3,5-TMB so that a soil TPH concentration can be back-calculated. Several model runs were performed in which the soil concentration of 1,3,5-TMB was varied until 1 mg/L TMB leaching to groundwater was achieved (UDEQ/LUST, 1995). The model predicted that when 1,3,5-TMB is between 130 mg/kg and 170 mg/kg (average 150 mg/kg), 1 mg/L 1,3,5-TMB leaches to groundwater. A soil TPH Tier 1 SL using Method 2 is then back-calculated, as follows:
Equation A.7 TPH mg/kg 1500 = TMB/TPH-1,3,5 10%
TMB-1,3,5 mg/kg 150
The Tier 1 SL, 1500 mg/kg, is 85% lower than the concentration of TPH that is visible as residual liquid in sediment pore spaces. As discussed above, all parameters used in VLEACH are identical to those used in Table A-1. The chemical properties of 1,3,5-Trimethylbenzene are shown in Table D-2 (C9 to C10 alkyl benzenes).
A.4 Exposure Scenarios Exposure scenarios are characterized by exposure pathways, exposed populations, exposure duration, and intake assumptions. The exposure equations in Table D-1 assume that during a given exposure duration, such as 30 years, an individual of a given weight, dermal surface area, and consumptive capacity will be exposed to the concentrations calculated by the equations in Table D-1.

- A-7
A.4.1 Exposure Pathways: The exposure pathways evaluated in Utah's corrective action process used to develope the Tier 1 SLs are the groundwater ingestion for groundwater, and soil leaching to groundwater for soil.
The groundwater pathway assumes that when the Tier 1 SL is confined to the source area, the ingestion exposure pathway is not complete and receptors are not likely to be exposed to contamination. The soil-leaching-to-groundwater pathway is calculated from the Tier 1 SL in the groundwater divided by the leaching factor. This describes the potential for contamination to leach to groundwater and attain the groundwater Tier 1 SL. Tier 1 evaluations exclude other exposure pathways including: vapor inhalation caused by contamination in soil and groundwater volatilizing into enclosed spaces via foundation cracks or openings; dermal absorption, and; the construction worker scenario where dermal exposure, vapor inhalation, and particulate inhalation are the primary exposure pathways. The Tier 1 SLs calculated for the excluded pathways are not appropriate for screening purposes because the resulting SLs are either excessively high or below laboratory detection limits due to the uncertainties associated with the contaminant fate and transport for those pathways. While the UDEQ/LUST is not ignoring those pathways, past experience with over 2000 reported releases throughout the State indicate that those exposure pathways are commonly not complete. The use of SLs for those pathways would therefore not be reasonable for screening purposes. However, if the site assessment information indicates that other exposure pathways are complete and receptors are threatened, appropriate abatement response actions may be necessary and cleanup standards would be developed for those pathways.
A.4.2 Exposed Populations (Land Use): The most sensitive population setting used in Utah’s Tier
1 screening process is residential. Exposure to individuals in the residential population setting is for human adults weighing 70 kg (154 lb) with a dermal surface area of 3.2E+03 cm2 that consume 2 liters per day of potentially contaminated water over a period of 30 years at home.
A.4.3 Exposure Duration: The ASTM default exposure duration values were not changed. The
exposure duration calculations assume that adults described above ingest contaminated groundwater, in the residential setting for 30 years.
A.4.4 Exposure Intake: The ASTM default value, ingestion of 2 liters per day (Table A-1) is the
standard assumption for water ingestion in residential settings for adults. A.5 Groundwater and Soil Parameters
A.5.1 Groundwater Parameters
A.5.1.1 Groundwater Mixing Zone Thickness: This parameter can be thought of as the upper portion of the aquifer that receives the contamination leaching from a LUST via the vadose zone, plus any additional thickness attributed to a fluctuating groundwater level. The ASTM default value for this parameter of 200 cm (6.6 ft) accurately reflects Utah's groundwater fluctuation levels.

- A-8
A.5.1.2 Groundwater Infiltration Rate: This parameter is the rate at which recharge water infiltrates the subsurface and potentially mobilizes adsorbed-phase contamination. The groundwater infiltration rate should be 10-20% of a region's average annual precipitation. The ASTM default value is 30 cm/yr (12 in/yr) and is more characteristic of regions that experience 40 to 60 in/yr total precipitation. 20% of the precipitation (14 in/yr) in Utah's intermontane basins is 3 in/yr, however a conservative infiltration rate of 6 in/yr was used in the calculations to account for artificial recharge such as irrigation or sprinkling.
A.5.1.3 Groundwater Velocity: This is the most sensitive parameter in the calculations
because: (1) It can vary by orders of magnitude in short distances due to the uncertainty and variability of hydraulic conductivity, and; (2) It drives the leaching factor equation and governs the amount of mixing that contamination undergoes in the aquifer. Therefore, low groundwater velocities result in very slow mixing and increased retention time near a source. An RBSL calculated using low velocities is generally the most conservative.
The ASTM value of 82 ft/yr was changed to a conservative 35 ft/yr which is derived from average Utah-representative hydraulic conductivity of about 5 ft/day, hydraulic gradient 0.007 ft/ft, and 38% total soil porosity.
A.5.2 Soil Parameters
A.5.2.1 Capillary Zone Thickness: The ASTM value of 2 in (5 cm or 0.16 ft) was
changed to 3 ft based on data from UDEQ/LUST case files.
A.5.2.2 Vadose Zone Thickness: The ASTM value of 9.68 ft was changed to 4 ft based on data from UDEQ/LUST case files.
A.5.2.3 Depth to Groundwater: The ASTM value of 9.8 ft was changed to 7 ft based on
data from UDEQ/LUST case files.
A.5.2.4 Depth to Contaminated Soil: The ASTM value of 3.28 ft was changed to 6ft based on data from UDEQ/LUST case files.
A.5.2.5 Fraction of Organic Carbon Content (TOC): The ASTM default value for this
parameter is 1%, but a conservative Utah-specific value of 0.5% is used.

- A-9
Table A-1 Input Parameter Data for ISLs and Tier 1 SLs
ASTM Default
Values Utah-Specific
Values Parameter Definition and Units Input Units Residential Residential
A Contaminated area cm2 2.2 X 10⁶
ATc Averaging Time for carcinogen years 70
ATnc Averaging Time for non-carcinogens years 30
BW Body weight, adults kg 70
d Thickness of surficial soil cm 100
ED Exposure duration, adults years 30
EF Exposure frequency days/ year 350
foc fraction organic carbon decimal fraction 0.01 0.005
H Henry’s Law coefficient Dim.
cm3-H2O)/(cm3-air)
chemical-specific see Table D-2
hcap Thickness of capillary fringe cm 5 91
hv Thickness of vadose zone cm 300 120
I Infiltration rate of water through soil cm/yr 30 15
IRwater Ingestion rate, daily liters/day 2
IRair Inhalation rate, daily outdoor m3/day 20
Koc Adsorption coefficient mL/g chemical-specific (see Table D-2) 180
Ls Depth to contaminated soil cm 100 210
LGW Depth to groundwater cm 300

- A-10
Table A-1, continued
ASTM Default Values Utah-Specific Values
Parameter Definition and Units Input Units Residential Residential
LFs-w Leaching factor of soil to groundwater
mg/L-H2O)/ (mg/kg-soil) chemical-specific (see Table D-2)
RfDo Reference Dose, oral mg/kg-day chemical-specific see Table D-2
S Solubility (aqueous) mg/L chemical-specific see Table D-2
SFo Cancer slope factor, oral (mg/kg-day)-1 chemical-specific see Table D-2
SFi Cancer slope factor ((mg/kg-
day)-1), inhalation (mg/kg-day)-1 chemical-specific see Table D-2
THQ Target Hazard Quotient unitless 1.0 unitless
TER Target Excess Lifetime Cancer
Risk unitless 10-6 or other 10-6 at source
Udarcy Groundwater Darcy velocity cm/yr 2500 1100
W Width of contaminated source
area parallel to GW flow or wind direction
cm 1500
ρb Bulk density of soil g/cm3 1.7
Өacap Volumetric air content in
capillary fringe soils cm3-air/cm3-soil 0.038
ӨT Total soil porosity cm3/cm3-soil 0.38
Өwcap Volumetric water content in
capillary fringe soils cm3-H2O/cm3-
soil 0.342
Өws Volumetric water content in
vadose zone soils cm3-water/cm3-
soil 0.12
Өas Volumetric air content in vadose
zone soils cm3-air/cm3-soil 0.26
δgw Groundwater mixing zone thickness cm 200

B-1
APPENDIX B
Tier 2 Risk Assessment Worksheets
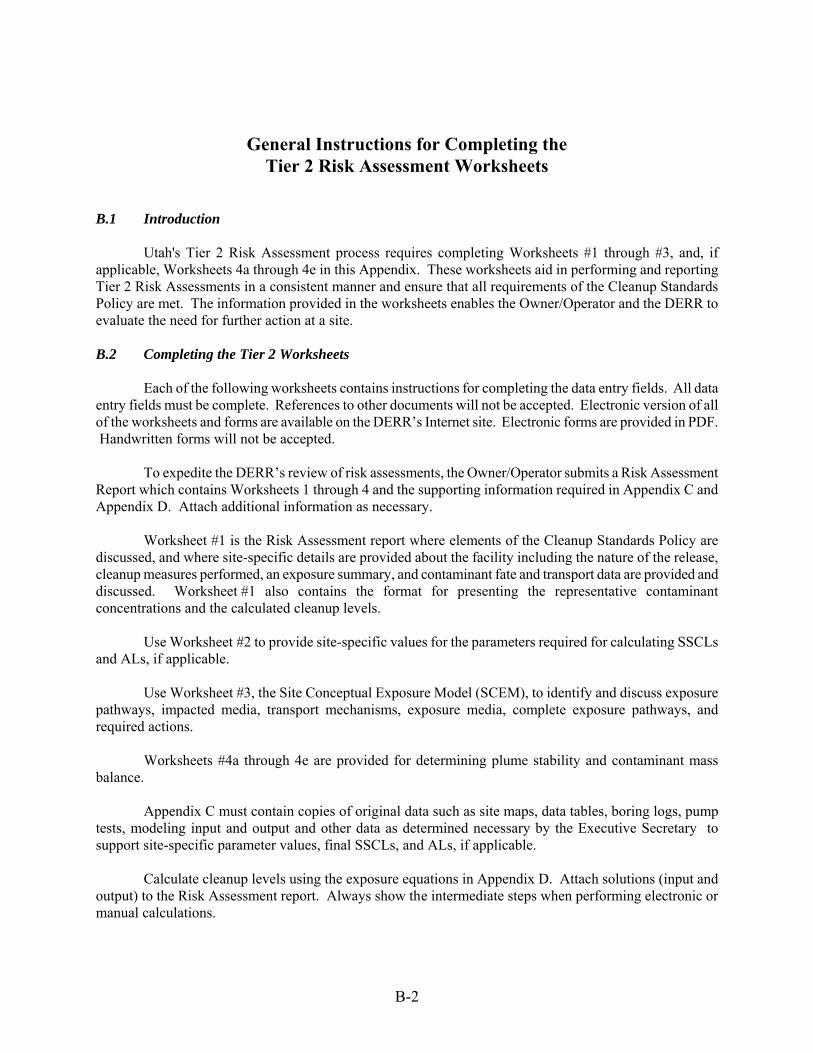
B-2
General Instructions for Completing the Tier 2 Risk Assessment Worksheets
B.1 Introduction
Utah's Tier 2 Risk Assessment process requires completing Worksheets #1 through #3, and, if applicable, Worksheets 4a through 4e in this Appendix. These worksheets aid in performing and reporting Tier 2 Risk Assessments in a consistent manner and ensure that all requirements of the Cleanup Standards Policy are met. The information provided in the worksheets enables the Owner/Operator and the DERR to evaluate the need for further action at a site. B.2 Completing the Tier 2 Worksheets
Each of the following worksheets contains instructions for completing the data entry fields. All data entry fields must be complete. References to other documents will not be accepted. Electronic version of all of the worksheets and forms are available on the DERR’s Internet site. Electronic forms are provided in PDF. Handwritten forms will not be accepted.
To expedite the DERR’s review of risk assessments, the Owner/Operator submits a Risk Assessment Report which contains Worksheets 1 through 4 and the supporting information required in Appendix C and Appendix D. Attach additional information as necessary.
Worksheet #1 is the Risk Assessment report where elements of the Cleanup Standards Policy are discussed, and where site-specific details are provided about the facility including the nature of the release, cleanup measures performed, an exposure summary, and contaminant fate and transport data are provided and discussed. Worksheet #1 also contains the format for presenting the representative contaminant concentrations and the calculated cleanup levels.
Use Worksheet #2 to provide site-specific values for the parameters required for calculating SSCLs and ALs, if applicable.
Use Worksheet #3, the Site Conceptual Exposure Model (SCEM), to identify and discuss exposure pathways, impacted media, transport mechanisms, exposure media, complete exposure pathways, and required actions.
Worksheets #4a through 4e are provided for determining plume stability and contaminant mass balance.
Appendix C must contain copies of original data such as site maps, data tables, boring logs, pump tests, modeling input and output and other data as determined necessary by the Executive Secretary to support site-specific parameter values, final SSCLs, and ALs, if applicable.
Calculate cleanup levels using the exposure equations in Appendix D. Attach solutions (input and output) to the Risk Assessment report. Always show the intermediate steps when performing electronic or manual calculations.

WORKSHEET #1 Risk Assessment Report
B-3
WORKSHEET #1 RISK ASSESSMENT REPORT
INSTRUCTIONS: 1. Enclose an Executive Summary not to exceed 2 pages in length.
2. Complete this Worksheet #1. Attach additional sheets as necessary. 3. Discuss figures, maps, cross-sections, graphs, tables, calculations, and other supporting documentation in the
Appendices as they relate to this report.
DERR Project Manager: ______________________________ Completed by: ______________________________________
Date Completed: ______________________________________
A. Facility Identification: Complete the following portion in full. Facility ID #: _________________________________________ Release ID: ____________________________________________ Facility Name: _________________________________________________________________________________________________ Facility Location and Address: ____________________________________________________________________________________ Facility Owner/Operator: _________________________________________________________________________________________
B. Person Completing the Tier 2 Risk Assessment: Print and sign your name in this portion to acknowledge that you are providing accurate information used for formulating your conclusions regarding any remaining contamination, exposure pathways and receptors. If exposure pathways are complete, receptors are likely to be at risk, and further action may therefore be necessary. The information provided herein is accurate to the best of my knowledge and best professional judgment.
______________________ _______________________________________ ___________ ___________________ Print Name and Company Sign Name Date CertifiedConsultant #
C. Facility History: Summarize each of the following: Type and number of years of facility operation; location, cause and nature of the release; type, quantity and age of the release; impacted media; contaminant source elimination and/or control measures; abatement and/or corrective action measures taken.

WORKSHEET #1 Risk Assessment Report
B-4
Facility ID #: _____________________________________________ Date Completed: __________________________________________ Facility Name & Location: __________________________________ Completed by: ____________________________________________ ________________________________________________________ DERR Project Manager: ____________________________________ D. Site Characterization and Assessment: Describe site characteristics and assessment results including the following: Methods used to characterize the site and investigate the contamination; land use (on-site and off-site); topographic features including type of ground cover; soil type; geologic and hydrologic features as they relate to the site; location and type of receptors, property lines and utility lines; and impacts to receptors.
E. Nature and Extent of Contamination: Discuss the nature, extent dimensions and behavior of contamination in all impacted media, including investigative and confirmation sampling results. Discuss measures taken to eliminate and/or control contaminant source. Discuss past and present occurrence of free product using supporting documentation such as maps, data table cross-sections, graphs, plume stability evaluations, supporting calculations, and other data.

WORKSHEET #1 Risk Assessment Report
B-5
Facility ID #: _____________________________________________ Date Completed: __________________________________________ Facility Name & Location: __________________________________ Completed by: ____________________________________________ ________________________________________________________ DERR Project Manager: ____________________________________ F. Tier 2 Options: Calculating Site-Specific Cleanup Levels (SSCLs): Mark the applicable spaces provided below, , for the option used to calculate and/or derive SSCLs, and describe why the Option was used.
OPTION 1: On-site impacts only. Are the SSCLs for applicable exposure pathways exceeded?
Yes : Cleanup is reasonable. Submit a Risk Assessment report and Corrective Action Plan in conformance with Step 4.22 of the Tier 2 Step-by-Step Procedures and Documentation.
No : Submit Risk Assessment report in conformance with Step 4.23 of the Tier 2 Step-by-Step Procedures and Documentation.
OPTION 2: On-site impacts Off-site impacts. Describe and discuss the derivation and application of attenuation mechanisms:
User-Supplied Natural Attenuation Factor Empirical Natural Attenuation Factor Electron Superposition
Are the SSCLs for applicable exposure pathways exceeded?
Yes : Cleanup is reasonable. Submit a Risk Assessment report and Corrective Action Plan in conformance with Step 4.22 of the Tier 2 Step-by-Step Procedures and Documentation.
No : Submit Risk Assessment report in conformance with Step 4.23 of the Tier 2 Step-by-Step Procedures and Documentation.
OPTION 3: On-site impacts Off-site impacts Describe and discuss the derivation and application of attenuation mechanisms:
User-Supplied Natural Attenuation Factor Empirical Natural Attenuation Factor First-Order Decay Electron Superposition Other: _____________________________
Are the SSCLs and ALs for applicable exposure pathways exceeded?
Yes : Cleanup is reasonable. Submit a Risk Assessment report and Corrective Action Plan in conformance with Step 4.22 of the Tier 2 Step-by-Step Procedures and Documentation.
No : Submit Risk Assessment report in conformance with Step 4.23 of the Tier 2 Step-by-Step Procedures and Documentation.
OPTION 4: On-site impacts Off-site impacts Describe and discuss the derivation and application of attenuation mechanisms:
User-Supplied Natural Attenuation Factor Empirical Natural Attenuation Factor First-Order Decay Electron Superposition Other: _____________________________
Are the SSCLs and ALs for applicable exposure pathways exceeded?
Yes : Cleanup is reasonable. Submit a Risk Assessment report and Corrective Action Plan in conformance with Step 4.22 of the Tier 2 Step-by-Step Procedures and Documentation.
No : Submit Risk Assessment report in conformance with Step 4.23 of the Tier 2 Step-by-Step Procedures and Documentation.
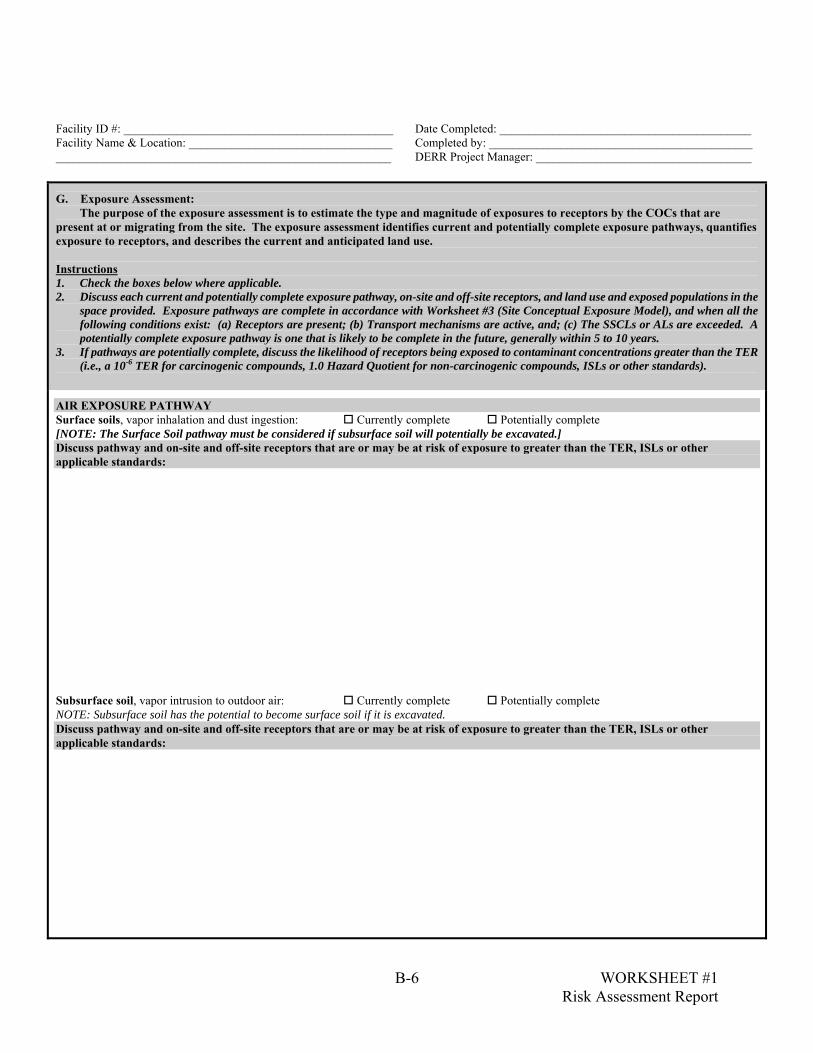
WORKSHEET #1 Risk Assessment Report
B-6
Facility ID #: _____________________________________________ Date Completed: __________________________________________ Facility Name & Location: __________________________________ Completed by: ____________________________________________ ________________________________________________________ DERR Project Manager: ____________________________________ G. Exposure Assessment:
The purpose of the exposure assessment is to estimate the type and magnitude of exposures to receptors by the COCs that are present at or migrating from the site. The exposure assessment identifies current and potentially complete exposure pathways, quantifies exposure to receptors, and describes the current and anticipated land use. Instructions 1. Check the boxes below where applicable. 2. Discuss each current and potentially complete exposure pathway, on-site and off-site receptors, and land use and exposed populations in the
space provided. Exposure pathways are complete in accordance with Worksheet #3 (Site Conceptual Exposure Model), and when all the following conditions exist: (a) Receptors are present; (b) Transport mechanisms are active, and; (c) The SSCLs or ALs are exceeded. A potentially complete exposure pathway is one that is likely to be complete in the future, generally within 5 to 10 years.
3. If pathways are potentially complete, discuss the likelihood of receptors being exposed to contaminant concentrations greater than the TER (i.e., a 10-6 TER for carcinogenic compounds, 1.0 Hazard Quotient for non-carcinogenic compounds, ISLs or other standards).
AIR EXPOSURE PATHWAY Surface soils, vapor inhalation and dust ingestion: Currently complete Potentially complete [NOTE: The Surface Soil pathway must be considered if subsurface soil will potentially be excavated.] Discuss pathway and on-site and off-site receptors that are or may be at risk of exposure to greater than the TER, ISLs or other applicable standards: Subsurface soil, vapor intrusion to outdoor air: Currently complete Potentially complete NOTE: Subsurface soil has the potential to become surface soil if it is excavated. Discuss pathway and on-site and off-site receptors that are or may be at risk of exposure to greater than the TER, ISLs or other applicable standards:

WORKSHEET #1 Risk Assessment Report
B-7
Facility ID #: _____________________________________________ Date Completed: ___________________________________ Facility Name & Location: __________________________________ Completed by: _____________________________________ ________________________________________________________ DERR Project Manager: _____________________________ G. Exposure Assessment, continued AIR EXPOSURE PATHWAY, continued Subsurface soil, vapor intrusion to indoor air: Currently complete Potentially complete Discuss pathway and on-site and off-site receptors that are or may be at risk of exposure to greater than the TER, ISLs or other applicable standards: Groundwater, vapor intrusion to outdoor air: Currently complete Potentially complete Discuss pathway and and on-site and off-site receptors that are or may be at risk of exposure to greater than the TER, ISLs or other applicable standards:

WORKSHEET #1 Risk Assessment Report
B-8
Facility ID #: _____________________________________________ Date Completed: __________________________________________ Facility Name & Location: __________________________________ Completed by: ____________________________________________ ________________________________________________________ DERR Project Manager: ____________________________________ G. Exposure Assessment, continued AIR EXPOSURE PATHWAY, continued Groundwater, vapor intrusion to indoor air: Currently complete Potentially complete Discuss pathway and on-site and off-site receptors that are or may be at risk of exposure to greater than the TER, ISLs or other applicable standards:
GROUNDWATER EXPOSURE PATHWAY Soil leaching to groundwater (for ingestion): Currently complete Potentially complete Discuss pathway and on-site and off-site receptors that are or may be at risk of exposure to greater than the TER, ISLs or other applicable standards:

WORKSHEET #1 Risk Assessment Report
B-9
Facility ID #: _____________________________________________ Date Completed: __________________________________________ Facility Name & Location: __________________________________ Completed by: ____________________________________________ ________________________________________________________ DERR Project Manager: ____________________________________ G. Exposure Assessment, continued GROUNDWATER EXPOSURE PATHWAY, continued Groundwater ingestion: Currently complete Potentially complete Discuss pathway and on-site and off-site receptors that are or may be at risk of exposure to greater than the TER, ISLs or other applicable standards:
SOIL EXPOSURE PATHWAY [NOTE: This pathway must be considered if subsurface soil will potentially be excavated.] Surface soil, dermal contact or ingestion: Currently complete Potentially complete
Construction Worker: Currently complete Potentially complete Discuss pathway and on-site and off-site receptors that are or may be at risk of exposure to greater than the TER, ISLs or other applicable standards:

WORKSHEET #1 Risk Assessment Report
B-10
Facility ID #: _____________________________________________ Date Completed: __________________________________________ Facility Name & Location: __________________________________ Completed by: ____________________________________________ ________________________________________________________ DERR Project Manager: ____________________________________ G. Exposure Assessment, continued Utility Lines: Currently impacted Potentially impacted Discuss current and potential impacts to utility lines. Describe and discuss conditions where contamination currently or potentially intersects the contamination, and make recommendations for protecting utility lines:

WORKSHEET #1 Risk Assessment Report
B-11
Facility ID #: _____________________________________________ Date Completed:____________________________________ Facility Name & Location: __________________________________ Completed by: _____________________________________ ________________________________________________________ DERR Project Manager: _____________________________ H. Contaminant Transport, Fate, Attenuation and Exposure Summary: Contaminants must attenuate to the Target Excess Risk
level (10-6 and Hazard Quotient = 1.0), ISLs or other applicable standards at all receptors.
INSTRUCTIONS FOR OPTION 3 and OPTION 4 Introduction
Transient analytical modeling is required for Option 3, and transient analytical and numerical modeling are required for Option 4. A model is a simplified version of actual field conditions that allows the knowledge of a site to be quantified. Effective and accurate
modeling requires abundant site data and possibly regional data. Models may vary in their sensitivity to certain parameters. For example, SOLUTE is sensitive to groundwater velocity, retardation factor, and half-life due to COC decay (not advection). The BIOSCREEN model is sensitive to the source term. The BIOPLUME model is a complex model that requires dissolved oxygen data, and possibly data that describe heterogenous conditions.
It is good modeling practice to perform and evaluate numerous model runs to accurately assess site conditions, and to determine the sensitivity of various parameters. Some input parameters that may be needed are identified in Worksheet #2.
Transient contaminant fate and transport computer modeling may be necessary for estimating the likelihood of a contaminant plume (adsorbed, dissolved and vapor phases) to persist in a way that threatens human or environmental health. Models can assist in determining if exposure pathways are currently and potentially complete, if site-specific cleanup levels are currently or potential exceeded for each exposure pathway, and the estimated duration of the contamination. Instructions
Complete each section provided below to convey the reasons for modeling, the results and accuracy of the modeling compared to the actual site conditions, and the modeling results as tools to indicate potential exposure to receptors. Use additional sheets as necessary. Attach input, output, and other data files and graphics to Appendix D. 1. Fate and Transport Models Used (check the applicable below and specify analytical or numerical)
a. Solute transport: Names and Governing Equations: b. Leaching from Vadose Zone: Names and Governing Equations: c. Leaching from Vadose Zone, Volatilization and Vapor Transport, Adsorbed Remaining: Names and Governing
Equations: d. Other models: Names and Governing Equations: 2. Purpose and Objectives of Modeling: Discuss the purpose and objectives for modeling as they relate to the following: (a)
Understanding the nature and extent of the contamination; (b) Evaluating currently or potentially complete exposure pathways and exposure to receptors; (c) Discuss how modeling results show the allowable SSCL values in space and time, and the time required to achieve the TER at each relevant point of exposure, and; (d) Discuss the duration, location and fate of the COCs for the complete exposure pathways if the applicable SSCLs at the POC, ALs at AMPs, or ISLs or other applicable standards at POEs are exceeded.

WORKSHEET #1 Risk Assessment Report
B-12
Facility ID #: _____________________________________________ Date Completed: __________________________________ Facility Name & Location: __________________________________ Completed by: ____________________________________ ________________________________________________________ DERR Project Manager: ____________________________ H. Contaminant Transport, Fate, Attenuation and Exposure Summary, continued 3. Discuss transient parameters used in the modeling, including time simulation periods and time steps, and their comparison to site
data: 4. Discuss the input parameters for each model used and their comparison to site data. Input parameters must accurately reflect site
conditions and correspond to Worksheet #2 and Worksheet #4, if applicable.

WORKSHEET #1 Risk Assessment Report
B-13
Facility ID #: _____________________________________________ Date Completed: __________________________________________ Facility Name & Location: __________________________________ Completed by: ____________________________________________ ________________________________________________________ DERR Project Manager: ____________________________________ H. Contaminant Transport, Fate, Attenuation and Exposure Summary, continued 5. Discuss the results of the sensitivity analysis and model calibration efforts:

WORKSHEET #1 Risk Assessment Report
B-14
Facility ID #: _____________________________________________ Date Completed: __________________________________________ Facility Name & Location: __________________________________ Completed by: ____________________________________________ ________________________________________________________ DERR Project Manager: ____________________________________ I. Public Notification:
Public notification is required prior to no further action. Public notification must reach the segment of the public (on-site and off-site) who may be directly or potentially affected by the contaminated media. NOTE: DO NOT PROCEED WITH PUBLIC NOTIFICATION UNTIL THE FORM SHOWN BELOW HAS BEEN COMPLETED, AND REVIEWED AND APPROVED BY THE EXECUTIVE SECRETARY. Instructions: Complete the Public Notification Form below and use it as the public notification. Public notification may be accomplished by personal contact or notice, notice in newspapers or distribution of flyers. 1. Name and address of the release site:
2. Provide a brief summary of the release and the site conditions:
3. Results of the Tier 2 Risk Assessment:
4. Name, agency address and telephone number of the DERR project manager:
5. Location, dates and time where the Tier 2 Risk Assessment can be viewed by the public:
6. Describe how the public will be notified:

WORKSHEET #1 Risk Assessment Report
B-15
Facility ID #: _____________________________________________ Date Completed: __________________________________________ Facility Name & Location: __________________________________ Completed by: ____________________________________________ ________________________________________________________ DERR Project Manager: ____________________________________ J. Conclusions and Recommendations: Discuss the extent and degree of contamination, plume stability, concentrations of COCs, required SSCLs and ALs, if applicable, complete exposure pathways, exposure to receptors and impact and potential impact to human health and the environmental, economic considerations and cost-effectiveness of cleanup options, technologies available for use in cleanup, and future work needed to protect receptors and POEs to the TER, ISLs or other applicable standards.
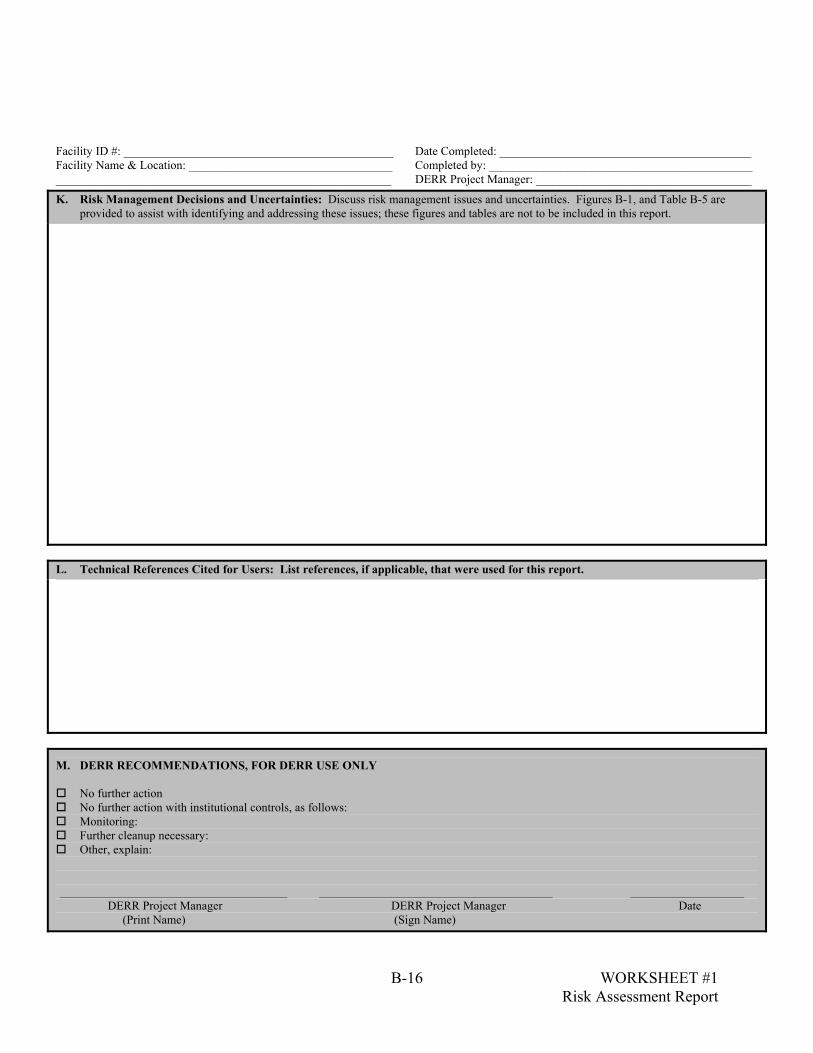
WORKSHEET #1 Risk Assessment Report
B-16
Facility ID #: _____________________________________________ Date Completed: __________________________________________ Facility Name & Location: __________________________________ Completed by: ____________________________________________ ________________________________________________________ DERR Project Manager: ____________________________________ K. Risk Management Decisions and Uncertainties: Discuss risk management issues and uncertainties. Figures B-1, and Table B-5 are
provided to assist with identifying and addressing these issues; these figures and tables are not to be included in this report.
L. Technical References Cited for Users: List references, if applicable, that were used for this report.
M. DERR RECOMMENDATIONS, FOR DERR USE ONLY
No further action No further action with institutional controls, as follows: Monitoring: Further cleanup necessary: Other, explain:
______________________________________ _______________________________________ ___________________
DERR Project Manager DERR Project Manager Date (Print Name) (Sign Name)

WORKSHEET #1 Risk Assessment Report
B-17
Table B-1: Site-Specific Cleanup Levels for Surface Soil (less than 3 feet below land surface)
INSTRUCTIONS: 1. Check this box if you are manually calculating SSCLs. You must then complete this form in full. See Appendix D, Table D-1 to manually calculate.
2. Check this box if you are electronically calculating SSCLs. You must include a completed form similar to the one shown below. 3. Complete the information requested in the spaces provided. 4. Check the boxes ( ) that apply to the site and enter actual and calculated contaminant concentrations.
Site Name: _________________________________ Site Location and Address: _____________________ _____________________________________, Utah Facility ID #: ___________ Release ID:______
Completed By (print your name): ________________________________________________________________ Company or Agency Name: ____________________________________________________________________ Date Completed:__________________________ Certified Consultant #: _____________________
Target Excess Risk (Class A & B): 10-6 required Calculation Option (check one): �OPTION 1 � OPTION 2 Target Excess Risk (Class C): 10-6 required �OPTION 3 �OPTION 4 Hazard Quotient: 1.0 required
SSCL Results For Complete Exposure Pathways (Check boxes below for the applicable condition).
CONSTITUENTS OF CONCERN
Soil Leaching to Groundwater
(groundwater for ingestion) � Currently Complete � Potentially Complete
Ingestion, Inhalation and
Dermal Contact � Currently Complete � Potentially Complete
Construction
Worker � Currently Complete � Potentially Complete
Applicable
SSCL Exceeded?
CAS No.
Constituent Name
in alphabetical order
Enter below the Representative
Source Area Concentrations
(mg/kg)
Residential
� on-site � off-site
Commercial
� on-site � off-site
MCLs or
other applicable standards
Residential:
� on-site � off-site
Commercial
� on-site � off-site
Commercial
� on-site � off-site
Applicable
SSCL (mg/kg)
(Enter the lowest SSCL
for any complete exposure pathway)
check (�) If
yes
71-43-2
Benzene
�
100-41-4
Ethylbenzene
�
1634-04-4
Methyl t-Butyl Ether
�
91-20-3
Naphthalene
�
108-88-3
Toluene
�
1330-20-7
Xylenes (mixed isomers)
�
Others (list here):
modified from © Groundwater Services, Inc. (GSI), 1995. All Rights Reserved. Version:v 1.0Software:GSI RBCA Spreadsheet

WORKSHEET #1 Risk Assessment Report
B-18
Table B-2: Site-Specific Cleanup Levels for Subsurface Soil (greater than 3 feet below land surface)
INSTRUCTIONS: 1. Check this box if you are manually calculating SSCLs. You must then complete this form in full. See Appendix D, Table D-1 to manually calculate.
2. Check this box if you are electronically calculating SSCLs. You must include a completed form similar to the one shown below. 3. Complete the information requested in the spaces provided. 4. Check the boxes ( ) that apply to the site and enter actual and calculated contaminant concentrations.
Site Name: _________________________________ Site Location and Address: ___________________ _____________________________________, Utah Facility ID #: ___________ Release ID:______
Completed By (print your name): ________________________________________________________________ Company or Agency Name: ____________________________________________________________________ Date Completed:__________________________ Certified Consultant #: _____________________
Target Excess Risk (Class A & B): 10-6 required Calculation Option (check one): � OPTION 1 � OPTION 2 Target Excess Risk (Class C): 10-6 required � OPTION 3 � OPTION 4 Hazard Quotient: 1.0 required
SSCL Results For Complete Exposure Pathways (Check boxes below for the applicable condition).
CONSTITUENTS OF CONCERN
Soil Leaching to Groundwater (groundwater for ingestion)
� Currently Complete � Potentially Complete
Soil Volatilization to
Indoor Air � Currently Complete � Potentially Complete
Soil Volatilization to
Outdoor Air � Currently Complete � Potentially Complete
Applicable
SSCL Exceeded?
CAS No. Constituent Name
in alphabetical order
Enter below the Representative
Source Area Concentrations
(mg/kg)
Residential � on-site � off-site
Commercial� on-site � off-site
MCLs or other
applicable standards
Residential: � on-site � off-site
Commercial� on-site � off-site
Commercial � on-site � off-site
Applicable
SSCL (mg/kg)
(Enter the lowest SSCL
for any complete exposure pathway)
check (�) If
yes
71-43-2
Benzene
�
100-41-4
Ethylbenzene
�
1634-04-4
Methyl t-Butyl Ether
�
91-20-3
Naphthalene
�
108-88-3
Toluene
�
1330-20-7
Xylenes (mixed isomers)
�
Others (list here):
modified from © Groundwater Services, Inc. (GSI), 1995. All Rights Reserved. Version:v 1.0Software:GSI RBCA Spreadsheet

WORKSHEET #1 Risk Assessment Report
B-19
Table B-3: Site-Specific Cleanup Levels for Groundwater
INSTRUCTIONS: 1. Check this box if you are manually calculating SSCLs or ALs. You must then complete this form in full. See Appendix D, Table D-1 to manually calculate.
2. Check this box if you are electronically calculating SSCLs or ALs. You must include a completed form similar to the one shown below. 3. Complete the information requested in the spaces provided. 4. Check the boxes ( ) that apply to the site and enter actual and calculated contaminant concentrations.
Site Name: _________________________________ Site Location and Address: ___________________ _____________________________________, Utah Facility ID #: ___________ Release ID:______
Completed By (print your name): ________________________________________________________________ Company or Agency Name: ____________________________________________________________________ Date Completed:__________________________ Certified Consultant #: _____________________ � Calculation for SSCLs � Calculation for ALs, if applicable. Locations and Names of AMPs: ______________________________________________
Target Excess Risk (Class A & B): 10-6 required Calculation Option (check one): � OPTION 1 � OPTION 2 Target Excess Risk (Class C): 10-6 required � OPTION 3 � OPTION 4 Hazard Quotient: 1.0 required
SSCL Results For Complete Exposure Pathways (Check boxes below for the applicable condition and enter SSCL in applicable locations).
CONSTITUENTS OF CONCERN
Groundwater Ingestion � Currently Complete � Potentially Complete
Groundwater Volatilization to Indoor Air
� Currently Complete � Potentially Complete
Groundwater Volatilization
to Outdoor Air � Currently Complete � Potentially Complete
Applicable SSCL
Exceeded?
CAS No. Constituent Name
in alphabetical order
Enter below the Representative
Source Area Concentrations
(mg/kg)
Residential� on-site � off-site
Commercial � on-site � off-site
MCLs or other
applicable standards
Residential: � on-site � off-site
Commercial� on-site � off-site
Commercial � on-site � off-site
Applicable SSCL
(mg/kg) (Enter the
lowest SSCL for any
complete exposure pathway)
check (�) If yes
71-43-2
Benzene
�
100-41-4
Ethylbenzene
�
1634-04-4
Methyl t-Butyl Ether
�
91-20-3
Naphthalene
�
108-88-3
Toluene
�
1330-20-7
Xylenes (mixed isomers)
�
Others (list here):
modified from © Groundwater Services, Inc. (GSI), 1995. All Rights Reserved. Version:v 1.0Software:GSI RBCA Spreadsheet

B-20
Table B-4: Example of Action Levels for Alternate Monitoring Points for the Groundwater Pathway*
Distance from Source Area to Three Alternate Monitoring Points (AMP)
and Corresponding Action Levels for Constituents
Distance to Receptor and Contaminant Concentration
Required at the Receptor (mg/L)
CAS No. Constituent SSCLs (mg/L) for the Source Area
AMP #1 10 (feet)
AMP #2 50 (feet)
AMP #3 100 (feet)
Receptor 200 (feet)
71-43-2 Benzene 4.6E-3 4.6E-3 4.6E-3 4.3E-3 2.9E-3 100-41-4 Ethylbenzene 5.8E+0 5.8E+0 5.8E+0 5.3E+0 3.7E+0
1634-04-4 Methyl t-Butyl Ether 2.9E-1 2.9E-1 2.9E-1 2.7E-1 1.8E-1 91-20-3 Naphthalene 2.3E-1 2.3E-1 2.3E-1 2.1E-1 1.5E-1 108-88-3 Toluene 1.2E+1 1.2E+1 1.2E+1 1.1E+1 7.3E+0
1330-20-7 Xylene (mixed isomers) 1.2E+2 1.2E+2 1.2E+2 1.1E+2 7.3E+1 * This table is an example only of an Option 3 or Option 4 case for a receptor located 200 feet down-gradient of a source area, and three AMPs located along plume centerline between the source area and the receptor.

B-21
WORKSHEET #2 DATA REQUIREMENTS
Instructions
Worksheet #2 identifies the data requirements for Option 1 through Option 4. Use Worksheet #2 to determine the general data requirements, the site-specific parameters that must be evaluated, and the required exposure and cross-media transport parameters that are used to calculate and/or derive Tier 2 SSCLs and ALs, if applicable, for the appropriate Option.
Non-site-specific parameter values that are required by the DERR are shown in Appendix D, Tables D-2 and D-3. These include, for example, target excess risk (TER) limit, exposure duration, ingestion rates, inhalation rates, volume of enclosed spaces, chemical property and toxicity values, and other assumptions.
Worksheet #2 must be completed in full by marking the applicable spaces provided. Copies of the raw original data used for developing the site-specific parameter values must be provided in Appendix C.

B-22
WORKSHEET # 2: Data Requirements for Option 1 through Option 4 INSTRUCTIONS: mark the boxes provided, , to ensure that each condition below is met
OPTION 1 OPTION 2 OPTION 3 OPTION 4
Extent (horizontal and vertical) and degree of soil and groundwater (if applicable) contamination must be defined. Subsurface Investigation requirements in accordance with DERR guidance. 4 sampling locations or other as
needed of impacted media to define the extent and degree of contamination and plume centerline.
6 sampling locations or other as needed of impacted media to define the extent and degree of contamination and plume centerline.
Plumes < 10,000 ft2: 7 sampling locations of impacted media, and at 5-foot vertical intervals for soil analysis and logging.
Plumes > 10,000 ft2: 7 sampling locations plus 1 location every additional 100 horizontal feet of impacted media, and samples collected at 5-foot vertical intervals for soil analysis and logging within contaminant area.
Plumes < 10,000 ft2:12 sampling locations of impacted media, and at 5-foot vertical intervals for soil analysis and logging.
Plumes > 10,000 ft2: 12 sampling locations plus 1 location every additional 100 horizontal feet of impacted media, and samples collected at 5-foot vertical intervals for soil analysis and logging within contaminant area.
Tabulated analytical data for: Gasoline: BTEXN, MTBE, TPH ; Diesel: BTEXN, TPH ; Waste Oil: BTEXN, MTBE, TRPH or Oil & Grease, Solvents; New Oil: TRPH or Oil & Grease (Utah Admin. Code R311-205(d)).
TPH fractionation a: Analyze at least 1 representative sample from the most contaminated area, of each contaminated medium, for TPH fractions using EPA methods 8260/8270.
Tabulated depth to groundwater and groundwater elevation, if applicable. Site maps showing all sample locations, on-site buildings, property lines, utility lines, road ways, and other applicable on-site and off-site receptors. Complete Appendix B Worksheets #1, #2 and #3, and Worksheet #4a through #4e if determination of plume stability and mass balance is necessary.
OPTIONAL to perform monitoring. If performed, mark the spaces provided where applicable:
Minimum 1 year of quarterly monitoring, unless otherwise directed by the DERR.
Minimum 2 years of quarterly monitoring, unless otherwise directed by the DERR.
Minimum 5 years of quarterly monitoring, unless otherwise directed by the DERR.
Monitoring Constituents and Locations: Constituents shown above (based on product type), depth to groundwater, groundwater elevation and hydraulic gradient. These help to determine
plume stability. Monitoring locations define extent, degree, and centerline of the contaminant plume.
OPTIONAL to monitor natural attenuation parameters: If performed, indicate below and circle the parameters monitored:
For groundwater monitoring, measure Dissolved Oxygen and sample Dissolved/Ferrous Iron (Fe+2), Nitrate, Sulfate, Oxidation/Reduction Potential or other (AFCEE, 1996)b in addition to BTEXN, MTBE, TPH.
Monitor natural attenuation parameters shown below: Indicate below and circle the parameters monitored:
For groundwater monitoring, measure Dissolved Oxygen and sample Dissolved/Ferrous Iron (Fe+2), Nitrate, Sulfate, Oxidation/Reduction Potential, or other (AFCEE, 1996)b in addition to BTEXN, MTBE, TPH.
Subsurface Investigation and
Monitoring Requirements
NOTE: The number of sampling and monitoring locations, the
number of years for monitoring, and the COCs to be analyzed
are recommended and subject to change as determined by the Executive Secretary. These
parameters must be capable of defining the extent and degree of
contamination, the plume centerline, if applicable, and the
nature of the contaminant plume.
OPTIONAL to perform vapor monitoring for Oxygen, Carbon Dioxide, and BTEXN, MTBE, TPH.
If applicable, perform vapor monitoring for Oxygen, Carbon Dioxide, and BTEXN, MTBE, TPH.
a See Table D-3 for details concerning TPH fractionation. b Note that the sampling efforts are valid only for those electron acceptors that show a positive correlation to contaminant plumes.

B-23
WORKSHEET # 2: Data Requirements for Option 1 through Option 4, continued INSTRUCTIONS: mark the boxes provided, , to ensure that each condition below is met
OPTION 1 OPTION 2 OPTION 3 OPTION 4
Plume Stability
Use Worksheets #4a through #4e to document
plume stability and mass balance.
PLUME MUST BE STABLE OR DIMINISHING
(Note: plume stability may not be possible without monitoring data)
Plume is: Stable Diminishing Expanding
If plume is not stable or
diminishing, go to next applicable Option, or submit Risk Assessment report and CAP.
PLUME MUST BE STABLE OR DIMINISHING
Plume is: Stable Diminishing Expanding
If plume is not stable or
diminishing, go to next applicable Option, or submit Risk Assessment report and CAP.
PLUME MAY BE STABLE, DIMINISHING OR EXPANDING
Plume is: Stable Diminishing Expanding
If plume is not stable or
diminishing, Option 4 may be required, or submit Risk Assessment report and CAP.
PLUME MAY BE STABLE, DIMINISHING OR EXPANDING
Plume is: Stable Diminishing Expanding
If plume is not stable or
diminishing, submit Risk Assessment report and CAP.
NAF Calculation Requirements
not applicable
Minimum of 3 sampling points located along the plume centerline
Minimum of 4 sampling points located along the plume centerline
Minimum of 6 sampling points located along the plume centerline
Modeling Requirements
Steady state: Solve equations shown in Appendix D Table D-1.
Steady state: Solve equations shown in Appendix D Table D-1.
Steady state: Solve equations shown in Appendix D Table D-1.
For dissolved phases, if preliminary SSCLs are exceeded, or if plume is expanding, transient analytical modeling is required to determine when SSCLs and ALs will be met.
For adsorbed phases, transient analytical or numerical.
Steady state: Solve equations shown in Appendix D Table D-1.
For dissolved phases, if preliminary SSCLs are exceeded, or if plume is expanding transient analytical and transient numerical modeling required to determine when SSCLs and ALs will be met.
For adsorbed phases, transient analytical or numerical.
Appendices
Appendix B: Worksheet #1: Risk Assessment Report Worksheet #2: Data Requirements for Options 1 through 4 Worksheet #3: Site Conceptual Exposure Model Worksheets #4a through #4e: Plume Stability Worksheets
Appendix C: Site-Specific Data Requirements and Attachments (maps, cross-sections, graphs, data tables, other) Appendix D: Calculations for Site-Specific Cleanup Levels (manual or electronic)
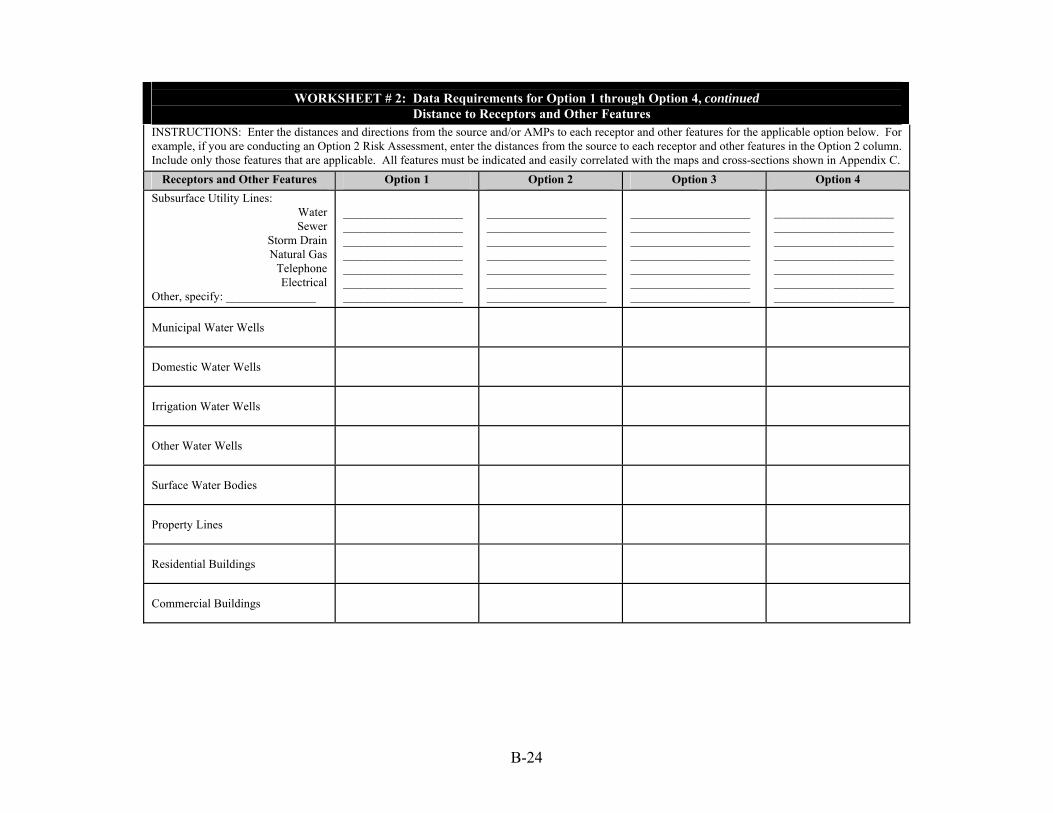
B-24
WORKSHEET # 2: Data Requirements for Option 1 through Option 4, continued Distance to Receptors and Other Features
INSTRUCTIONS: Enter the distances and directions from the source and/or AMPs to each receptor and other features for the applicable option below. For example, if you are conducting an Option 2 Risk Assessment, enter the distances from the source to each receptor and other features in the Option 2 column. Include only those features that are applicable. All features must be indicated and easily correlated with the maps and cross-sections shown in Appendix C.
Receptors and Other Features Option 1 Option 2 Option 3 Option 4 Subsurface Utility Lines:
Water Sewer
Storm Drain Natural Gas
Telephone Electrical
Other, specify: _______________
____________________ ____________________ ____________________ ____________________ ____________________ ____________________ ____________________
____________________ ____________________ ____________________ ____________________ ____________________ ____________________ ____________________
____________________ ____________________ ____________________ ____________________ ____________________ ____________________ ____________________
____________________ ____________________ ____________________ ____________________ ____________________ ____________________ ____________________
Municipal Water Wells
Domestic Water Wells
Irrigation Water Wells
Other Water Wells
Surface Water Bodies
Property Lines
Residential Buildings
Commercial Buildings

B-25
WORKSHEET # 2: Data Requirements for Option 1 through Option 4, continued Data Requirements for Site-Specific Parameters, and Exposure and Cross-Media Transport Parameters for Option 1 and Option 2
Parameter Symbol
Parameter Definition and Units
Permissible Values and Instructions Mark the spaces provided, ⌧,
where applicable
If applicable
enter values used in
unshaded cells
Data Requirements OPTION 1 OPTION 2
Mark the spaces provided or enter values, ⌧, where applicable For Field-Measured parameters, use average and representative values.
A Contaminated Soil Area (ft2)
site-specific measurement
Minimum 3 locations. Enter # locations: ___ Drilling ___ Drivinga ___ Digging
Minimum 4 locations. Enter # locations: ___ Drilling ___ Drivinga ___ Digging
ATc Averaging Time for carcinogens,
years
Residential/ Commercial/ Construc- Unknown Industrial tion
70 70 70
Values provided are not variable
ATnc Averaging Time for non-
carcinogens, years
Residential/ Commercial/ Construc- Unknown Industrial tion
30 25 1
Values provided are not variable
BCi Biodegradation Capacity
available for constituent i
unitless
Show values at right if calculated
calculated, see Table D-1, Equation D.23
Enter Electron Acceptor Concentrations Below (mg/L) Inside Plume Background Δ
BCT Biodegradation Capacity for all
electron acceptors in groundwater
unitless
Show value at near right if calculated
(to calculate, see Table D-1, Equation D.23).
Enter electron acceptor data at far right.
Dissolved Oxygen* ___________ ___________ _________ Dissolved Sulfate* ___________ ___________ _________ Dissolved Nitrate* ___________ ___________ _________ Dissolved Iron (observed within the plume)* ___________ ___________ Methane (observed within the plume)** ___________ ___________ Note: Δ = concentration inside the plume minus background concentration.
* = use Δ values of these parameters to calculate BC. ** = use inside-plume values to calculate BC.
BW Body weight, adults, kg
Residential/ Commercial/ Construc- Unknown Industrial tion
70 70 70
Values provided are not variable

B-26
WORKSHEET # 2: Data Requirements for Option 1 through Option 4, continued Data Requirements for Site-Specific Parameters, and Exposure and Cross-Media Transport Parameters for Option 1 and Option 2, continued
Parameter Symbol
Parameter Definition and Units
Permissible Values and Instructions Mark the spaces provided, ⌧,
where applicable
If applicable
enter values used in
unshaded cells
Data Requirements OPTION 1 OPTION 2
Mark the spaces provided or enter values, ⌧, where applicable For Field-Measured parameters, use average and representative values.
C(ea)n Concentration of electron acceptor n in groundwater,
mg/L
Tabulate data in Appendix C
field measured
d Thickness of surficial soil, ft
Residential/ Commercial/ Construc- Unknown Industrial tion
3.28 3.28 3.28
Values provided are not variable
Dair Diffusiion coefficient in air,
cm2/sec
chemical-and fraction-specific
see Appendix D Table D-2
Deffs Effective
diffusivity in vadose zone soils,
cm2/sec
Enter value at right if
calculated by hand
calculated
see Appendix D, Table D-1
ds Thickness of contaminated
subsurface soil (feet)
site-specific measurement
ds: _____ Depth to top: ____ Depth to base: ___
Minimum 3 locations. Enter # locations: ___ Drilling ___ Drivinga ___ Digging
Minimum 4 locations. Enter # locations: ___ Drilling ___ Drivinga ___ Digging
Deffcrack Effective
diffusivity through
foundation cracks, cm2/sec
Enter value at right if
calculated by hand
calculated
see Appendix D, Table D-1

B-27
WORKSHEET # 2: Data Requirements for Option 1 through Option 4, continued Data Requirements for Site-Specific Parameters, and Exposure and Cross-Media Transport Parameters for Option 1 and Option 2, continued
Parameter
Symbol
Parameter Definition and Units
Permissible Values and Instructions
Mark the spaces provided, ⌧, where applicable
If
applicable enter values used in
unshaded cells
Data Requirements
OPTION 1 OPTION 2 Mark the spaces provided or enter values, ⌧, where applicable For Field-Measured parameters, use average and representative values.
Deff
capf
Effective diffusivity in
capillary fringe zone cm2/sec
Enter value at right if
calculated by hand
calculated
see Appendix D, Table D-1
Deff
ws
Effective diffusivity above the water table,
cm2/sec
Enter value at right if
calculated by hand
calculated
see Appendix D, Table D-1
Dwat
Diffusiion coefficient in
water, cm2/sec
chemical-and fraction-specific
see Appendix D Table D-2
ED
Exposure duration, adults
years
Residential/ Commercial/ Construc- Unknown Industrial tion
30 25 1
Values shown are not variable
EF
Exposure frequency, adults
days/year
Residential/ Commercial/ Construc- Unknown Industrial tion
350 250 250
Values shown are not variable
ER
Enclosed space air exchange rate
1/sec = sec-1
Residential/ Commercial/ Construc- Unknown Industrial tion 0.00014 sec-1 0.00023 sec-1 -
Values shown are not variable

B-28
WORKSHEET # 2: Data Requirements for Option 1 through Option 4, continued Data Requirements for Site-Specific Parameters, and Exposure and Cross-Media Transport Parameters for Option 1 and Option 2, continued
Parameter
Symbol
Parameter Definition and Units
Permissible Values and Instructions
Mark the spaces provided, ⌧, where applicable
If
applicable enter values used in
unshaded cells
Data Requirements
OPTION 1 OPTION 2 Mark the spaces provided or enter values, ⌧, where applicable For Field-Measured parameters, use average and representative values.
foc,
saturated
Fraction of
organic carbon content, saturated
zone 3
Clay 0.28%
Silty clay 0.25%
Silt 0.25%
Clayey silt 0.25%
Silty sand 0.05%
Clayey sand (fine sand) 0.05%
Clean sand (medium sand) 0.05%
Gravel (coarse sand) 0.05%
To determine soil type, collect a minimum of 3 soil samples from same horizon as contaminated soils but from uncontaminated areas (use average values). Enter the # of locations: ___ Drilling ___ Drivinga ___ Digging
Value selected from permissible values.
Field-Measured.
To determine soil type, collect a minimum of 4 soil samples from same horizon as contaminated soils but from uncontaminated areas (use average values). Enter the # of locations: ___ Drilling ___ Drivinga ___ Digging
Value selected from permissible values.
Field-Measured.
foc,
unsaturated
Fraction of
organic carbon content,
unsaturated zone1, 9
Clay 0.55%
Silty clay 0.50%
Silt 0.50%
Clayey silt 0.50%
Silty sand 0.10%
Clayey sand (fine sand) 0.10%
Clean sand (medium sand) 0.10%
Gravel (coarse sand) 0.10%
To determine soil type, collect a minimum of 3 soil samples from same horizon as contaminated soils but from uncontaminated areas (use average values). Enter the # of locations: ___ Drilling ___ Drivinga ___ Digging
Value selected from permissible values.
Field-Measured.
To determine soil type, collect a minimum of 4 soil samples from same horizon as contaminated soils but from uncontaminated areas (use average values): Enter the # of locations: ___ Drilling ___ Drivinga ___ Digging
Value selected from permissible values.
Field-Measured.

B-29
WORKSHEET # 2: Data Requirements for Option 1 through Option 4, continued Data Requirements for Site-Specific Parameters, and Exposure and Cross-Media Transport Parameters for Option 1 and Option 2, continued
Parameter
Symbol
Parameter Definition and Units
Permissible Values and Instructions
Mark the spaces provided, ⌧, where applicable
If
applicable enter values used in
unshaded cells
Data Requirements
OPTION 1 OPTION 2 Mark the spaces provided or enter values, ⌧, where applicable For Field-Measured parameters, use average and representative values.
H
Henry’s Law
Constant (dimensionless,
L-H20/L-air)
chemical-and fraction-specific
see Appendix D Table D-2
Values are not variable
hcapf
Thickness of capillary fringe
(feet)1, 2 LGW - hv = hcapf
Saturated Capillary Fringe
Medium Thickness (feet) Clay 5
Silty clay 4
Silt 3
Clayey silt 4
Silty sand 2
Clayey sand (fine sand) 1.5 Clean sand (medium sand) 0.8 Gravel (coarse sand) 0.25
To determine soil type, collect a minimum of 3 soil samples from top of saturated zone (use average values). Enter the # of locations: ___ Drilling ___ Drivinga ___ Digging Field measurements are not permissible.
To determine soil type, collect a minimum of 4 soil samples from top of saturated zone (use average values). Enter the # of locations: ___ Drilling ___ Drivinga ___ Digging Field measurements are not permissible.
hv
Thickness of vadose zone
(feet)
site-specific measurement
Minimum 3 locations. Enter the # of locations: ___ Drilling ___ Drivinga ___ Digging
Minimum 4 locations. Enter the # of locations: ___ Drilling ___ Drivinga ___ Digging

B-30
WORKSHEET # 2: Data Requirements for Option 1 through Option 4, continued Data Requirements for Site-Specific Parameters, and Exposure and Cross-Media Transport Parameters for Option 1 and Option 2, continued
Parameter
Symbol
Parameter Definition and Units
Permissible Values and Instructions
Mark the spaces provided, ⌧, where applicable
If
applicable enter values used in
unshaded cells
Data Requirements
OPTION 1 OPTION 2 Mark the spaces provided or enter values, ⌧, where applicable For Field-Measured parameters, use average and representative values.
I
Infiltration rate
(feet/year)7
Clayey soils, unpaved site:
I = (5%) X Annual Precipitation
Sandy soils, unpaved site: I = (10%) X Annual Precipitation
Paved site: I = (0.55%) X Annual Precipitation
Enter annual precip. in inches/year here: ________ Enter I here: _____
To determine soil or ground cover type, collect a minimum of 5 samples. It is permissible to use the formulas shown in column 3 provided there are no leaky utility lines or other sources of artificial recharge.
To determine soil or ground cover type, collect a minimum of 5 samples. It is permissible to use the formulas shown in column 3 provided there are no leaky utility lines or other sources of artificial recharge.
i
Hydraulic gradient
(ft/ft)
Site-specific measurement.
Value ____ Range____ _________
If applicable, minimum of 1 round monitoring using 3 measurement points. ____ # Locations and rounds measured for i
Minimum of 1 year quarterly monitoring using a minimum of 3 measurement points. ____ # Locations and rounds measured for i
IRair-ind
Inhalation rate, daily indoor,
m3/day
Residential/ Commercial/ Construc- Unknown Industrial tion
20 20 -
Values are not variable
IRair-out
Inhalation rate, daily outdoor,
m3/day
Residential/ Commercial/ Construc- Unknown Industrial tion
20 20 10
Values are not variable
IRsoil
Ingestion rate of
soil, mg/day
Residential/ Commercial/ Construc- Unknown Industrial tion
114 50 100
Values are not variable
IRwater
Ingestion rate, daily, liters/
day
Residential/ Commercial/ Construc- Unknown Industrial tion
2 1 -
Values are not variable

B-31
WORKSHEET # 2: Data Requirements for Option 1 through Option 4, continued Data Requirements for Site-Specific Parameters, and Exposure and Cross-Media Transport Parameters for Option 1 and Option 2, continued
Parameter
Symbol
Parameter Definition and Units
Permissible Values and Instructions
Mark the spaces provided, ⌧, where applicable
If
applicable enter values used in
unshaded cells
Data Requirements
OPTION 1 OPTION 2 Mark the spaces provided or enter values, ⌧, where applicable For Field-Measured parameters, use average and representative values.
K
Hydraulic
conductivity (feet/day)4, 5
Clay 0.00283
Silty clay 0.07
Silt 1.42
Clayey silt 0.0283
Silty sand 2.83
Clayey sand (fine sand) 0.0283
Clean sand (medium sand) 28.3
Gravel (coarse sand) 283
If measured, enter range of values: ___________________________ Enter average value: ____ _________
Value selected from permissible values.
Sediment samples & stratigraphic profiles must be collected from a minimum of 3 locations within the upper 3 feet of the saturated zone.
Slug tests performed at 2 locations (for shallow aquifers only. Use average and/or representative values). ____ # Locations measured for each above, and
identity of the locations.
Value selected from permissible values.
Sediment samples & stratigraphic profiles must be collected from a minimum of 4 locations within the upper 3 feet of the saturated zone.
Slug tests performed at 2 locations (for shallow aquifers only. Use average and/or representative values). ____ # Locations measured for each above, and
identity of the locations. Kd or ks
Distribution coefficient, mL/g, L/kg
Show value for each constituent at
right if calculating by hand
calculated: Kd = Koc X foc
Koc
Adsorption coefficient, mL/g, L/kg
chemical-and fraction-specific
see Appendix D Table D-2
Values are not variable

B-32
WORKSHEET # 2: Data Requirements for Option 1 through Option 4, continued Data Requirements for Site-Specific Parameters, and Exposure and Cross-Media Transport Parameters for Option 1 and Option 2, continued
Parameter
Symbol
Parameter Definition and Units
Permissible Values and Instructions
Mark the spaces provided, ⌧, where applicable
If
applicable enter values used in
unshaded cells
Data Requirements
OPTION 1 OPTION 2 Mark the spaces provided or enter values, ⌧, where applicable For Field-Measured parameters, use average and representative values.
LB
Enclosed space
volume/ infiltration area
ratio, cm
Residential/ Commercial/ Construc- Unknown Industrial tion
200 300 -
Values are not variable
Lcrack
Foundation or wall thickness,
cm
Residential/ Commercial/ Construc- Unknown Industrial tion
15 15 -
Values are not variable
LGW
Depth to
groundwater, ft hv + hcapf =LGW
site-specific measurement
Minimum 3 locations for each monitoring round. Enter the # of locations: ___ Drilling ___ Drivinga ___ Digging
Minimum 4 locations for each monitoring round. Enter the # of locations: ___ Drilling ___ Drivinga ___ Digging
LP
Length of
Groundwater Contaminant Plume (feet)
site-specific measurement
Minimum 3 locations. Enter the # of locations: ___ Drilling ___ Drivinga ___ Digging
Minimum 4 locations. Enter the # of locations: ___ Drilling ___ Drivinga ___ Digging
Ls
Depth to
contaminated soil, ft
site-specific measurement
Top: ____ Base:____
Minimum 3 locations. Enter the # of locations: ___ Drilling ___ Drivinga ___ Digging
Minimum 4 locations. Enter the # of locations: ___ Drilling ___ Drivinga ___ Digging
M
Soil to skin
adherence factor, mg/cm2
Residential/ Commercial/ Construc- Unknown Industrial tion
0.5 0.5 0.5
Values are not variable
Pe
Particulate
emission rate, g/cm2-sec
6.9 X 10⁻¹⁴
Value shown is not variable

B-33
WORKSHEET # 2: Data Requirements for Option 1 through Option 4, continued Data Requirements for Site-Specific Parameters, and Exposure and Cross-Media Transport Parameters for Option 1 and Option 2, continued
Parameter
Symbol
Parameter Definition and Units
Permissible Values and Instructions
Mark the spaces provided, ⌧, where applicable
If
applicable enter values used in
unshaded cells
Data Requirements
OPTION 1 OPTION 2 Mark the spaces provided or enter values, ⌧, where applicable For Field-Measured parameters, use average and representative values.
R
Retardation
Factor, unitless
If calculated by hand, show values at right
calculated, see Appendix D, Table D-1, Equation D.27
RAFd
Relative
absorption factor, dermal,
(volatiles/ PAHs)
Residential/ Commercial/ Construc- Unknown Industrial tion 0.5/0.05 0.5/0.05 0.5/0.05
Values are not variable
RAFo
Relative
absorption factor, oral, unitless
Residential/ Commercial/ Construc- Unknown Industrial tion 1.0 1.0 1.0
Values are not variable
RBSLi
Risk-based screening level for media “i” (mg/kg-soil;
mg/L-water; or ug/m3)
chemical-, media-, and exposure route-specific
RfDi
Reference Dose,
inhalation, mg/kg-day
chemical-and fraction-specific;
see Appendix D, Table D-2
Values are not variable
RfDo
Reference Dose, oral, mg/kg-day
chemical-and fraction-specific;
see Appendix D, Table D-2
Values are not variable
SA
Skin surface area
cm2
Residential/ Commercial/ Construc- Unknown Industrial tion 5800 5800 5800
Values are not variable
SFi
Cancer slope
factor , inhalation (mg/kg-day)-1
chemical-specific;
see Appendix D, Table D-2
Values are not variable

B-34
WORKSHEET # 2: Data Requirements for Option 1 through Option 4, continued Data Requirements for Site-Specific Parameters, and Exposure and Cross-Media Transport Parameters for Option 1 and Option 2, continued
Parameter
Symbol
Parameter Definition and Units
Permissible Values and Instructions
Mark the spaces provided, ⌧, where applicable
If
applicable enter values used in
unshaded cells
Data Requirements
OPTION 1 OPTION 2 Mark the spaces provided or enter values, ⌧, where applicable For Field-Measured parameters, use average and representative values.
SFo
Cancer slope factor, oral
(mg/kg-day)-1
chemical-specific;
see Appendix D, Table D-2
Values are not variable
TER
Target Excess
Lifetime Cancer Risk, unitless
Residential/ Commercial/ Construc- Unknown Industrial tion
10-6 10-6 10-6
Values are not variable
THQ
Target Hazard
Quotient, unitless
Residential/ Commercial/ Construc- Unknown Industrial tion 1.0 1.0 1.0
Values are not variable
Uair
Wind speed
above ground surface in
ambient mixing zone (cm/sec)
225
Value shown is not variable
Udarcy
Groundwater
Darcy velocity (feet/day)
site-specific measurement = Ki
Calculated only if criteria for i & K are met.
Calculated only if criteria for i & K are met.

B-35
WORKSHEET # 2: Data Requirements for Option 1 through Option 4, continued Data Requirements for Site-Specific Parameters, and Exposure and Cross-Media Transport Parameters for Option 1 and Option 2, continued
Parameter
Symbol
Parameter Definition and Units
Permissible Values and Instructions
Mark the spaces provided, ⌧, where applicable
If
applicable enter values used in
unshaded cells
Data Requirements
OPTION 1 OPTION 2 Mark the spaces provided or enter values, ⌧, where applicable For Field-Measured parameters, use average and representative values.
UFn
Utilization Factor
for electron acceptor n (i.e.,
mass ratio of electron acceptor to hydrocarbon
consumed in biodegradation
reactions; unitless).
Values shown at far right are for BTEX only and are not variable.
Check cell at right if UFs are used.
Oxygen 3.14
Nitrate 4.90
Sulfate 4.6
Ferrous Iron 21.8
Methane 0.78
Utran
Groundwater
Transport Velocity (feet/day)
site-specific measurement = Ki/θeff
Calculated only if criteria for i & K are met.
Calculated only if criteria for i &K are met.
VFsamb
Volatilization
factor of subsurface soils to ambient air
(mg/m3-air)/(mg/kg-soil
Enter values at right
calculated see Appendix D, Table D-1

B-36
WORKSHEET # 2: Data Requirements for Option 1 through Option 4, continued Data Requirements for Site-Specific Parameters, and Exposure and Cross-Media Transport Parameters for Option 1 and Option 2, continued
Parameter
Symbol
Parameter Definition and Units
Permissible Values and Instructions
Mark the spaces provided, ⌧, where applicable
If
applicable enter values used in
unshaded cells
Data Requirements
OPTION 1 OPTION 2 Mark the spaces provided or enter values, ⌧, where applicable For Field-Measured parameters, use average and representative values.
VFsesp
Volatilization
factor of subsurface soils
to enclosed space (indoor air)
(mg/m3-air)/(mg/kg-soil)
Enter values at right
calculated see Appendix D, Table D-1
VFss
Volatilization
factor of surficial soil to outdoor (ambient) air as
vapors (mg/m3-
air)/(mg/kg-soil)
Enter values at right if measured
calculated see Appendix D, Table D-1
VFwamb
Volatilization
factor of groundwater to
ambient air (mg/m3-
air)/(mg/L-water)
Enter values at right if measured
calculated see Appendix D, TableD-1
VFwesp
Volatilization
factor of groundwater to enclosed space
(indoor air) (mg/m3-
air)/(mg/L-water)
Enter values at right if measured
calculated see Appendix D, Table D-1

B-37
WORKSHEET # 2: Data Requirements for Option 1 through Option 4, continued Data Requirements for Site-Specific Parameters, and Exposure and Cross-Media Transport Parameters for Option 1 and Option 2, continued
Parameter
Symbol
Parameter Definition and Units
Permissible Values and Instructions
Mark the spaces provided, ⌧, where applicable
If
applicable enter values used in
unshaded cells
Data Requirements
OPTION 1 OPTION 2 Mark the spaces provided or enter values, ⌧, where applicable For Field-Measured parameters, use average and representative values.
W
Width (feet) contaminated source areas
parallel to GW flow or wind direction, ft
site-specific measurement
Any site-specific value permissible. Any site-specific value permissible.
α
Dispersivity in Groundwater:
(feet) αx Longitudinal αy Transverse αz Vertical
Calculated. Enter Values in Unshaded Cell
at Far Right
α x __________________________ feet α y __________________________ feet α z __________________________ feet
α x __________________________ feet α y __________________________ feet α z __________________________ feet
δair
Ambient air mixing zone height, cm
200
Values are not variable
δgw
Groundwater mixing zone thickness, cm
200
Values are not variable unless field-measured
η
Areal fraction of
cracks in foundations/walls cm2-cracks/cm2-
total area
0.01
Values are not variable

B-38
WORKSHEET # 2: Data Requirements for Option 1 through Option 4, continued Data Requirements for Site-Specific Parameters, and Exposure and Cross-Media Transport Parameters for Option 1 and Option 2, continued
Parameter
Symbol
Parameter Definition and Units
Permissible Values and Instructions
Mark the spaces provided, ⌧, where applicable
If
applicable enter values used in
unshaded cells
Data Requirements
OPTION 1 OPTION 2 Mark the spaces provided or enter values, ⌧, where applicable For Field-Measured parameters, use average and representative values.
ρs
Bulk density of
soil, g/cm3
1.7
Values are not variable
τ
Averaging time for vapor flux,
sec
Residential/ Commercial/ Construc- Unknown Industrial tion 9.46 X 10⁸ 7.88 X 10⁸ 3.15 X 10⁷
Values are not variable
θacapf
Volumetric air
content, capillary fringe soils1,7,8
percent
θacapf = θT - θwcapf
calculate
calculate
θacrack
Volumetric air
content, foundation crack,8
percent
same as θas
same as θas
same as θas
θas
Volumetric air content, vadose soils1,7,8 percent
θas = θT - θws
calculate
calculate

B-39
WORKSHEET # 2: Data Requirements for Option 1 through Option 4, continued Data Requirements for Site-Specific Parameters, and Exposure and Cross-Media Transport Parameters for Option 1 and Option 2, continued
Parameter
Symbol
Parameter Definition and Units
Permissible Values and Instructions
Mark the spaces provided, ⌧, where applicable
If
applicable enter values used in
unshaded cells
Data Requirements
OPTION 1 OPTION 2 Mark the spaces provided or enter values, ⌧, where applicable For Field-Measured parameters, use average and representative values.
θeff
Porosity, effective
(use for lateral transport
groundwater models; for
saturated zone only)1,7,8 percent
Clay 0.10%
Silty clay 0.15%
Silt 0.15%
Clayey silt 0.15%
Silty sand 0.20%
Clayey sand (fine sand) 0.20%
Clean sand (medium sand) 0.23%
Gravel (coarse sand) 0.26%
To determine soil type, analyze a minimum of 3 soil samples from same horizon as contaminated soils (use average values). Enter the # of locations: ___ Drilling ___ Drivinga ___ Digging
Value selected from permissible values.
Field-Measured.
To determine soil type, analyze a minimum of 4 soil samples from same horizon as contaminated soils (use average values). Enter the # of locations: ___ Drilling ___ Drivinga ___ Digging
Value selected from permissible values.
Field-Measured.
θT
Porosity, total
(use for volatilization
models)4, percent
Clay 38%
Silty clay 36%
Silt 46%
Clayey silt 36%
Silty sand 41%
Clayey sand (fine sand) 38%
Clean sand (medium sand) 41%
Gravel (coarse sand) 30%
To determine soil type or to field-measure parameter, analyze a minimum of 3 soil samples from same horizon as contaminated soils (use average values). Enter the # of locations: ___ Drilling ___ Drivinga ___ Digging
Value selected from permissible values.
Field-Measured.
To determine soil type or to field-measure parameter, analyze a minimum of 3 soil samples from same horizon as contaminated soils (use average values). Enter the # of locations: ___ Drilling ___ Drivinga ___ Digging
Value selected from permissible values.
Field-Measured.

B-40
WORKSHEET # 2: Data Requirements for Option 1 through Option 4, continued Data Requirements for Site-Specific Parameters, and Exposure and Cross-Media Transport Parameters for Option 1 and Option 2, continued
Parameter
Symbol
Parameter Definition and Units
Permissible Values and Instructions
Mark the spaces provided, ⌧, where applicable
If
applicable enter values used in
unshaded cells
Data Requirements
OPTION 1 OPTION 2 Mark the spaces provided or enter values, ⌧, where applicable For Field-Measured parameters, use average and representative values.
θwcapf
Volumetric water content, capillary
fringe soils7,8 percent
θwcapf = θT- θacapf
Clay 37.980%
Silty clay 35.986%
Silt 45.970%
Clayey silt 35.986%
Silty sand 40.965%
Clayey sand (fine sand) 37.978%
Clean sand (medium sand)40.965%
Gravel (coarse sand) 29.980%
To determine soil type of field-measured parameter, analyze minimum of 3 soil samples from same horizon as contaminated soils . Enter the # of locations: ___ Drilling ___ Drivinga ___ Digging
Value selected from permissible values.
Field-Measured.
To determine soil type or field-measured parameter, a, analyze minimum of 4 soil samples from same horizon as contaminated soils . Enter the # of locations: ___ Drilling ___ Drivinga ___ Digging
Value selected from permissible values.
Field-Measured.
θwcrack
Volumetric water
content, foundation crack,8
percent
same as θws
same as θws
same as θws

B-41
WORKSHEET # 2: Data Requirements for Option 1 through Option 4, continued Data Requirements for Site-Specific Parameters, and Exposure and Cross-Media Transport Parameters for Option 1 and Option 2, continued
Parameter
Symbol
Parameter Definition and Units
Permissible Values and
Instructions Mark the spaces provided, ⌧,
where applicable
If applicable enter values
used in unshaded
cells
Data Requirements
OPTION 1 OPTION 2 Mark the spaces provided or enter values, ⌧, where applicable For Field-Measured parameters, use average and representative values.
θws
Volumetric water content, vadose
soils1,7,8
θws θws
Soil DTGW* DTGW* Type 0 - 20 ft >20 ft
Clay 30% 15%
Silty clay 25% 12%
Silt 20% 8%
Clayey silt 25% 12%
Silty sand 10% 5%
Clayey sand (fine sand) 23% 10% Clean sand (medium sand) 7% 3% Gravel (coarse sand) 7% 3%
To determine soil type or filed-measured parameter, analyze minimum of 3 soil samples from same horizon as contaminated soils: ____ Drilling ___ Drivinga ___ Digging
Value selected from permissible values.
Field-Measured.
To determine soil type or filed-measured parameter, analyze minimum of 4 soil samples from same horizon as contaminated soils: ____ Drilling ____ Drivinga ____ Digging
Value selected from permissible values.
Field-Measured.

B-42
WORKSHEET # 2: Data Requirements for Option 1 through Option 4, continued Data Requirements for Site-Specific Parameters, and Exposure and Cross-Media Transport Parameters for Option 3 and Option 4
Parameter
Symbol
Parameter Definition and Units
Permissible Values and
Instructions Mark the spaces provided, ⌧,
where applicable
If applicable enter values
used in unshaded
cells
Data Requirements
OPTION 3 OPTION 4 Mark the spaces provided or enter values, ⌧, where applicable For Field-Measured parameters, use average and representative values.
A
Contaminated Soil Area (ft2)
site-specific measurement
Minimum 5 locations. Enter the # of locations: ___ Drilling ___ Drivinga ___ Digging
Minimum 5 locations. Enter the # of locations: ___ Drilling ___ Drivinga ___ Digging
ATc
Averaging Time for
carcinogens, years
Residential/ Commercial/ Construc- Unknown Industrial tion
70 70 70
Values provided are not variable
ATnc
Averaging
Time for non-carcinogens,
years
Residential/ Commercial/ Construc- Unknown Industrial tion
30 25 1
Values provided are not variable
BCi
Biodegradatio
n Capacity available for constituent i
unitless
Show values at right if calculated
calculated, see Appendix D, Table D-1, Equation D.23
BCT
Biodegradation Capacity for
all electron acceptors in groundwater
unitless
Show value at near right if calculated
(to calculate, see Table D-1, Equation D.23).
Enter electron acceptor data at far right.
Enter Electron Acceptor Concentrations Below (mg/L)
Inside Plume Background Δ Dissolved Oxygen* _________ _________ _________ Dissolved Sulfate* _________ _________ _________ Dissolved Nitrate* _________ _________ _________ Dissolved Iron (observed within the plume) _________ _________ Methane (observed within the plume) _________ _________ Note: Δ = concentration inside the plume minus background concentration.
* = use Δ values of these parameters to calculate BC. ** = use inside-plume values to calculate BC.
BW
Body weight,
adults, kg
Residential/ Commercial/ Construc- Unknown Industrial tion
70 70 70
Values provided are not variable

B-43
WORKSHEET # 2: Data Requirements for Option 1 through Option 4, continued Data Requirements for Site-Specific Parameters, and Exposure and Cross-Media Transport Parameters for Option 1 and Option 2, continued
Parameter
Symbol
Parameter Definition and Units
Permissible Values and
Instructions Mark the spaces provided, ⌧,
where applicable
If applicable enter values
used in unshaded
cells
Data Requirements
OPTION 3 OPTION 4 Mark the spaces provided or enter values, ⌧, where applicable For Field-Measured parameters, use average and representative values.
C(ea)n
Concentration of
electron acceptor n in groundwater,
mg/L
Tabulate data in Appendix C
field measured
d
Thickness of
surficial soil, ft
Residential/ Commercial/ Construc- Unknown Industrial tion
3.28 3.28 3.28
Values provided are not variable
Dair
Diffusion
coefficient in air, cm2/sec
chemical-and fraction-specific
see Appendix D, Table D-2
Deffs
Effective
diffusivity in vadose zone
soils, cm2/sec
Enter value at right if calculated by hand
calculated see Appendix D, Table D-1
ds
Thickness of contaminated
subsurface soil (feet)
site-specific measurement
ds: _____ Depth to top: ____ Depth to base: ___
Minimum 3 locations. Enter the # of locations: ___ Drilling ___ Drivinga ___
Digging
Minimum 4 locations. Enter the # of locations: ___ Drilling ___ Drivinga ___ Digging
Deff
crack
Effective diffusivity
through foundation
cracks, cm2/sec
Enter value at right if calculated by hand
calculated see Appendix D, Table D-1

B-44
WORKSHEET # 2: Data Requirements for Option 1 through Option 4, continued Data Requirements for Site-Specific Parameters, and Exposure and Cross-Media Transport Parameters for Option 1 and Option 2, continued
Parameter
Symbol
Parameter Definition and Units
Permissible Values and
Instructions Mark the spaces provided, ⌧,
where applicable
If applicable enter values
used in unshaded
cells
Data Requirements
OPTION 3 OPTION 4 Mark the spaces provided or enter values, ⌧, where applicable For Field-Measured parameters, use average and representative values.
Deff
capf
Effective diffusivity in
capillary fringe zone cm2/sec
Enter value at right if calculated by hand
calculated
see Appendix D, Table D-1
Deff
ws
Effective diffusivity
above the water table, cm2/sec
Enter value at right if calculated by hand
calculated see Appendix D, Table D-1
Dwat
Diffusion
coefficient in water, cm2/sec
chemical-and fraction-specific
see Appendix D Table D-2
ED
Exposure
duration, adults years
Residential/ Commercial/ Construc- Unknown Industrial tion
30 25 1
Values shown are not variable
EF
Exposure frequency,
adults days/year
Residential/ Commercial/ Construc- Unknown Industrial tion
350 250 250
Values shown are not variable
ER
Enclosed space
air exchange rate 1/sec (sec-1)
Residential/ Commercial/ Construc- Unknown Industrial tion 0.00014 sec-1 0.00023 sec-1 -
Values shown are not variable

B-45
WORKSHEET # 2: Data Requirements for Option 1 through Option 4, continued Data Requirements for Site-Specific Parameters, and Exposure and Cross-Media Transport Parameters for Option 1 and Option 2, continued
Parameter
Symbol
Parameter Definition and Units
Permissible Values and Instructions
Mark the spaces provided, ⌧, where applicable
If applicable enter values
used in unshaded
cells
Data Requirements
OPTION 3 OPTION 4 Mark the spaces provided or enter values, ⌧, where applicable For Field-Measured parameters, use average and representative values.
foc,
saturated
Fraction of
organic carbon content, saturated
zone 3, percent
Clay 0.28%
Silty clay 0.25%
Silt 0.25%
Clayey silt 0.25%
Silty sand 0.05%
Clayey sand (fine sand) 0.05%
Clean sand (medium sand) 0.05%
Gravel (coarse sand) 0.05%
To determine soil type, collect a minimum of 5 soil samples from same horizon as contaminated soils but from uncontaminated areas (use average values). Enter the # of locations: ___ Drilling ___ Drivinga ___ Digging
Value selected from permissible values.
Field-Measured.
To determine soil type, collect a minimum of 5 soil samples from same horizon as contaminated soils but from uncontaminated areas (use average values). Enter the # of locations: ___ Drilling ___ Drivinga ___ Digging
Value selected from permissible values.
Field-Measured.
foc,
unsaturated
Fraction of
organic carbon content,
unsaturated zone1, 9
Clay 0.55%
Silty clay 0.50%
Silt 0.50%
Clayey silt 0.50%
Silty sand 0.10%
Clayey sand (fine sand) 0.10%
Clean sand (medium sand) 0.10%
Gravel (coarse sand) 0.10%
To determine soil type, collect a minimum of 5 soil samples from same horizon as contaminated soils but from uncontaminated areas (use average values). Enter the # of locations: ___ Drilling ___ Drivinga ___ Digging
Value selected from permissible values.
Field-Measured.
To determine soil type, collect a minimum of 5 soil samples from same horizon as contaminated soils but from uncontaminated areas (use average values): Enter the # of locations: ___ Drilling ___ Drivinga ___ Digging
Value selected from permissible values.
Field-Measured.

B-46
WORKSHEET # 2: Data Requirements for Option 1 through Option 4, continued Data Requirements for Site-Specific Parameters, and Exposure and Cross-Media Transport Parameters for Option 3 and Option 4, continued
Parameter
Symbol
Parameter Definition and Units
Permissible Values and
Instructions Mark the spaces provided, ⌧,
where applicable
If applicable enter values
used in unshaded
cells
Data Requirements
OPTION 3 OPTION 4 Mark the spaces provided or enter values, ⌧, where applicable For Field-Measured parameters, use average and representative values.
H
Henry’s Law
Constant (dimensionless,
L-H20/L-air)
chemical-and fraction-specific
see Appendix D Table D-2
Values are not variable
hcapf
Thickness of capillary fringe
(feet)1, 2 LGW - hv = hcapf
Saturated Capillary Fringe Medium Thickness (feet)
Clay 5
Silty clay 4
Silt 3
Clayey silt 4
Silty sand 2
Clayey sand (fine sand) 1.5 Clean sand (medium sand) 0.8 Gravel (coarse sand) 0.25
To determine soil type, collect a minimum of 5 soil samples from top of saturated zone (use average values). Enter the # of locations: ___ Drilling ___ Drivinga ___ Digging Field measurements are not permissible.
To determine soil type, collect a minimum of 5 soil samples from top of saturated zone (use average values). Enter the # of locations: ___ Drilling ___ Drivinga ___ Digging Field measurements are not permissible.
hv
Thickness of
vadose zone, ft
site-specific measurement
Minimum 5 locations. Enter the # of locations: ___ Drilling ___ Drivinga ___ Digging
Minimum 5 locations. Enter the # of locations: ___ Drilling ___ Drivinga ___ Digging

B-47
WORKSHEET # 2: Data Requirements for Option 1 through Option 4, continued Data Requirements for Site-Specific Parameters, and Exposure and Cross-Media Transport Parameters for Option 3 and Option 4, continued
Parameter
Symbol
Parameter Definition and Units
Permissible Values and Instructions
Mark the spaces provided, ⌧, where applicable
If applicable enter values
used in unshaded
cells
Data Requirements
OPTION 3 OPTION 4 Mark the spaces provided or enter values, ⌧, where applicable For Field-Measured parameters, use average and representative values.
I
Infiltration rate
(feet/year)7
Clayey soils, unpaved site:
I = (5%) X Annual Precipitation
Sandy soils, unpaved site: I = (10%) X Annual Precipitation
Paved site: I = (0.55%) X Annual Precipitation
Enter annual precip. in inches/year here: ________ Enter I here: _____
To determine soil or ground cover type, collect a minimum of 5 samples. It is permissible to use the formulas shown in column 3 provided there are no leaky utility lines or other sources of artificial recharge.
To determine soil or ground cover type, collect a minimum of 5 samples. It is permissible to use the formulas shown in column 3 provided there are no leaky utility lines or other sources of artificial recharge.
i
Hydraulic gradient
ft/ft
Site-specific measurement.
Value ____ Range____ _________
Measured for all groundwater monitoring rounds using a minimum of 5 measurement points. ____ # Locations and rounds measured for i
Measured for all groundwater monitoring rounds using a minimum of 5 measurement points. ____ # Locations and rounds measured for i
IRair-ind
Inhalation rate, daily indoor,
m3/day
Residential/ Commercial/ Construc- Unknown Industrial tion
20 20 -
Values are not variable
IRair-out
Inhalation rate, daily outdoor,
m3/day
Residential/ Commercial/ Construc- Unknown Industrial tion
20 20 10
Values are not variable
IRsoil
Ingestion rate of
soil, mg/day
Residential/ Commercial/ Construc- Unknown Industrial tion
114 50 100
Values are not variable
IRwater
Ingestion rate, daily, liters/
day
Residential/ Commercial/ Construc- Unknown Industrial tion
2 1 -
Values are not variable

B-48
WORKSHEET # 2: Data Requirements for Option 1 through Option 4, continued Data Requirements for Site-Specific Parameters, and Exposure and Cross-Media Transport Parameters for Option 3 and Option 4, continued
Parameter
Symbol
Parameter Definition and Units
Permissible Values and
Instructions Mark the spaces provided, ⌧,
where applicable
If applicable enter values
used in unshaded
cells
Data Requirements
OPTION 3 OPTION 4 Mark the spaces provided or enter values, ⌧, where applicable For Field-Measured parameters, use average and representative values.
K
Hydraulic conductivity feet/day4, 5
Must be field-measured
If measured, enter range of values: ___________________________ Enter average value: ____ _________
Perform slug tests at 3 locations (for
shallow aquifers only), or drawdown tests at an appropriate number of locations. Use representative values. ____ # Locations measured for each above, and
identity of the locations.
Perform slug tests at 4 locations (for shallow
aquifers only), or drawdown tests at an appropriate number of locations.. Use representative values. ____ # Locations measured for each above, and
identity of the locations.
Kd or ks
Distribution coefficient, mL/g, L/kg
Show value for each constituent at
right if calculating by hand
calculated: Kd = Koc X foc
Koc
Adsorption coefficient, mL/g, L/kg
chemical-and fraction-specific
see Appendix D, Table D-2
Values are not variable
LB
Enclosed space
volume/ infiltration area
ratio, cm
Residential/ Commercial/ Construc- Unknown Industrial tion
200 300 -
Values are not variable
Lcrack
Foundation or wall thickness,
cm
Residential/ Commercial/ Construc- Unknown Industrial tion
15 15 -
Values are not variable

B-49
WORKSHEET # 2: Data Requirements for Option 1 through Option 4, continued Data Requirements for Site-Specific Parameters, and Exposure and Cross-Media Transport Parameters for Option 3 and Option 4, continued
Parameter
Symbol
Parameter Definition and Units
Permissible Values and
Instructions Mark the spaces provided, ⌧,
where applicable
If applicable enter values
used in unshaded
cells
Data Requirements
OPTION 3 OPTION 4 Mark the spaces provided or enter values, ⌧, where applicable For Field-Measured parameters, use average and representative values.
LGW
Depth to
groundwater, ft hv + hcapf =LGW
site-specific measurement
Minimum 5 locations for each monitoring round. Enter the # of locations: ___ Drilling ___ Drivinga ___ Digging
Minimum 5 locations for each monitoring round. Enter the # of locations: ___ Drilling ___ Drivinga ___ Digging
LP
Length of
Groundwater Contaminant Plume (feet)
site-specific measurement
Minimum 3 locations. Enter the # of locations: ___ Drilling ___ Drivinga ___ Digging
Minimum 4 locations. Enter the # of locations: ___ Drilling ___ Drivinga ___ Digging
Ls
Depth to
contaminated soil, ft
site-specific measurement
Top: ____ Base:____
Minimum 5 locations. Enter the # of locations: ___ Drilling ___ Drivinga ___ Digging
Minimum 5 locations. Enter the # of locations: ___ Drilling ___ Drivinga ___ Digging
M
Soil to skin adherence
factor, mg/cm2
Residential/ Commercial/ Construc- Unknown Industrial tion
0.5 0.5 0.5
Values are not variable
Pe
Particulate
emission rate, g/cm2-sec
6.9 X 10⁻¹⁴
Value shown is not variable
R
Retardation
Factor, unitless
If calculated by hand, show values at right
calculated, see Equation D.27
RAFd
Relative
absorption factor, dermal,
(volatiles/ PAHs)
Residential/ Commercial/ Construc- Unknown Industrial tion 0.5/0.05 0.5/0.05 0.5/0.05
Values shown are not variable
RAFo
Relative
absorption factor, oral,
unitless
Residential/ Commercial/ Construc- Unknown Industrial tion 1.0 1.0 1.0
Values shown are not variable

B-50
WORKSHEET # 2: Data Requirements for Option 1 through Option 4, continued Data Requirements for Site-Specific Parameters, and Exposure and Cross-Media Transport Parameters for Option 3 and Option 4, continued
Parameter
Symbol
Parameter Definition and Units
Permissible Values and
Instructions Mark the spaces provided, ⌧,
where applicable
If applicable enter values
used in unshaded
cells
Data Requirements
OPTION 3 OPTION 4 Mark the spaces provided or enter values, ⌧, where applicable For Field-Measured parameters, use average and representative values.
RBSLi
Risk-based screening level for media “i” (mg/kg-soil;
mg/L-water; or ug/m3)
chemical-, media-, and exposure route-specific
RfDi Reference Dose,
inhalation, mg/kg-day
chemical-and fraction-specific
see Appendix D, Table D-2
Values are not variable
RfDo
Reference Dose, oral, mg/kg-day
chemical-and fraction-specific
see Appendix D, Table D-2
Values are not variable
SA
Skin surface
area cm2
Residential/ Commercial/ Construc- Unknown Industrial tion 5800 5800 5800
Values are not variable
SFi
Cancer slope
factor , inhalation
(mg/kg-day)-1
chemical-specific
see Appendix D, Table D-2
Values are not variable
SFo
Cancer slope factor, oral
(mg/kg-day)-1
chemical-specific
see Appendix D, Table D-2
Values are not variable
TER
Target Excess
Lifetime Cancer Risk, unitless
Residential/ Commercial/ Construc- Unknown Industrial tion 10-6 10-6 10-6
Values shown are not variable
THQ
Target Hazard
Quotient, unitless
Residential/ Commercial/ Construc- Unknown Industrial tion 1.0 1.0 1.0
Values shown are not variable

B-51
WORKSHEET # 2: Data Requirements for Option 1 through Option 4, continued Data Requirements for Site-Specific Parameters, and Exposure and Cross-Media Transport Parameters for Option 3 and Option 4, continued
Parameter
Symbol
Parameter Definition and Units
Permissible Values and
Instructions Mark the spaces provided, ⌧,
where applicable
If applicable enter values
used in unshaded
cells
Data Requirements
OPTION 3 OPTION 4 Mark the spaces provided or enter values, ⌧, where applicable For Field-Measured parameters, use average and representative values.
Uair
Wind speed
above ground surface in
ambient mixing zone (cm/sec)
225
Value shown is not variable
Udarcy
Groundwater
Darcy velocity (feet/day)
site-specific measurement = Ki
Calculated only if criteria for i & K are met.
Calculated only if criteria for i & K are met.
UFn
Utilization Factor for electron
acceptor n (i.e., mass ratio of
electron acceptor to
hydrocarbon consumed in
biodegradation reactions; unitless).
Values shown at far right are for BTEX only and are not variable.
Check cell at right if UFs are used.
Oxygen 3.14
Nitrate 4.90
Sulfate 4.6
Ferrous Iron 21.8
Methane 0.78
Utran
Groundwater
Transport Velocity (feet/day)
site-specific measurement = Ki/θeff
Calculated only if criteria for i & K are met.
Calculated only if criteria for i &K are met.
VFsamb
Volatilization
factor of subsurface soils to ambient air
(mg/m3-air)/(mg/kg-soil)
If calculated by hand, enter values at right
calculated see Appendix D, Table D-1

B-52
WORKSHEET # 2: Data Requirements for Option 1 through Option 4, continued Data Requirements for Site-Specific Parameters, and Exposure and Cross-Media Transport Parameters for Option 3 and Option 4, continued
Parameter
Symbol
Parameter Definition and Units
Permissible Values and
Instructions Mark the spaces provided, ⌧,
where applicable
If applicable enter values
used in unshaded
cells
Data Requirements
OPTION 3 OPTION 4 Mark the spaces provided or enter values, ⌧, where applicable For Field-Measured parameters, use average and representative values.
VFsesp
Volatilization
factor of subsurface soils
to enclosed space (indoor air)
(mg/m3-air)/(mg/kg-soil)
If calculated by hand, enter values at right
calculated see Appendix D, Table D-1
VFss
Volatilization
factor of surficial soil to outdoor (ambient) air as
vapors (mg/m3-
air)/(mg/kg-soil)
Enter values at right if measured
calculated see Appendix D, Table D-1
VFwamb
Volatilization
factor of groundwater to
ambient air (mg/m3-
air)/(mg/L-water)
If calculated by hand, enter values at right
calculated see Appendix D, Table D-1
VFwesp
Volatilization
factor of groundwater to enclosed space
(indoor air)(mg/m3-
air)/(mg/L-water)
If calculated by hand, enter values at right
calculated see Appendix D, Table D-1

B-53
WORKSHEET # 2: Data Requirements for Option 1 through Option 4, continued Data Requirements for Site-Specific Parameters, and Exposure and Cross-Media Transport Parameters for Option 3 and Option 4, continued
Parameter
Symbol
Parameter Definition and Units
Permissible Values and
Instructions Mark the spaces provided, ⌧,
where applicable
If applicable enter values
used in unshaded
cells
Data Requirements
OPTION 3 OPTION 4 Mark the spaces provided or enter values, ⌧, where applicable For Field-Measured parameters, use average and representative values.
W
Width (feet) contaminated source areas
parallel to GW flow or wind
direction
site-specific measurement
Any site-specific value permissible.
Any site-specific value permissible.
α
Dispersivity in Groundwater:
(feet) αx Longitudinal αy Transverse αz Vertical
Calculated. Enter Values in Unshaded Cell
at Far Right
α x __________________________ feet α y __________________________ feet α z __________________________ feet
α x __________________________ feet α y __________________________ feet α z __________________________ feet
δair
Ambient air mixing zone height, cm
200
Values shown are not variable
δgw
Groundwater mixing zone thickness, cm
200
Values shown are not variable
η
Areal fraction of
cracks in foundations/wall
s cm2-cracks/cm2-
total area
0.01
Values shown are not variable
ρs
Bulk density of
soil, g/cm3
1.7
Values shown are not variable

B-54
WORKSHEET # 2: Data Requirements for Option 1 through Option 4, continued Data Requirements for Site-Specific Parameters, and Exposure and Cross-Media Transport Parameters for Option 3 and Option 4, continued
Parameter
Symbol
Parameter Definition and Units
Permissible Values and Instructions
Mark the spaces provided, ⌧, where applicable
If applicable enter values
used in unshaded
cells
Data Requirements
OPTION 3 OPTION 4 Mark the spaces provided or enter values, ⌧, where applicable For Field-Measured parameters, use average and representative values.
τ
Averaging time for vapor flux,
sec
Residential/ Commercial/ Construc- Unknown Industrial tion 9.46 X 10⁸ 7.88 X 10⁸ 3.15 X 10⁷
Values shown are not variable
θacapf
Volumetric air content, capillary fringe soils1,7,8
θacapf = θT - θwcapf
calculate
calculate
θacrack
Volumetric air
content, foundation
crack,8
same as θas
same as θas
same as θas
θas
Volumetric air content, vadose
soils1,7,8
θas = θT - θws
calculate
calculate
θeff
Porosity, effective
(use for lateral transport
groundwater models; for
saturated zone only)1,7,8
Clay 0.10%
Silty clay 0.15%
Silt 0.15%
Clayey silt 0.15%
Silty sand 0.20%
Clayey sand (fine sand) 0.20%
Clean sand (medium sand) 0.23%
Gravel (coarse sand) 0.26%
To determine soil type, analyze a minimum of 3 soil samples from same horizon as contaminated soils (use average values). Enter the # of locations: ___ Drilling ___ Drivinga ___ Digging
Value selected from permissible values.
Field-Measured.
To determine soil type, analyze a minimum of 4 soil samples from same horizon as contaminated soils (use average values). Enter the # of locations: ___ Drilling ___ Drivinga ___ Digging
Value selected from permissible values.
Field-Measured.

B-55
WORKSHEET # 2: Data Requirements for Option 1 through Option 4, continued Data Requirements for Site-Specific Parameters, and Exposure and Cross-Media Transport Parameters for Option 3 and Option 4, continued
Parameter
Symbol
Parameter Definition and Units
Permissible Values and Instructions
Mark the spaces provided, ⌧, where applicable
If applicable enter values
used in unshaded
cells
Data Requirements
OPTION 3 OPTION 4 Mark the spaces provided or enter values, ⌧, where applicable For Field-Measured parameters, use average and representative values.
θT
Porosity, total
(use for volatilization
models)4
Clay 38%
Silty clay 36%
Silt 46%
Clayey silt 36%
Silty sand 41%
Clayey sand (fine sand) 38%
Clean sand (medium sand) 41%
Gravel (coarse sand) 30%
To determine soil type or to field-measure parameter, analyze a minimum of 3 soil samples from same horizon as contaminated soils (use average values). Enter the # of locations: ___ Drilling ___ Drivinga ___ Digging
Value selected from permissible values.
Field-Measured.
To determine soil type or to field-measure parameter, analyze a minimum of 4 soil samples from same horizon as contaminated soils (use average values). Enter the # of locations: ___ Drilling ___ Drivinga ___ Digging
Value selected from permissible values.
Field-Measured.
θwcapf
Volumetric
water content, capillary fringe
soils7,8
θwcapf = θT- θacapf
Clay 37.980%
Silty clay 35.986%
Silt 45.970%
Clayey silt 35.986%
Silty sand 40.965%
Clayey sand (fine sand) 37.978%
Clean sand (medium sand)40.965%
Gravel (coarse sand) 29.980%
To determine soil type of field-measured parameter, analyze a minimum of 5 soil samples from same horizon as contaminated soils . Enter the # of locations: ___ Drilling ___ Drivinga ___ Digging
Value selected from permissible values.
Field-Measured.
To determine soil type or field-measured parameter, a, analyze a minimum of 5 soil samples from same horizon as contaminated soils . Enter the # of locations: ___ Drilling ___ Drivinga ___ Digging
Value selected from permissible values.
Field-Measured.

B-56
WORKSHEET # 2: Data Requirements for Option 1 through Option 4, continued Data Requirements for Site-Specific Parameters, and Exposure and Cross-Media Transport Parameters for Option 3 and Option 4, continued
Parameter
Symbol
Parameter Definition and Units
Permissible Values and
Instructions Mark the spaces provided, ⌧,
where applicable
If applicable enter values
used in unshaded
cells
Data Requirements
OPTION 3 OPTION 4 Mark the spaces provided or enter values, ⌧, where applicable For Field-Measured parameters, use average and representative values.
θwcrack
Volumetric
water content, foundation
crack,8
same as θws
same as θws
same as θws
θws
Volumetric
water content, vadose soils1,7,8
θws θws
Soil DTGW* DTGW* Type 0 - 20 ft >20 ft
Clay 30% 15%
Silty clay 25% 12%
Silt 20% 8%
Clayey silt 25% 12%
Silty sand 10% 5%
Clayey sand (fine sand) 23% 10% Clean sand (medium sand) 7% 3% Gravel (coarse sand) 7% 3%
To determine soil type or filed-measured parameter, analyze a minimum of 5 soil samples from same horizon as contaminated soils:
____ Drilling ___ Drivinga ___ Digging Value selected from permissible values.
Field-Measured.
To determine soil type or filed-measured parameter, analyze a minimum of 5 soil samples from same horizon as contaminated soils: ____ Drilling ____ Drivinga ____ Digging
Value selected from permissible values.
Field-Measured.
References for Worksheet #2: -indicates that condition does not apply; a drivng refers to direct-push sampling techniques; * Depth to Groundwater 1 Groundwater Services, Inc. (GSI), 1996a; 2 Brady, N.C., 1974; 3 Derived from reference 1 based on solubility of foc in saturated zone; 4 Freeze and Cherry, 1979; 5 DERR case files; 6 Spitz and
Moreno 1996; 7 Connor, et al., 1996; 8 ASTM, 1995.

B-57
Worksheet #2: Data Requirements for Option 1 through Option 4, continued
Justification for Departure from Worksheet #2 Requirements INSTRUCTIONS: Identify each item from the preceding Worksheet #2, that does not conform to the specified requirements in Worksheet #2. Describe why the requirement was not conformed to, and the impact the nonconformity has on evaluating site conditions and exposure pathways. Number of Sampling Locations: Hydraulic Conductivity Measurements: Number of Monitoring Locations: Number of Years of Monitoring: Plume Stability: Determination of Attenuation Mechanisms: Exposure Parameters: Cross-Media Transport Parameters:

B-58
AIR Inhalation of Vapors
or Particulates
SOIL Dermal
Contact/Ingestion
GROUNDWATER Potable W ater Use
or Property Boundary
SURFACE WATER Recreational Use/ Sensitive Habitat
TRANSPORT MECHANISM
EXPOSURE PATHWAY
CAUSES of RELEASE IMPACTED
MEDIUM
Surface Soil <3 ft deep**
Free Phase Liquid
Plume***
Dissolved Groundwater Plume
Subsurface Soil >3 ft deep**
Surface soils, Sediments, or Surface W ater
Storm water/Surface W ater Transport
Mobile Free Phase Migration
Leaching and/or Groundwater
Transport
Volatilization to Indoor Air
Volatilization to Outdoor Air
Volatilization and Dust Transport
POTENTIAL RECEPTORS*
____Product Storage
(tanks/UST)
____Piping
____Dispenser
____Other
On-site: Residential Sensitive Habitat
Off-site: Residential Sensitive Habitat
nonresidential construction worker
nonresidential construction worker
Exposed Receptors
Exposed Persons
On-site: Residential Sensitive Habitat
Off-site: Residential Sensitive Habitat
nonresidential construction worker
Groundwater Users
On-site: Residential Sensitive Habitat
Off-site: Residential Sensitive Habitat
nonresidential construction worker
Surface Water Users
On-site: Residential Sensitive Habitat
Off-site: Residential Sensitive Habitat
nonresidential construction worker
nonresidential None
1. Mark the small boxes if the specified condition is applicable
INSTRUCTIONS
Worksheet #3: Site Conceptual Exposure Model (modified from GSI, 1995)
2. Fill in the shutoff valves to indicate that exposure pathway is NOT complete. Exposure pathway may not be complete due to source removal, control, and/or treatment.
CLEANUP OPTIONS
Complete ___Current Pathway ___Potential
Complete ___Current Pathway ___Potential
Complete ___Current Pathway ___Potential
Action Required? Yes__ No__ if YES, list cleanup options below: _________________________________ _________________________________
Action Required? Yes__ No__ if YES, list cleanup options below: _________________________________ _________________________________
Action Required? Yes__ No__ if YES, list cleanup options below: _________________________________ _________________________________
3. For each complete pathway, identify the cleanup options.
(check applicable)
** Evaluate potential for subsurface soil to be excavated and become surface soil * "Potential" refers to a projection of 5 to 10 years
Notes:
*** Free Product is a source that must be eliminated or controlled. See Free Product Removal Report in Subsurface Investigation, Appendix D.
Complete ___Current Pathway ___Potential
Action Required? Yes__ No__ if YES, list cleanup options below: _________________________________ _________________________________
nonresidential construction worker
nonresidential construction worker
Site Name: __________________________ Site Location: _______________________ Facility ID:_________________

B-59
Figure B-1: Hypothetical Exposure Pathways and Initial Screening Criteria
Use this figure as a guide only for evaluating exposure. Do not complete or submit this form. This figure may be helpful in evaluating uncertainties and making risk management decisions and may be useful for completing Section K of Worksheet #1, Appendix B.
EXPOSURE PATHWAY SCREENING CRITERIA
Exposure Pathway and Remedy Performance Standard Source Zone Transport Mechanism Receptor Point Air Exposure Prevent exceedance of applicable
risk limits due to vapor or dust inhalation.
● No affected soils exceeding Tier 1 criteria within 15 ft of ground surface.
● Soil vapor flux to surface does not exceed air exposure limit.
● Air dispersion effects reduce
ambient dust/vapors to below air exposure limit.
● Ambient Air: Concentrations at POE are below applicable exposure limits.
● Indoor Air: No enclosed
building located over affected soil zone.
Soil Exposure Prevent exceedance of applicable
risk limits due to human exposure via incidental soil ingestion or dermal contact
● No affected soils at ground surface exceeding Tier 1 criteria.
-----
-----
Groundwater Ingestion Prevent exceedance of drinking
water limits in water supply wells completed within underlying water-bearing strata.
● No affected groundwater exceeding drinking water limits (federal MCLs).
● No affected soils exceeding
Tier 1 criteria.
● Affected groundwater plume stable or shrinking and does not reach applicable POE.
● Plume concentrations at POE are below drinking water limits.
Subsurface Utilities Prevent property damage, explosive
vapor condition, and contaminant migration via subsurface utility corridor. Remove NAPL to extent practicable.
● No affected soils or groundwater contact with subsurface utilities. No NAPL present in soils or groundwater.
● Affected groundwater plume stable or shrinking and does not reach subsurface utility.
● For vapors, soil and groundwater concentrations within 15 ft beneath subsurface utility are below Tier 1 SL for soil-to-air and groundwater-to-air pathways.
NOTES: 1) An exposure pathway screening evaluation is to be conducted prior to Tier 2 Options 1 through 4 to identify pathways of concern for each site. For each Tier 2 Risk Assessment, Worksheet 3
(SCEM) must be completed to identify complete/incomplete exposure pathways without consideration of existing or proposed control measures. An exposure pathways is considered incomplete if the relevant screening criteria are satisfied for either the source zone, the transport mechanism, or the receptor point. Pathways which do not meet screening criteria are either currently or potentially complete and will require further evaluation and/or response.
2) POE = Point of Exposure
NAPL = Non-Aqueous Phase Liquid

B-60
Table B-5: Guide for Evaluating Exposure
Use this table as a guide only for evaluating exposure. Do not complete or submit this form. This table may be helpful in evaluating uncertainties and making risk management decisions and may be useful for completing Section K of Worksheet #1, Appendix B.
PATHWAYS OF CONCERN
PATHWAY SCREENING CRITERIA
CURRENT vs. POTENTIAL EXPOSURE
PATHWAY STATUS
AIR EXPOSURE PATHWAYS ▪ Subsurface Soil-
To-Ambient Air Subsurface soil contamination? □ No--------------------------------------------------------------------➠ Imcomplete Pathway
□ Yes----➠Affected soils exposed at ground surface------□ No----➠Complete/Potential Exposure (no cover)? □ Yes---➠Complete/Current Exposure*
▪ Subsurface Soil: Vapor Intrusion-to- Indoor Air
Subsurface soil beneath existing building?
□ No-----➠Buildings expected to be built over contamination?➠ □ No----➠Incomplete Pathway □ Yes----➠Complete/Potential Exposure □ Yes----➠Observed or suspected soil vapor impact---➠□ No----➠Complete/Potential Exposure □ Yes----➠Complete/Current Exposure*
▪ GW-to-Ambient Air GW contamination? □ No------------------------------------------------------------------------------------➠Incomplete Pathway □ Yes--➠Affected plume beneath exposed surface area--➠□ No--➠Complete/Potential Exposure (no cover, i.e. bare soil)? □ Yes---➠Complete/Current Exposure*
▪ GW: Vapor Intrusion-to- Indoor Air
GW contamination beneath existing building?
□ No-----➠Buildings expected to be built over contamination?➠ □ No----➠Incomplete Pathway □ Yes----➠Complete/Potential Exposure □ Yes----➠Observed or suspected soil vapor impact---➠□ No----➠Complete/Potential Exposure □ Yes----➠Complete/Current Exposure*
GROUNDWATER EXPOSURE PATHWAYS ▪ GW Ingestion: On-Site
GW impacted in excess of Tier 1 criteria and existing water supply well located on-site?
□ No------------------------------------------------------------------------------------➠Incomplete Pathway □ Yes--➠On-Site water supply well impacted by----➠□ No--➠Complete/Potential Exposure site constituents? □ Yes---➠Complete/Current Exposure*
▪ GW Ingestion: Off-Site
GW impacted in excess of Tier 1 criteria and plume presently off-site or likely to migrate on-site?
□ No------------------------------------------------------------------------------------➠Incomplete Pathway □ Yes--➠Plume in expanding condition and existing water➠□ No--➠Complete/Potential Exposure supply well within 250ft downgradient? □ Yes---➠Complete/Current Exposure*
▪ Soil-to-GW Impact Surface or subsurface soil contamination and either on-site or off-site GW ingestion pathway complete?
□ No------------------------------------------------------------------------------------➠Incomplete Pathway □ Yes--➠Affected soil zone exposed to rainfall infiltration➠□ No--➠Complete/Potential Exposure (no cover)? □ Yes---➠Complete/Current Exposure*
▪ GW Dermal Contact: Construction Worker in ROW
GW ingestion POE is across ROW and GW plume concentrations beneath ROW exceed Tier 1 criteria within 0-15 ft bgs?
□ No------------------------------------------------------------------------------------➠Incomplete Pathway □ Yes--➠ROW earthwork activity underway or proposed➠□ No--➠Complete/Potential Exposure □ Yes---➠Complete/Current Exposure*

B-61
Table B-5, Continued: Guide for Evaluating Exposure
Use this table as a guide only for evaluating exposure. Do not complete or submit this form. This table may be helpful in evaluating uncertainties and making risk management decisions and may be useful for completing Section K of Worksheet #1, Appendix B.
PATHWAYS OF CONCERN
PATHWAY SCREENING CRITERIA
CURRENT vs. POTENTIAL EXPOSURE
PATHWAY STATUS
SOIL EXPOSURE PATHWAYS ▪ Subsurface Soil Dermal Contact, Vapor/Dust Inhalation: Residential or Commercial Workers
Surface or subsurface soil contamination?
□ No-----➠Is subsurface soil likely to be excavated?--- □ No----➠Incomplete Pathway □ Yes----➠Complete/Potential Exposure □ Yes----➠Site earthwork activity underway or proposed?--□ No---➠Complete/Potential Exposure □ Yes----➠Complete/Current Exposure*
▪ Subsurface Soil Dermal Contact, Vapor/Dust Ingestion: Construction Worker
Surface or subsurface soil contamination?
□ No-----➠Is subsurface soil likely to be excavated?--- □ No----➠Incomplete Pathway □ Yes----➠Complete/Potential Exposure □ Yes----➠Site earthwork activity underway or proposed?--□ No---➠Complete/Potential Exposure □ Yes----➠Complete/Current Exposure*
UNDERGROUND UTILITY IMPACTS ▪ Soil Impacts on Utilities
Soil contamination in contact with or within 15 feet below underground utility?
□ No------------------------------------------------------------------------------------➠Incomplete Pathway □ Yes--➠Soil vapors exceed 20% LEL adjacent to utility--➠□ No--➠Complete/Potential Exposure line or utility susceptible to physical damage □ Yes---➠Complete/Current Exposure*
▪ GW/NAPL Impacts on Utilities
NAPL or GW containing BTEXN in excess of 30 mg/L in contact with or within 15 ft below underground utility?
□ No------------------------------------------------------------------------------------➠Incomplete Pathway □ Yes--➠Soil vapors exceed 20% LEL adjacent to utility--➠□ No--➠Complete/Potential Exposure line or utility susceptible to physical damage □ Yes---➠Complete/Current Exposure*

B-62
Worksheet #4a Plume Stability Evaluation Procedures and Results
Facility Name and Location: Date Completed: Facility ID: Completed By:
INSTRUCTIONS STEP 1 Use this Worksheet 4a to show the final results of your mass balance and plume stability calculations. Complete Worksheets 4b through 4e, as applicable, to ensure that your final conclusions regarding contaminant reduction are as accurate as possible. Discuss groundwater fluctuations, biodegradation capacity, or other phenomena to support your conclusions regarding plume stability. Discuss the source of data used and show applicable figures in Appendix C. STEP 2 Check the worksheet(s) below that apply to the site: _____ Worksheet 4a: Plume Stability Results (this page) _____ Worksheet 4b: Mass Calculations for Dissolved Phase _____ Worksheet 4c: Mass Calculations for Adsorbed Phase _____ Worksheet 4d: Percent of Average Decrease of Dissolved Contaminant Concentrations _____ Worksheet 4e: Statistical Evaluation of Plume Stability STEP 3 Discuss the results of each Worksheet (4b through 4e) as they relate to your Tier 2 Risk Assessment and plume stability in each medium.

B-63
WORKSHEET #4b Mass Calculations for Initial and Ending Dissolved Phase
Constituent(s) Evaluated: _____________________ Facility Name and Location: Date Completed: Facility ID: Completed By:
Example of Dissolved Plume Concentration Map at TIME=INITIAL
INSTRUCATIONS 1. Evaluate applicable, appropriate and representative individual and/or combined constituents (e.g., benzene, total BTEXN, TPH, other)
that, for example, exceed Tier 1 criteria or ISLs. Identify constituents(s) evaluated. 2. Construct site-specific GW contamination concentrations contour maps, like the example shown, for initial and ending times. Divide
the map into discrete sections or “areas” and calculate the mass in each area, for each time interval, as shown. 3. If you use this spreadsheet to solve the equations, enter your site-specific data in the unshaded cells below. 4. Calculate the total mass in the dissolved phase, in each area, at TIME = INITIAL. Then, calculate the total mass in dissolved total
mass in the dissolved phase, in each area, for TIME = END. Identify what your INITIAL and ENDING times are. 5. The plume is stable if the ending mass is less the same as the initial mass. The plum is decreasing if the ending mass is less than the
initial mass. 6. The FINAL PERCENT REDUCTION (+) or INCREASE (-) of mass is shown in the cell below. 7. If you are manually calculating mass, use the equations below.
EQUATIONS Mass Area(A) = (Area of Area A) (thickness of plume in Area A, ft) (ave conc in Area A, mg/L) (total porosity) (unit mass conversion) Mass Area(B) = (thickness of plume in Area B, ft)[(Area of B) (Area of A)](ave.concen. Area B, mg/L) (total Porosity) (unit mass conversion) Mass Area(C) = (thickness of plume in Area C, ft)[(Area of C) (Area B)] (ave. concen. Area C, mg/L) (total porosity) (unit mass conversion) Unit Mass Conversion = (1000 L/M^3) (0.02832 m^3/ft^3) (lg/1000mg) (1kg/1000g)
GW: FINAL % REDUCTION (+) OR INCREASE (-) shown below
TIME = INITIAL Enter Beginning Date Here: _____________________ GW Area “A”
Enter Plume Length below (feet)
Enter Plume Width below (feet)
Enter Plume Thickness below (feet) *
Enter Average Conc. Below (mg/L)
Enter Porosity Mass in Dissolved Phase shown below (kg)
GW Area “B”
Enter Plume Length below (feet)
Enter Plume Width below (feet)
Enter Plume Thickness below (feet)
Enter Average Conc. Below (mg/L)
Enter Porosity Mass in Dissolved Phase shown below (kg)
GW Area “C”
Enter Plume Length below (feet)
Enter Plume Width below (feet)
Enter Plume Thickness below (feet) *
Enter Average Conc. Below (mg/L)
Enter Porosity Mass in Dissolved Phase shown below (kg)
TIME = INITIAL: TOTAL MASS IN DISSOLVED PHASE SHOWN BELOW (kg):
TIME = END Enter Ending Date Here: ____________________ GW Area “A”
Enter Plume Length below (feet)
Enter Plume Width below (feet)
Enter Plume Thickness below (feet) *
Enter Average Conc. Below (mg/L)
Enter Porosity Mass in Dissolved Phase shown below (kg)
GW Area “B”
Enter Plume Length below (feet)
Enter Plume Width below (feet)
Enter Plume Thickness below (feet)
Enter Average Conc. Below (mg/L)
Enter Porosity Mass in Dissolved Phase shown below (kg)
GW Area “C”
Enter Plume Length below (feet)
Enter Plume Width below (feet)
Enter Plume Thickness below (feet) *
Enter Average Conc. Below (mg/L)
Enter Porosity Mass in Dissolved Phase shown below (kg)
TIME = END: TOTAL MASS IN DISSOLVED PHASE SHOWN BELOW (kg):
*Use 3 feet for GW plume thickness unless you have evidence such as vertical sampling, to prove otherwise

B-64
WORKSHEET #4c Mass Calculations for Initial and Ending Adsorbed Phase
Constituent(s) Evaluated: _____________________ Facility Name and Location: Date Completed: Facility ID: Completed By:
Example of Adsorbed Plume Concentration Map at TIME=INITIAL
INSTRUCATIONS 1. Evaluate applicable, appropriate and representative individual and/or combined constituents (e.g., benzene, total BTEXN, TPH, other)
that, for example, exceed Tier 1 criteria or ISLs. Identify constituents(s) evaluated. 2. Construct site-specific soil contamination concentrations contour maps, like the example shown, for initial and ending times. Divide
the map into discrete sections or “areas” and calculate the mass in each area, for each time interval, as shown. 3. If you use this spreadsheet to solve the equations, enter your site-specific data in the unshaded cells below. 4. First, calculate the total mass in the dissolved phase, in each area, at TIME = INITIAL. Then, calculate the total mass in adsorbed
phase, for each time interval, in each area, for TIME = END. Identify what your INITIAL and ENDING times are. 5. The plume is stable if the ending mass is less the same as the initial mass. The plum is decreasing if the ending mass is less than the
initial mass. The plume is increasing if the ending mass is greater than the initial mass. 6. The FINAL PERCENT REDUCTION (+) or INCREASE (-) of mass is shown in the cell below. 7. If you are manually calculating mass, use the equations below.
Mass Area A = (Area of Area A) (thickness of soil plume in Area A, ft) (ave soil conc in Area A, mg/kg) (bulk density) (UMC) Mass Area B = (thickness of soil plume in Area B, ft)[(Area of B - Area of A)](ave.soil conc Area B, mg/kg) (bulk density) (UMC) Mass Area C = (thickness of soil plume in Area C, ft)[(Area of C - Area B)] (ave. soil conc Area C, mg/kg) (bulk density) (UMC) Soil Mass % dec/inc: 1-(mass@end/mass@initial) UMC, Unit Mass Conversion = (28320 cm^3/ft^3) (1kg/1000g) (1g/1000 mg) (1kg/1000 g)
FINAL RESULTS OF SOIL MASS REDUCTION OR INCREASE MASS SUMMARY (KG)
Total Mass in Soil at Time = INITIAL (kg)
Total Mass in Soil at Time = END (kg)
Final Mass Reduction/Increase in Soil
%
TIME = INITIAL Enter Beginning Date Here: _____________________ Soil Area “A”
Enter Plume Length below (feet)
Enter Plume Width below (feet)
Enter Plume Thickness below (feet) *
Enter Average Conc. Below (mg/kg)
Bulk Density (g/cm^3)
Mass in Adsorbed Phase shown below (kg)
Soil Area “B”
Enter Plume Length below (feet)
Enter Plume Width below (feet)
Enter Plume Thickness below (feet) *
Enter Average Conc. Below (mg/kg)
Bulk Density (g/cm^3)
Mass in Adsorbed Phase shown below (kg)
Soil Area “C”
Enter Plume Length below (feet)
Enter Plume Width below (feet)
Enter Plume Thickness below (feet) *
Enter Average Conc. Below (mg/kg)
Bulk Density (g/cm^3)
Mass in Adsorbed Phase shown below (kg)
TIME = INITIAL: TOTAL MASS IN ADSORBED PHASE SHOWN BELOW (kg):
TIME = END Enter Ending Date Here: ____________________ Soil Area “A”
Enter Plume Length below (feet)
Enter Plume Width below (feet)
Enter Plume Thickness below (feet) *
Enter Average Conc. Below (mg/kg)
Bulk Density (g/cm^3)
Mass in Adsorbed Phase shown below (kg)
Soil Area “B”
Enter Plume Length below (feet)
Enter Plume Width below (feet)
Enter Plume Thickness below (feet) *
Enter Average Conc. Below (mg/kg)
Bulk Density (g/cm^3)
Mass in Adsorbed Phase shown below (kg)
Soil Area “C”
Enter Plume Length below (feet)
Enter Plume Width below (feet)
Enter Plume Thickness below (feet) *
Enter Average Conc. Below (mg/kg)
Bulk Density (g/cm^3)
Mass in Adsorbed Phase shown below (kg)
TIME = END: TOTAL MASS IN ADSORBED PHASE SHOWN BELOW (kg):
*Adsorbed plume thickness must reflect the actual thickness of contaminated soil.

B-65
WORKSHEET #4d Determining Percent Decrease in Dissolved Concentrations
Constituent(s) Evaluated: _________________________ Facility Name and Location: Date Completed: Facility ID: Completed By:
INSTRUCTIONS: Example of Calculating Percent Reduction of Dissolved Contamination Across a Site. Enter your data in the UNSHADED cells
Enter Well # below
Enter Concentration at
Time 1 (= baseline
concentration)
Enter Concentration at
Time 2
Enter Concentration at
Time 3
Enter Concentration at
Time 4
MW-1 MW-2 MW-3 MW-4
ENTER TOTAL # OF WELLS LISTED
ABOVE
TOTAL CONCENTRATION
OF ALL WELLS
AVERAGE CONCETNRATION
OF ALL WELLS
TOTAL AVERAGE CONCENTRATION
AVERAGE %
FORMULAS: AVERAGE % REDUCTION = (concentration average at TIME = 1) – (concentration average at TIME = 2)

B-66
WORKSHEET #4e: STATISTICAL EVALUATION OF PLUME STABILITY Site Name:
Facility ID: Date Completed: Completed By:
HISTORICAL GROUNDWATER DATABASE ADEQUACY OF DATABASE FOR TREND ANALYSIS Instructions: This form can be used to characterize a groundwater plume as either stable, diminishing, or expanding based on
concentration trends. For meaningful results, the historical database should include four or more groundwater sampling events at two or more monitoring wells located inside the plume area. Evaluate database in space provided and indicate selected action (⊠ ). Warning: This Worksheet #4e may not be useful for fluctuating concentration trends. It may be more useful to rely on mass balance Worksheets #4a and #4b, and hydrographs such as that shown in Figure C-6 to evaluate plume stability. ❑ Sufficient Data available: Four or more independent samples (i.e., different sampling dates) are available from each well in plume area: ➨Complete one statistical Analysis Worksheet (page 2 of 3) for each monitoring well in plume to evaluate trends in sampling data. Record results for all wells on Summary Worksheet (page 3 of 3). ❑ Insufficient Data Available: Fewer than 4 independent samples are available from each well.
➨Select action: ❑ Conduct additional groundwater monitoring and reevaluate, OR
❑ Assume expanding plume condition and proceed with risk-based site evaluation
HISTORICAL GROUNDWATER MONITORING DATA Instructions: In spaces provided below, record historical groundwater monitoring results for wells located inside plume area.
Do not include upgradient wells or background wells in this stability evaluation.
WELL ID: Sampling
Event
Date
Total BTEXN Conc. (mg/L)
1 2 3 4 5
6
7 8 9 10 Notes: ND = Not detected; NS = Not sampled; PSH = Phase-separated hydrocarbon present.

B-67
WORKSHEET #4e: STATISTICAL EVALUATION OF PLUME STABILITY, continued Site Name:
Facility ID: Date Completed: Completed By:
INSTRUCTIONS The Mann-Kendall statistic can be used to define the stability condition of a groundwater plume (i.e., stable, diminishing or expanding) based on
concentration trends at individual wells. For each monitoring well located in plume area for which 4 or more independent sampling events are available, follow the steps described below. Complete a separate form for each well. Step 1: Well Data: Enter Well ID No. and total BTEXN concentrations for each sampling event (i.e. data from page 1 of 3). Included only events for which numeric or ND values are available. Do not include Not Sampled (NS) or PSH events. Step 2: Data Comparisons: Complete Row 1, comparing the results of Events 2, 3 etc. to Event 1, as follows: 1 Concentration of Event x > Event 1: Enter 1 1 Concentration of Event x = Event 1: Enter 0 1 Concentration of Event x < Event 1: Enter –1 Complete all Rows in same manner until all sampling events are complete. Sum the right hand column down to get TOTAL sum. This TOTAL value represents Mann-Kendall Statistic “S” for the data from this well. Step 4: Results: Use Confidence Level Chart to determine % confidence in plume trend based on S value & number of sampling events.
MANN-KENDALL ANALYSIS OF PLUME
WELL ID No:
Total BTEXN (mg/L) Event 1 Event 2 Event 3 Event 4 Event 5 Event 6 Event 7 Event 8 Event 9 Event 10 Sum Rows
Row 1: Compare to Event 1: 0 Row 2: Compare to Event 2: 0 Row 3: Compare to Event 3: 0 Row 4: Compare to Event 4: 0 Row 5: Compare to Event 5: 0
Row 6: Compare to Event 6: 0
Row 7: Compare to Event 7: 0 Row 8: Compare to Event 8: 0 Row 9: Compare to Event 9: 0 Mann-Kendall Statistic (S) = TOTAL 0
CHARACTERIZATION OF GROUDNWATER PLUME BASED ON DATA FROM THIS WELL Use the Confidence Level Chart with the Mann-Kendall Statistic computed above (S) and the number of sampling events to estimate confidence level in the
presence of a plume trend (i.e. expanding plume or diminishing plume):
Confidence Level Chart
Total No. of Sampling Events S Value 4 5 6 7 8 9 10 ± 1 ± 2 ± 3
No Trend Indicated
± 4 ± 5 ± 6 Trend May ± 7 Be Present ± 8 (70% ≤ Conf. 90%) ± 9 ± 10 ± 11 “Trend is Present” ± 12 (>90% Confidence) ± 13 ± 14 ± 15
Stability Evaluation Results
❑ No Trend Indicated Stable Plum ❑ Trend May Be Present* (70% ≤ Conf. < 90%):
❑ S<0 Potentially Diminishing Plume
❑ S>0 Potentially Expanding Plume ❑ Trend Is Present (≥ 90% Confidence):
❑ S<0 Diminishing Plume
❑ S>0 Expanding Plume
*Trend May Be Present: For this case, additional monitoring data is required to confirm presence of trend. To proceed with RBCA evaluation, assume stable plume for S<0 and assume expanding plume for S>0.

B-68
WORKSHEET #4e: STATISTICAL EVALUATION OF PLUME STABILITY, continued
Site Name: Date Completed: Facility ID: Completed By:
SUMMARY OF RESULTS: GROUDNWATER PLUME STABILITY CONDITION INSTRUCTIONS: Record results of statistical trend analysis for each monitoring well located inside plume area. Provide a brief discussion regarding significance of findings. RESULTS OF MANN-KENDALL ANALYSIS
Well ID.
No of Sampling
Events
Mann-Kendall
Statistic, S
Plume Trend
NOTES: Plume Trend: Stable, Potentially Diminishing, Diminishing, Potentially Expanding, or Expanding as determined from Confidence Level Chart.
DISCUSSION Discuss consistency of findings among wells, conclusion regarding total plume stability condition, need for further evaluation, etc.

C-1
APPENDIX C Site-Specific Data Requirements and Attachments

C-2
Table C-1: Data Requirements Checklist INSTRUCTIONS
1. Ensure you have attached all required and relevant data
for each applicable Option shown below. 2. Place each data requirement in the order shown below for
the Tier 2 Risk Assessment report.
Data requirements for each Option are checked below
DATA REQUIREMENTS FOR EACH OPTION OPTION 1 OPTION 2 OPTION 3 OPTION 4
Figure C-1 Site Map
Figure C-2 Vicinity Map
Figure C-3 Groundwater Elevation Maps
a
Figure C-4 Contaminant Iso-Concentration Maps
a
Figure C-5 Electron Acceptor or Metabolic By-Product
Iso-Concentration Mapsb
na
Figure C-6 Example Graph of Groundwater Elevation,
Dissolved Oxygen and Benzene Over Time
na
Figure C-7 Example Graph of Groundwater Elevation and
Free Product Thickness Over Time
na
Table C-2 Soil Closure and Confirmation Sample
Analytical Results
Table C-3 Groundwater Closure Sample Analytical
Results
a
Table C-4 Groundwater Monitoring Analytical Results
na
Table C-5 Contaminant and Electron Acceptor or
Metabolic By-Product Analytical Results
na
Table C-6 Logs of Monitoring Wells, Borings, Drive
Points and Test Pits
na
Table C-7 Hydraulic Testing
na
Table C-8 Cross-Section Requirements
• Subsurface Investigation Report (must contain all of the
above-listed data requirements). You may attach a complete report or applicable portions of the Subsurface Investigation Report.
NOTES: a= condition may apply if groundwater is impacted.;a na = condition is not applicable or is optional.
b = Examples of electron acceptors that may need sampling and mapping include dissolved oxygen, sulfate, nitrate and ferrous iron (Fe+2). Note, however, that the sampling efforts and maps are valid only for those electron acceptors that show a positive inverse correlation to contaminant plumes.

C-3
Figure C-1: Site Mapa Required for All Options
NORTH
⇑ |________________|
feet Check each item below to ensure they are included on the site mapa. If you generate your own maps, make sure you have plotted all of the following features:
Map to scale showing bar scale Monitoring Wells, identification, and locations North arrow Sampling locations Current and/or former UST systems Soil stockpiles, treatment areas, other
(tanks, piping, dispensers; indicate product type for each) Excavations Other sources of contamination (ASTs, other) Buildings and structures; indicate residential
buildings Location of the release, known contamination, and source area Utility lines (underground) Land use of adjacent and nearby properties Property lines Roads Geographic land features (surface water,
wetlands, other)

C-4
Figure C-2: Vicinity Map Required for all Options
NORTH
⇑ |________________|
feet Check each item below to ensure they are included on the site map. If you generate your own maps, make sure you have plotted all of the following features:
Map to scale showing bar scale Roads North arrow Utility lines (underground) Site location Buildings and structures; indicate Property lines residential buildings Monitoring Wells, identification, and locations Excavations Geographic land features (surface water, wetlands, other) Sampling locations Land use of adjacent and nearby properties

C-5
Figure C-3: Groundwater Elevation Maps Required for Options 2, 3 and 4
(feet above mean sea level or other datum)
NORTH
⇑ |________________|
feet Check each item below to ensure they are included on the map. If you generate your own maps, make sure you have plotted all of the following features:
Same features as shown on the site and/or vicinity maps Date on which groundwater elevation was measured
Groundwater elevation measurement in feet above mean sea level Contour lines, labeled for each monitoring point (all wells must be surveyed to a common datum)

C-6
Figure C-4: Contaminant Iso-Concentration Maps (Prepare Separate Soil and Groundwater Maps)
Required for Options 2, 3 and 4 (mg/kg for soil and mg/L for groundwater)
NORTH
⇑ |________________|
feet Check each item below to ensure they are included on the site map. If you generate your own maps, make sure you have plotted all of the following features:
Same features as shown on the site and/or vicinity maps Date on which samples were collected Contaminant concentrations for each monitoring point Contour lines for each contaminant, labeled Locations of cross-sections, preferably on soil
iso-concentration maps

C-7
Figure C-5: Electron Acceptor or Metabolic By-Product Iso-Concentration Maps Required for Options 3 and 4
(mg/L, or other applicable units)
NORTH
⇑ |________________|
feet Check each item below to ensure they are included on the site map. If you generate your own maps, make sure you have plotted all of the following features: (NOTE: One constituent per map)
Same features as shown on the site and/or vicinity maps Date on which parameter was measured Electron acceptor concentrations for each monitoring point Contour lines for each parameter, labeled

C-8
Figure C-6Example Graph of Depth to Groundwater
and Benzene Over Time
0.0
0.2
0.4
0.6
0.8
1.0
1.2
1.4
4/12/9
35/1
7/94
2/7/95
11/16
/958/1
9/96
5/19/9
72/9
/982/4
/002/8
/0111
/16/01
8/21/0
2
date sampled
cont
amin
ant c
once
ntra
tion,
mg/
L
37
38
39
40
41
42
43
44
45
46
47
dept
h be
low
land
sur
face
BenzeneDepth to water, ft

C-9
Figure C- 7 Example Graph of Depth to Groundwater and Free Product Thickness Over Time
0.0
0.5
1.0
1.5
2.0
2.5
3.0
3.5
4/1/93
5/1/93
6/1/93
7/1/93
8/1/93
9/1/93
10/1/
9311
/1/93
12/1/
931/1
/942/1
/943/1
/944/1
/945/1
/946/1
/947/1
/948/1
/949/1
/9410
/1/94
11/1/
94
date measured
Free
Pro
duct
Thi
ckne
ss, f
eet
0
2
4
6
8
10
12
14
16
18
20
Dep
th to
Gro
undw
ater
,fe
et b
elow
land
sur
face
FP ThicknessDTW

C-10
Table C-2
Soil Closure and Confirmation Sample Analytical Results mg/kg
Closure
Confir- mation
b
SAMPLE NAMEa
check
the spaces below that
apply
check
the spaces below that
apply
DEPTH (feet below
land surface)
DATE SAMPLED
BENZENE
TOLUENE
ETHYL- BENZENE
XYLENES
NAPHTHA-LENE
MTBE
TPH
a Sample names must accurately correspond to samples names and locations on the site map. b Confirmation samples represent contamination remaining in place.

C-11
Table C-3
Groundwater Closure Sample Analytical Results mg/L
SAMPLE NAMEa
DEPTH to GROUND-
WATER (feet below
land surface)
DEPTH OF GROUND-WATER SAMPLE (feet below
land surface)
DATE
SAMPLED
BENZENE
TOLUENE
ETHYL-
BENZENE
XYLENES
NAPHTHA-
LENE
MTBE
TPH
REMARKS
a Sample names must accurately correspond to samples names and locations on the site map.

C-12
Table C-4
Groundwater Monitoring Analytical Results for Contaminants
mg/L
Sample Namea
Date Sampled
Depth to GW
(feet bg)
Free Product
Thickness (feet)
Benzene Toluene Ethyl- Benzene Xylenes Naphtha-
Lene MTBE TPH
Remarks (analytical
method, other)
a Sample names must accurately correspond to samples names and locations on the site map.

C-13
Table C-5
Groundwater Monitoring Analytical Results for Contaminants and Electron Acceptors
mg/L
Sample Namea
Date
Sampled
Depth to
GW (feet bg)
Free Product Thickness (feet)
Benzene
Toluene
Ethyl-
Benzene
Xylenes
Naphtha
- lene
MTBE
TPH
Dissolved Oxygen
Nitrate
Sulfate
Ferrous
Iron
a Sample names must accurately correspond to samples names and locations on the site map.

C-14
Table C-6:Example of Required Information for Logs of Monitoring Wells, Borings, Drive Points and Test Pits
Depth,
feet below land
surface
Well Construction Details
Organic Vapor
Readings
Blow Counts
per foot
Description of Subsurface Soils, Soil Classification
Traffic protection box Bentonite seal Casing Screened interval Filter pack Other
Describe the Below-Listed
Features for the Entire Vertical Interval
Depth to Groundwater Soil type Color of soil Moisture and dryness Compaction Organic matter, other debris Observed contamination Odors Other features

C-15
Table C-7: Hydraulic Tests: Pump Test and/or Slug Test Data and Results
Ensure you have met the requirements shown in the chart below. Attach your raw and resolved field data here.
See Worksheet #2 for Additional Specific Requirements for Hydraulic Tests
Option 1
Option 2
Option 3
Option 4
HYDRAULIC
CONDUCTIVITY
Optional to perform slug
tests at minimum of 2 representative locations
Optional to perform slug
tests at minimum of 2 representative locations
Required:
Perform slug tests at minimum of 3 representative locations
Required:
Perform slug tests at minimum of 4 representative locations or
Perform pumping test at minimum of 1 representative location
OTHER HYDRAULIC
TEST FIELD MEASUREMENTS
Transmissivity Other, (e.g., storage
coefficient)
Optional to measure
other hydraulic parameters. Check the applicable below:
Transmissivity Other, specify (e.g.,
storage coefficient) _______________ _______________ Other______________
____________________ ____________________
Optional to measure
other hydraulic parameters. Check the applicable below:
Transmissivity Other, specify (e.g.,
storage coefficient) _______________ _______________ Other______________
________________________________________
Optional to measure
other hydraulic parameters. Check the applicable below:
Transmissivity Other, specify (e.g.,
storage coefficient) _______________ _______________ Other______________
________________________________________
Optional to measure
other hydraulic parameters. Check the applicable below:
Transmissivity Other, specify (e.g.,
storage coefficient) _______________ ______________ Other______________
________________________________________

C-16
Table C-8: Cross-Section Requirements
Cross-sections, or profiles, aid in determining the extent and degree of contaminant areas relative to
receptors. Cross-sections must be drawn to an appropriate horizontal and vertical scale, and include the following features:
Two vertical axes with one showing depth in feet below land surface with ground surface being represented by “0 feet,” and the other showing relative elevation so that accurate surface topography is depicted.
Location of the water table including a maximum, minimum, and current location with the dates
of each properly labeled.
Locations of subsurface utility lines.
Locations of UST systems.
Locations of buildings, streets, highways, surface water bodies, other relevant features and receptors.
Locations of borings, probes and monitoring wells to their full depth showing sample intervals,
well screen intervals.
Sediment type.

D-1
APPENDIX D Calculations for
Site-Specific Cleanup Levels (SSCLs)

D-2
Exposure and Cross-Media Transport Equations The exposure and cross-media transport equations provided in this Table D-1 are taken directly from ASTM (1995) and GSI (1995). The equations are tools to manually estimate cleanup levels based on site-specific parameter values. Commercially available electronic spreadsheets may be used in place of the manual equations shown in this section. Whether the equations are solved manually or electronically, the calculated SSCLs and the actual contaminant concentrations must be shown on completed Tables A-1 through A-3 (Appendix A). Instructions If manually solving the equations, show your work in the spaces provided or in a similar format. Use the units shown in ASTM, 1995. Use Worksheet #2 (Appendix A) and Table D-2 for the appropriate parameter values required by the equations. The parameters values in Table D-2 may not be varied.

D-3
Table D-1
Exposure Medium Exposure Route Exposure Equation D.1. Air Inhalation,
Carcinogens
mgg 10
ED EF x IR SF365days/yr AT BW TER =
air mug RBSL 3
airi
c3c-air
μ×
×××××
Inhalation non-carcinogens
mgg 10
ED EF IR
365days/yr AT BW RfD THQ =
air mug RBSL 3
air
nci
3nc-airμ
×××
××××
D.2. Groundwater Ingestion, carcinogens
ED EF IR SF365days/yr AT BW TER =
waterLmg RBSL
watero
cc-wing ×××
×××
Ingestion, non-carcinogens
ED EF IR
365days/yr AT BW RfD THQ =
waterLmg RBSL
water
nco
nc-wing ××
××××

D-4
Exposure Medium Exposure Route Exposure Equation
D.3. Groundwater Indoor air
(enclosed space) vapor inhalation, carcinogens
mg/ug 10 VF
RBSL = waterLmg RBSL 3-
wesp
c-airc-wesp ×
Indoor air (enclosed space) vapor inhalation, non-carcinogens
mg/ug 10 VF
RBSL = waterLmg RBSL 3-
wesp
nc-airnc-wesp ×
D.4. Groundwater Outdoor air (ambient) Vapor inhalation Carcinogens
mg/ug 10 VF
RBSL = waterL
mg RBSL 3-
wamb
c-airc-wamb ×⎥⎦
⎤⎢⎣⎡
Outdoor air (ambient) vapor inhalation Non-carcinogens
mg/ug 10 VF
RBSL = watermg/L RBSL 3-
wamb
nc-airnc-wamb ×

D-5
Exposure Medium Exposure Route Exposure Equation
D.5. Subsurface Soil
Leaching to groundwater (GW ingestion) Carcinogens
LFRBSL =
kgmg RBSL
w-s
c-wingc leach,-s ⎥
⎦
⎤⎢⎣
⎡
Leaching to groundwater (GW ingestion)
Non-carcinogens
LFRBSL = soil
kgmg RBSL
w-s
nc-wingnc leach,-s ⎥
⎦
⎤⎢⎣
⎡
D.6. Subsurface Soil
Indoor air (enclosed space) vapor inhalation
Carcinogens
ugmg 10
VFRBSL = soil
kgmg RBSL 3-
sesp
c-airc-sesp ×⎥
⎦
⎤⎢⎣
⎡
Indoor air (enclosed space) vapor inhalation Non-carcinogens
ugmg 10
VFRBSL = soil
kgmg RBSL 3-
sesp
nc-airnc-sesp ×⎥
⎦
⎤⎢⎣
⎡
D.7. Subsurface Soil Outdoor air (ambient) vapor inhalation
Carcinogens
mg/ug 10 VF
RBSL = soilkgmg RBSL 3-
samb
c-airc-samb ×⎥
⎦
⎤⎢⎣
⎡
Outdoor air (ambient) vapor inhalation Non-carcinogens
mg/ug 10 VF
RBSL = soilkgmg RBSL 3-
samb
nc-airnc-samb ×⎥
⎦
⎤⎢⎣
⎡

D-6
Exposure Medium Exposure Route Exposure Equation
D.8. Surface Soil Ingestion of soil, inhalation of vapors and particulates, and dermal contact (e.g., excavated soils
stockpiles, land farms) Carcinogens
( ) PEF)] + VF( IR SF( + RAF M SA+ RAF IR mgkg
10 SF[( ED EF
365days/yr AT BW TER = soilkgug
RBSLssairidosoil
6-o
cc-ss
××××××××
×××⎥⎦
⎤⎢⎣
⎡
Ingestion of soil, inhalation of vapors and particulates, and dermal contact (e.g., excavated soils stockpiles, land farms) Non-carcinogens
RfDPEF) + VF( IR( +
RfD
))RAF M SA+ RAF IR( mgkg
10( ED EF
365days/yr AT BW THQ = soilkgug RBSL
i
ssair
o
dosoil6-
ncnc-ss
×××××
×
×××⎥⎦
⎤⎢⎣
⎡

D-7
Cross-Media Exposure Route and Equations
D.9. VFss: Surface Soil Volatilization Factor
g - mkg - cm 10
)H + k + (HD
U2W
= soil)(mg/kg
air) mmg( VF 3
33
asssws
effs
airair
sss
3
or
g - mkg - cm 10
Ud W
= soil(mg/kg
air) mmg( VF 3
33
airair
sss
3
whichever is lessD.10. PEF: Particulate Emission Factor
g - mkg - cm 10
UW P =
soil)(mg/kgair) mmg( PEF
3
33
airair
e
3
D.11. VFsamb: Subsurface Soil Volatilization to Outdoor (ambient) Air
g - m
g - cm 10
WDLU + 1 H + k +
H =
soilmg/kgair mmg VF 3
33
effs
sairairasssws
ssamb
3

D-8
Cross-Media Exposure Route and Equations
D.12. VFsesp: Subsurface Soil Volatilization to Enclosed Space (indoor air)
kg - mkg - cm 10
LDL/D +
L ERL/D + 1
L ERL / D
]H + k + [H
= soil)(mg/kg
air) mmg( VF 3
33
crackeffcrack
seffs
B
seffs
B
seffs
asssws
s
sesp
/
3
D.13. VFwamb: Groundwater Volatilization Factor to Outdoor (ambient) Air
mL 10
WDLU + 1
H = water)(mg/L
air) mmg( VF 33
effws
GWairairwamb
3
D.14. VFwesp: Groundwater Volatilization Factor to Indoor Air (enclosed space)
mL/ 10
L / DL / D +
L ERL / D + 1
L ERL / D H
= watermg/L
air mmg VF 33
crackeffcrack
GWeffws
B
GWeffws
B
GWeffws
wesp
3

D-9
Cross-Media Exposure Route and Equations
D.15. Ksw: Soil Leachate Partition Factor
( ) ( )θρθρ
assws
sw-s H + Kd +
= soil-mg/kg
water-mg/L K××⎥
⎦
⎤⎢⎣
⎡
D.16. LDF: Soil Leachate-Groundwater Dilution Factor
or use D.17 below
D.17. LFsw: Leaching Factor, soil to groundwater
( ) ( )( ) ⎟⎠
⎞⎜⎝
⎛××
××W I U + 1 x H + Kd +
= soil-mg/kg
water-mg/L LFgwdarcy
assws
sw-s
δθρθ
ρ
D.18. Deff
s: Effective Diffusivity in Vadose Zone Soils
⎥⎦
⎤⎢⎣
⎡⎥⎦
⎤⎢⎣
⎡⎥⎦
⎤⎢⎣
⎡
θθ
θθ
2T
3.33ws
wat
2T
3.33asair
2effs
HD+ D = cm D
sec
WI U + 1 = less)(dimension LDF gwdarcy
×× δ

D-10
Cross-Media Exposure Route and Equations D.19. Deff
ws: Effective Diffusivity above the Water Table
( )⎥⎥⎦
⎤
⎢⎢⎣
⎡+⎥
⎦
⎤⎢⎣
⎡effs
veffcapf
capf-1
vcapf
2effws D
hDh h + h = cm D sec
D.20. Deff
crack: Effective Diffusivity through Foundations Cracks
⎥⎦
⎤⎢⎣
⎡⎥⎦
⎤⎢⎣
⎡⎥⎦
⎤⎢⎣
⎡
θθ
θθ
2T
3.33wcrack
wat
2T
3.33acrackair
2effcrack
HD + D = cm D sec
D.21. Deff
wcap: Effective Diffusivity through the Capillary Fringe
⎥⎦
⎤⎢⎣
⎡⎥⎦
⎤⎢⎣
⎡⎥⎦
⎤⎢⎣
⎡
θθ
θθ
2T
3.33wcap
wat
2T
3.33acapair
2effcapf
HD + D = cm D sec

D-11
Equations for solving Lateral Groundwater Dilution Attenuation Factor
D.22. Solute Transport with First-Order Decay
⎟⎟⎠
⎞⎜⎜⎝
⎛⎟⎟
⎠
⎞
⎜⎜
⎝
⎛⎟⎟⎠
⎞⎜⎜⎝
⎛
⎥⎥⎦
⎤
⎢⎢⎣
⎡+
x2S erf
x4S erf
URa
1 2
x = CC
z
d
y
w
tran
ixi
xsi
(x)i
αα
λα
41exp
ix
si
CC
DAF)(
=
Parameters shown below are not in Worksheet #2 C(x)i Concentration of constituent i at distance x Csi Concentration of constituent i in source zone Sd Source depth (cm) Sw Source width (cm) erf Complementary error function. x Distance down-gradient of source (cm) λi First-order degradation rate (day-1) for constituent i D.23. Solute Transport with Biodegradation by Electron Acceptor Superposition Model
( ) CB - x4
S erf x4
S erf CB + C = C iz
d
y
wisi(x)i
⎥⎥⎦
⎤
⎢⎢⎣
⎡⎟⎟⎠
⎞⎜⎜⎝
⎛⎟⎟⎠
⎞⎜⎜⎝
⎛
αα
C C CB = CB
si
siTi Σ
UF
C(ea) = CBn
nT Σ
CC = NAF
(x)i
si
Parameters shown below are not in Worksheet #2
NAF Natural Attenuation Factor, or Dilution-Attenuation Factor (DAF)

D-12
Equations for solving Lateral Groundwater Dilution Attenuation Factor
D. 24. Lateral Air Dispersion Factor
( )⎟⎟⎠
⎞⎜⎜⎝
⎛⎟⎟⎠
⎞⎜⎜⎝
⎛⎟⎟⎠
⎞⎜⎜⎝
⎛⎟⎟⎠
⎞⎜⎜⎝
⎛×
σδ
σδ
σσσπ 2z
air2
2z
air2
2y
2
zyairsi
i
2) +(z - +
2 -z -
2y-
U2Q =
CC(x) expexpexp
( ) ( )L
A U = Q airair δ
Air Dispersion Factor (ADF) CC = ADF
(x)i
si
Air Dispersion Coefficient (σ) σy = 10(LOG(plume length) x 0.941 – 0.861) σz = 10(LOG(plume length) x 0.927 – 1.01)

D-13
Cross-Media Exposure Route and Equations
D.25. Natural Attenuation Factor (NAF), field-measured empirical method:
point sampling receptor, gradient-down at ionconcentrat tcontaminan sourceat ionconcentrat tcontaminan = NAF
D.26. Groundwater Seepage/Transport Velocity (Utran):
θ efftran
i K = U
D.27. Contaminant Retardation (R): (Calculate only if you have reliable data for the input parameters)
( )foc X Koc x + 1 = Reff
s
θρ
D.28. Contaminant Velocity (Cv): (Use groundwater velocity if retardation parameters are uncertain or highly variable)
RU = Cv tran
D.29. Distribution/Partitioning Coefficient (Kd) (for organic chemicals only)
foc Koc = Kd ×

D-14
Calculating Site-Specific Cleanup Levels
D.30. Site-Specific Cleanup Levels (SSCLs)
NAF RBSL = SSCL ii ×
NAF = Natural Attenuation Factor, unitless (see equation D.25 above). The NAF may be derived
empirically from field data or derived from modeling, if applicable. The NAF may include the ADF for wind-born contamination (equation D.24) and the DAF for contaminants dissolved in groundwater (equations D.22 and D.23).

D-15
Table D-2: TPH Fraction-Specific a and Chemical-Specific Property
a and Toxicity Values
TPH Fractions
and Chemicals
showing
Carbon Number
and
Representative
CAS number
EPA Analy-
tical Method
b
Mole-
cular
weight
(g/mol)
Vapor
Pressure
c
(mm Hg)
Henry’s
Law
Constantd
(L-H2O/
L-air,
unitless)
Diffusion
Coefficient in
Air e
(Dair
, cm2/s)
Diffusion
Coefficient
in Water e
(Dw, cm
2/s)
Aqueous
Solubility
(20-25o C)
(pure
compound)
(mg/L)
Adsorption
Coefficient
(Koc)
(mL/g)
Cancer Slope
Factor, Oral
(SFo)
(kg-day/mg)
Cancer
Slope
Factor,
Inhalation
(SFi)
(kg-day/mg)
Reference
Dose, Oral
(RfDo)
(mg/kg-day)
Reference
Dose,
Inhalation
(RfDi)
(mg/kg-day)
ALIPHATICS
C5-C6
110-54-3
(hexane)
8260B 81 2.66 E+02 g 4.10 E+01 8.57 E-02 8.34 E-06 3.60 E+01 6.30 E+02 - - 6.00 E-02
h 6.00 E-02
h
C7-C8
142-82-5
(heptane)
8260B 100 4.80 E+01 7.70 E+01 6.69 E-02 6.89 E-06 5.40 E+00 3.16 E+03 - - 6.00 E-02 h 6.00 E-02
h
C9-C10
111-84-2
(nonane)
8260B 130 5.00 E+00 1.60 E+02 6.44 E-02 5.90 E-06 4.30 E-01 3.16 E+04 - - 1.00 E-01 i 2.90 E-01
i
C11-C12
1120-21-4
(undecane)
8270B 160 4.80 E-01 1.60 E+02 4.60 E-02 5.19 E-06 3.40 E-02 3.16 E+05 - - 1.00 E-01 i 2.90 E-01
i
C13-C16
544-76-3
(hexadecane)
8270B 200 3.60 E-02 1.60 E+02 3.95 E-02 4.50 E-06 7.60 E-04 5.00 E+06 - - 1.00 E-01 i 2.90 E-01
i
C17-C21
629-78-7
(heptadecane)
8270B 270 8.40 E-04 1.10 E+02 3.28 E-02 3.76 E-06 2.50 E-06 4.00 E+08 - - 2.00 E+00 i na
i
C22-C35
629-78-7
(heptadecane)
8270B 280 8.40 E-04 1.10 E+02 3.28 E-02 3.76 E-06 1.50 E-06 4.00 E+08 - - 2.00 E+00 i na
i

D-16
TPH Fractions
and Chemicals
showing Carbon
Number
and
Representative
CAS number
EPA
Analy-
tical
Method
b
Mole-
cular
weight
(g/mol)
Vapor
Pressure
c
(mm Hg)
Henry’s
Law
Constantd
(L-H2O/
L-air,
unitless)
Diffusion
Coefficient in
Air e
(Dair
, cm2/s)
Diffusion
Coefficient
in Water e
(Dw, cm
2/s)
Aqueous
Solubility
(20-25o C)
(pure
compound)
(mg/L)
Adsorption
Coefficient
(Koc)
(mL/g)
Cancer
Slope
Factor, Oral
(SFo)
(kg-day/mg)
Cancer
Slope
Factor,
Inhalation
(SFi)
(kg-day/mg)
Reference
Dose, Oral
(RfDo)
(mg/kg-day)
Reference
Dose,
Inhalationf
(RfDi)
(mg/kg-day)
AROMATICS
Benzene C6
71-43-2 8260B 78.11 9.50 E+01 2.25 E-01 8.80 E-02 9.80 E-06 1.78 E+03 8.12 E+01 2.90 E-02
j 2.90 E-02
j - -
Toluene C7
108-88-3 8260B 92.13 2.85 E+01 2.74 E-01 8.57 E-02 8.60 E-06 5.15 E+02 2.34 E+02 - - 8.00 E-02
j 1.43 E+00
j
Ethylbenzene
C8
100-41-4
8260B 106.2 9.50 E+00 3.58 E-01 7.50 E-02 7.80 E-06 1.52 E+02 5.37 E+02 - - 1.00 E-01 j 2.90 E-01
j
Xylenes C8
1330-20-7 1
8260B 106.2 8.59 E+00 2.52 E-01 7.85 E-02 8.90 E-06 1.98 E+02 5.86 E+02 - - 2.00 E-01 j 2.90 E-02
j
Naphthalene
C10
91-20-3
8260B 128.19 2.76 E-01 1.74 E-02 5.90 E-02 7.50 E-06 3.10 E+01 8.44 E+02 - - 2.00 E-02 k 8.60 E-04
k
Methyl t-Butyl
Ether (MtBE)
1634-04-04 m
8260B 88.146 2.49 E+02 2.40 E-02 7.92 E-02 9.41 E-05 4.30 E+04 1.20 E+01 - - 5.00 E-03
o 8.57 E-01
k
C9-C10
(alkyl benzenes)
8260B 120.2 –
176.2 5.00 E+00 4.20 E-01 6.00 E-02 7.51 E-06 1.10 E+02 1.26 E+03 - - 4.00 E-02
i 6.00 E-02
i
C11-C13
(total alkyl
naphthalenes) n
8270B 142.2 –
176.2 5.00 E-02 2.30 E-02 4.80 E-02 7.67 E-06 1.45 E+03 7.06 E+03 - - 4.00 E-02
i 6.00 E-02
i
C12-C22 p
(polynuclear
aromatic
hydrocarbons)
8270B 152.21 –
278.35 2.70 E-03 4.12 E-01 3.23 E-02 1.66 E-05 4.86E+01 6.29 E+04 - - 3.00 E-02
i na
i
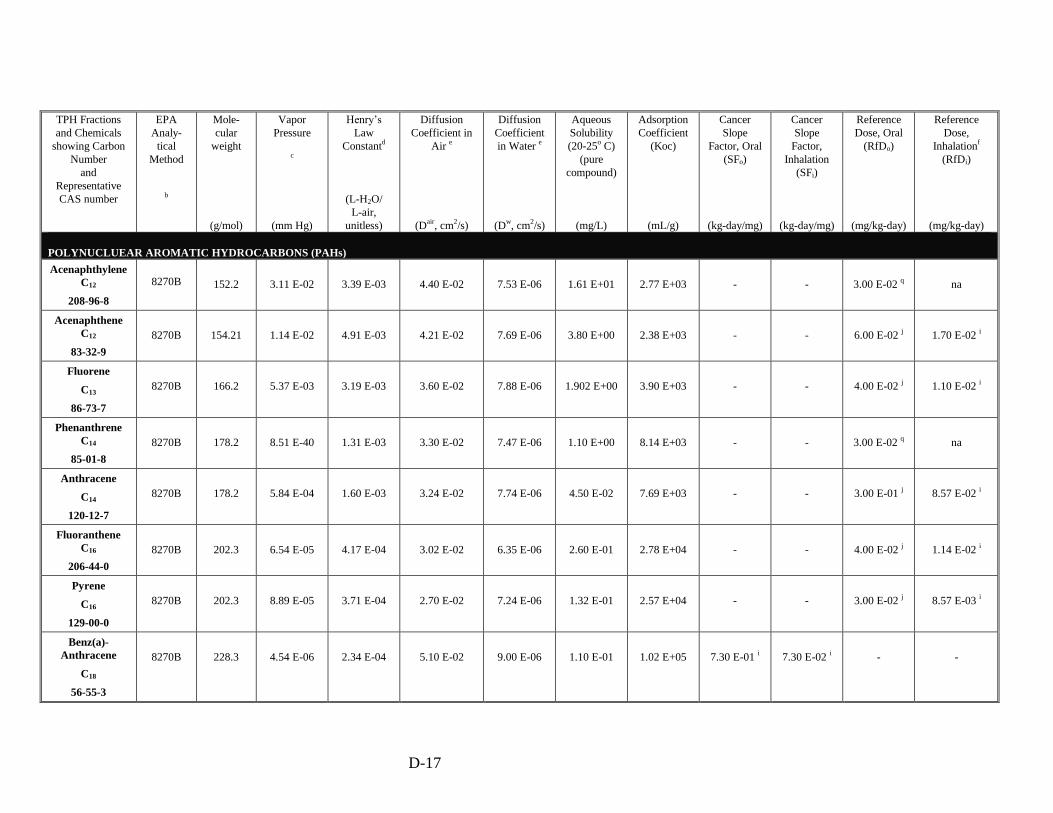
D-17
TPH Fractions
and Chemicals
showing Carbon
Number
and
Representative
CAS number
EPA
Analy-
tical
Method
b
Mole-
cular
weight
(g/mol)
Vapor
Pressure
c
(mm Hg)
Henry’s
Law
Constantd
(L-H2O/
L-air,
unitless)
Diffusion
Coefficient in
Air e
(Dair
, cm2/s)
Diffusion
Coefficient
in Water e
(Dw, cm
2/s)
Aqueous
Solubility
(20-25o C)
(pure
compound)
(mg/L)
Adsorption
Coefficient
(Koc)
(mL/g)
Cancer
Slope
Factor, Oral
(SFo)
(kg-day/mg)
Cancer
Slope
Factor,
Inhalation
(SFi)
(kg-day/mg)
Reference
Dose, Oral
(RfDo)
(mg/kg-day)
Reference
Dose,
Inhalationf
(RfDi)
(mg/kg-day)
POLYNUCLUEAR AROMATIC HYDROCARBONS (PAHs)
Acenaphthylene
C12
208-96-8
8270B 152.2 3.11 E-02 3.39 E-03 4.40 E-02 7.53 E-06 1.61 E+01 2.77 E+03 - - 3.00 E-02 q na
Acenaphthene
C12
83-32-9
8270B 154.21 1.14 E-02 4.91 E-03 4.21 E-02 7.69 E-06 3.80 E+00 2.38 E+03 - - 6.00 E-02 j 1.70 E-02
i
Fluorene
C13
86-73-7
8270B 166.2 5.37 E-03 3.19 E-03 3.60 E-02 7.88 E-06 1.902 E+00 3.90 E+03 - - 4.00 E-02 j 1.10 E-02
i
Phenanthrene
C14
85-01-8
8270B 178.2 8.51 E-40 1.31 E-03 3.30 E-02 7.47 E-06 1.10 E+00 8.14 E+03 - - 3.00 E-02 q na
Anthracene
C14
120-12-7
8270B 178.2 5.84 E-04 1.60 E-03 3.24 E-02 7.74 E-06 4.50 E-02 7.69 E+03 - - 3.00 E-01 j 8.57 E-02
i
Fluoranthene
C16
206-44-0
8270B 202.3 6.54 E-05 4.17 E-04 3.02 E-02 6.35 E-06 2.60 E-01 2.78 E+04 - - 4.00 E-02 j 1.14 E-02
i
Pyrene
C16
129-00-0
8270B 202.3 8.89 E-05 3.71 E-04 2.70 E-02 7.24 E-06 1.32 E-01 2.57 E+04 - - 3.00 E-02 j 8.57 E-03
i
Benz(a)-
Anthracene
C18
56-55-3
8270B 228.3 4.54 E-06 2.34 E-04 5.10 E-02 9.00 E-06 1.10 E-01 1.02 E+05 7.30 E-01 i 7.30 E-02
i - -

D-18
TPH Fractions
and Chemicals
showing Carbon
Number and
Representative
CAS number
EPA
Analy-
tical
Method
b
Mole-
cular
weight
(g/mol)
Vapor
Pressure
c
(mm Hg)
Henry’s
Law
Constantd
(L-H2O/
L-air,
unitless)
Diffusion
Coefficient in
Air e
(Dair
, cm2/s)
Diffusion
Coefficient
in Water e
(Dw, cm
2/s)
Aqueous
Solubility
(20-25o C)
(pure
compound)
(mg/L)
Adsorption
Coefficient
(Koc)
(mL/g)
Cancer Slope
Factor, Oral
(SFo)
(kg-day/mg)
Cancer Slope
Factor,
Inhalation (SFi)
(kg-day/mg)
Reference
Dose, Oral
(RfDo)
(mg/kg-day)
Reference
Dose,
Inhalationf
(RfDi)
(mg/kg-day)
POLYNUCLUEAR AROMATIC HYDROCARBONS (PAHs), continued
Chrysene
C18
218-01-09
8270B 228.3 8.06 E-07 1.80 E-04 2.48 E-02 6.21 E-06 1.50 E-03 8.14 E+04 7.30 E-03 i 7.30 E-03
i - -
Benzo(b)-
Fluoranthene
C20
205-99-2
8270B 252.32 5.07 E-05 8.36 E-04 2.26 E-02 5.56 E-06 1.50 E-03 8.30 E+04 7.30 E-01 i 7.30 E-01
i - -
Benzo(k)-
Fluoranthene
C20
207-08-09
8270B 252.32 3.09 E-08 6.46 E-06 2.26 E-02 5.56 E-06 8.00 E-04 1.21 E+05 7.30 E-02 i 7.30 E-02
i - -
Benzo(a)-
Pyrene
C20
50-32-8
8270B 252.3 1.60 E-07 1.86 E-05 4.30 E-02 9.00 E-06 3.80 E-03 1.31 E+05 7.30 E+00 m 6.10 E+00
m - -
Indeno (1, 2, 3-
Cd) Pyrene
C22
193-39-5
8270B 276.34 7.60 E-07 2.07 E-11 2.30 E-02 4.41 E-06 6.20 E-02 8.00 E+03 7.30 E-01 o 6.10 E-01
o - -
Dibenzo-(a, h)
Anthracene
C122
53-70-3
8270B 278.35 5.20 E-10 1.58 E-05 2.00 E-02 5.24 E-06 5.00 E-04 7.41 E+05 7.30 E-01 o 6.10 E-01
o - -
Benzo (g, h, i)-
Perylene
C22
191-24-2
8270B 268.36 1.69 E-07 3.03 E-05 4.90 E-02 5.56 E-06 3.00 E-04 3.11 E+05 - - 3.00 E-02 q na
q
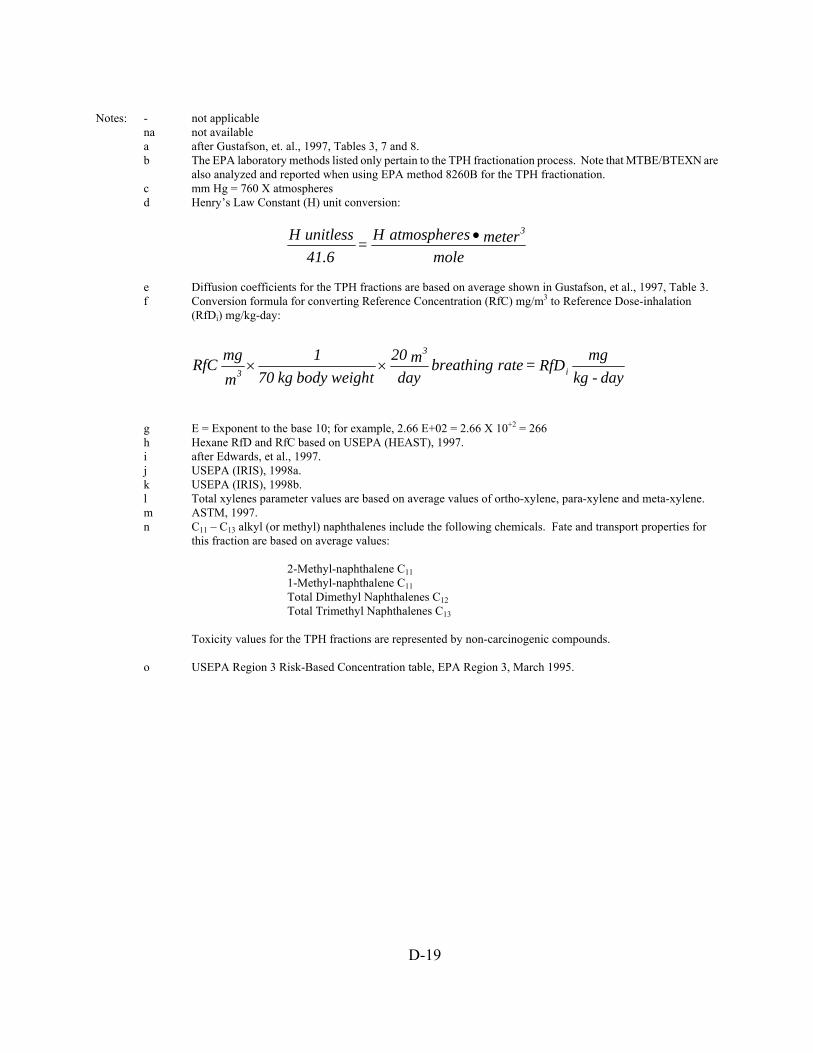
D-19
Notes: - not applicable na not available a after Gustafson, et. al., 1997, Tables 3, 7 and 8.
b The EPA laboratory methods listed only pertain to the TPH fractionation process. Note that MTBE/BTEXN are also analyzed and reported when using EPA method 8260B for the TPH fractionation.
c mm Hg = 760 X atmospheres d Henry’s Law Constant (H) unit conversion:
molemeter satmosphere H =
41.6unitless H 3•
e Diffusion coefficients for the TPH fractions are based on average shown in Gustafson, et al., 1997, Table 3. f Conversion formula for converting Reference Concentration (RfC) mg/m3 to Reference Dose-inhalation
(RfDi) mg/kg-day:
g E = Exponent to the base 10; for example, 2.66 E+02 = 2.66 X 10+2 = 266 h Hexane RfD and RfC based on USEPA (HEAST), 1997. i after Edwards, et al., 1997. j USEPA (IRIS), 1998a. k USEPA (IRIS), 1998b. l Total xylenes parameter values are based on average values of ortho-xylene, para-xylene and meta-xylene. m ASTM, 1997. n C11 – C13 alkyl (or methyl) naphthalenes include the following chemicals. Fate and transport properties for
this fraction are based on average values: 2-Methyl-naphthalene C11 1-Methyl-naphthalene C11 Total Dimethyl Naphthalenes C12 Total Trimethyl Naphthalenes C13 Toxicity values for the TPH fractions are represented by non-carcinogenic compounds.
o USEPA Region 3 Risk-Based Concentration table, EPA Region 3, March 1995.
day-kgmg RfD = rate breathing
daym 20
tbody weigh kg 701
mmg RfC i
3
3××

D-20
p C12 – C22 polynuclear aromatic hydrocarbons include the following chemicals. Fate and transport properties for this fraction are based on average values:
Acenaphthylene C12 Acenaphthene C12 Fluorene C13 Phenanthrene C14 Anthracene C14 Fluoranthene C16 Pyrene C16
*Benz(a)-Anthracene C18 *Chrysene C18 *Benzo(b)-Fluoranthene C20 *Benzo(k)-Fluoranthene C20 *Benzo(a)-Pyrene C20 *Indeno(1,23-Cd) Pyrene C22 *Dibenzo(a,h) Anthracene C22 Benzo(g,h,I) Perylene C22
* = Carcinogenic compounds. If these compounds are detected, SSCLs must be calculated for those compounds using their unique chemical and toxicity parameter values.
Toxicity values for the TPH fractions are represented by non-carcinogenic compounds. q no toxicity data available; values used are for the C17 to C35 aromatic fraction according to Edwards, et al.,
1997

D-21
Table D-3: Determination of RBSL and SSCL Values for Total Petroleum Hydrocarbons (TPH)
1. Sample Collection
• Collect a minimum of one environmental sample that is representative of each contaminated medium (e.g.,
soil and groundwater) and the maximum concentration and composition of the petroleum contamination at the site. For sites where TPH contamination is highly variable in concentration or composition, the user should collect multiple TPH samples at representative locations to ensure a representative analysis by the laboratory.
2. Laboratory Analysis
• Analyze the sample(s) using EPA methods 8260B and 8270B. Specify “Utah TPH Fractionation” on your
chain of custody forms to ensure that the laboratory uses the reporting format specific for TPH fractionation which differs from a typical 8260B and/or 8270B chemical parameter listing. The laboratory should report concentrations for each of the 10 different TPH fractions listed in Table D-2. In addition, on the 8260B report, the laboratory should list values for any detectable BTEXN and MTBE. For fractions where the measured concentration is below the method reporting limit, a value of half the method reporting limit should be used as the representative source area concentration in deriving SSCLs.
3. Determination of Tier 2 RBSLs for Each TPH Fraction
• Fraction-specific RBSL values must be derived for each complete exposure pathway at the site. For each
TPH fraction, RBSL values can be calculated for each relevant exposure pathway using the equations provided on Table D-1 (see Equations D.1 through D.8). Fraction-specific chemical property values and toxicological parameters to be used in the RBSL calculations are provided in Table D-2.
4. Determination of SSCL Values for TPH Fractions
• Under Tier 2 Options 2 through 4, SSCL values for the individual TPH fractions are developed in the same
manner as for any other COCs (e.g., BTEXN AND MTBE). Using the chemical property values and toxicological parameter values listed on Table D-2, a NAF value may be derived for each TPH fraction using the Option 2 through 4 calculation methods. The NAF is then multiplied by the appropriate RBSL value to obtain an SSCL for each complete exposure pathway. The fraction that exceeds its applicable SSCL the most will ultimately drive the cleanup for all the other fractions contained within TPH at the site.
5. Confirmation Sampling for TPH Fractions Following TPH-Driven Cleanup Activities
• After completing cleanup activities that are driven by the exceedence of SSCLs for the TPH fraction(s),
the user should obtain an appropriate number of environmental samples at representative locations and depths in order to verify the effectiveness of the cleanup at the release site. The same procedures described herein would again be employed for comparison with representative source area TPH fractionation values obtained. During cleanup, the user may elect to obtain samples for TPH fractionation, and BTEXN and MTBE (8260B method) if applicable, to measure the relative progress of the cleanup activities and to estimate the cleanup duration.
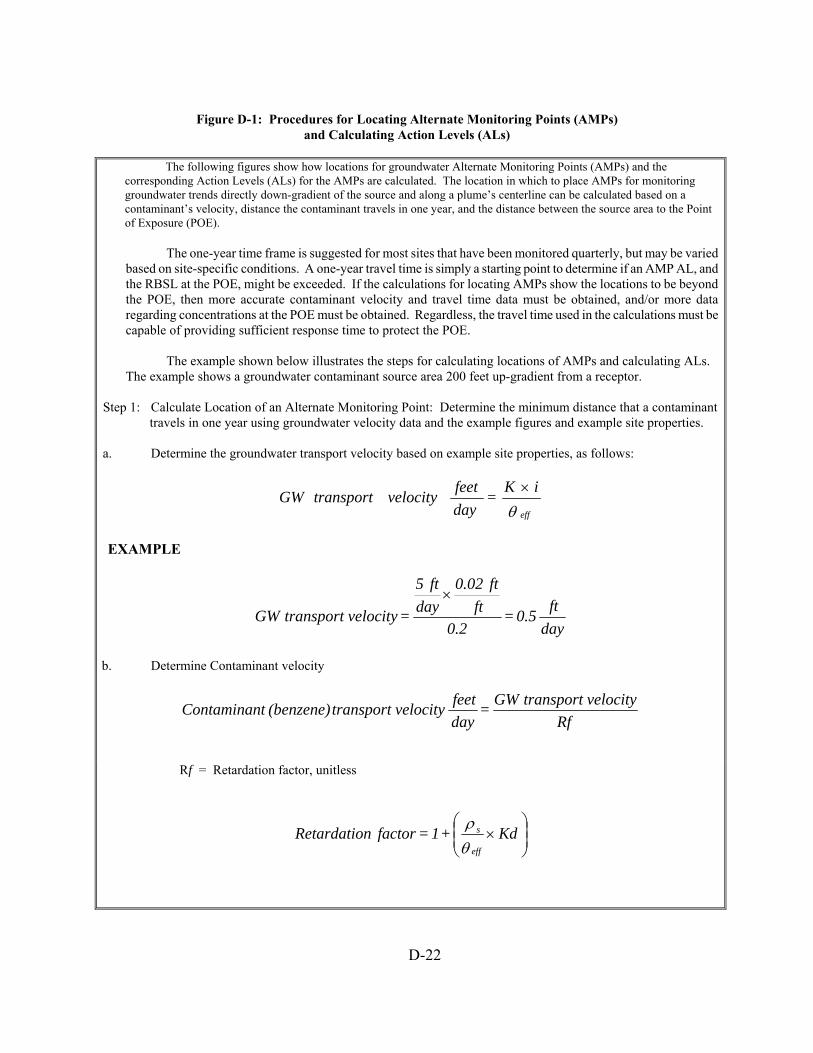
D-22
Figure D-1: Procedures for Locating Alternate Monitoring Points (AMPs) and Calculating Action Levels (ALs)
The following figures show how locations for groundwater Alternate Monitoring Points (AMPs) and the
corresponding Action Levels (ALs) for the AMPs are calculated. The location in which to place AMPs for monitoring groundwater trends directly down-gradient of the source and along a plume’s centerline can be calculated based on a contaminant’s velocity, distance the contaminant travels in one year, and the distance between the source area to the Point of Exposure (POE).
The one-year time frame is suggested for most sites that have been monitored quarterly, but may be varied
based on site-specific conditions. A one-year travel time is simply a starting point to determine if an AMP AL, and the RBSL at the POE, might be exceeded. If the calculations for locating AMPs show the locations to be beyond the POE, then more accurate contaminant velocity and travel time data must be obtained, and/or more data regarding concentrations at the POE must be obtained. Regardless, the travel time used in the calculations must be capable of providing sufficient response time to protect the POE.
The example shown below illustrates the steps for calculating locations of AMPs and calculating ALs.
The example shows a groundwater contaminant source area 200 feet up-gradient from a receptor. Step 1: Calculate Location of an Alternate Monitoring Point: Determine the minimum distance that a contaminant
travels in one year using groundwater velocity data and the example figures and example site properties. a. Determine the groundwater transport velocity based on example site properties, as follows:
θ eff
i K = dayfeetvelocity transport GW ×
EXAMPLE
dayft 0.5 =
0.2ft
ft 0.02 day
ft 5
=velocity transport GW×
b. Determine Contaminant velocity
Rfvelocity transport GW =
dayfeetvelocity transport (benzene) tContaminan
Rf = Retardation factor, unitless
⎟⎟⎠
⎞⎜⎜⎝
⎛× Kd + 1 = factor nRetardatio
eff
s
θρ

D-23
Figure D-1: Procedures for Locating Alternate Monitoring Points (AMPs) and Calculating Action Levels (ALs) continued
step 1, continued EXAMPLE
mL/g 0.05 = 0.001 mL/g 50 = foc Koc = Kd sat ××
1.43 = g
mL 0.05 0.2
cmg 1.7
+ 1 = factor nRetardatio3
⎟⎟⎟⎟
⎠
⎞
⎜⎜⎜⎜
⎝
⎛
×
dayft 0.35 =
1.43day0.5ft
=velocity transport Benzene
c. Solve for distance traveled in 1 year from the up-gradient AMP to the down-gradient POE, as follows: EXAMPLE
feet 127 = day
ft 0.35 days 365 =velocity transport Benzene Time Travel = Distance ××
Step 2: Calculate ALs for the groundwater AMPs. Solve the exposure and cross-media transport equations in the
same way that SSCLs for the source were calculated except the distance entered in the equations will be the distance from the newly placed AMP to the receptor. In the case of this example, that distance would be 127 feet.
Example Parameter Values
Parameter Parameter Symbol Example Parameter Value Hydraulic Conductivity, ft/day K 5 Hydraulic gradient, ft/ft i 0.02 Effective porosity (decimal fraction) θeff 0.2 Soil bulk density, g/cm3* ρs 1.7 Partition coefficient, mL/g Kd Calculated from Koc X foc Benzene adsorption coefficient, mL/g Koc 50 fraction of organic carbon in saturated zone (decimal fraction) focsat 0.001
NOTES: *1 cm3 = 1 mL

D-24
Figure D-1: Example of Locating Alternate Monitoring Points (AMPs) and Calculating Action Levels (ALs)
Gradient
200 feet
Source (POC), SSCLs apply
Receptor (POE), RBSLs apply
Receptor (POE), RBSLs apply
Source (POC), SSCLs apply
75 feet 127 feet
AMP
Gradient
Example: AMP is calculated as being located 127 feet

D-25
TRANSIENT MODELING DATA REQUIREMENTS
Attach input, output and other relevant files. Attach applicable graphics for each time step and for each model used. Provide a detailed discussion in Worksheet #1, Section H, of modeling input that is specific
to the site, and the model output and results.

D-26
Figure D-2: Example of Graphic Modeling Results

D-27
Figure D-3
Example of BIOSCREEN Modeling Results
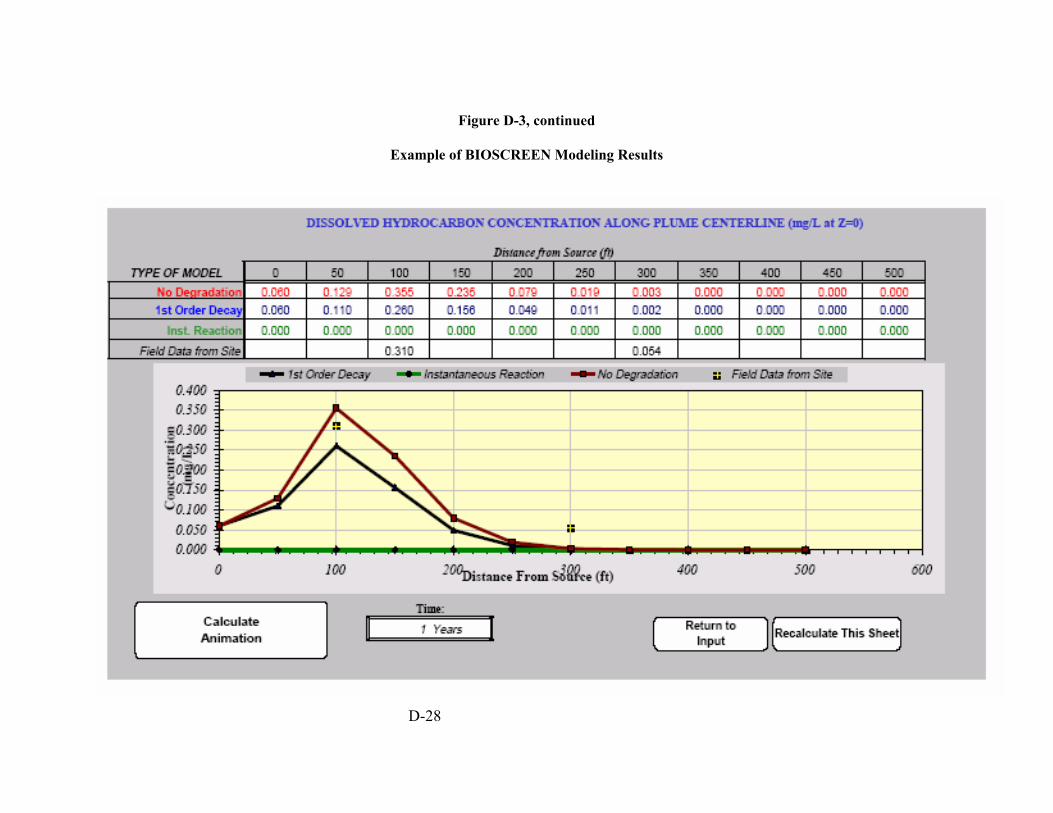
D-28
Figure D-3, continued
Example of BIOSCREEN Modeling Results