guidelines on quality control procedures for data from automatic weather stations igor zahumenský...
TRANSCRIPT
Guidelines on Quality Control
Procedures for Data from
Automatic Weather Stations
Igor Zahumenský (Slovakia, CBS ET/AWS)
Purpose of the Guidelines
Different quality control procedures for the various phases of the data collection process
But Absence of comprehensive QC
at all levels.
Purpose of the Guidelines – cont.
The proposed Guidelines try to overcome this deficiency and present: a comprehensive system of the check procedures and algorithms and
quality control flags
that should be implemented at all levels of data quality control.
Purpose of the Guidelines – cont.
The proposal addresses only: real time QC of data from a single
AWS platform;Beyond the scope of the document: spatial QC; checks against analyzed or predicted
fields; QC of formatting, transmission and
decoding errors.
Cooperation
CBS ET AWS jointly with: CIMO ET SM&MT CCL JCOMM GCOS
will continue with the work in the development of the Guidelines for AWS QC procedures for future publication in WMO Guide on GDPS, CIMO Guide, …
Guidelines on QC Procedures(Outline)
Introduction Chapter I: Definitions Chapter II: Basic QC Procedures Chapter III: Extended QC
Procedures
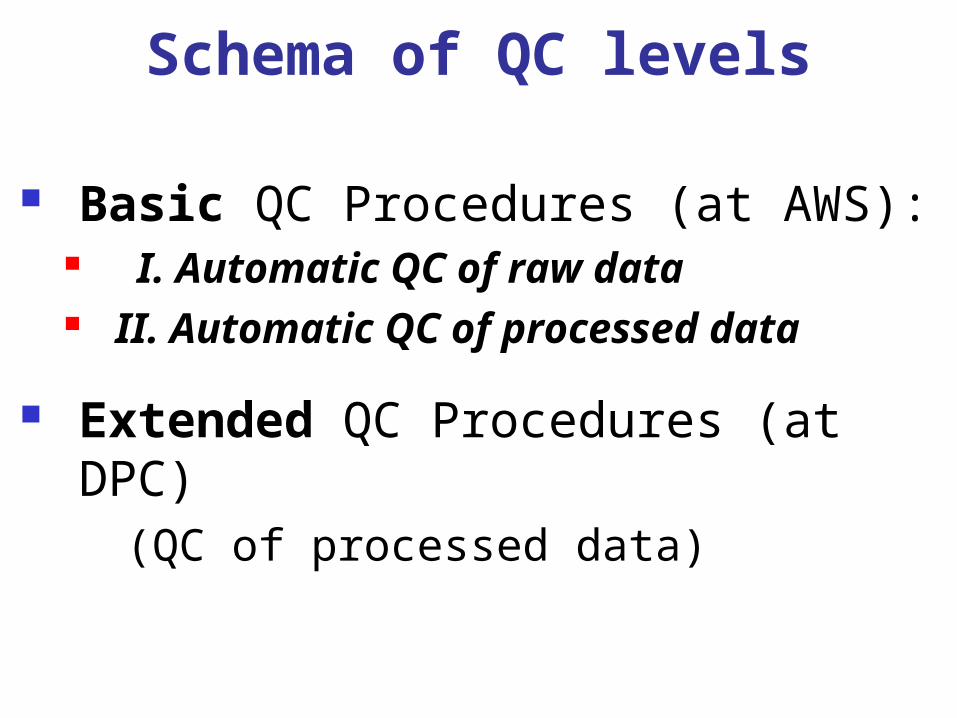
Schema of QC levels
Basic QC Procedures (at AWS): I. Automatic QC of raw data II. Automatic QC of processed data
Extended QC Procedures (at DPC) (QC of processed data)
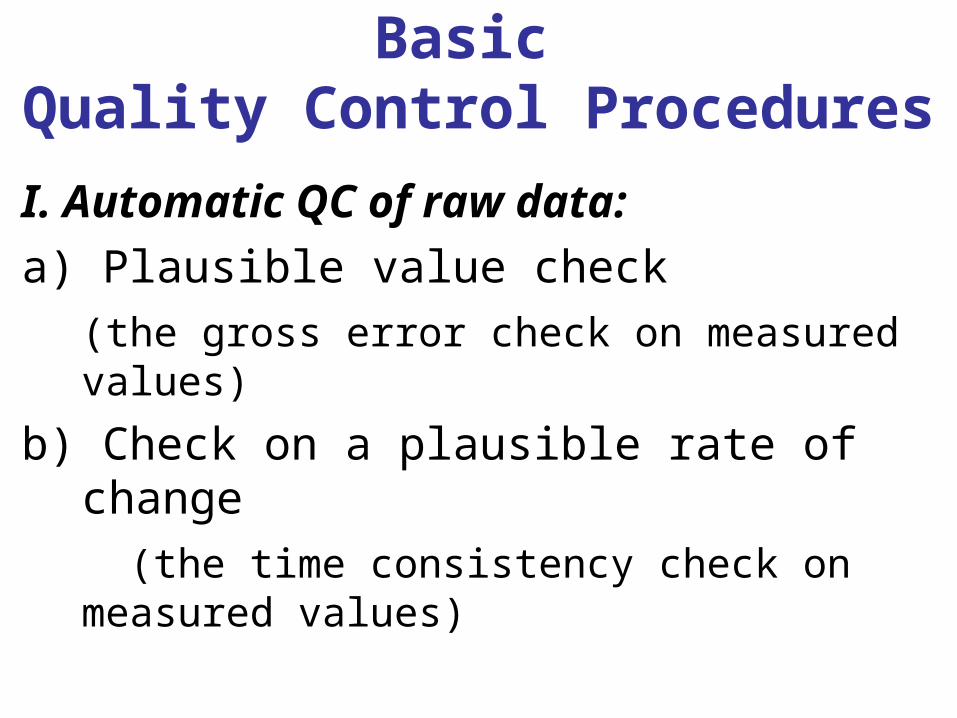
Basic Quality Control Procedures
I. Automatic QC of raw data:a) Plausible value check
(the gross error check on measured values)
b) Check on a plausible rate of change (the time consistency check on
measured values)
Basic Quality Control Procedures – cont.
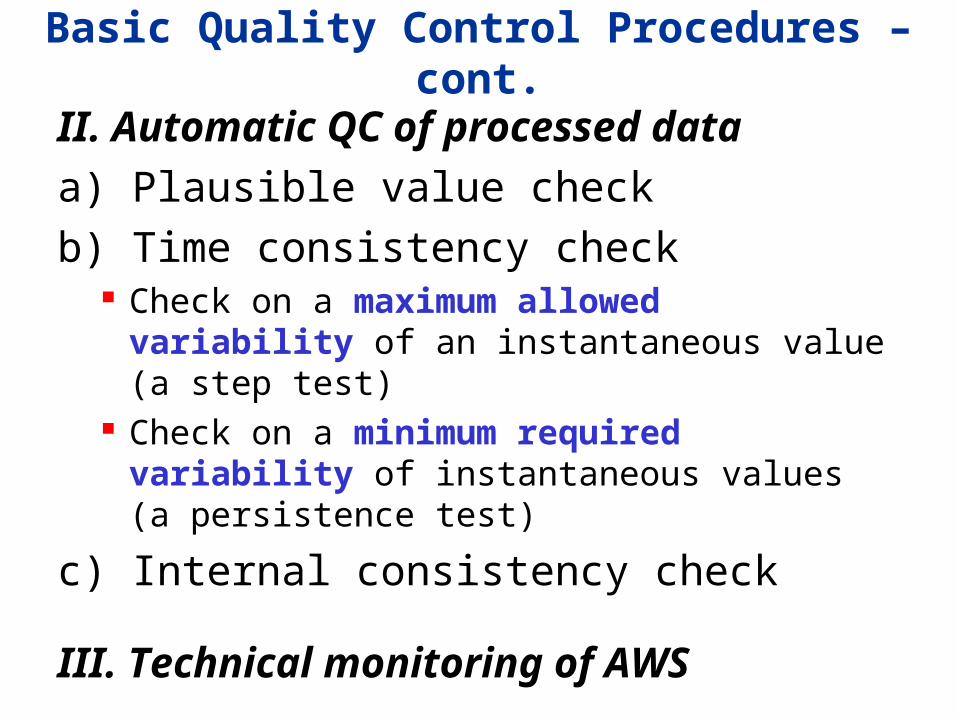
II. Automatic QC of processed dataa) Plausible value check b) Time consistency check
Check on a maximum allowed variability of an instantaneous value (a step test)
Check on a minimum required variability of instantaneous values (a persistence test)
c) Internal consistency check
III. Technical monitoring of AWS
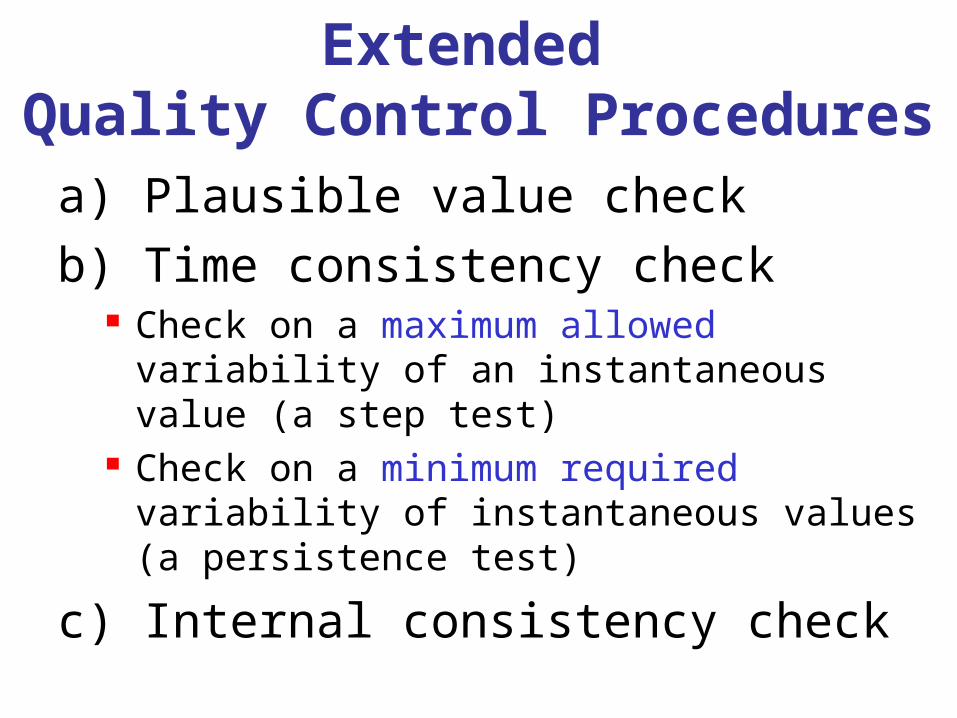
Extended Quality Control Proceduresa) Plausible value check b) Time consistency check
Check on a maximum allowed variability of an instantaneous value (a step test)
Check on a minimum required variability of instantaneous values (a persistence test)
c) Internal consistency check
Result of the QC process
Applying QC procedures, AWS data are: Validated and if necessary: Deleted or Corrected
Feature of QC system
QC system should include procedures for returning to the source of data to: verify them and prevent recurrence of the errors.
WMO documentation
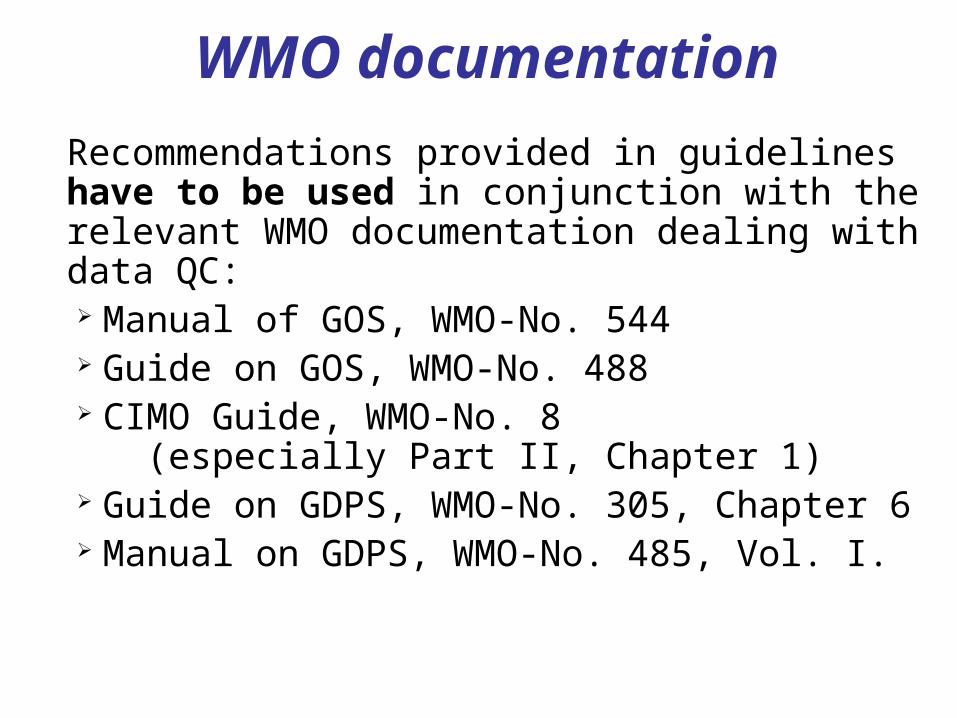
Recommendations provided in guidelines have to be used in conjunction with the relevant WMO documentation dealing with data QC: Manual of GOS, WMO-No. 544 Guide on GOS, WMO-No. 488 CIMO Guide, WMO-No. 8
(especially Part II, Chapter 1) Guide on GDPS, WMO-No. 305, Chapter
6 Manual on GDPS, WMO-No. 485, Vol. I.
CHAPTER I. Definitions of:
Quality Control Quality Assurance Types of errors
Random errors Systematic errors Large errors Micrometeorological errors
Abbreviations used
CHAPTER II.
BASICQUALITY CONTROL
PROCEDURES
BASIC QC PROCEDURES
Applied at an AWS to monitor the quality of sensors’ data prior to their use in computation of weather parameter values;
Designed to remove erroneous sensor information while retaining valid sensor data;
Shall be applied at each stage of the conversion of raw sensor outputs into meteorological parameters;
The outputs of B-QC would be included inside every AWS message.
Basic QC Procedures – cont.
Types of B-QC: Automatic QC of raw data;
(sensor samples – signal measurements)
Automatic QC of processed data.
Automatic QC of raw data
Intended primarily to indicate any sensor malfunction, instability, interference in order to reduce potential corruption of processed data.
The values that fail this QC level shall not used in further data processing.
Automatic QC of processed data
Intended to identify erroneous or anomalous data.
The range of this control depends on the sensors used.
QC flags All AWS data should be flagged; Data QC categories:
good (accurate; data with errors less than or equal to a specified value);
inconsistent (one or more parameters are inconsistent);
doubtful (suspect); erroneous (wrong; data with errors
exceeding a specified value); missing data.
QC flags – cont.
Data quality shall be known & demonstrable;
Data has to pass all checks in the framework of B-QC;
In case of error or missing data additional information should be transmitted.
05/07/05 22
I. Automatic QC of raw data
Plausible value check: the gross error check on measured values
Check on a plausible rate of change:the time consistency check on measured values
05/07/05 23
Plausible value check
The aim of the check is to verify if the values are within the acceptable range limits;
Each sample shall be examined if its value lies within the measurement range of a pertinent sensor;
If the value fails the check it is rejected and not used in further computation of a relevant parameter.
05/07/05 24
Check on a plausible rate of change
The aim of the check is to verify the rate of change (unrealistic jumps in values).
The check is best applicable to data of high temporal resolution (a high sampling rate) as the correlation between the adjacent samples increases with the sampling rate.
05/07/05 25
Check on a plausible rate of change - cont.
After each signal measurement the current sample shall be compared to the preceding one;
If the difference of these two samples is more than the specified limit then the current sample is identified as suspect and not used for the computation of an average, but:
05/07/05 26
Check on a plausible rate of change - cont.
It is still used for checking the temporal consistency of samples: - the new sample is still checked with the suspect one.
In case of large noise, one or two successive samples are not used for the computation of the average.
05/07/05 27
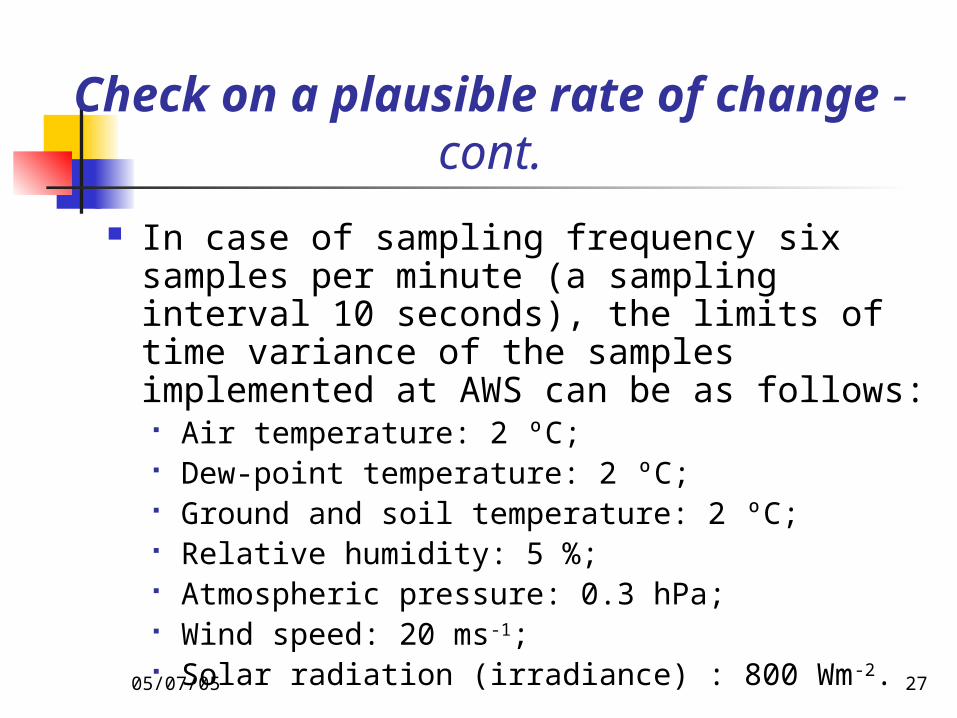
Check on a plausible rate of change - cont.
In case of sampling frequency six samples per minute (a sampling interval 10 seconds), the limits of time variance of the samples implemented at AWS can be as follows: Air temperature: 2 ºC; Dew-point temperature: 2 ºC; Ground and soil temperature: 2 ºC; Relative humidity: 5 %; Atmospheric pressure: 0.3 hPa; Wind speed: 20 ms-1; Solar radiation (irradiance) : 800 Wm-2.
05/07/05 28
Check on a plausible rate of change – cont.
There should be at least: 66% (2/3) of the samples available to compute
an instantaneous (one-minute) value; In case of the wind direction and speed at
least 75% of the samples
to compute a 2- or 10-minute average. If less than 66% (75%) of the samples are
available in one minute, the current value fails the QC criterion and is not used in further computation of a relevant parameter;
The value should be flagged as missing.
II. Automatic QC of processed data
Plausible value check Time consistency check Internal consistency check
05/07/05 30
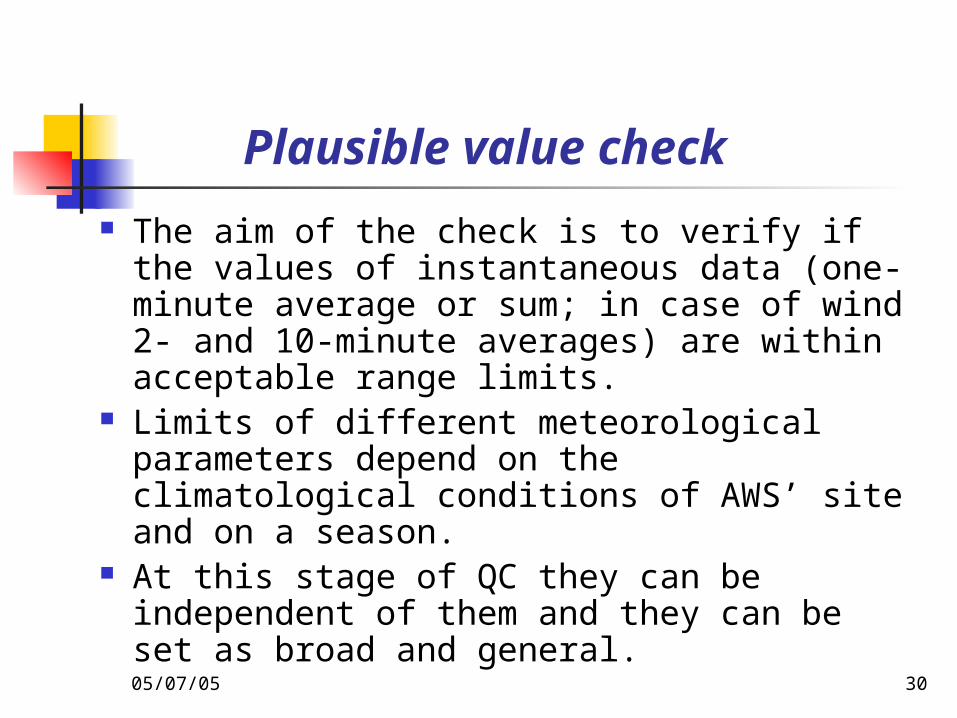
Plausible value check The aim of the check is to verify if the
values of instantaneous data (one-minute average or sum; in case of wind 2- and 10-minute averages) are within acceptable range limits.
Limits of different meteorological parameters depend on the climatological conditions of AWS’ site and on a season.
At this stage of QC they can be independent of them and they can be set as broad and general.
05/07/05 31
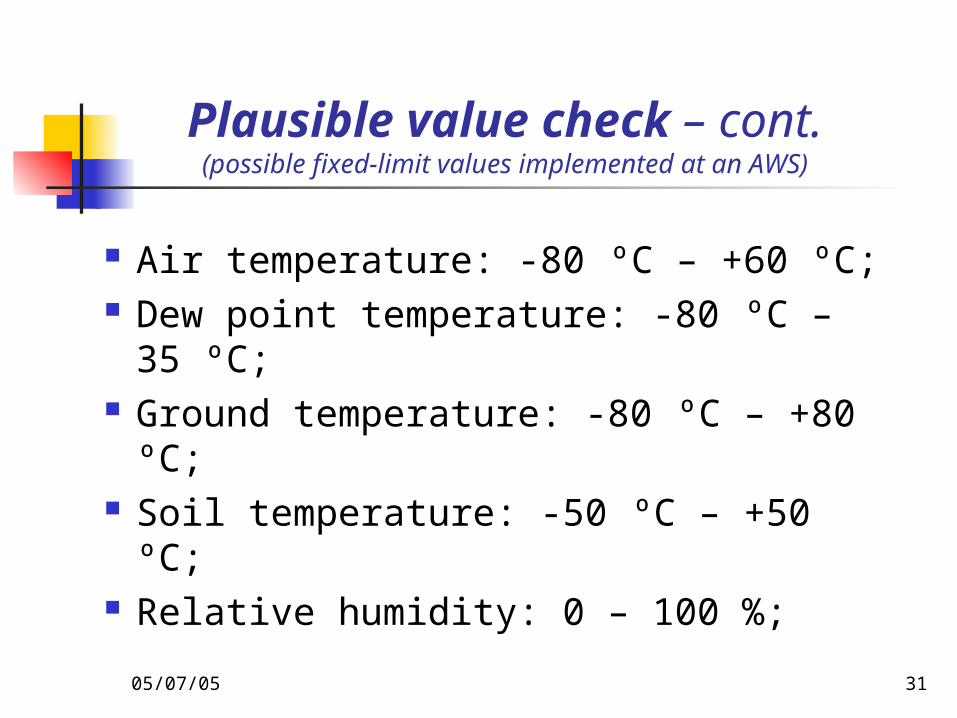
Plausible value check – cont.(possible fixed-limit values implemented at an AWS)
Air temperature: -80 ºC – +60 ºC; Dew point temperature: -80 ºC –
35 ºC; Ground temperature: -80 ºC – +80
ºC; Soil temperature: -50 ºC – +50 ºC; Relative humidity: 0 – 100 %;
05/07/05 32
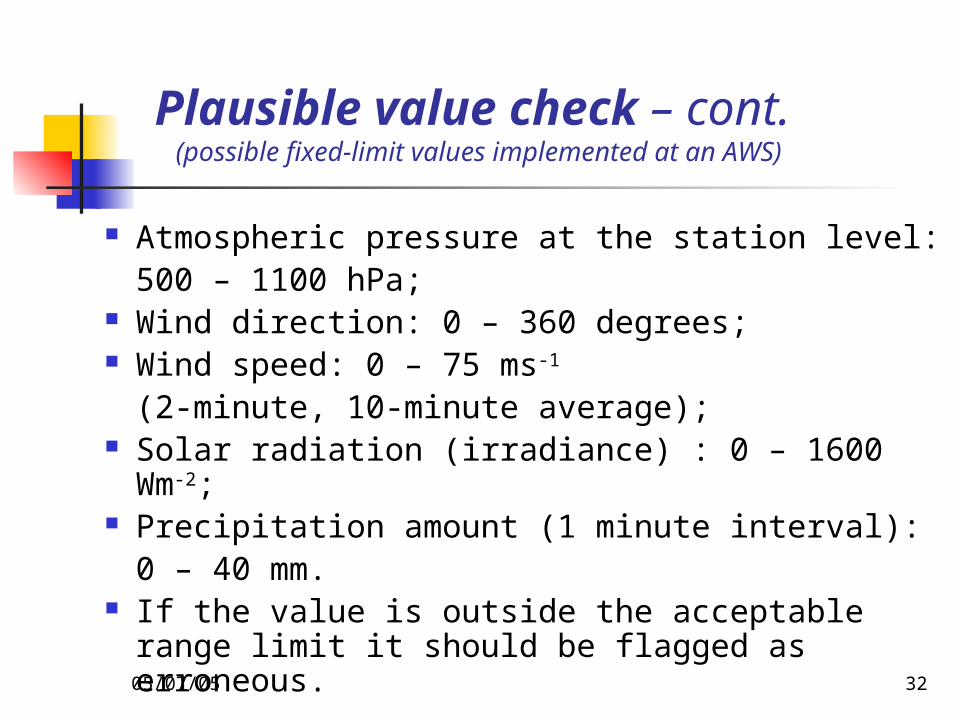
Plausible value check – cont. (possible fixed-limit values implemented at an AWS)
Atmospheric pressure at the station level: 500 – 1100 hPa;
Wind direction: 0 – 360 degrees; Wind speed: 0 – 75 ms-1
(2-minute, 10-minute average); Solar radiation (irradiance) : 0 – 1600 Wm-2; Precipitation amount (1 minute interval):
0 – 40 mm. If the value is outside the acceptable range
limit it should be flagged as erroneous.
05/07/05 33
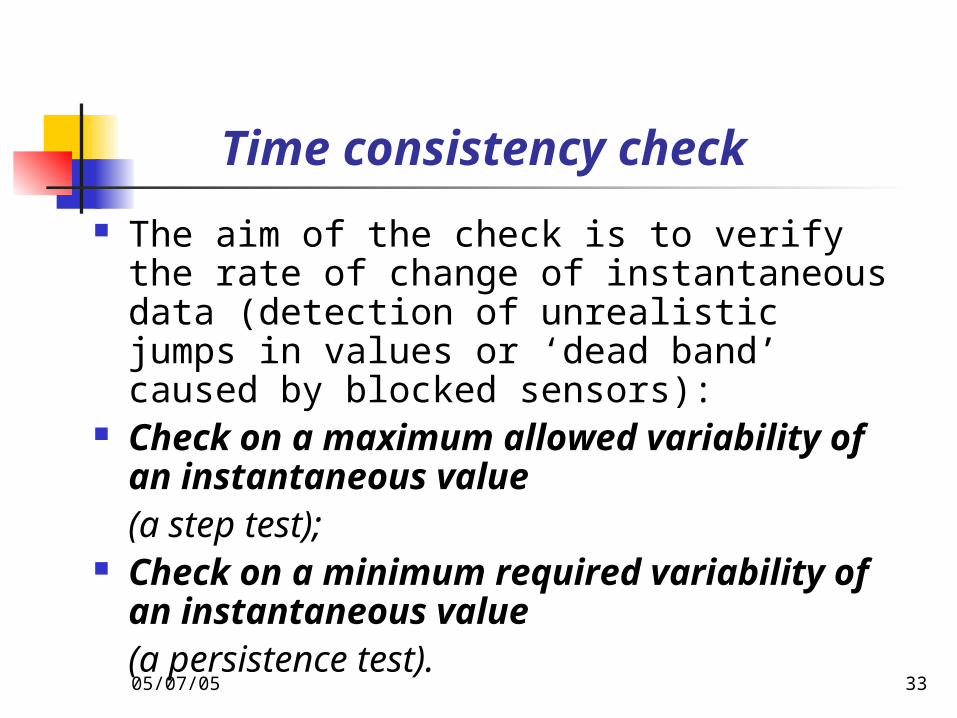
Time consistency check The aim of the check is to verify the rate
of change of instantaneous data (detection of unrealistic jumps in values or ‘dead band’ caused by blocked sensors):
Check on a maximum allowed variability of an instantaneous value (a step test);
Check on a minimum required variability of an instantaneous value (a persistence test).
05/07/05 34
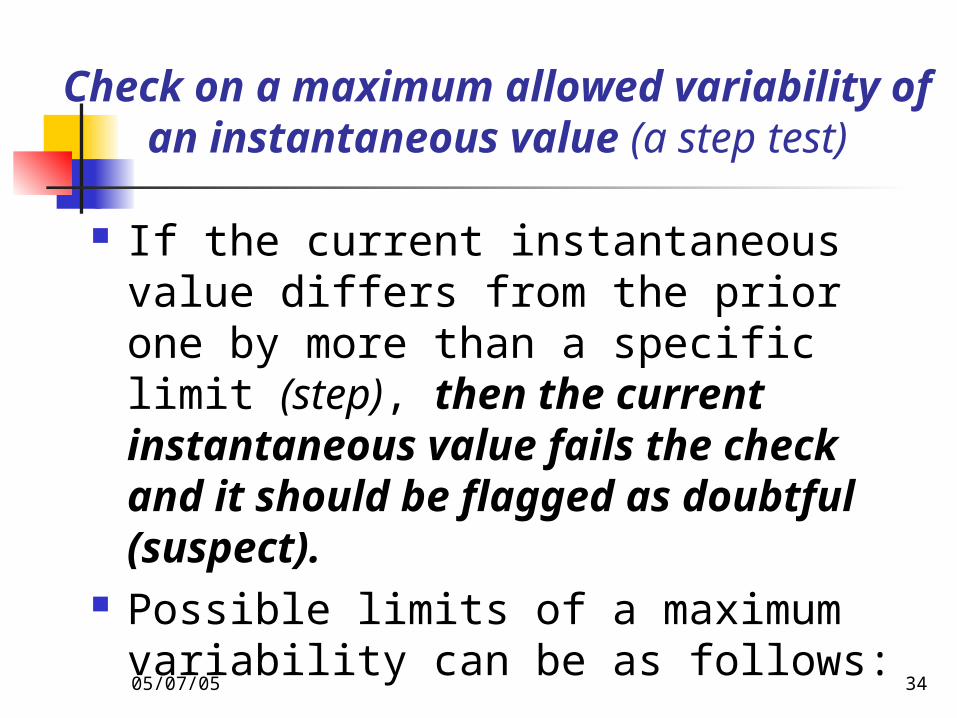
Check on a maximum allowed variability of an instantaneous value
(a step test)
If the current instantaneous value differs from the prior one by more than a specific limit (step), then the current instantaneous value fails the check and it should be flagged as doubtful (suspect).
Possible limits of a maximum variability can be as follows:
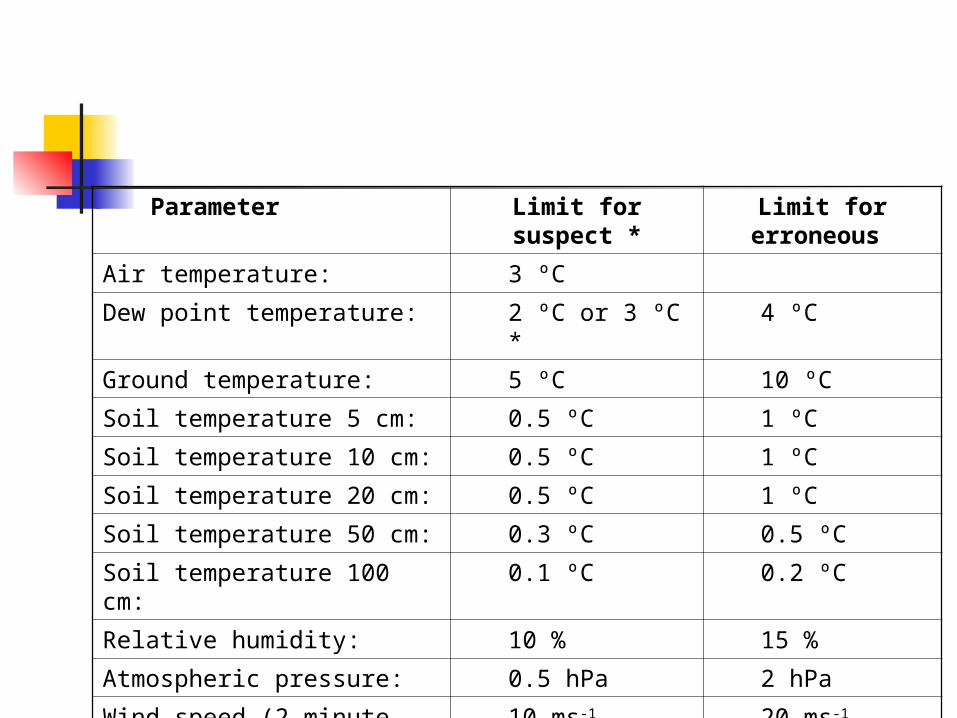
Parameter Limit for suspect *
Limit for erroneous
Air temperature: 3 ºC
Dew point temperature: 2 ºC or 3 ºC * 4 ºC
Ground temperature: 5 ºC 10 ºC
Soil temperature 5 cm: 0.5 ºC 1 ºC
Soil temperature 10 cm: 0.5 ºC 1 ºC
Soil temperature 20 cm: 0.5 ºC 1 ºC
Soil temperature 50 cm: 0.3 ºC 0.5 ºC
Soil temperature 100 cm: 0.1 ºC 0.2 ºC
Relative humidity: 10 % 15 %
Atmospheric pressure: 0.5 hPa 2 hPa
Wind speed (2-minute average)
10 ms-1 20 ms-1
Solar radiation (irradiance): 800 Wm-2 1000 Wm-2 35
05/07/05 36
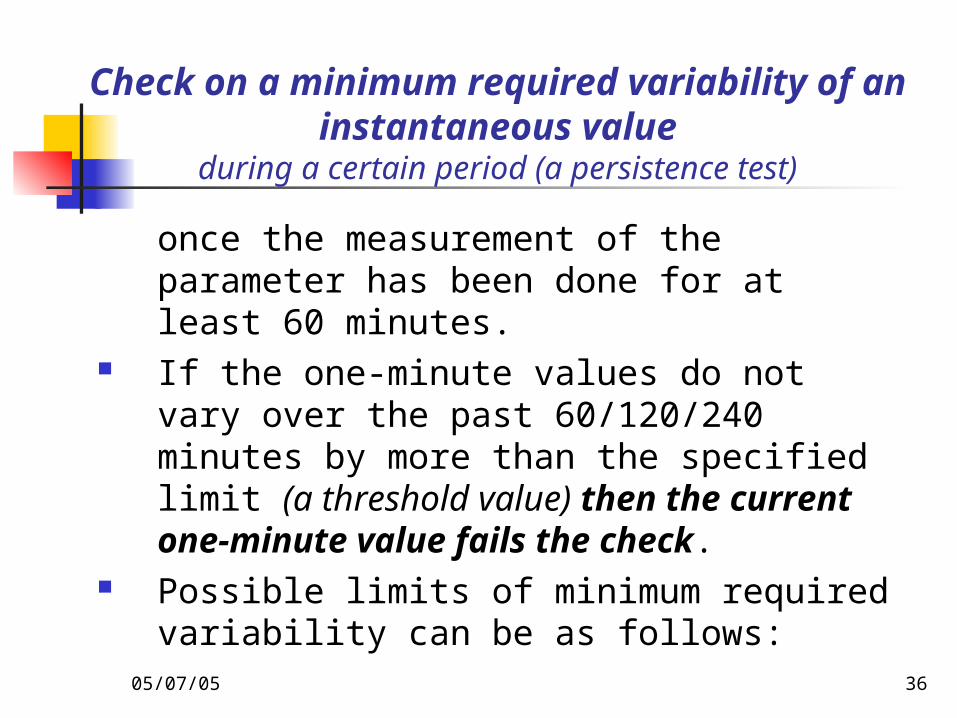
Check on a minimum required variability of an instantaneous value
during a certain period (a persistence test)
once the measurement of the parameter has been done for at least 60 minutes.
If the one-minute values do not vary over the past 60/120/240 minutes by more than the specified limit (a threshold value) then the current one-minute value fails the check.
Possible limits of minimum required variability can be as follows:
05/07/05 37
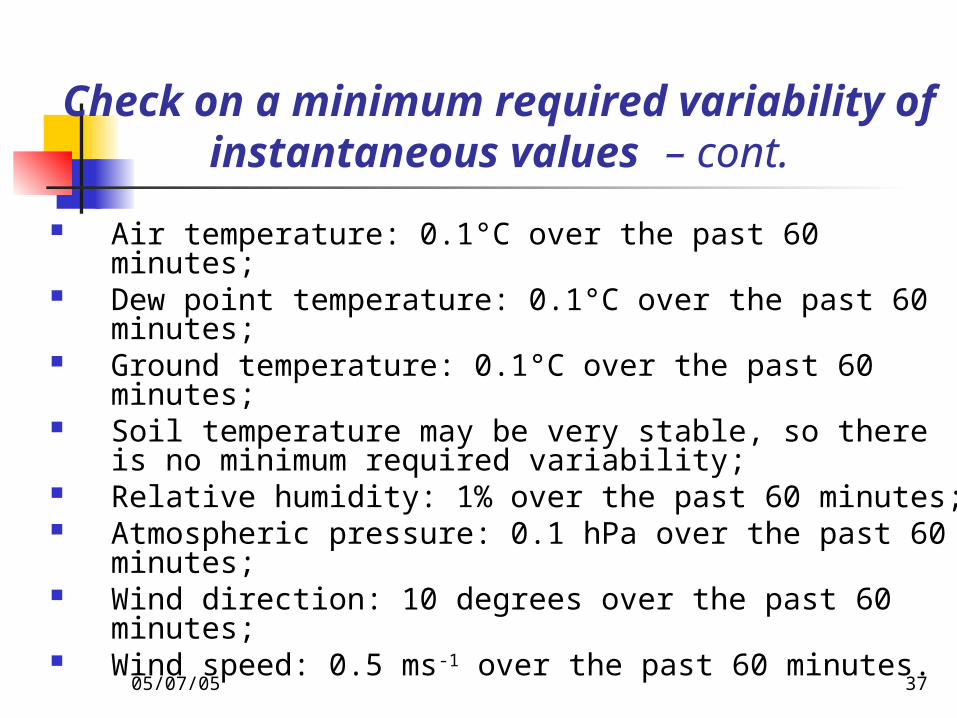
Check on a minimum required variability of instantaneous values –
cont.
Air temperature: 0.1°C over the past 60 minutes; Dew point temperature: 0.1°C over the past 60
minutes; Ground temperature: 0.1°C over the past 60
minutes; Soil temperature may be very stable, so there is no
minimum required variability; Relative humidity: 1% over the past 60 minutes; Atmospheric pressure: 0.1 hPa over the past 60
minutes; Wind direction: 10 degrees over the past 60
minutes; Wind speed: 0.5 ms-1 over the past 60 minutes.
If the value fails the time consistency checks it should be flagged as doubtful (suspect).
05/07/05 38
Check on a minimum required variability of instantaneous values –
cont.
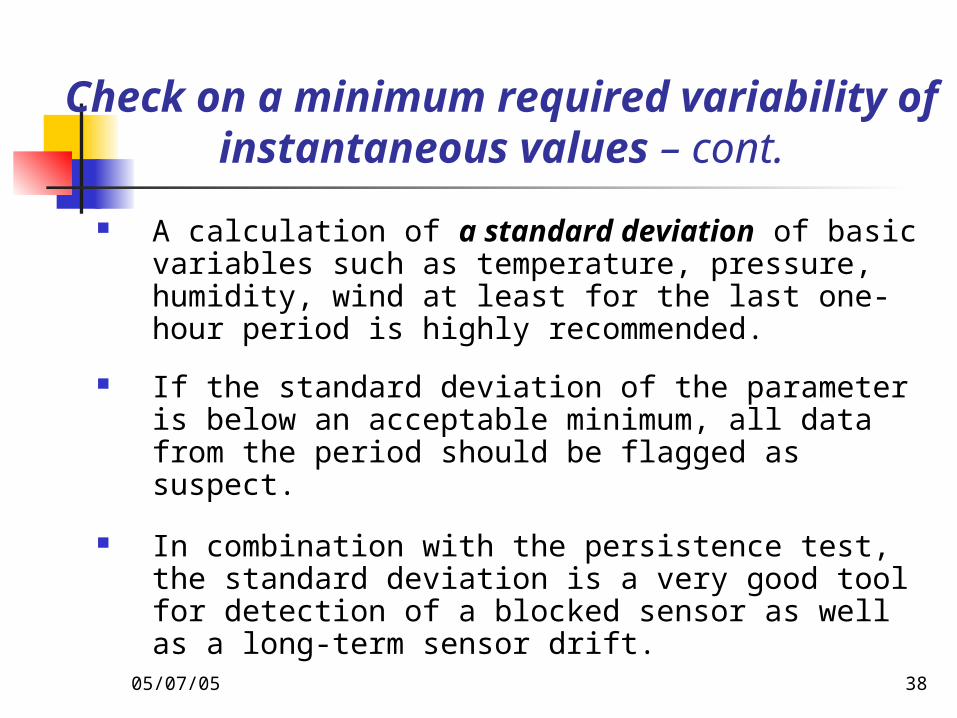
A calculation of a standard deviation of basic variables such as temperature, pressure, humidity, wind at least for the last one-hour period is highly recommended.
If the standard deviation of the parameter is below an acceptable minimum, all data from the period should be flagged as suspect.
In combination with the persistence test, the standard deviation is a very good tool for detection of a blocked sensor as well as a long-term sensor drift.
05/07/05 39
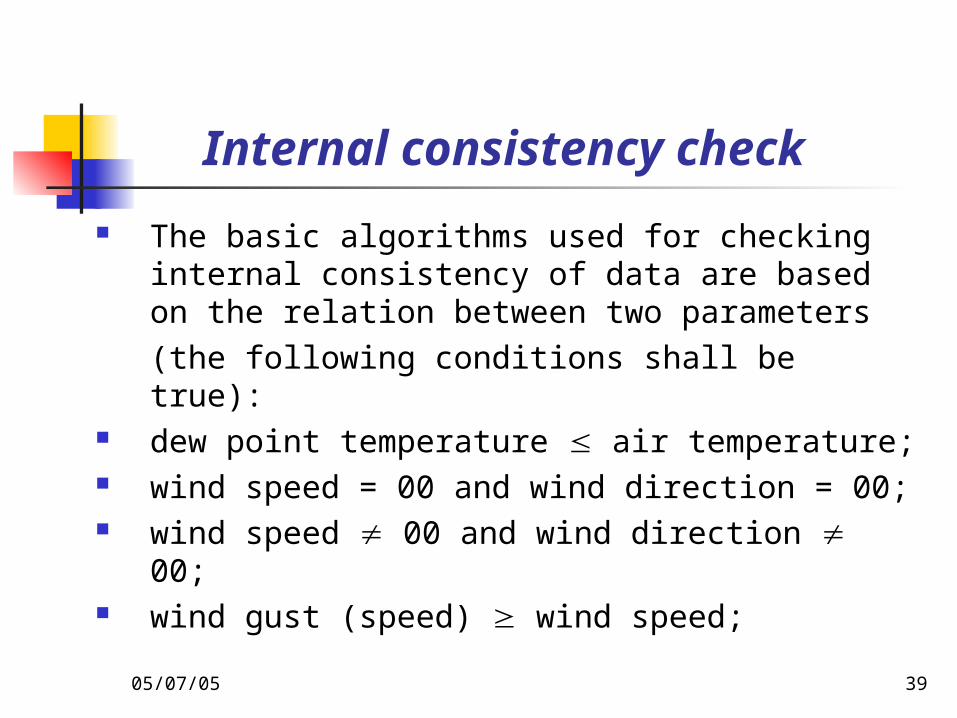
Internal consistency check The basic algorithms used for checking
internal consistency of data are based on the relation between two parameters (the following conditions shall be true):
dew point temperature air temperature; wind speed = 00 and wind direction = 00; wind speed 00 and wind direction 00; wind gust (speed) wind speed;
05/07/05 40
Internal consistency check – cont.
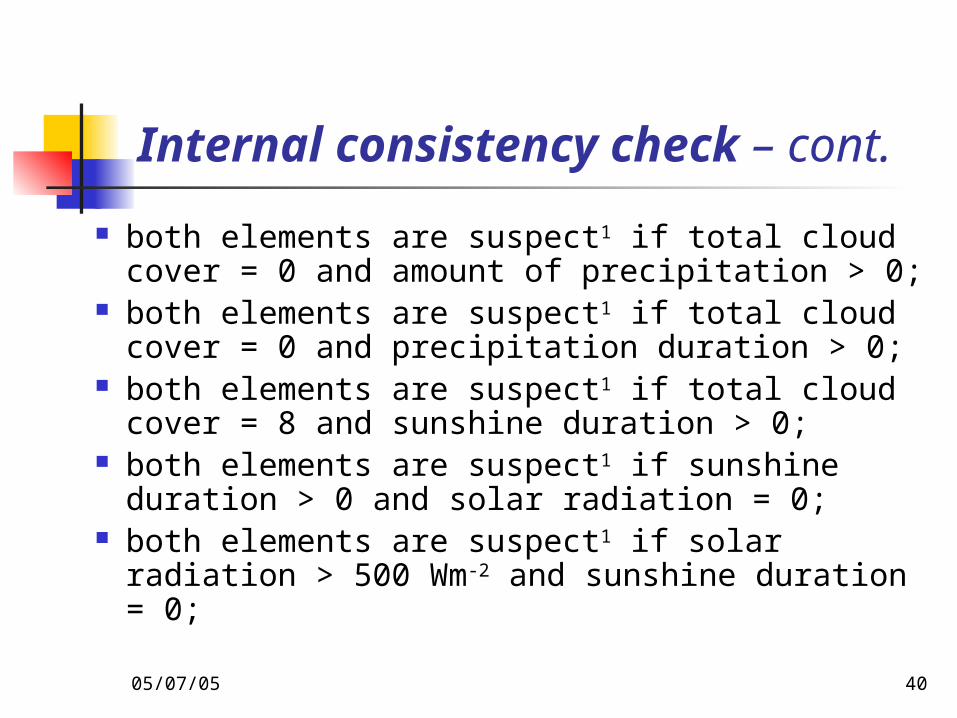
both elements are suspect1 if total cloud cover = 0 and amount of precipitation > 0;
both elements are suspect1 if total cloud cover = 0 and precipitation duration > 0;
both elements are suspect1 if total cloud cover = 8 and sunshine duration > 0;
both elements are suspect1 if sunshine duration > 0 and solar radiation = 0;
both elements are suspect1 if solar radiation > 500 Wm-2 and sunshine duration = 0;
05/07/05 41
Internal consistency check – cont.
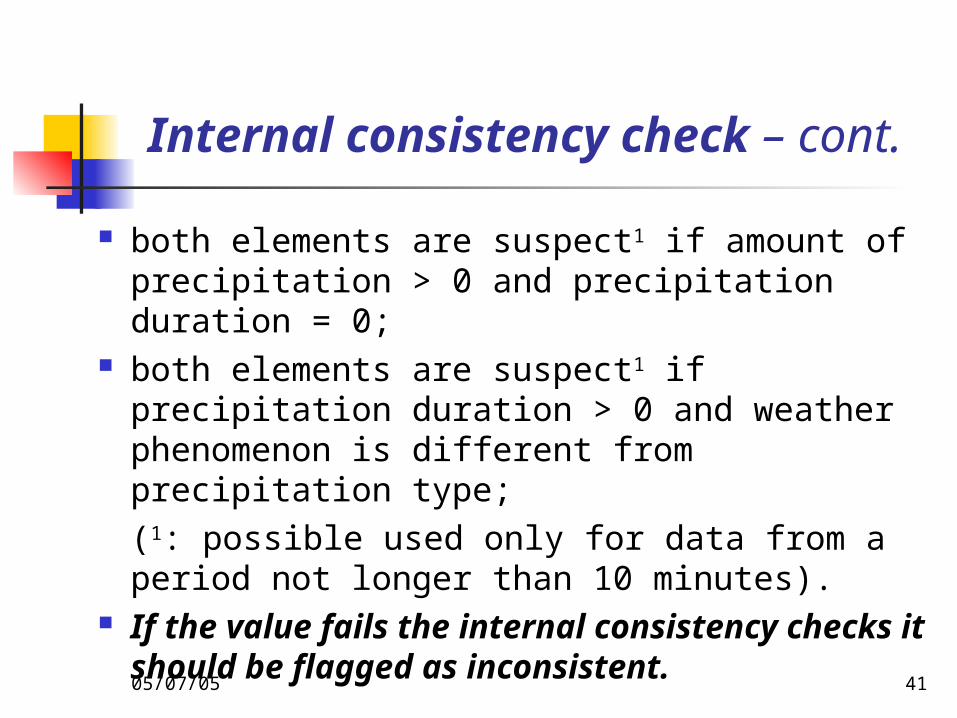
both elements are suspect1 if amount of precipitation > 0 and precipitation duration = 0;
both elements are suspect1 if precipitation duration > 0 and weather phenomenon is different from precipitation type;(1: possible used only for data from a period not longer than 10 minutes).
If the value fails the internal consistency checks it should be flagged as inconsistent.
Technical monitoring
of all crucial parts of AWS including all sensors is an inseparable part of the QA system.
It provides information on quality of data through the technical status of the instrument and information on the internal measurement status.
Corresponding information should be exchanged together with measured data.
CHAPTER III.
EXTENDEDQUALITY CONTROL
PROCEDURES
EXTENDED QC PROCEDURES
Extended Quality Control procedures should be applied at the national Data Processing Centre.
The checks that had already been performed at the AWS site should be repeated at DPC but in more elaborate form.
This should include comprehensive checks against physical and climatological limits, time consistency checks for a longer measurement period, checks on logical relations among a number of variables (internal consistency of data), statistical methods to analyze data, etc.
Internal consistency checks of data
Both values could be flagged as inconsistent, doubtful or erroneous when only one of them is really suspect or wrong.
Further checking by other means should be performed so that only the suspect / wrong value is correspondingly flagged and the other value is flagged as good.
Internal consistency checks of data – cont.
In comparison with B-QC performed at AWS more QC categories of flags can be used, e.g.:
data verified (after flagging at B-QC as suspect, wrong or inconsistent, but validated as good using other checking procedures);
data corrected (wrong or suspect data corrected using appropriate procedures)
Extended QC Procedures – cont.
Wind direction and wind speed; Air temperature and dew point
temperature; Air temperature and present weather; Visibility and present weather; Present weather and cloud information; Present weather and duration of
precipitation; Cloud information and precipitation
information; Cloud information and duration of
precipitation; Duration of precipitation and other
precipitation information; Cloud information and sunshine duration.
Extended QC Procedures – cont.
For each check:
if the checked values fail the internal consistency checks, they should be flagged as suspect or erroneous (depending on the check) and inconsistent.
Extended QC Procedures – cont.
For further treatment of data it is necessary to keep the results of the E-QC data together with the information on how suspect or wrong data had been treated.
Therefore data, passing through QC, should be flagged.
The output of the quality control system should include QC flags that indicate whether the measurement passed or failed, as well as a set of summary statements about the sensors.
Extended QC Procedures – cont.
Every effort has to be made to fill data gaps, correct all erroneous values and validate doubtful data detected by QC procedures at the Data Processing Centre choosing appropriate procedures.
References Automated Surface Observing System
(ASOS), User’s Guide, http://www.nws.noaa.gov/asos/aum-toc.pdf
The Impact of Unique Meteorological Phenomena Detected by the Oklahoma Mesonet and ARS Micronet on Automated Quality Control, Fiebrich, C.A., Crawford, K.C., 2001, Bulletin of the American Meteorological Society, Vol. 82, No. 10. http://hprcc.unl.edu/aws/publications.htm
Quality Control of Meteorological Observations, Automatic Methods Used in the Nordic Countries, Report 8/2002, http://www.smhi.se/hfa_coord/nordklim/