gwpc shale gas and water use presentation … overview modern energy sources chesapeake energy...
TRANSCRIPT
GWPC Shale Gas and Water Use Presentation September 28, 2010
“Deep Shale Natural Gas and Water Use, Part Two:
Abundant, Affordable, and Still , ,Water Efficient”
Matthew E. Mantell, P.E.Corporate Environmental Engineer
Chesapeake Energy Corporation6100 N Western Avenue ı Oklahoma City OK 76118 ı 405-935-8000
2
6100 N. Western Avenue ı Oklahoma City, OK 76118 ı [email protected] ı chk.com ı NYSE: CHK
Presentation Overview
Modern Energy Sources
Chesapeake Energy Operations
Advantages of Shale Gas
Keys to Shale Gas Development
Water / Energy Nexus/ gy
Water Use Efficiency by Shale Gas Play
Raw Fuel Source Water Use Comparison
Shale Gas Produced Water Reuse Shale Gas Produced Water Reuse
“Permanent Removal” of Water from Cycle
Water Use Efficiency of Power Plants
Carbon Capture and Water Efficiency
Water Intensity of Transportation Fuels
Closing Thoughts
3
g g
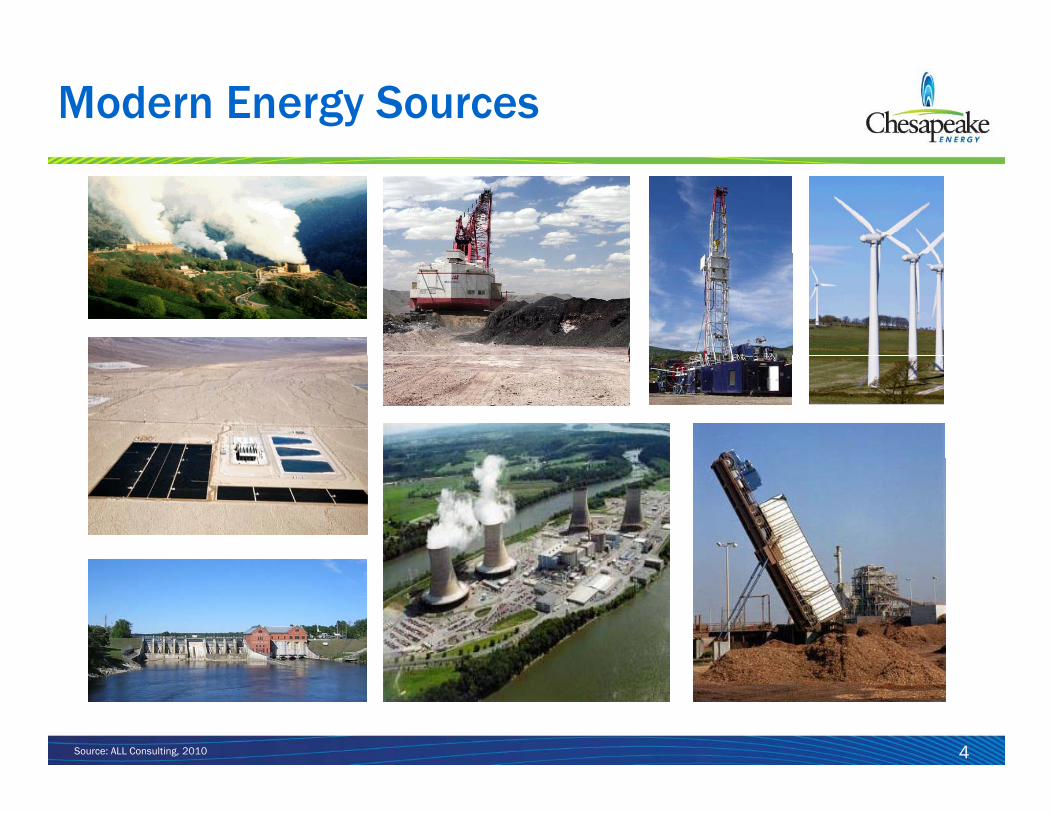
Modern Energy Sources
4Source: ALL Consulting, 2010
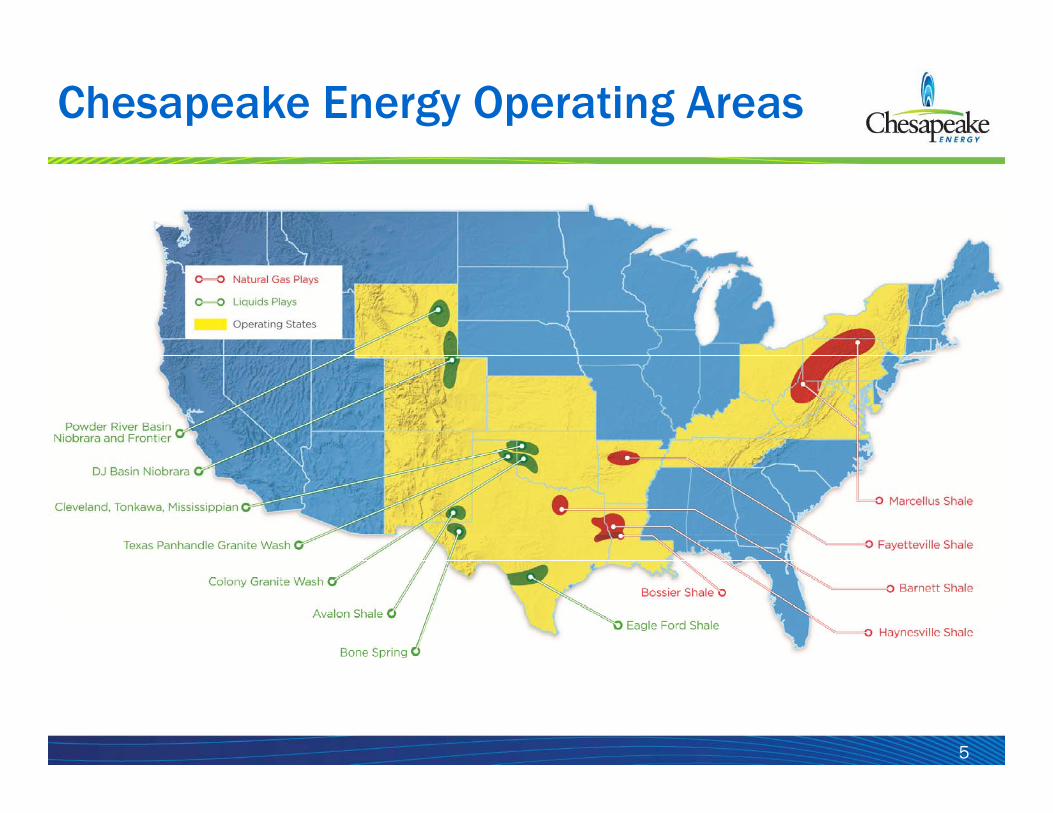
Chesapeake Energy Operating Areas
5

Advantages of Deep Shale Natural Gas
Abundant in U.S.
Barnett Shale: 44 Tcf*
Affordable
Natural gas price of $5 per MMBtu
Fayetteville Shale: 42 Tcf*
Haynesville Shale: 250 Tcf*
equivalent to $30 Bbl oilCurrent oil price around $80 Bbl
Emission friendlyMarcellus Shale: 490 Tcf** 50% the carbon dioxide of coal
30% the carbon dioxide of gasolineNo mercury or PM emissions
Most widely used fuel sourceClean burning power plantsResidential useIndustrial and manufacturingCommercial space heatingTransportation fuel (CNG)
6
*US Department of Energy (April 2009): Modern Shale Gas Development in the United states: a Prime,r p. 17)**Dr. Terry Engelder, Penn State University)Tcf = trillion cubic feet
a spo tat o ue (C G)

Keys to Shale Gas D l tDevelopment
7
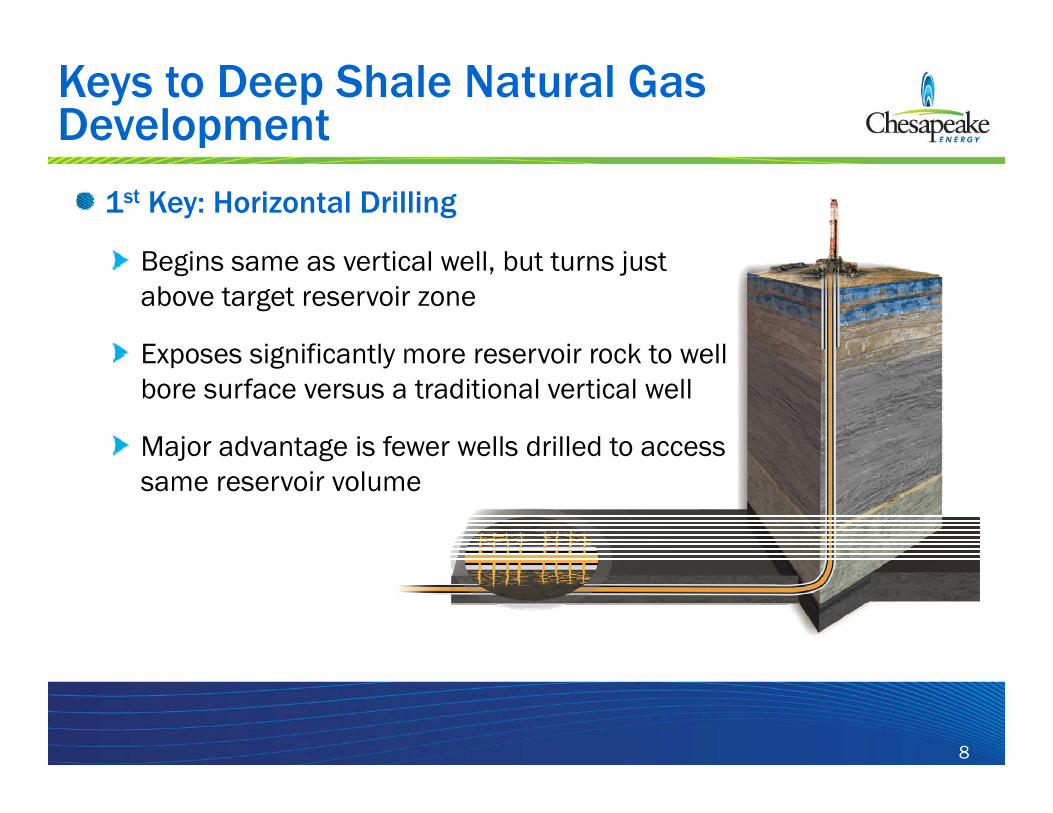
Keys to Deep Shale Natural Gas Development
1st Key: Horizontal Drilling
B i ti l ll b t t j t Begins same as vertical well, but turns just above target reservoir zone
Exposes significantly more reservoir rock to well Exposes significantly more reservoir rock to well bore surface versus a traditional vertical well
Major advantage is fewer wells drilled to access j gsame reservoir volume
8
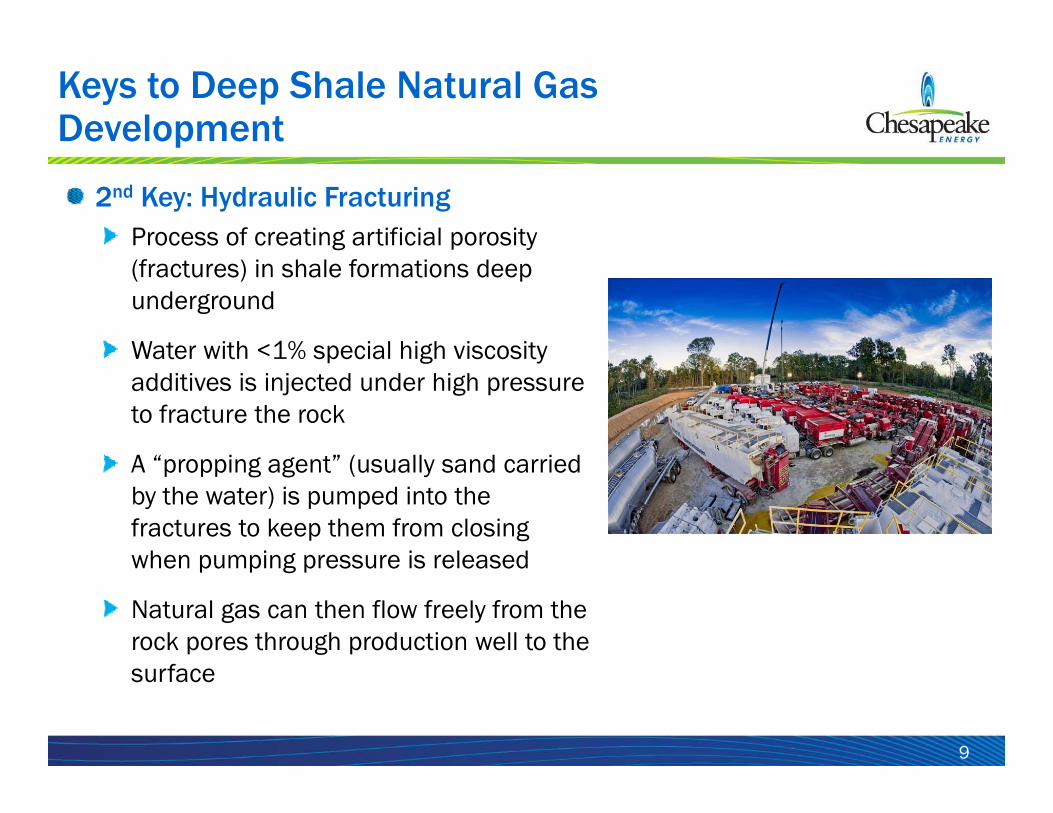
Keys to Deep Shale Natural Gas Development
2nd Key: Hydraulic FracturingProcess of creating artificial porosity (fractures) in shale formations deep underground
Water with <1% special high viscosity Water with <1% special high viscosity additives is injected under high pressure to fracture the rock
A “ i g g t” ( ll d i d A “propping agent” (usually sand carried by the water) is pumped into the fractures to keep them from closing when pumping pressure is releasedwhen pumping pressure is released
Natural gas can then flow freely from the rock pores through production well to the
9
surface
Water / Energy NexusWater / Energy Nexus
10
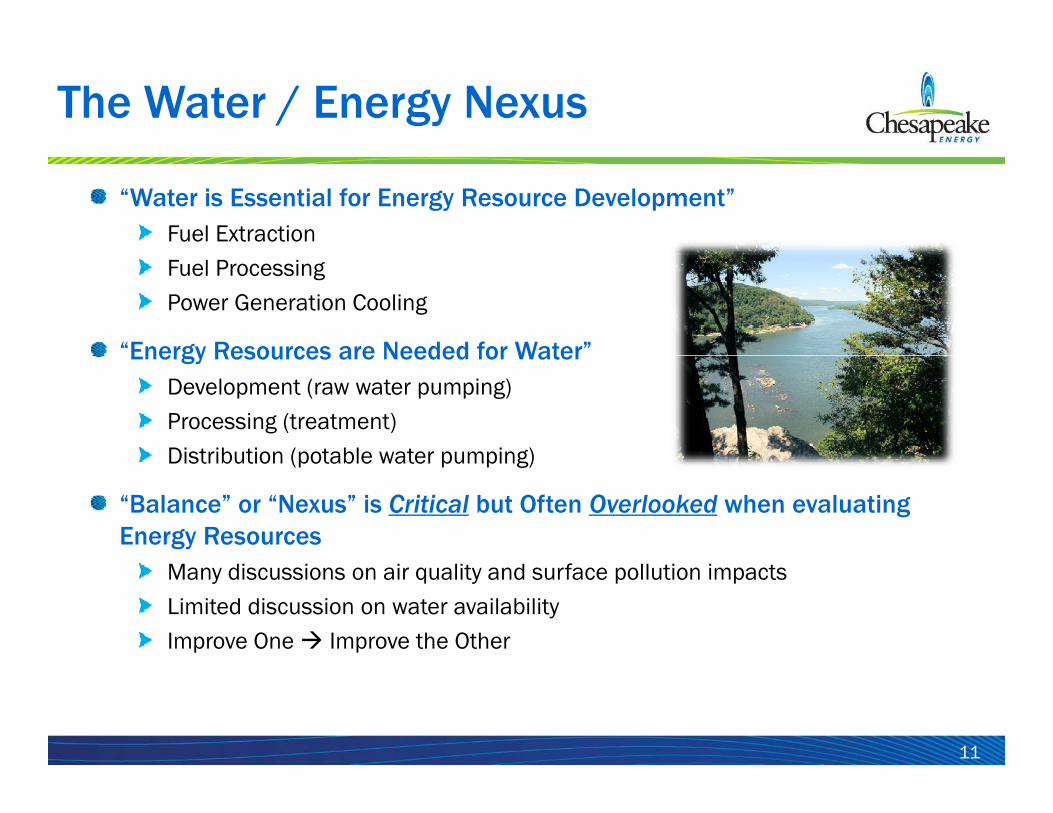
The Water / Energy Nexus
“Water is Essential for Energy Resource Development”Fuel ExtractionFuel ProcessingPower Generation Cooling
“Energy Resources are Needed for Water”Energy Resources are Needed for WaterDevelopment (raw water pumping)Processing (treatment)Distribution (potable water pumping)Distribution (potable water pumping)
“Balance” or “Nexus” is Critical but Often Overlooked when evaluating Energy Resources
Many discussions on air quality and surface pollution impactsLimited discussion on water availabilityImprove One Improve the Other
11
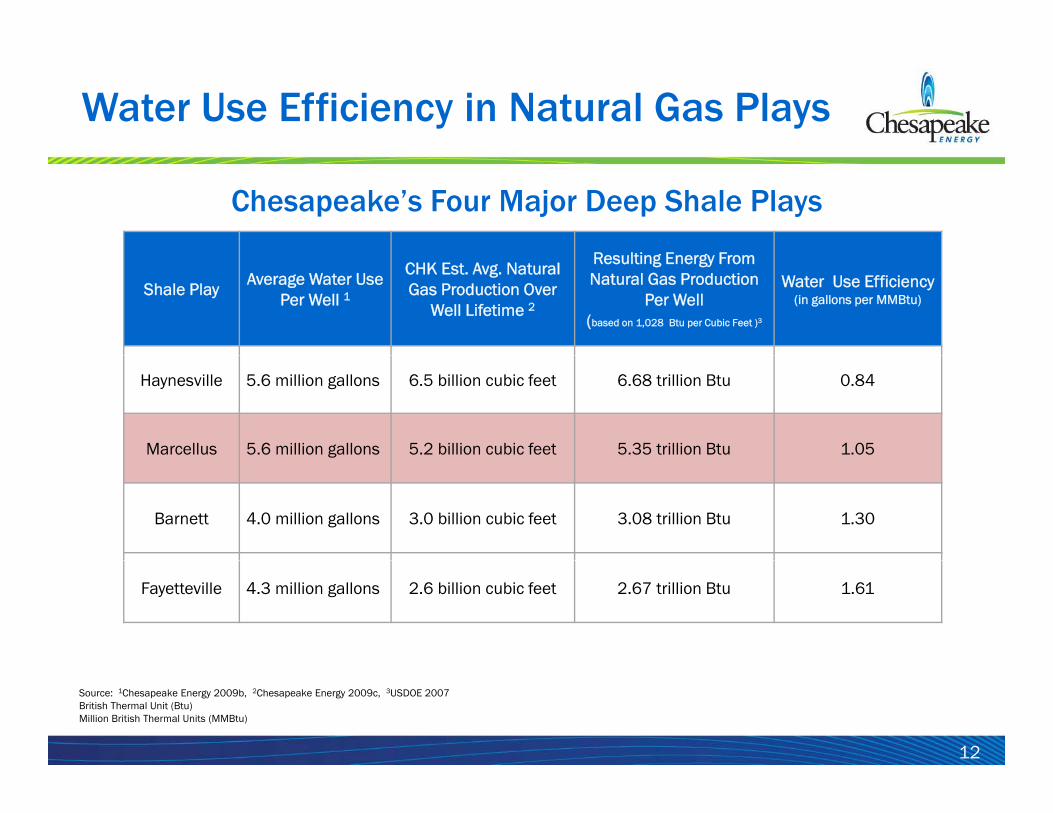
Water Use Efficiency in Natural Gas Plays
R l i E F
Chesapeake’s Four Major Deep Shale Plays
Shale PlayAverage Water Use
Per Well 1
CHK Est. Avg. Natural Gas Production Over
Well Lifetime 2
Resulting Energy FromNatural Gas Production
Per Well(based on 1,028 Btu per Cubic Feet )3
Water Use Efficiency(in gallons per MMBtu)
Haynesville 5.6 million gallons 6.5 billion cubic feet 6.68 trillion Btu 0.84
Marcellus 5.6 million gallons 5.2 billion cubic feet 5.35 trillion Btu 1.05
Barnett 4.0 million gallons 3.0 billion cubic feet 3.08 trillion Btu 1.30
Fayetteville 4.3 million gallons 2.6 billion cubic feet 2.67 trillion Btu 1.61
12
Source: 1Chesapeake Energy 2009b, 2Chesapeake Energy 2009c, 3USDOE 2007British Thermal Unit (Btu)Million British Thermal Units (MMBtu)
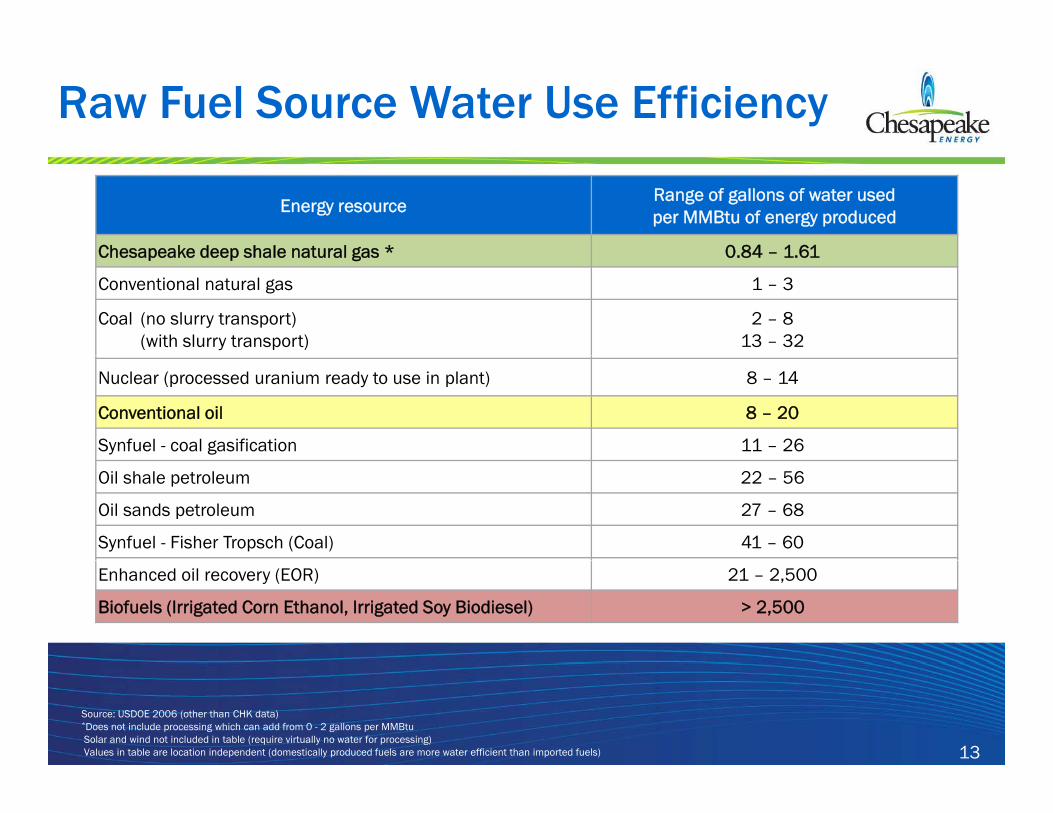
Raw Fuel Source Water Use Efficiency
Energy resourceRange of gallons of water used per MMBtu of energy produced
Chesapeake deep shale natural gas * 0 84 – 1 61Chesapeake deep shale natural gas 0.84 – 1.61
Conventional natural gas 1 – 3
Coal (no slurry transport)(with slurry transport)
2 – 813 – 32
Nuclear (processed uranium ready to use in plant) 8 – 14
Conventional oil 8 – 20
Synfuel - coal gasification 11 – 26
Oil shale petroleum 22 – 56
Oil sands petroleum 27 – 68
Synfuel - Fisher Tropsch (Coal) 41 – 60
Enhanced oil recovery (EOR) 21 – 2,500
Biofuels (Irrigated Corn Ethanol, Irrigated Soy Biodiesel) > 2,500
13
Source: USDOE 2006 (other than CHK data)*Does not include processing which can add from 0 - 2 gallons per MMBtuSolar and wind not included in table (require virtually no water for processing)Values in table are location independent (domestically produced fuels are more water efficient than imported fuels)
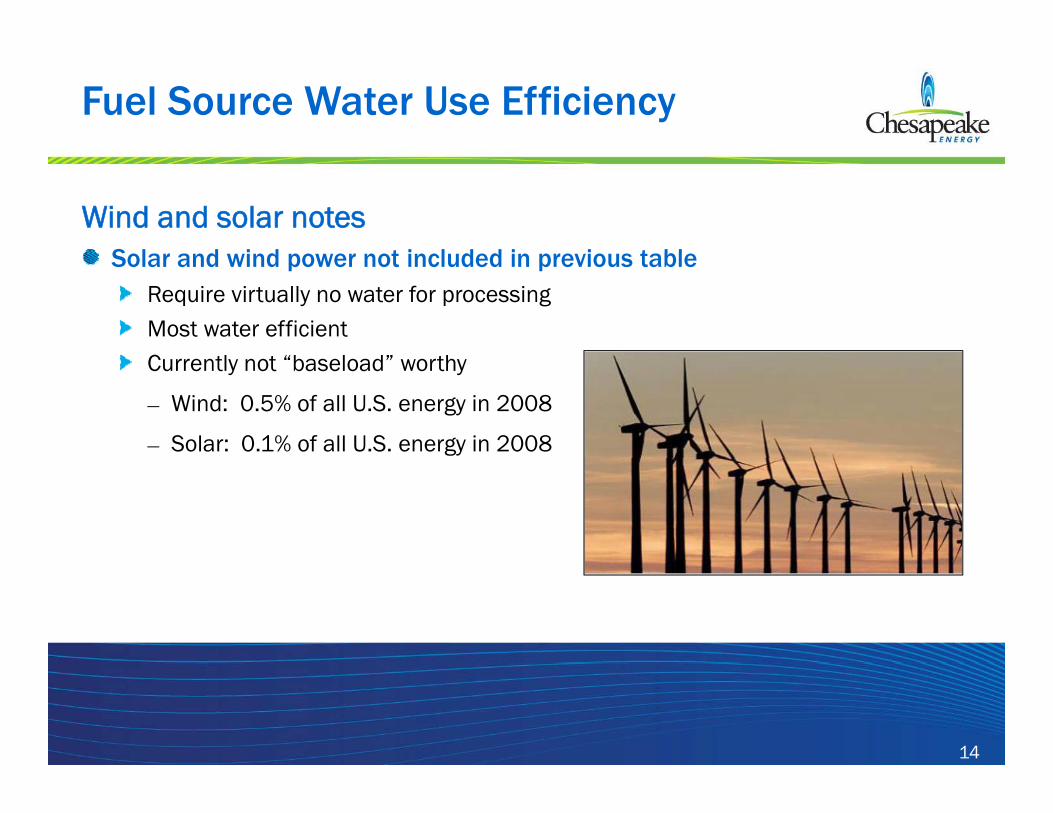
Fuel Source Water Use Efficiency
Wind and solar notesS l d i d t i l d d i i t blSolar and wind power not included in previous table
Require virtually no water for processingMost water efficientC l “b l d” hCurrently not “baseload” worthy
― Wind: 0.5% of all U.S. energy in 2008
― Solar: 0.1% of all U.S. energy in 2008
14
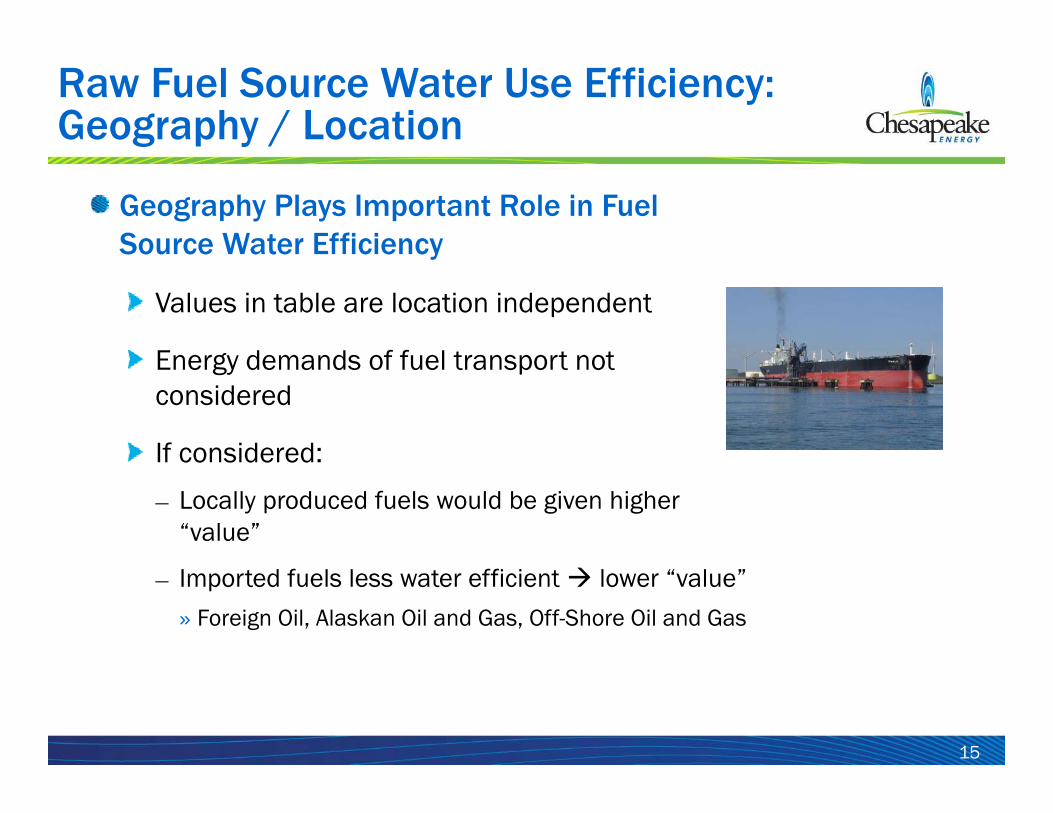
Raw Fuel Source Water Use Efficiency:Geography / Location
Geography Plays Important Role in Fuel Source Water EfficiencySource Water Efficiency
Values in table are location independent
Energy demands of fuel transport not Energy demands of fuel transport not considered
If considered:If considered:
― Locally produced fuels would be given higher “value”
― Imported fuels less water efficient lower “value”
» Foreign Oil, Alaskan Oil and Gas, Off-Shore Oil and Gas
15
Keys to Produced Water Reuse
Produced Water Volumes / Generation Prefer higher volumes initially with lower longer term
production (logistics is key)production (logistics is key)
Dissolved Parameters Blending for Reuse Chlorides and Total Dissolved Solids (TDS) G ll t l ki g t l j t d t i Generally not looking at removal, just determines
freshwater blending ratios
● Suspended Parameters Filtering Prior to Reuse Turbidity and Total Suspended Solids (TSS) Turbidity and Total Suspended Solids (TSS) Can determine filtration rates, size of filter,
operational performance
Other Parameters of Concern Other Parameters of Concern Water “hardness” compounds (e.g. Calcium and
Magnesium) can cause significant scaling issues and problems with fracturing additives
16
a d p ob e s t actu g add t es

Produced Water Reuse and Recycling: Barnett and Fayetteville Shale
Barnett ShaleReuse limited by high volumes of water produced
d id il bili f Cl II SWDand wide availability of Class II SWDsGenerally high TDS, low TSS, moderate scaling tendencyCurrently treating and reusing water in the Currently treating and reusing water in the Southern portion of the play
Fayetteville ShaleRelatively good quality produced water suitable for Relatively good quality produced water suitable for reuse with sufficient initial volumesLow TDS, low TSS and low scaling tendencyCHK is meeting portion of drilling and fracturing CHK is meeting portion of drilling and fracturing needs with reuse
17
Produced Water Reuse and Recycling: Haynesville and Marcellus Shale
Haynesville ShaleSmall volume of produced water initially (compared to other major plays)(compared to other major plays)Very poor quality produced water (high TDS, high TSS, high scaling tendency)Water volumes, poor quality, and the resulting p q y geconomics have prevented reuse
Marcellus ShaleExcellent potential for reuse. Significant volumes initially with quick drop-off.Moderate to high TDS managed with blending, moderate TSS managed with filtrationRelatively high scaling tendency (high Ca, Mg), but proven to work with monitoring program
18
Criticism of Oil and Natural Gas Water Use
Concerns of the so called “permanent removal” of water from the effective hydrologic cycle.
Most water used in shale gas development either remains in the formation or returns as either remains in the formation or returns as produced waterThe preferred method for disposal of produced water is through permitted Class II produced water is through permitted Class II SWDsArgument that this is a different type of “consumption” than the evaporation of water consumption than the evaporation of water from a power plant and other types of “consumption”
19
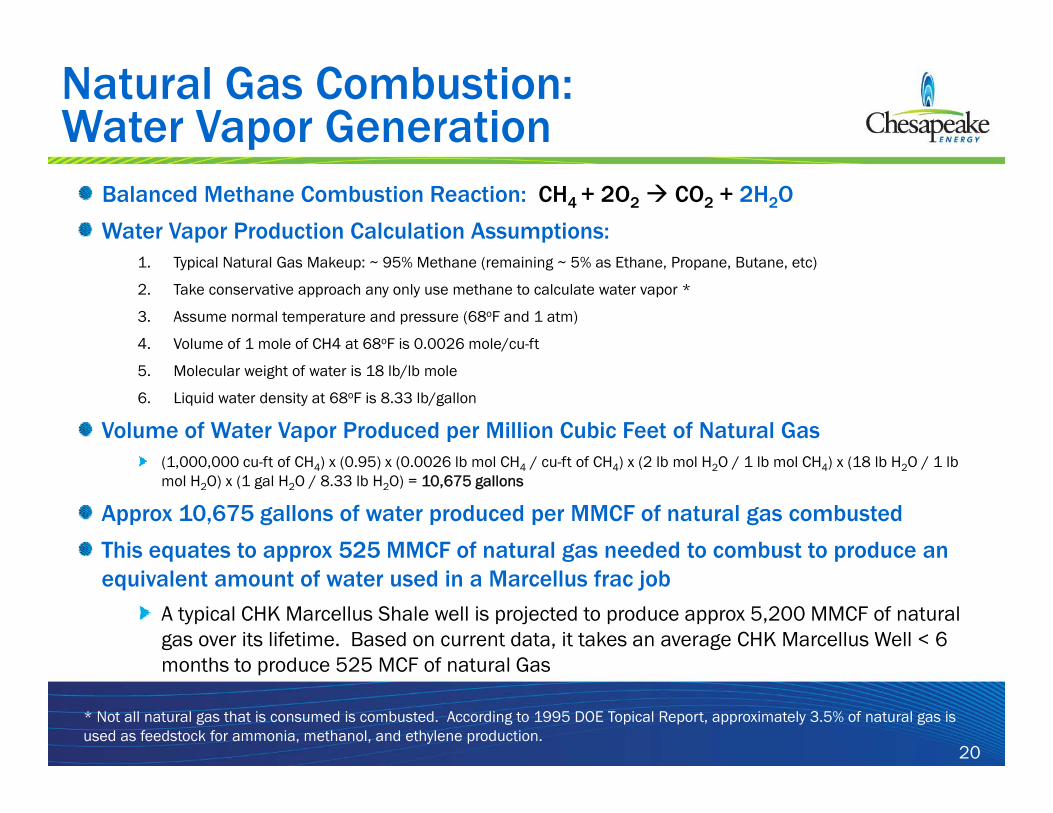
Natural Gas Combustion:Water Vapor Generation
Balanced Methane Combustion Reaction: CH4 + 2O2 CO2 + 2H2O
Water Vapor Production Calculation Assumptions:1. Typical Natural Gas Makeup: ~ 95% Methane (remaining ~ 5% as Ethane, Propane, Butane, etc)
2. Take conservative approach any only use methane to calculate water vapor *
3. Assume normal temperature and pressure (68oF and 1 atm)
4. Volume of 1 mole of CH4 at 68oF is 0.0026 mole/cu-ft
5. Molecular weight of water is 18 lb/lb mole
6. Liquid water density at 68oF is 8.33 lb/gallon
Volume of Water Vapor Produced per Million Cubic Feet of Natural Gas(1 000 000 ft f CH ) (0 95) (0 0026 lb l CH / ft f CH ) (2 lb l H O / 1 lb l CH ) (18 lb H O / 1 lb (1,000,000 cu-ft of CH4) x (0.95) x (0.0026 lb mol CH4 / cu-ft of CH4) x (2 lb mol H2O / 1 lb mol CH4) x (18 lb H2O / 1 lb mol H2O) x (1 gal H2O / 8.33 lb H2O) = 10,675 gallons
Approx 10,675 gallons of water produced per MMCF of natural gas combusted
This equates to approx 525 MMCF of natural gas needed to combust to produce an q pp g pequivalent amount of water used in a Marcellus frac job
A typical CHK Marcellus Shale well is projected to produce approx 5,200 MMCF of natural gas over its lifetime. Based on current data, it takes an average CHK Marcellus Well < 6 months to produce 525 MCF of natural Gas
20
months to produce 525 MCF of natural Gas
* Not all natural gas that is consumed is combusted. According to 1995 DOE Topical Report, approximately 3.5% of natural gas isused as feedstock for ammonia, methanol, and ethylene production.

Typical Efficiencies of Thermoelectric Power Plants
14% Flue Gas 36%
Cooling
100% F l
33% Cooling Water
100% Fuel
gWater
50% Electricity
Fuel Water
15% Electricity
%
Natural Gas Combined Cycle Coal /Biomass Steam Turbine
52% Unconverted Solar
Concentrating Solar
SynGas (Coal) Combined Cycle Nuclear Steam Turbine
21Source: Adapted from Stillwell et al. 2009
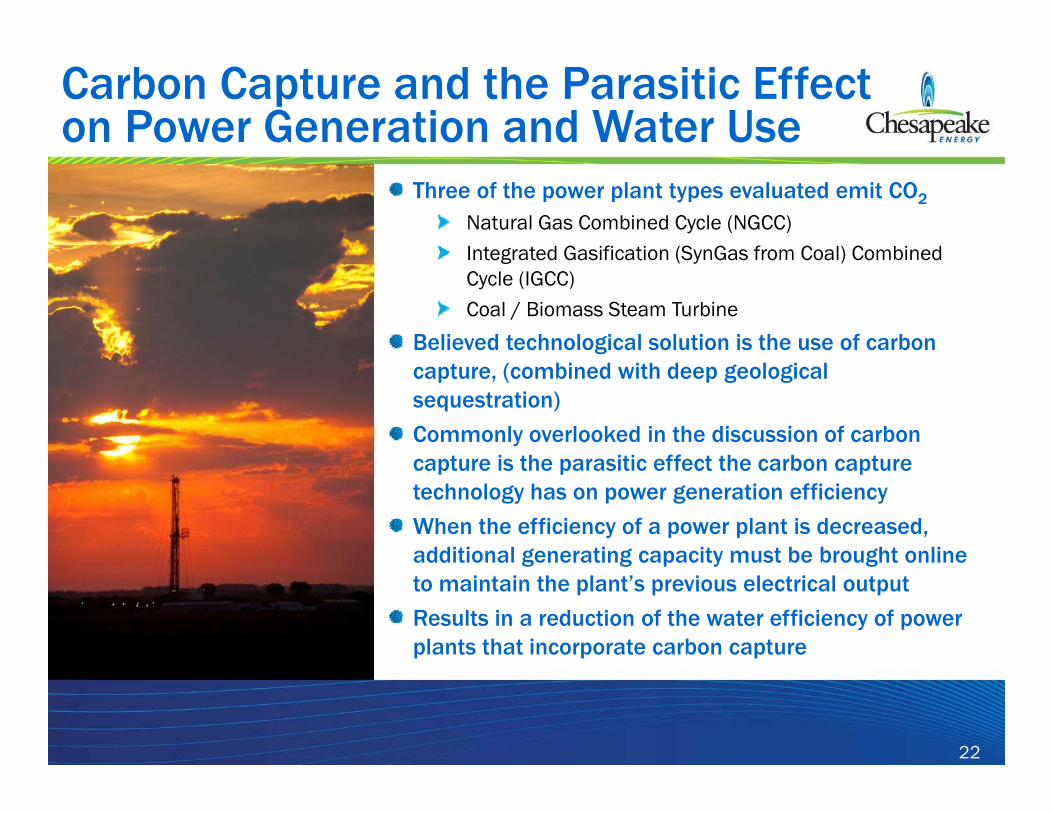
Carbon Capture and the Parasitic Effect on Power Generation and Water Use
Three of the power plant types evaluated emit CO2
Natural Gas Combined Cycle (NGCC)Integrated Gasification (SynGas from Coal) Combined Integrated Gasification (SynGas from Coal) Combined Cycle (IGCC)Coal / Biomass Steam Turbine
Believed technological solution is the use of carbon capture, (combined with deep geological sequestration)
Commonly overlooked in the discussion of carbon t i th iti ff t th b t capture is the parasitic effect the carbon capture
technology has on power generation efficiency
When the efficiency of a power plant is decreased, additional generating capacity must be brought online additional generating capacity must be brought online to maintain the plant’s previous electrical output
Results in a reduction of the water efficiency of power plants that incorporate carbon capture
22
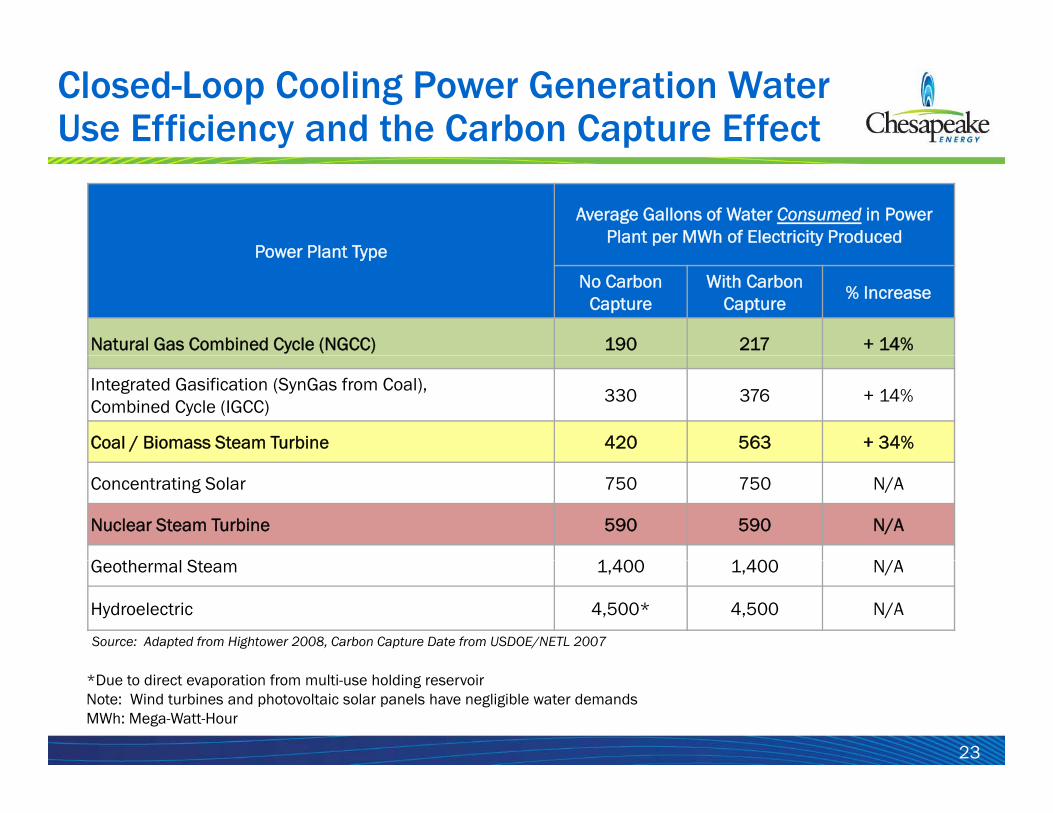
Closed-Loop Cooling Power Generation Water Use Efficiency and the Carbon Capture Effect
Power Plant Type
Average Gallons of Water Consumed in Power Plant per MWh of Electricity Produced
Power Plant Type
No Carbon Capture
With CarbonCapture
% Increase
Natural Gas Combined Cycle (NGCC) 190 217 + 14%
Integrated Gasification (SynGas from Coal), Combined Cycle (IGCC)
330 376 + 14%
Coal / Biomass Steam Turbine 420 563 + 34%
Concentrating Solar 750 750 N/A
Nuclear Steam Turbine 590 590 N/A
G h l S 1 400 1 400 N/AGeothermal Steam 1,400 1,400 N/A
Hydroelectric 4,500* 4,500 N/A
Source: Adapted from Hightower 2008, Carbon Capture Date from USDOE/NETL 2007
23
*Due to direct evaporation from multi-use holding reservoirNote: Wind turbines and photovoltaic solar panels have negligible water demandsMWh: Mega-Watt-Hour
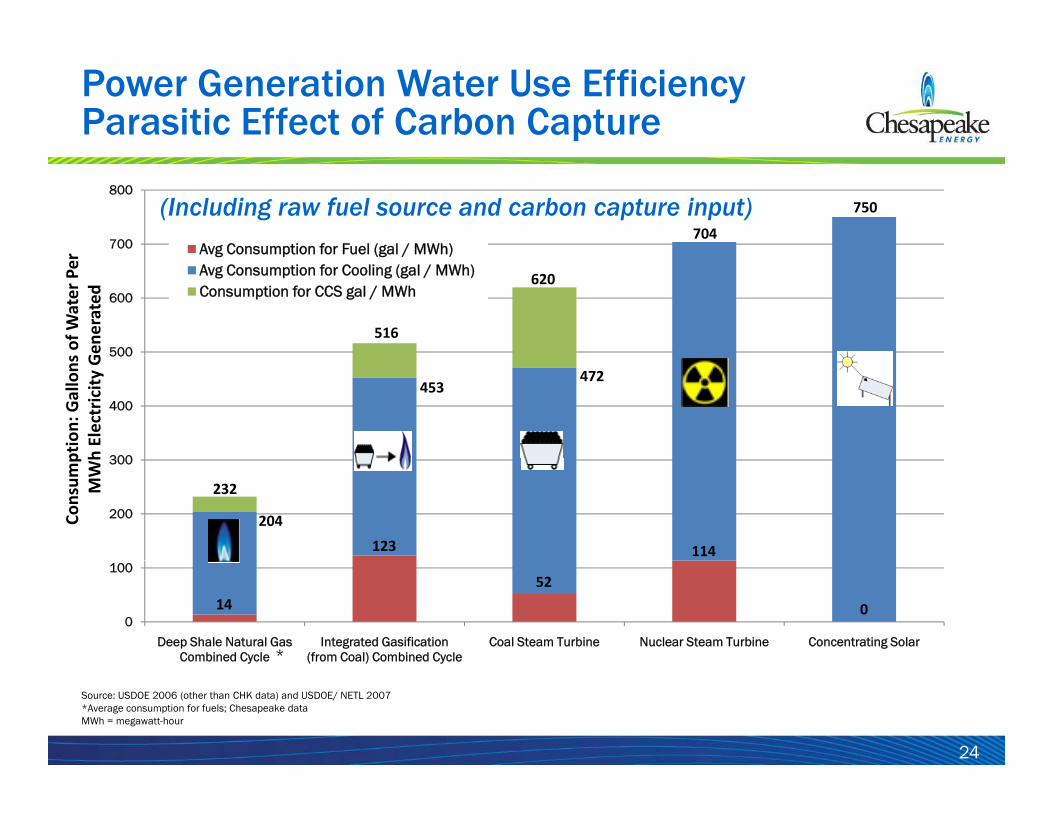
Power Generation Water Use Efficiency Parasitic Effect of Carbon Capture
700
800
Avg Consumption for Fuel (gal / MWh)704
750(Including raw fuel source and carbon capture input)
500
600
Avg Consumption for Fuel (gal / MWh)Avg Consumption for Cooling (gal / MWh)Consumption for CCS gal / MWh
s of W
ater Per
Gen
erated
516
620
300
400
500
ption: Gallons
h Electricity
G
453472
200
300
Consum
pMWh
123 114
204
232
0
100
Deep Shale Natural Gas Combined Cycle
Integrated Gasification (from Coal) Combined Cycle
Coal Steam Turbine Nuclear Steam Turbine Concentrating Solar*
1452
0
24
y ( ) y
Source: USDOE 2006 (other than CHK data) and USDOE/ NETL 2007*Average consumption for fuels; Chesapeake dataMWh = megawatt-hour
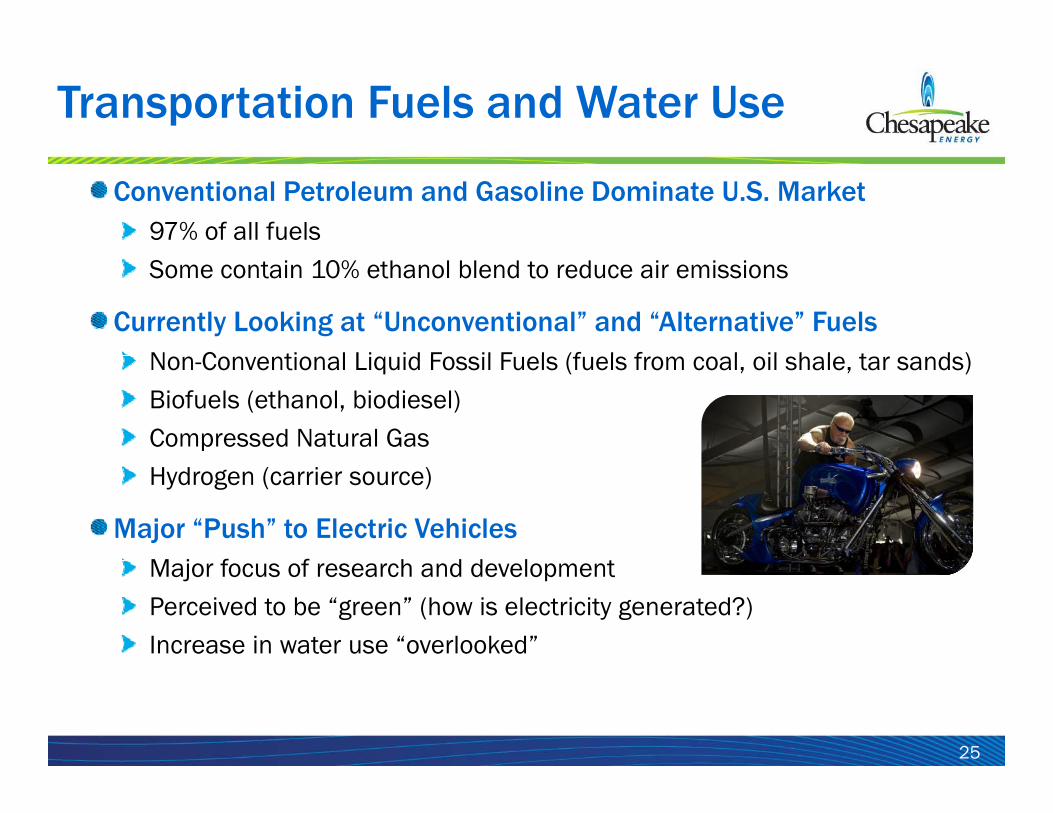
Transportation Fuels and Water Use
Conventional Petroleum and Gasoline Dominate U.S. Market97% of all fuelsSome contain 10% ethanol blend to reduce air emissions
Currently Looking at “Unconventional” and “Alternative” FuelsN C ti l Li id F il F l (f l f l il h l t d )Non-Conventional Liquid Fossil Fuels (fuels from coal, oil shale, tar sands)Biofuels (ethanol, biodiesel)Compressed Natural GasHydrogen (carrier source)
Major “Push” to Electric VehiclesM j f f h d d l tMajor focus of research and developmentPerceived to be “green” (how is electricity generated?)Increase in water use “overlooked”
25
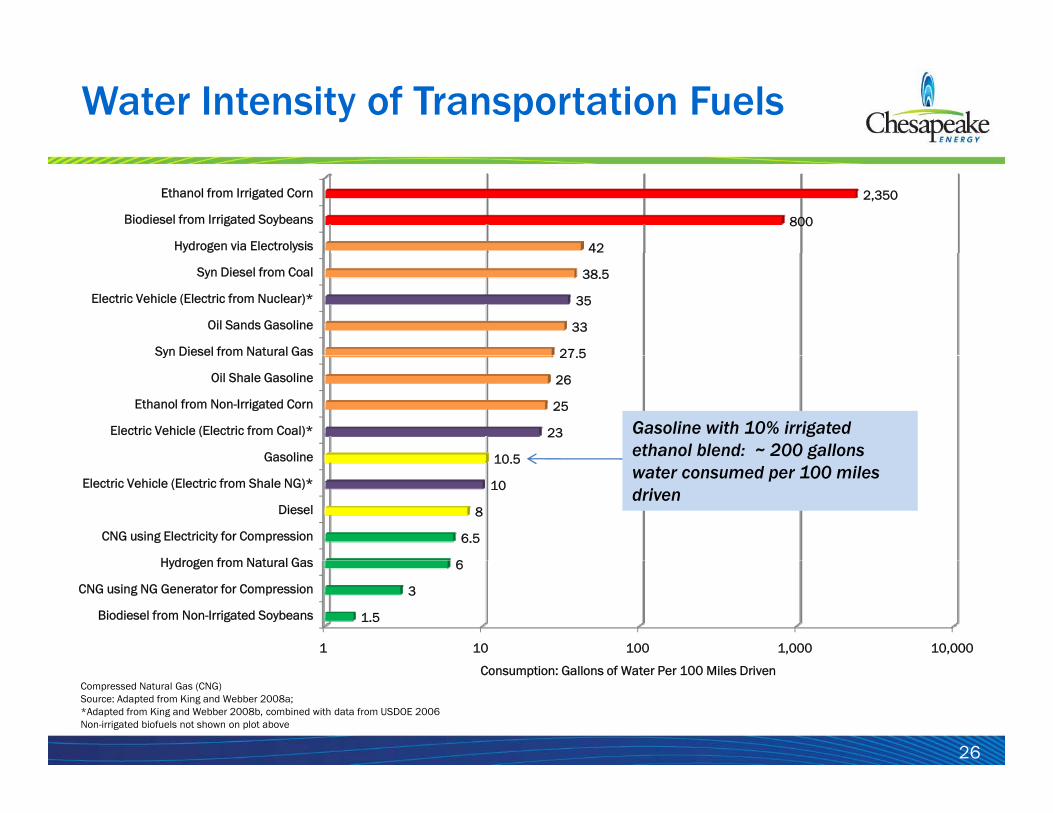
Water Intensity of Transportation Fuels
Hydrogen via Electrolysis
Biodiesel from Irrigated Soybeans
Ethanol from Irrigated Corn
42
800
2,350
Syn Diesel from Natural Gas
Oil Sands Gasoline
Electric Vehicle (Electric from Nuclear)*
Syn Diesel from Coal
27 5
33
35
38.5
Gasoline
Electric Vehicle (Electric from Coal)*
Ethanol from Non-Irrigated Corn
Oil Shale Gasoline
Syn Diesel from Natural Gas
10 5
23
25
26
27.5
Gasoline with 10% irrigated ethanol blend: ~ 200 gallons
Hydrogen from Natural Gas
CNG using Electricity for Compression
Diesel
Electric Vehicle (Electric from Shale NG)*
Gasoline
6
6.5
8
10
10.5 gwater consumed per 100 miles driven
1 10 100 1,000 10,000
Biodiesel from Non-Irrigated Soybeans
CNG using NG Generator for Compression
Hydrogen from Natural Gas
1.5
3
6
26
Consumption: Gallons of Water Per 100 Miles DrivenCompressed Natural Gas (CNG)Source: Adapted from King and Webber 2008a; *Adapted from King and Webber 2008b, combined with data from USDOE 2006Non-irrigated biofuels not shown on plot above
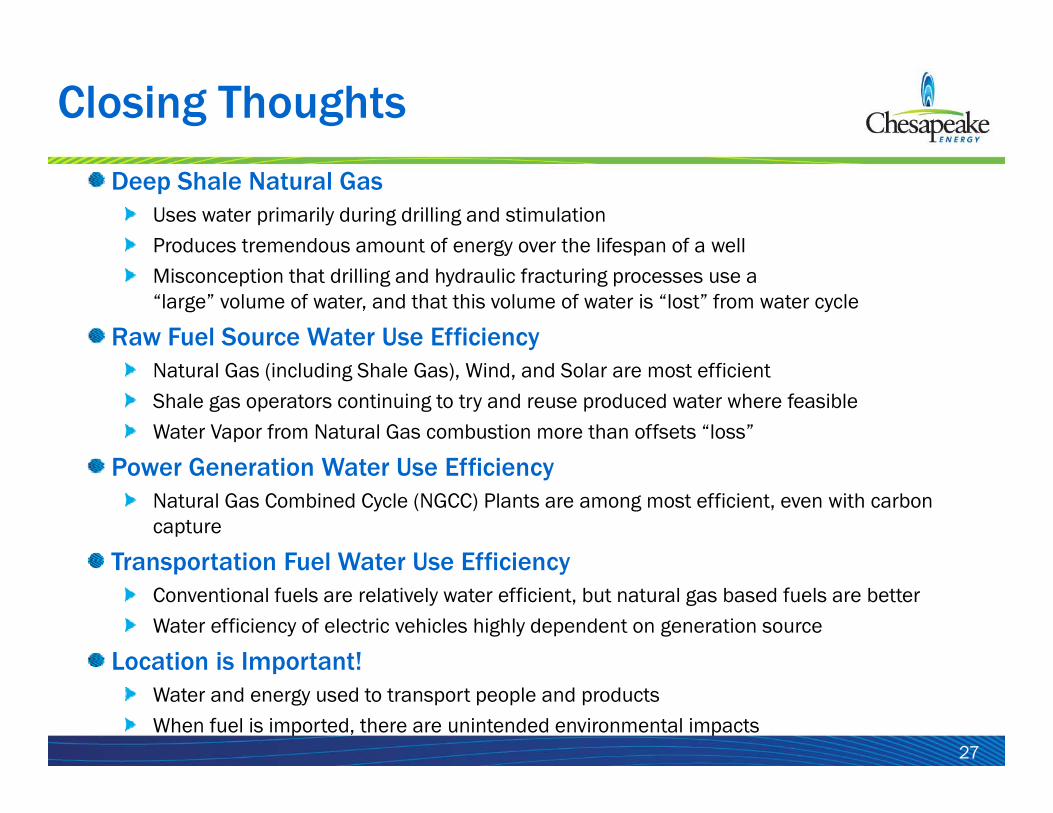
Closing Thoughts
Deep Shale Natural GasUses water primarily during drilling and stimulationProduces tremendous amount of energy over the lifespan of a wellgy pMisconception that drilling and hydraulic fracturing processes use a “large” volume of water, and that this volume of water is “lost” from water cycle
Raw Fuel Source Water Use EfficiencyNatural Gas (including Shale Gas), Wind, and Solar are most efficientShale gas operators continuing to try and reuse produced water where feasibleWater Vapor from Natural Gas combustion more than offsets “loss”
P G i W U Effi iPower Generation Water Use EfficiencyNatural Gas Combined Cycle (NGCC) Plants are among most efficient, even with carbon capture
Transportation Fuel Water Use EfficiencyTransportation Fuel Water Use EfficiencyConventional fuels are relatively water efficient, but natural gas based fuels are betterWater efficiency of electric vehicles highly dependent on generation source
Location is Important!
27
Location is Important!Water and energy used to transport people and productsWhen fuel is imported, there are unintended environmental impacts
2010 GWPC Water / Energy SymposiumEnergy Symposium
Matthew E. Mantell, P.E.Corporate Environmental Engineer
Chesapeake Energy Corporation6100 N Western Avenue ı Oklahoma City OK 76118 ı 405-935-8000
28
6100 N. Western Avenue ı Oklahoma City, OK 76118 ı [email protected] ı chk.com ı NYSE: CHK