h o and hcl trace gas kinetics on crystalline hcl hydrates ... · pdf fileh2o and hcl trace...
TRANSCRIPT

Atmos. Chem. Phys., 14, 5183–5204, 2014www.atmos-chem-phys.net/14/5183/2014/doi:10.5194/acp-14-5183-2014© Author(s) 2014. CC Attribution 3.0 License.
H2O and HCl trace gas kinetics on crystalline HCl hydrates andamorphous HCl / H2O in the range 170 to 205 K: the HCl / H2Ophase diagram revisitedR. Iannarelli and M. J. Rossi
Laboratory of Atmospheric Chemistry (LAC), Paul Scherrer Institute (PSI), PSI Villigen, 5232, Switzerland
Correspondence to:M. J. Rossi ([email protected])
Received: 7 November 2013 – Published in Atmos. Chem. Phys. Discuss.: 27 November 2013Revised: 24 March 2014 – Accepted: 10 April 2014 – Published: 27 May 2014
Abstract. In this laboratory study, H2O ice films of 1 to 2 µmthickness have been used as surrogates for ice particles atatmospherically relevant conditions in a stirred flow reactor(SFR) to measure the kinetics of evaporation and condensa-tion of HCl and H2O on crystalline and amorphous HCl hy-drates. A multidiagnostic approach has been employed usingFourier transform infrared spectroscopy (FTIR) absorptionin transmission to monitor the condensed phase and residualgas mass spectrometry (MS) for the gas phase. An averagestoichiometric ratio of H2O : HCl = 5.8± 0.7 has been mea-sured for HClq6H2O, and a mass balance ratio between HCladsorbed onto ice and the quantity of HCl measured usingFTIR absorption (Nin – Nesc– Nads)/NFTIR = 1.18± 0.12 hasbeen obtained. The rate of evaporationRev(HCl) for crys-talline HCl hexahydrate (HClq6H2O) films and amorphousHCl / H2O mixtures has been found to be lower by a fac-tor of 10 to 250 compared toRev(H2O) in the overlappingtemperature range 175 to 190 K. Variations of the accommo-dation coefficientα(HCl) on pure HClq6H2O up to a fac-tor of 10 at nominally identical conditions have been ob-served. The kinetics (α, Rev) are thermochemically consis-tent with the corresponding equilibrium vapour pressure. Inaddition, we propose an extension of the HCl / H2O phase di-agram of crystalline HClq6H2O based on the analysis of de-convoluted FTIR spectra of samples outside its known exis-tence area. A brief evaluation of the atmospheric importanceof both condensed phases – amorphous HCl / H2O and crys-talline HCl q6H2O – is performed in favour of the amorphousphase.
1 Introduction
After the discovery of the ozone hole over Antarctica, theimportance of heterogeneous chemistry on frozen surfaceshad started to be recognized (Solomon et al., 1986) as wellas the role of polar stratospheric clouds (PSCs) as substrateson whose surfaces heterogeneous reactions may take place.
PSCs are formed in the stratosphere during polar nightwhen the temperatures drop to as low as 183 K to al-low for cloud formation even in the dry stratosphere (Pe-ter, 1997). PSCs are classified according to their composi-tion, consisting either of crystalline NAT (type Ia), ternaryH2SO4 / HNO3 / H2O supercooled solution (type Ib) or pureH2O ice (type II) (Zondlo et al., 2000).
Heterogeneous reactions occurring on PSCs convert themajor unreactive chlorine reservoir compounds, ClONO2and HCl, into molecular chlorine, which is rapidly photol-ysed into atomic chlorine. Reaction (R1) is the most im-portant chlorine-activating reaction in the polar stratospherebecause it converts two moles of unreactive chlorine com-pounds into two moles of atomic chlorine after photolysisin an efficient heterogeneous reaction (Seinfeld and Pandis,2006):
ClONO2(g) + HCl(s) → Cl2(g) + HNO3(s). (R1)
Reaction (R1) belongs to one of the fastest stratospheric re-actions (Friedl et al, 1986; Molina et al., 1985, 1987), ordersof magnitude faster than the corresponding homogeneous gasphase process (Molina et al., 1985). The Cl2 released into thegas phase from Reaction (R1) rapidly photolyses into free Clatoms, which then establish a rapid cycle of O3 destruction.Furthermore, Reaction (R1) also leads to the overall removal
Published by Copernicus Publications on behalf of the European Geosciences Union.

5184 R. Iannarelli and M. J. Rossi: The HCl / H2O phase diagram revisited
of nitrogen oxides from the gas phase, trapping HNO3 in theice and thus facilitating O3 destruction through a catalyticcycle as reported in Reactions (R2)–(R4):
X + O3 → XO + O2 (R2)
XO + O → X + O2 (R3)
net: O3 + O → O2+O2, (R4)
where X is H, OH, NO, Cl or Br leading to HOx, NOx, ClOxand BrOx catalytic cycles, respectively.
The understanding of the interaction of HCl with ice iscrucial in order to determine the availability of HCl at thegas–ice condensed phase interface for Reaction (R1) to ef-fectively happen. To this purpose, the HCl–ice system hasbeen extensively studied over the years by means of dif-ferent techniques. Laminar flow tubes and Knudsen reac-tors are among the most widely used devices when coupledwith diagnostic techniques such as ellipsometry (McNeill etal., 2006), Fourier transform infrared spectroscopy (FTIR)in transmission (Ritzhaupt and Devlin, 1991; Koehler et al.,1993; Delzeit et al., 1993) and reflection–absorption infraredspectroscopy (RAIRS) (Banham et al, 1996; Graham andRoberts, 1997). Two crystalline hydrates have been found attemperatures that may be relevant for the upper troposphereand lower stratosphere, the hexahydrate (HClq6H2O) andthe trihydrate (HClq3H2O). Moreover, amorphous mixturesof variable H2O : HCl ratios, may well be relevant at strato-spheric conditions.
The phase diagram of the HCl / H2O system constructedby Molina and coworkers (Molina, 1994; Wooldridge etal, 1995) indicates that the HCl trihydrate requires HClconcentrations much higher than found in the stratosphere([HCl] = 1–3 ppb; Carslaw et al., 1997) and therefore has noatmospheric relevance. On the other hand, HCl hexahydratemay nucleate at HCl concentrations of atmospheric relevancebut at temperatures lower than normally found during polarnights such that its atmospheric relevance has been ques-tioned as well (Koehler et al, 1993; McNeill et al., 2007;Chiesa and Rossi, 2013). It thus appears that only bulk amor-phous HCl / H2O mixtures have atmospheric relevance atlong atmospheric residence times which are in addition morereactive than the crystalline phase HClq6H2O as far as Re-action (R1) is concerned (McNeill et al., 2006).
In this study we focused our attention on the HCl hex-ahydrate phase (HH) as well as on amorphous mixtures(amHCl) using HCl concentrations comparable to HCl hex-ahydrate in order to compare its behaviour under typicalstratospheric conditions of [H2O] = 2–6 ppm and [HCl] = 1–3 ppb (Carslaw et al., 1997). Our results are in agreementwith previous studies in showing that the irreversible conver-sion of HCl hexahydrate into an amorphous 6: 1 H2O / HClmixture was observed at temperatures higher than 190 K(Graham and Roberts, 1997; Sadtchenko et al., 2000; Chiesaand Rossi, 2013) and that the amorphous HCl / H2O phase
had a larger HCl vapour pressure, thus increased reactiv-ity compared to crystalline HClq6H2O under similar ex-perimental conditions (Chiesa and Rossi, 2013). This in-creased reactivity of an amorphous phase is consistent withthe conclusions that a “disordered” HCl / H2O ice structurewas more reactive in terms of Reaction (R1) compared to a“non-disordered” ice structure (McNeill et al., 2006).
The main focus of this study is, however, the heteroge-neous kinetics of H2O and HCl interacting with crystallineHCl hexahydrate and amorphous HCl / H2O phases, whichhave, to our knowledge, not been studied in detail before.The majority of studies focus on the HCl interaction withice in terms of the total uptake on pure ice films (Abbatt etal., 1992; Hanson and Ravishankara, 1992; Chu et al., 1993;Huthwelker et al., 2004) and only briefly (if not at all) men-tion an uptake coefficientγ or an accommodation coefficientα of HCl on ice in the range 0.1 to 0.3. Others have studiedthe interaction of HCl with ice films in terms of its effects onthe morphology (Sadtchenko et al., 2000) and on the disorderand roughness of the substrate surface (McNeill et al., 2007).
Hynes et al. (2001) reportγ (HCl) = 0.1 at 205 K with asubstantial decrease as the temperature increases with no de-pendence onPHCl, whereas Flückiger et al. (1998) foundγ (HCl) in the range from 0.34 to 0.22 in the temperaturerange 190 to 210 K on pure ice with a negative temperaturedependence, which has been explained using a two-precursormodel (Flückiger and Rossi, 2003). Given the nature of theexperiments, namely laminar flow tubes and Knudsen reac-tors, neither is able to identify the nature of the substrate asthey have no means of investigating the condensed phase un-der the relevant conditions of the uptake experiment. Using astirred flow reactor similar to the one used in this work, Del-val et al. (2003) provided aγ value ranging from 0.05 to 0.01in the temperature range 200 to 235 K and are able to identifythe nature of the substrate by means of FTIR in transmission.
In this work we expand on the results of Delval etal. (2003) by measuring the uptake kinetics of HCl andH2O on HCl-doped ice substrates whose phase identities areknown, namely HCl hexahydrate or an amorphous HCl / H2Omixture, in the temperature range 170–205 K. Using the up-take data of several independent experimental series, wethen obtain the kinetics of the two “elementary” processes,namely the mass accommodation coefficientα(X) and thecorresponding evaporation rateRev(X) for X = H2O and HCl.Regarding the definition of terms, we would like to refer toAmmann et al. (2013). We also discuss the effect of surfacedisorder onα, and we propose a revision of the phase di-agram of the binary HCl / H2O system based on the resultsobtained for the HCl hexahydrate substrates.
In order to achieve this, we have modified and adapted thereactor used by Delval et al. (2003, 2005) and Chiesa andRossi (2013) as well as described the HCl and H2O inter-action with the reactor walls using a Langmuir adsorptionisotherm for both H2O and HCl, both separately and in thepresence of each other, in order to resolve the difficulties in
Atmos. Chem. Phys., 14, 5183–5204, 2014 www.atmos-chem-phys.net/14/5183/2014/
R. Iannarelli and M. J. Rossi: The HCl / H2O phase diagram revisited 5185
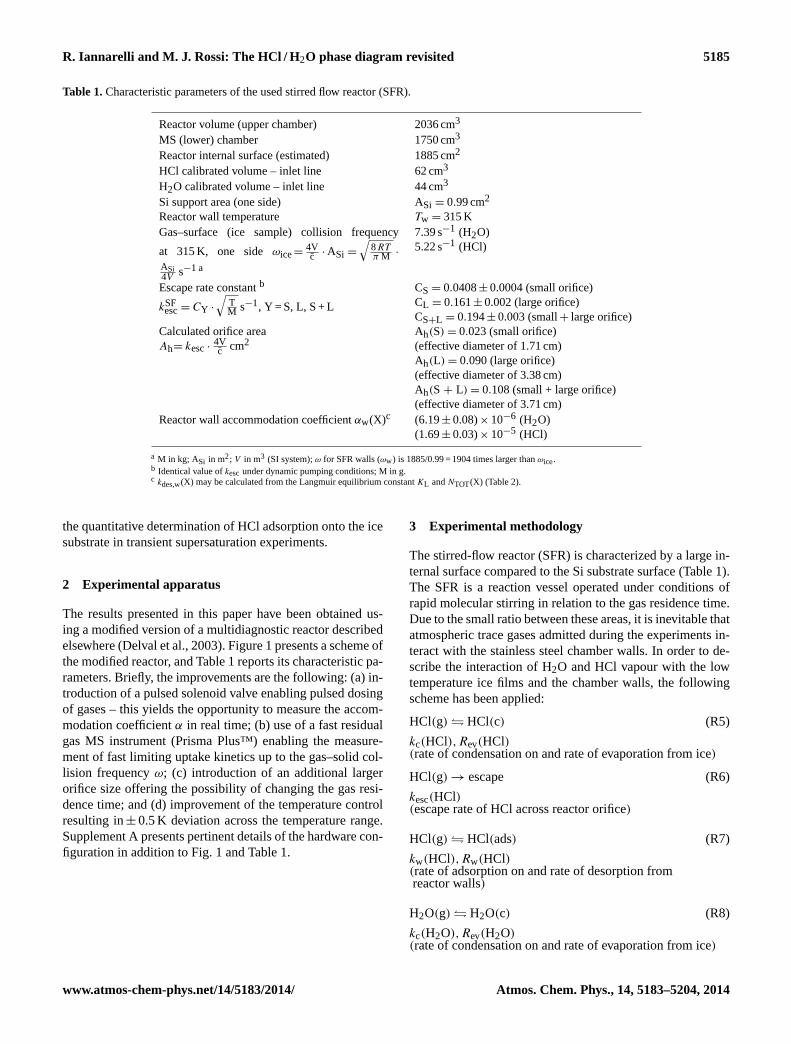
Table 1.Characteristic parameters of the used stirred flow reactor (SFR).
Reactor volume (upper chamber) 2036 cm3
MS (lower) chamber 1750 cm3
Reactor internal surface (estimated) 1885 cm2
HCl calibrated volume – inlet line 62 cm3
H2O calibrated volume – inlet line 44 cm3
Si support area (one side) ASi = 0.99 cm2
Reactor wall temperature Tw = 315 KGas–surface (ice sample) collision frequency
at 315 K, one sideωice=4Vc̄ · ASi =
√8RTπ M ·
ASi4V
s−1 a
7.39 s−1 (H2O)5.22 s−1 (HCl)
Escape rate constantb
kSFesc= CY ·
√TM s−1, Y = S, L, S + L
CS = 0.0408± 0.0004 (small orifice)CL = 0.161± 0.002 (large orifice)CS+L = 0.194± 0.003 (small+ large orifice)
Calculated orifice areaAh= kesc·
4Vc̄ cm2
Ah(S) = 0.023 (small orifice)(effective diameter of 1.71 cm)Ah(L) = 0.090 (large orifice)(effective diameter of 3.38 cm)Ah(S + L) = 0.108 (small + large orifice)(effective diameter of 3.71 cm)
Reactor wall accommodation coefficientαw(X)c (6.19± 0.08)× 10−6 (H2O)(1.69± 0.03)× 10−5 (HCl)
a M in kg; ASi in m2; V in m3 (SI system);ω for SFR walls (ωw) is 1885/0.99 = 1904 times larger thanωice.b Identical value ofkescunder dynamic pumping conditions; M in g.c kdes,w(X) may be calculated from the Langmuir equilibrium constantKL andNTOT(X) (Table 2).
the quantitative determination of HCl adsorption onto the icesubstrate in transient supersaturation experiments.
2 Experimental apparatus
The results presented in this paper have been obtained us-ing a modified version of a multidiagnostic reactor describedelsewhere (Delval et al., 2003). Figure 1 presents a scheme ofthe modified reactor, and Table 1 reports its characteristic pa-rameters. Briefly, the improvements are the following: (a) in-troduction of a pulsed solenoid valve enabling pulsed dosingof gases – this yields the opportunity to measure the accom-modation coefficientα in real time; (b) use of a fast residualgas MS instrument (Prisma Plus™) enabling the measure-ment of fast limiting uptake kinetics up to the gas–solid col-lision frequencyω; (c) introduction of an additional largerorifice size offering the possibility of changing the gas resi-dence time; and (d) improvement of the temperature controlresulting in± 0.5 K deviation across the temperature range.Supplement A presents pertinent details of the hardware con-figuration in addition to Fig. 1 and Table 1.
3 Experimental methodology
The stirred-flow reactor (SFR) is characterized by a large in-ternal surface compared to the Si substrate surface (Table 1).The SFR is a reaction vessel operated under conditions ofrapid molecular stirring in relation to the gas residence time.Due to the small ratio between these areas, it is inevitable thatatmospheric trace gases admitted during the experiments in-teract with the stainless steel chamber walls. In order to de-scribe the interaction of H2O and HCl vapour with the lowtemperature ice films and the chamber walls, the followingscheme has been applied:
HCl(g) � HCl(c) (R5)
kc(HCl),Rev(HCl)(rate of condensation on and rate of evaporation from ice)
HCl(g) → escape (R6)
kesc(HCl)(escape rate of HCl across reactor orifice)
HCl(g) � HCl(ads) (R7)
kw(HCl),Rw(HCl)(rate of adsorption on and rate of desorption fromreactor walls)
H2O(g) � H2O(c) (R8)
kc(H2O),Rev(H2O)(rate of condensation on and rate of evaporation from ice)
www.atmos-chem-phys.net/14/5183/2014/ Atmos. Chem. Phys., 14, 5183–5204, 2014

5186 R. Iannarelli and M. J. Rossi: The HCl / H2O phase diagram revisited
H2O(g) → escape (R9)
kesc(H2O)(rate of escape of H2O across reactor orifice)
H2O(g) � H2O(ads) (R10)
kw(H2O),Rw(H2O)(rate of adsorption on and rate of desorption fromreactor walls)
where kc(HCl) and kc(H2O) are the condensation rateconstants on ice in s−1 for HCl and H2O, Rev(HCl)and Rev(H2O) the evaporation rates from the ice inmolec s−1 cm−3, kw(HCl) andkw(H2O) the adsorption rateconstants onto the reactor walls,Rw(HCl) and Rw(H2O)the desorption rates from the walls in molec s−1 cm−3 andkesc(HCl) and kesc(H2O) the effusion rate constants out ofthe reactor in s−1, respectively.
The aim of this study is to separate the rate of evapora-tion Rev and the accommodation coefficientα on ice for bothgases, HCl and H2O, in order to obtain the kinetics of evapo-ration and condensation. Both kinetic parameters are subse-quently combined to obtain the corresponding HCl and H2Oequilibrium vapour pressures that may be compared to lit-erature measurements. This approach is known as thermo-chemical kinetics where thermodynamic parameters are usedas thermodynamic constraints for the measured kinetics.
For a gas X (HCl, H2O), the following flow balance equa-tion holds in the presence of ice at steady state:
Fin(X) + F des(X) + F ev(X) (1)
= FSS(X) + Fads,w(X) + Fads,ice(X),
where all terms are flow rates in molec s−1. In particular,Finis the chosen flow rate of molecules admitted in the reactor,Fdes the flow rate of molecules desorbing from the reactorwalls, Fev the flow rate of molecules evaporating from theice surface,FSS the flow rate of molecules effusing throughthe leak valve into the MS chamber,Fads,w the flow rate ofmolecules adsorbing onto the reactor walls andFice,w theflow rate of molecules adsorbing onto the ice film.
We assume that the adsorption onto the walls can be de-scribed as a Langmuir-type adsorption, and under this as-sumption, Eq. (1) may be expressed as follows (see Supple-ment B for the mathematical derivation) for a gas X (HCl,H2O):
V · Rin(X) + NTOT · kdes,w(X) · θ + V · Rev(X) (2)
= V · RSS(X) + Sw ·αw(X) · c̄
4(1− θ) · [X]
+ Sice ·αice(X) · c̄
4· [X],
where V is the reactor volume in cm3, Rin the rate ofmolecules X admitted in the chamber in molec s−1 cm−3,
1186
Figure 1: Schematic drawing of the reactor used in this work. The diagnostic tools are 1187
highlighted in red and important parameters are listed in Table 1. The ice film is 1188
deposited on both sides of the 1” diameter Si window (black vertical symbol hanging 1189
from cryostat inside reaction vessel). 1190
1191
Figure 1. Schematic drawing of the reactor used in this work. Thediagnostic tools are highlighted in red, and important parameters arelisted in Table 1. The ice film is deposited on both sides of the 1′′
diameter Si window (black vertical symbol hanging from cryostatinside reaction vessel).
NTOT the total number of molecules X adsorbed onto thereactor walls,kdes,w(X) the desorption rate constant fromthe reactor walls in s−1, θ the fractional surface coverage interms of a molecular monolayer,Rev the rate of evaporationof X from the ice in molec s−1 cm−3, RSS the rate of effusionthrough the leak valve in molec s−1 cm−3, Sw and Sice thesurfaces of the reactor walls and the ice film in cm2, αw andαice the accommodation coefficients of X on the walls andon the ice film and̄c the mean thermal velocity of a moleculein cm s−1, respectively.
In order to measure the four unknown parameters inEq. (2), namelykdes,w, Rev, αw and αice, a three-prongedstrategy has been adopted: first, pulsed valve experimentswith the cryostat at ambient temperature (no ice) have beenused in order to measureαw for HCl and H2O. Second, theLangmuir adsorption isotherms at ambient temperature forthe interaction of HCl and H2O with the reactor walls in theabsence of ice have been measured andkdes,w has been ob-tained. Finally, a combination of pulsed valve and steady-state experiments has been used in order to measureαice andRev, respectively, for both HCl and H2O. The details of thedifferent steps follow below. We emphasize that the combi-nation of a real-time (pulsed valve, PV) experiment with asteady-state flow experiment results in data of superior qual-ity compared to the combination of two steady-state flow ex-periments owing to the difference of two large numbers in
Atmos. Chem. Phys., 14, 5183–5204, 2014 www.atmos-chem-phys.net/14/5183/2014/

R. Iannarelli and M. J. Rossi: The HCl / H2O phase diagram revisited 5187
the latter case. Therefore, we have used the combination ofPV/steady-state flow throughout this study because the ori-fice sizes are not of sufficiently different size in order to af-ford stable numerics in the evaluation of rate data.
3.1 Pulsed valve experiments at roomtemperature
PV experiments are experiments where a transient supersat-uration of gas is created in the reactor by admitting a shortpulse of molecules in the range 1016–1017 molecules perpulse. The admitted dose depends on the stagnant pressureof the reservoir as well as the pulse duration. In order to de-termine the number of molecules admitted with each pulse,the dose dependence has been calibrated using inertN2 asadmitted gas, yielding a typical dose of 5.8× 10¹⁴ moleculesper millisecond duration of the pulse per Torr of pressure inthe gas reservoir. The upper limit of 1017 molecules pulse−1
leads to an upper limiting transient pressure of approximately5 mTorr which still corresponds to molecular flow condi-tions.
With the cryostat at ambient temperature, PV experimentsmay be used to measure the uptake of HCl and H2O onto thereactor walls. In the aftermath of a calibrated pulse of knowndose, the exponential decay of the mass spectrometer (MS)signal at massm/z 18 or 36 (kd) is given by the sum of themeasured effusion (kesc) and adsorption rate constant (kw)on the reactor walls, namelykd = kesc+ kw (Flückiger et al.,1998).
The measured acquisition frequency of thePrisma™control unit, expressed as the number of datapoints recorded per second, is approximately 3 s−1, toosmall to measure decay rate constants in the range 2.5–0.2 s−1 or higher. Therefore, in all PV experiments we haveused a PrismaPlus™control unit, which has an acquisitionfrequency of 250 s−1per data point. If we take seven pointsin order to define a decay curve, we obtain an upper limitfor the measurement of a decay rate constant of 35 s−1, highenough to measure the largest rate constants we expect.These rate constants may in principle go up all the way toequalω in case the uptake coefficient were unity. Owingto the small sample area in the present SFR, it becomespossible to experimentally measure potentially very largeuptake or accommodation coefficients which would not bepossible in Knudsen or fast laminar flow reactors owing tomuch larger values ofω. The dose admitted with each pulsehas been calibrated using a non-reactive gas and measuringthe total number of molecules admitted in the aftermath ofa pulse as a function of the pulse duration and the reservoirbacking pressure by time-integrating the calibrated MSsignal that itself was calibrated using a steady-state flowof the same gas coupled to a measurement of the pressuredecrease with time in a calibrated volume.
Figure S1 in the Suppelement shows an example of pulsesadmitted into the reactor: the dark blue and red curves cor-
respond to pulses of H2O and HCl molecules, respectivelyin the absence of ice. Series of pulses at different doses havebeen used to determine the accommodation coefficientsαw,which are related to the adsorption rate constants as follows:
αw =kw
ωw, (3)
whereωw is the calculated gas–surface collision frequencyin s−1 scaled to the internal walls of the SFR and given inTable 1.
The accommodation coefficient of H2O on the walls isαw(H2O) = (6.19± 0.08)× 10−6 and is roughly 4 orders ofmagnitude smaller than the measuredαice(H2O) at temper-atures in the range 170 to 200 K, namelyαice(H2O) ≈ 0.1(see below). Since the ratio between the internal wall and theice surface area is approximately 1000, we consider the in-ternal walls as an active surface that can act as a source or asink for H2O vapour, depending on its partial pressure. Thecontribution of the walls is even more important for HCl:the accommodation coefficient of HCl vapour on the walls isαw(HCl) = (1.69± 0.03)× 10−5, only a factor of 70 smallerthan the lowest value ofαice(HCl) = 1.2× 10⁻³ correspond-ing to the worst case scenario for HCl (Table 1).
3.2 Langmuir adsorption isotherms for H2O andHCl on stainless-steel reactor walls at roomtemperature
In this work, we assumed that the adsorption onto the wallsmay be described as a Langmuir adsorption. Under this as-sumption, the coverage of the surface wallsθ is a function ofthe concentration of the gas X (HCl, H2O) as follows:
θ([X]) =KL[X]
1+ KL[X], (4)
whereKL (cm3 molec−1) is the Langmuir constant, which isthe equilibrium constant for the adsorption process, namelyKL = kc(X)
/Rev(X), wherekc(X) is the condensation rate
constant in s−1. When steady-state conditions are estab-lished, the concentration of a gas X (X = H2O, HCl) in theSFR reactor is given by Eq. (5):
[X]SS=FSS(X)
kesc(X) · V. (5)
In order to obtain the coverageθ , we introduce a controlledflow of a gas X into the chamber at SFR conditions and waitfor steady state to be established by monitoring the effusionflow using the MS. For non-interactive gases, the timescale toreach steady-state conditions is given by the residence timeτr = k−1
esc. Any decrease beyondτr has been attributed to therate of adsorption of gas molecules onto the walls of the re-actor, according toτr = (kesc+ kw)−1.
Figure S2 in the Supplement shows the results of an exper-iment performed using HCl vapour: the grey curve represents
www.atmos-chem-phys.net/14/5183/2014/ Atmos. Chem. Phys., 14, 5183–5204, 2014

5188 R. Iannarelli and M. J. Rossi: The HCl / H2O phase diagram revisited
n-steps of increasing flows of HCl effusing from the reactoras measured by the calibrated MS, corresponding to increas-ing HCl flows introduced into the reactor chamber. The redshaded area represents the difference between the hypotheti-cal effusion flowFesc,hypo, corresponding to a non-interactivecase with no adsorption of H2O or HCl onto the walls, andthe measured flowFesc,measfor eachj -th time interval. Asmentioned above, we attribute this difference to the rate ofadsorption of gas molecules onto the reactor walls. Underthis assumption, for each time intervalj the red shaded areain Fig. S2 in the Supplement is the total number of moleculesadsorbed onto the reactor walls, which may be calculated ac-cording to Eq. (6):
Nj
ads,w(X)=∫ (
Fesc,hypo(t) − Fesc,meas(t))· dt, (6)
with Fesc,hypoandFesc,measin molec s−1 andNj
ads,w(X), thecumulative number of molecules X adsorbed at eachj -thtime interval, respectively. The total cumulative number ofmolecules of gas X adsorbed onto the wallsNX
ads,w is the sum
of all N j
ads,w(X) and a function of the steady-state concentra-tion of the gas X (HCl, H2O) and may be expressed in termsof a Langmuir constant as follows:
NXads,w([X]) =
NXTOT · KL[X]
1+ KL[X], (7)
whereNXTOT is the total maximum number of molecules X
that can be adsorbed on the total internal surface of the SFRvessel. We calculated the coverage as a function of concen-tration as expressed in Eq. (4) as the ratio betweenNX
ads,wand
NXTOT:
θ([X])=NX
ads,w
NXTOT
. (8)
The experiments were performed under two different condi-tions:
– Pure gas system: only one selected gas was introducedinto the reactor (HCl or H2O).
– Binary system: the main gas has been introduced intothe reactor together with a constant flow of the othergas in order to simulate the planned experiments at lowtemperatures.
Figure 2 shows the results for the construction of a Langmuiradsorption isotherm in terms of the wall coverageθ obtainedfrom Eq. (8) for HCl and H2O interacting with the stainless-steel walls at 315 K as a function of gas concentration ac-cording to Eq. (5).
The red circles represent experiments with a pure H2Oflow admitted into the reactor, and the green circles repre-sent experiments where an additional constant flowFIN =
8× 10¹⁴ molec s−1 of HCl was introduced into the reactortogether with the variable H2O flow.
1192
Figure 2: Wall coverage as a function of HCl and H2O concentration interacting with 1193
the reactor walls according to Langmuir using data of the type displayed in Fehler! 1194
Verweisquelle konnte nicht gefunden werden.. The red symbols represent the 1195
interaction of pure H2O and the green symbols the interaction of H2O in the presence 1196
of an additional HCl flow Fin(HCl) = 8⋅1014 molec s-1 admitted into the reactor. 1197
Similarly, the black symbols represent the interaction of pure HCl, the blue symbols 1198
the interaction of HCl in the presence of an additional H2O flow Fin(H2O) = 1199
(3÷6)·1015 molec s-1 admitted into the reactor. The parameters of the fitting curves 1200
may be found in Table 2. 1201
1202
Figure 2. Wall coverage as a function of HCl and H2O concentra-tion interacting with the reactor walls according to Langmuir usingdata of the type displayed in Fig. S2 in the Supplement. The redsymbols represent the interaction of pure H2O and the green sym-bols the interaction of H2O in the presence of an additional HClflow Fin(HCl) = 8× 10¹⁴ molec s−1 admitted into the reactor. Sim-ilarly, the black symbols represent the interaction of pure HCl, theblue symbols the interaction of HCl in the presence of an additionalH2O flow Fin(H2O) = (3–6)× 1015molec s−1 admitted into the re-actor. The parameters of the fitting curves may be found in Table 2.
The black triangles represent the interaction of pure HCl,the blue triangles the interaction of HCl in the presence of anadditional H2O flow admitted into the reactor. For HCl weadopted a similar approach but the results are different: in thepresence of additional H2O flow, the HCl coverage is lower,in contrast to the previous case. In the following discussionwe will attempt an interpretation of this difference.
NTOT represents the total maximum number of moleculesthat can be adsorbed onto the stainless-steel surface.For H2O, in the presence of HCl, it corresponds toNMAX (HCl) = 4.45× 10¹⁴ molec cm−2, approximately 45 %of a formal monolayer coverage of H2O on ice (1ML(H2O) = 1× 10¹⁵ molec cm−2), whereas for pure HCl itcorresponds toNMAX (H2O) = 2.68× 10¹⁴ molec cm−2.
The number of molecules in a formal monolayer (ML) ofHCl may be estimated from bulk densities using the expres-sion ML = (ρNA /M)2/3, whereρ, NA and M are the bulk den-sity, Avogadro’s number and molar mass, respectively. Thedensityρ = 1.490 kg l−1 for pure liquid HCl atT =−85◦C(CRC Handbook) yields a value for one ML of 8.53× 10¹⁴
molec cm−2. TheMatheson Gas Data Bookprovides a den-sity of ρ = 0.879 kg l−1 for liquid HCl at T = 10◦C andP = 32 atm, from which a value for one ML of 6.0× 10¹⁴
molec cm−2 may be calculated. This last value has been usedin the present work given the temperature of the reactor in-ternal surfaces (Tw = 42◦C) comparable to the entry given intheMatheson Gas Data Book. The maximum HCl coveragein the present system (NMAX = 2.68× 10¹⁴ molec cm−2) ob-tained from the Langmuir isotherm at saturation corresponds
Atmos. Chem. Phys., 14, 5183–5204, 2014 www.atmos-chem-phys.net/14/5183/2014/

R. Iannarelli and M. J. Rossi: The HCl / H2O phase diagram revisited 5189
therefore to approximately 45 % of a formal monolayer cov-erage of HCl on stainless steel. We also report that, on ice,a formal monolayer of HCl has been measured by Hensonet al. (2004) as 2.3× 10¹⁴ molec cm−2 using BET analy-sis, which compares well with our measurement ofNMAXand points to a coverage of approximately 1 formal mono-layer of HCl on the system internal surfaces on the basis of2.3× 1014 molec cm−2 of HCl for a monolayer coverage onice. However, the consensus value for HCl coverage on an icefilm is closer to 2.7× 10¹⁴ molec cm−2 (Chiesa and Rossi,2013).
For a gas X, the Langmuir equilibrium constant is a func-tion of the accommodation coefficientαw(X) and the desorp-tion rate constantkdes,w(X) (s−1) according to Eq. (9) (seeSupplement B, Eq. S11):
KL=SW · αW(X) · c̄/
4NX
TOT · kdes,w(X), (9)
where SW is the internal surface in cm2 and NTOT the to-tal number of adsorption sites on the surface for moleculeX. The fitting parameters of the Langmuir isotherms provideKL andNTOT for the present experimental system, whereasαw(X) has been measured directly from the real-time PV ob-servation as reported in Sect. 3.1 thus allowing the calcula-tion of kdes,w(X).
3.3 Pulsed valve and steady-state experiments atlow temperatures
As mentioned above, a combination of PV and steady-stateexperiments has been used to measureαice andRev, respec-tively, for both HCl and H2O interacting with the thin icefilm. After the growth of the selected substrate according tothe protocols reported above, the thin film is set to a chosentemperature. When steady-state conditions are established,a series of three gas (HCl, H2O) pulses at intervals of ap-proximately 60 s is admitted into the reactor. Similarly to PVat room temperature, the exponential decay of the MS sig-nal at m/z 18 or 36 (kd) is given by the sum of the mea-suredkesc, the adsorption rate constant on the walls (kw)and the adsorption rate constant (kice) onto the ice, namelykd = kesc+ kw + kice, in the aftermath of a pulse. We thencalculate the accommodation coefficientαice(X) of a gas X(X = HCl, H2O) onto the ice substrates according to Eq. (10)with ωice given in Table 1:
αice=kice
ωice. (10)
The steady-state MS signal established before the pulse se-ries represents the flow rate of molecules effusing through theleak valveFSS(X) in Eq. (1) and it may be used to calculateRev(X) from Eq. (2). Figure S3 in the Supplement shows anexample of the combined PV and steady-state experimentsfor H2O pulses as a function of time on an HCl hexahydrate
(HH) substrate taking note of the large disparity of the MSsignal for HCl and H2O. H2O flow rate with a series of pulsesat temperatures of 176 and 181.5 K is shown in blue on theright axis of Fig. S3 in the Supplement. The red curve on theleft axis represents the corresponding HCl flow rate at thesame temperatures. At 176 K, the correspondent flow ratesof H2O and HCl are measured. Subsequently, for technicalreasons, only the H2O signal atm/z 18 is recorded, and aseries of three H2O pulses is admitted into the reactor. Fromthe pulse decay ratekd, αice(H2O) may be calculated accord-ing to Eq. (10). As the temperature is increased to 181.5 K,both massesm/z 18 and 36 are again recorded. When steadystate is established for the new target temperature, a new se-ries of H2O pulses is admitted. The steady-state flow beforethe pulse series representsFSS(H2O) in Eq. (1), and it maybe used to calculateRev(H2O) from Eq. (2). This protocolhas been applied using HH and amHCl as substrates as wellas alternating H2O and HCl as probing gases using a seriesof pulses at temperatures in the range 167 to 203 K. The or-ange curve in Fig. S1 in the Supplement shows an exampleof HCl pulses over ice, compared to a pulse (red curve) in theabsence of ice.
With the separation ofRev andαice for both HCl and H2O,we may calculate the equilibrium vapour pressurePeq(X) foreach gas, corrected according to Eq. (S2) in the Supplement,as follows:
Peq(X) =Rev(X)
kc(X)·RT
NA, (11)
whereR is the molar gas constant in cm3 Torr K−1 mol−1, T
the temperature of the thin film in K andNA the Avogadroconstant in molec mol−1. In our current setup only one gas ata time can be used for PV experiments. When the ice film isexposed to a transient supersaturation of H2O andαice(H2O)and FSS(H2O) are measured, we may calculatePeq(H2O),whereas onlyFSS(HCl) can be measured, as shown in Fig. S3in the Supplement.
The flowFSS(HCl) may still be used to calculatePeq(HCl)in H2O-PV experiments when coupled withαice(HCl) mea-sured in HCl-PV experiments according to Eqs. (2) and (11).
Similarly, when the ice film is exposed to an HCl pulse,bothαice(HCl) andFSS(HCl) are measured in order to calcu-late Peq(HCl) and onlyFSS(H2O) is obtained.FSS(H2O) isthen coupled withαice(H2O) from H2O-PV experiments inorder to calculatePeq(H2O) in HCl-PV experiments.
4 Results
In the following section the results obtained applyingthe method described above will be presented. As men-tioned before, once the selected substrate, amHCl or HH,has been grown according to the corresponding protocoland characterized using its FTIR absorption spectrum (seebelow), the film is set to a chosen temperature. When
www.atmos-chem-phys.net/14/5183/2014/ Atmos. Chem. Phys., 14, 5183–5204, 2014

5190 R. Iannarelli and M. J. Rossi: The HCl / H2O phase diagram revisited
steady-state conditions are established, the correspondingflows FSS(H2O) andFSS(HCl) are recorded. Subsequently,the series of gas X (HCl, H2O) pulses are admitted intothe reactor, from whichαice(X) may be calculated accord-ing to Eq. (10). The film is then set to a higher temperature,FSS(H2O) andFSS(HCl) are recorded and the series of pulsesrepeated on the same ice sample. The cumulative dose on theice sample has been measured as the difference between theadmitted dose and the number of molecules effused from thereactor in the aftermath of each pulse. This experimental pro-tocol has been repeated for each measured point in the tem-perature interval of interest and repeated for both series ofgas, HCl and H2O, pulses.
4.1 Amorphous HCl / H2O mixture thin films
The results for amHCl are reported in Fig. 3. Figure 3a showsthe measuredαice(X), X = (H2O, HCl), as a function of tem-perature.αice(H2O) on pure ice (inverse blue triangles) variesfrom 0.12 at 175 K to 0.054 at 203 K.αice(H2O) on amHCl(red circles) decreases as a function of temperature, beingequal toαice(H2O) on pure ice within experimental error inthe range 175–185 K and lower by approximately 20 % attemperatures higher than 185 K. Coloured triangles repre-sent results forαice(HCl) on amHCl, where the colour scalegives the accumulated dose of HCl on the HCl-doped icefilm after each pulse.αice(HCl) is equal within experimen-tal error toαice(H2O) on pure ice up to 180 K and lower bya factor of approximately 2 above 180 K. Consistent with theexperimental protocol, the ice samples are increasingly en-riched in HCl as the temperature increases. Fresh ice sam-ples have been exposed to HCl pulses at temperatures of194 and 200 K, andαice(HCl) is higher by a factor of 1.5and 1.25 compared to aged samples, respectively. This re-sult compares favourably with the observation of Flückigeret al. (1998), who have noticed a dose dependence of the ki-netics of HCl adsorption on pure ice exposed to transient su-persaturation.
Figure 3b shows results forRev in molec s−1 cm−3 as afunction of temperature. Inverse blue triangles representRevof pure ice, red circles H2O and black triangles HCl results,respectively.Rev(HCl) is significantly different, lower by afactor of 10 in the temperature range 175–185 K and lower byup to a factor of 100 at temperatures higher than 185 K com-pared toRev(H2O), which is equal toRev(H2O) of pure iceacross the temperature range 175–205 K. This result furtherconfirms the finding of Delval et al. (2003) that the evapora-tion of H2O, despite the presence of adsorbed HCl onto theice substrate, takes place at a rate characteristic of pure icein a H2O-enriched substrate, which is at a low HCl contentof the condensed phase. The full green line shows the rateof evaporation of pure water for the system in use calculatedfrom literature results of equilibrium vapour pressure (Martiand Mauersberger, 1993) usingα = 1, whereas the dashedgreen line represents extrapolated values ofRev(H2O) for
1203
Figure 3: Synopsis of kinetic results for amHCl using H2O, HCl as a probe gas. The 1204
symbols used are explained in the text. The calculated relative error for α is 10%. The 1205
relative errors calculated for Rev(HCl) and Peq(HCl) are 30% whereas for Rev(H2O) 1206
and Peq(H2O) they are 25%. Examples of the amplitude of the errors are reported for 1207
selected points. The green line shows results from Marti and Mauersberger, 1993. The 1208
colour scale shows the cumulative adsorbed dose after HCl pulsed gas admission. 1209
1210
Figure 3. Synopsis of kinetic results for amHCl using H2O, HCl asa probe gas. The symbols used are explained in the text. The cal-culated relative error forα is 10 %. The relative errors calculatedfor Rev(HCl) andPeq(HCl) are 30 %, whereas forRev(H2O) andPeq(H2O) they are 25 %. Examples of the amplitude of the errorsare reported for selected points. The green line shows results fromMarti and Mauersberger (1993). The colour scale shows the cumu-lative adsorbed dose after HCl pulsed gas admission.
temperatures lower than 173 K using the expression providedby Marti and Mauersberger (1993).
Figure 3c shows the results forPeq in Torr calculated ac-cording to Eq. (11) for both H2O and HCl. The same sym-bols as in Fig. 3b are used.Peq(HCl) of amHCl is lower bya factor of 100 at temperatures higher than 185 K comparedto Peq(H2O) of amHCl, which is equal within experimentaluncertainty toPeq(H2O) of pure ice. At temperatures lowerthan 185 K,Peq(HCl) of amHCl is still lower thanPeq(H2O)of amHCl but only by a factor of 10, less so than at highertemperatures. The solid and dashed green lines represent thevapour pressure of water as in Fig. 3b.
The values obtained for the equilibrium vapour pressurehave been compared with the HCl / H2O phase diagram con-structed by Molina and coworkers (Abbatt, 1992; Molina,1994; Wooldridge, 1995). Figure 4 shows the results foramHCl films, which all lie within the existence area of HH.
Atmos. Chem. Phys., 14, 5183–5204, 2014 www.atmos-chem-phys.net/14/5183/2014/

R. Iannarelli and M. J. Rossi: The HCl / H2O phase diagram revisited 5191
1211
Figure 4: Binary phase diagram of the HCl/H2O system reconstructed from Molina 1212
and coworkers (Abbatt, 1992; Molina, 1994; Wooldridge, 1995). The full triangles 1213
represent calculated values of Peq(HCl) for amHCl using the kinetic data of the 1214
present work. Different colours represent different experiment series. 1215
1216
Figure 4. Binary phase diagram of the HCl / H2O system recon-structed from Molina and coworkers (Abbatt, 1992; Molina, 1994;Wooldridge, 1995). The full triangles represent calculated valuesof Peq(HCl) for amHCl using the kinetic data of the present work.Different colours represent different experiment series.
This is expected since the cumulative dose admitted into thereactor chamber is the same used during the HH growth pro-tocol, namely 5× 10¹⁷ molecules of HCl compared to ap-proximately 4× 10¹⁸ molecules of H2O, corresponding to anaverage mole fractionχHCl = 0.111.
4.2 Crystalline hexahydrate films
The results for HH are reported in Fig. 5. Figure 5a showsthe measuredαice(X) as a function of temperature. Inverseblue triangles representαice(H2O) on pure ice, as shown inFig. 3. αice(H2O) on HH (red circles) decreases a functionof temperature and is lower by a factor of approximately1.5 thanαice(H2O) on pure ice at temperatures higher than185 K. Coloured triangles represent results forαice(HCl) onHH, with the colour scale showing the cumulative dose ofHCl on the HCl-doped ice film.αice(HCl) shows larger scat-ter compared to amHCl with a variation up to a factor of 10for results at the same temperature across the full temper-
1217
Figure 5: Synopsis of kinetic results for HH using H2O, HCl as a probe gas. The 1218
symbols used are explained in the text. The calculated relative error for α is 10%. The 1219
relative errors calculated for Rev(HCl) and Peq(HCl) are 30% whereas for Rev(H2O) 1220
and Peq(H2O) they are 25%. Examples of the amplitude of the errors are reported for 1221
selected points. The green line shows results from Marti and Mauersberger, 1993. The 1222
colour scale shows the cumulative adsorbed dose after HCl pulsed gas admission. 1223
1224
Figure 5. Synopsis of kinetic results for HH using H2O, HCl asa probe gas. The symbols used are explained in the text. The cal-culated relative error forα is 10 %. The relative errors calculatedfor Rev(HCl) andPeq(HCl) are 30 %, whereas forRev(H2O) andPeq(H2O) they are 25 %. Examples of the amplitude of the errorsare reported for selected points. The green line shows results fromMarti and Mauersberger (1993). The colour scale shows the cumu-lative adsorbed dose after HCl pulsed gas admission.
ature range. Furthermore, each series of three pulses spacedby typically 60 to 90 s always showed a decrease inαice(HCl)between the first and the last pulse. Similar results havebeen shown previously in the literature (McNeill et al., 2007)where the scatter has been explained in terms of the morphol-ogy or the smoothness of the ice surface. We will discussthese results further in the discussion section.
Figure 5b shows results for theRev in molec s−1 cm−3 asa function of temperature.Rev(HCl) on HH, represented byblack triangles, is lower by a factor of 100 across the tem-perature range 165–193 K compared toRev(H2O) on HH,which, being equal toRev(H2O) on pure ice within exper-imental error, indicates that the presence of crystalline HHon the ice substrate does not substantially affect the evapora-tion of H2O, which is that of pure ice, in a manner similar toamHCl as described before.
www.atmos-chem-phys.net/14/5183/2014/ Atmos. Chem. Phys., 14, 5183–5204, 2014
5192 R. Iannarelli and M. J. Rossi: The HCl / H2O phase diagram revisited
1225
Figure 6: Binary phase diagram of the HCl/H2O system. The empty triangles 1226
represent calculated values of Peq(HCl) for HH using the kinetic data for adsorption 1227
and desorption of the present work. Different colours represent different experiment 1228
series. 1229
1230
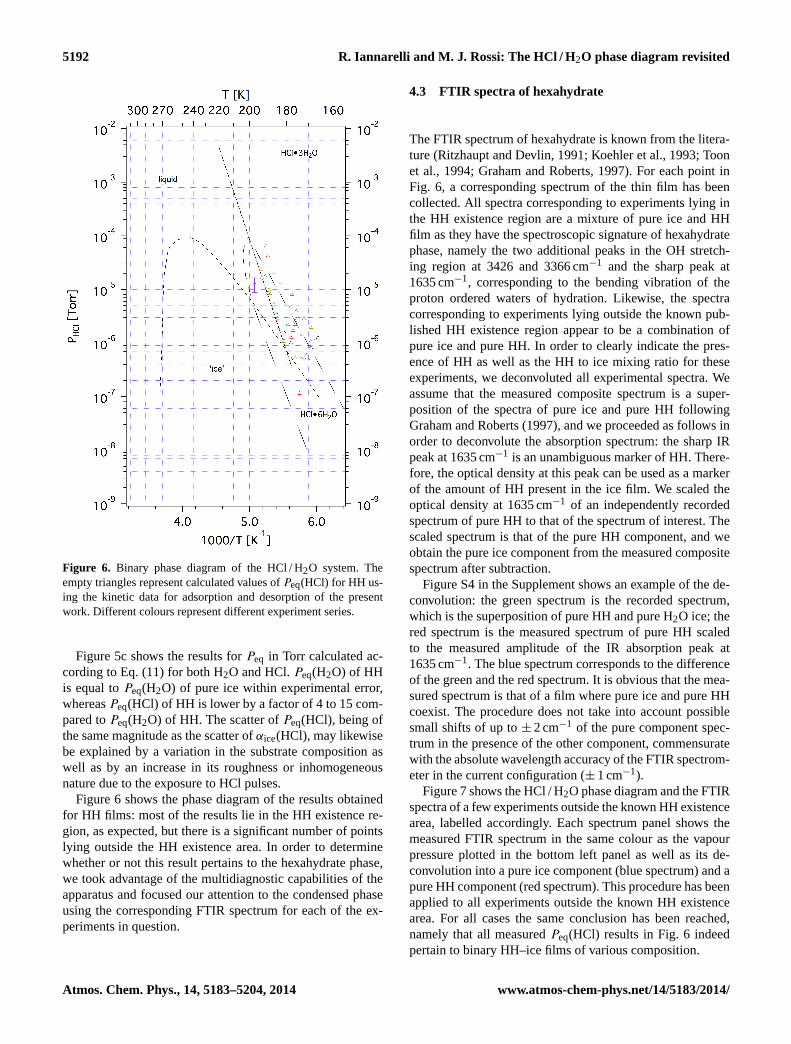
Figure 6. Binary phase diagram of the HCl / H2O system. Theempty triangles represent calculated values ofPeq(HCl) for HH us-ing the kinetic data for adsorption and desorption of the presentwork. Different colours represent different experiment series.
Figure 5c shows the results forPeq in Torr calculated ac-cording to Eq. (11) for both H2O and HCl.Peq(H2O) of HHis equal toPeq(H2O) of pure ice within experimental error,whereasPeq(HCl) of HH is lower by a factor of 4 to 15 com-pared toPeq(H2O) of HH. The scatter ofPeq(HCl), being ofthe same magnitude as the scatter ofαice(HCl), may likewisebe explained by a variation in the substrate composition aswell as by an increase in its roughness or inhomogeneousnature due to the exposure to HCl pulses.
Figure 6 shows the phase diagram of the results obtainedfor HH films: most of the results lie in the HH existence re-gion, as expected, but there is a significant number of pointslying outside the HH existence area. In order to determinewhether or not this result pertains to the hexahydrate phase,we took advantage of the multidiagnostic capabilities of theapparatus and focused our attention to the condensed phaseusing the corresponding FTIR spectrum for each of the ex-periments in question.
4.3 FTIR spectra of hexahydrate
The FTIR spectrum of hexahydrate is known from the litera-ture (Ritzhaupt and Devlin, 1991; Koehler et al., 1993; Toonet al., 1994; Graham and Roberts, 1997). For each point inFig. 6, a corresponding spectrum of the thin film has beencollected. All spectra corresponding to experiments lying inthe HH existence region are a mixture of pure ice and HHfilm as they have the spectroscopic signature of hexahydratephase, namely the two additional peaks in the OH stretch-ing region at 3426 and 3366 cm−1 and the sharp peak at1635 cm−1, corresponding to the bending vibration of theproton ordered waters of hydration. Likewise, the spectracorresponding to experiments lying outside the known pub-lished HH existence region appear to be a combination ofpure ice and pure HH. In order to clearly indicate the pres-ence of HH as well as the HH to ice mixing ratio for theseexperiments, we deconvoluted all experimental spectra. Weassume that the measured composite spectrum is a super-position of the spectra of pure ice and pure HH followingGraham and Roberts (1997), and we proceeded as follows inorder to deconvolute the absorption spectrum: the sharp IRpeak at 1635 cm−1 is an unambiguous marker of HH. There-fore, the optical density at this peak can be used as a markerof the amount of HH present in the ice film. We scaled theoptical density at 1635 cm−1 of an independently recordedspectrum of pure HH to that of the spectrum of interest. Thescaled spectrum is that of the pure HH component, and weobtain the pure ice component from the measured compositespectrum after subtraction.
Figure S4 in the Supplement shows an example of the de-convolution: the green spectrum is the recorded spectrum,which is the superposition of pure HH and pure H2O ice; thered spectrum is the measured spectrum of pure HH scaledto the measured amplitude of the IR absorption peak at1635 cm−1. The blue spectrum corresponds to the differenceof the green and the red spectrum. It is obvious that the mea-sured spectrum is that of a film where pure ice and pure HHcoexist. The procedure does not take into account possiblesmall shifts of up to± 2 cm−1 of the pure component spec-trum in the presence of the other component, commensuratewith the absolute wavelength accuracy of the FTIR spectrom-eter in the current configuration (± 1 cm−1).
Figure 7 shows the HCl / H2O phase diagram and the FTIRspectra of a few experiments outside the known HH existencearea, labelled accordingly. Each spectrum panel shows themeasured FTIR spectrum in the same colour as the vapourpressure plotted in the bottom left panel as well as its de-convolution into a pure ice component (blue spectrum) and apure HH component (red spectrum). This procedure has beenapplied to all experiments outside the known HH existencearea. For all cases the same conclusion has been reached,namely that all measuredPeq(HCl) results in Fig. 6 indeedpertain to binary HH–ice films of various composition.
Atmos. Chem. Phys., 14, 5183–5204, 2014 www.atmos-chem-phys.net/14/5183/2014/

R. Iannarelli and M. J. Rossi: The HCl / H2O phase diagram revisited 5193
1231
Figure 7: Selected measured FTIR spectra with their deconvolution into pure ice 1232
(blue) and pure HH (red) component. The measured FTIR absorption spectra are 1233
coloured according to where they fit into the binary HCl/H2O Phase Diagram. 1234
1235
Figure 7. Selected measured FTIR spectra with their deconvolution into pure ice (blue) and pure HH (red) component. The measured FTIRabsorption spectra are coloured according to where they fit into the binary HCl / H2O phase diagram.
Table 2.Fit parameters for H2O and HCl interaction with internal stainless steel surfaces (SS304) of the reactor.
K∗L
[cm3 molec−1]
NTOT[molec]
NMAX[molec cm−2]
H2O adsorption (3.18± 0.38)× 10−14 (7.03± 0.42)× 1017 (3.73± 0.22)× 1014
H2O adsorption with HCl flow(Fin = 8× 10¹⁴molec s−1)
(4.67± 0.39)× 10−14 (8.38± 0.29)× 1017 (4.45± 0.15)× 1014
HCl adsorption (4.37± 0.21)× 10−12 (5.06± 0.06)× 1017 (2.68± 0.03)× 1014
HCl adsorption with H2O flow(Fin = 6× 10¹⁵molec s−1)
(6.31± 0.49)× 10−13 (4.85± 0.07)× 1017 (2.57± 0.04)× 1014
HCl adsorption with H2O flow(Fin = 3× 10¹⁵molec s−1)
(6.46± 0.63)× 10−13 (3.79± 0.09)× 1017 (2.01± 0.04)× 1014
∗ KL is the Langmuir adsorption equilibrium constant.
5 Discussion
5.1 Langmuir adsorption isotherms
In order to describe the adsorption of HCl and H2O ontothe reactor internal surface, we used Langmuir adsorptionisotherms to fit the measurement of HCl and H2O surfacecoverage. As shown in Fig. 2, the presence of an HCl flowduring H2O steady-state experiments (green circles) presum-ably enhances the capability of H2O to adsorb onto the walls,whereas the presence of an additional H2O flow during HCl
exposure reduces the HCl coverage. Theincreasingtrend ofH2O adsorption in going from the pure case to H2O in thepresence of HCl (going from red to green in Fig. 2) meansthat H2O will unselectively adsorb on both surface sites aswell as on already adsorbed HCl. H2O is able to adsorb bothon already adsorbed HCl as well as on free surface sites. Incontrast, thedecreasingtrend of HCl adsorption in goingfrom pure HCl to HCl in the presence of H2O (going fromblack to blue in Fig. 2) may be interpreted as a displacementprocess: H2O displaces already adsorbed HCl, thereby reduc-ing the adsorption capacity of HCl in the presence of H2O.
www.atmos-chem-phys.net/14/5183/2014/ Atmos. Chem. Phys., 14, 5183–5204, 2014

5194 R. Iannarelli and M. J. Rossi: The HCl / H2O phase diagram revisited
This result seems in some way to be contradictory to the val-ues of the Langmuir constants KL displayed in Table 2. Theobtained H2O and HCl adsorption data are sufficient for theinterpretation of HCl kinetics in the present work; however,they only lead to a speculative interpretation of the HCl andH2O adsorption data for the moment. We will refrain from amolecular interpretation until additional data on this systemhave been obtained.
Langmuir isotherms are not the only isotherms usedto describe surface adsorption. For instance, Deitz andTurner (1970) used conventional Type II physical adsorptionisotherms to describe the adsorption of water on the walls ofa glass–Kovar stainless steel vacuum system in the pressurerange from 0.2 to 5 Torr. Type II isotherms are also knownas BET (Brunauer–Emmett–Teller) adsorption isotherms andallow for multilayer adsorption in contrast to simple Lang-muir theory (Gregg and Sing, 1982). They conclude that thewater adsorption strongly depends on the materials and needsto be determined for each apparatus. On the other hand, elec-trochemical quartz crystal microbalance measurements havebeen used to determine the adsorption of fission products(caesium and iodide) in their ionic form on the surface ofstainless steel and zirconium (Répánszki et al., 2007). Theauthors conclude that a Langmuir-type isotherm is able to de-scribe the adsorption, where the saturation values correspondto surface monolayers.
Furthermore, Langmuir adsorption models have also beensuccessfully used to describe sub-monolayer adsorption oforganics (Winkler et al., 2002; von Hessberg et al., 2008)as well as inorganics on ice (Pouvesle et al., 2010). Re-cently, experiments monitoring the density of adsorbed ace-tone molecules on ice using a combination of X-ray pho-toemission spectroscopy (XPS) and near-edge X-ray absorp-tion spectroscopy (NEXAFS) have been performed where re-sults have been expressed in terms of Langmuir adsorptionisotherms (Starr et al., 2011).
5.2 Mass balance and stoichiometry
When introduced into the SFR at low temperatures in thepresence of ice, a molecule of X may follow one of three dif-ferent pathways: it may effuse out of the reactor through theleak valve; it may be adsorbed onto the walls of the reactor;or it may condense onto the low temperature ice. Namely, ifNin(X) is the number of molecules introduced into the reac-tor, we haveNin(X) = Nesc(X) + Nads(X) + NHH(X), whereNesc(X) is the number of molecules of X that effuse out of thechamber,Nads(X) the molecules adsorbed onto the internalwalls of the reactor andNHH(X) is the number of moleculesin the condensed ice phase.
Nin(X) is measured by means of the pressure drop in a cali-brated volume,Nesc(X) corresponds to the integral over timeof the calibrated MS signal andNads(X) may be calculatedaccording to Eq. (7) using the measured equilibrium constant
KL . NHH(X) is calculated using a mass balance argument asthe differenceNHH(X) = Nin(X) − (Nads(X) + Nesc(X)).
We may also calculateNFTIR(X) in the case of HCl as fol-lows: using the measured optical density at 1635 cm−1 andthe known IR cross section at the same frequency, namelyσ = (6.5± 1.9)× 10−19 cm2 (Chiesa and Rossi, 2013), thenumber of HCl molecules in the condensed phase may becalculated according to Eq. (12):
NFTIR(HCl) =ln(10) · OD1635
σ· ASi, (12)
where OD is the optical density in absorbance units, ASi thearea (one side) of the silicon film support andσ is the IRabsorption cross section at 1635 cm−1, respectively. Makinguse of the multidiagnostic capabilities of the system, we maytherefore establish a mass balance of molecules in the con-densed phase betweenNHH(HCl) andNFTIR(HCl). Table 3lists the contributing terms as well as the comparison be-tweenNHH(HCl) andNFTIR(HCl).
Similarly, for H2O, the number of molecules of H2O in thecondensed phase,NFTIR(H2O), may be calculated accordingto Eq. (13):
NFTIR(H2O) =ln(10) · OD3233
σ· ASi, (13)
whereσ = (8.0± 0.8)× 10−19 cm2 (Chiesa and Rossi, 2013)is the IR absorption cross section of pure ice at 3233 cm−1.
Equations (12) and (13) may be used to determine the sto-ichiometry of the condensed phase. Upon formation of HHduring exposure of HCl, the peak intensity at 3233 cm−1 de-creases. The decrease in OD may be used to calculate thenumber of H2O molecules that are used to construct the newcrystalline HCl q6H2O phase. The number of available H2Ois given by the total number of H2O in the pure ice filmbefore HCl exposure and calculated according to Eq. (13).After the HCl exposure to the ice film had been halted, thedeconvolution procedure described in Sect. 4.3 has been ap-plied to the composite spectrum of the film at steady-stateconditions. The resulting spectrum for the excess water (bluespectrum in Fig. S4 in the Supplement) is then used to calcu-late the number of pure H2O in the sample that are not asso-ciated with HCl, according to Eq. (13). The number of HClmolecules in the sample, namelyNFTIR(HCl), is calculatedaccording to Eq. (12).
Equivalently, the same information onNFTIR(HCl) may beobtained in the following procedure and is calledNHH(H2O).The decrease in OD at 3233 cm−1, 1(OD), yields the differ-ence betweenNpure(H2O), the number of H2O molecules inthe initially pure ice film, andNice(H2O), the number of H2Omolecules in excess pure ice of the doped sample that is notinvolved in forming crystalline HH absorbing at 3233 cm−1,the frequency of pure ice absorption.1(OD) leads to thenumber of H2O molecules that have been used to constructthe HH phase, namelyNHH(H2O), according to Eq. (13)
Atmos. Chem. Phys., 14, 5183–5204, 2014 www.atmos-chem-phys.net/14/5183/2014/

R. Iannarelli and M. J. Rossi: The HCl / H2O phase diagram revisited 5195
Table 3.Mass balance and stoichiometry for selected experiments on HCl crystalline hexahydrates.
HCl
Exp Nin(HCl)[molec]× 1017
Nesc(HCl)[molec]× 1017
Nads(HCl)[molec]× 1016
NHH(HCl)[molec]× 1017
NFTIR(HCl)[molec]× 1017
1 5.19± 0.26 1.18± 0.06 6.73± 0.34 3.34± 0.17 2.94± 0.862 6.00± 0.30 1.28± 0.06 9.99± 0.50 3.72± 0.19 3.27± 0.963 6.09± 0.30 1.19± 0.06 7.78± 0.39 4.12± 0.21 3.14± 0.924 5.48± 0.49 1.04± 0.05 6.31± 0.32 3.81± 0.19 2.92± 0.855 4.79± 0.24 0.79± 0.04 8.95± 0.45 3.11± 0.16 3.05± 0.89
H2O
Exp Npure(H2O)[molec]× 1018
Nice(H2O)[molec]× 1018
NHH(H2O)[molec]× 1018
RaHH Sb
HH
1 4.89± 0.24 3.16± 0.16 1.73± 0.09 1.14 5.892 4.78± 0.24 2.68± 0.13 2.10± 0.11 1.14 6.423 5.03± 0.25 3.17± 0.16 1.86± 0.09 1.31 5.934 4.72± 0.24 3.42± 0.17 1.31± 0.07 1.30 4.475 3.77± 0.19 1.82± 0.09 1.95± 0.10 1.02 6.39
a The mass balance ratioRHH(HCl) is given byNHH(HCl) / NFTIR(HCl).b The average stoichiometric ratio SHH =NHH(H2O) /NFTIR(HCl) is 5.80± 0.70 taking into account all experiments. Excluding the outlier of 4.47 leads to anaverage ratio of 6.16± 0.29.
and Table 3. Finally, the ratioSHH =NHH(H2O) /NFTIR(HCl)reveals the stoichiometry of the crystalline film leading toH2O : HCl = 6 : 1 reported in Table 3.
Table 3 shows results for all experiments per-formed. In all cases the HCl mass balance ratioRHH = NHH(HCl) / NFTIR(HCl) and the stoichiometricratio SHH =NHH(H2O) /NFTIR(HCl) of the condensed phasehave been calculated at the end of the HH growth protocol,once steady-state conditions had been reached and beforePV dosing experiments began. The HCl mass balance ratioyields an average value of 1.18± 0.12. The wall-adsorbedmolecules account for about 12 to 19 % of the total numberof molecules let into the reactor and for about 22 to 30 %of the number of molecules adsorbed onto the ice. Theseresults show that particular caution has to be exercised inthe description of the gas–wall interaction in the SFR dueto the importance it has in the processes involved. Themeasured stoichiometric ratio yields an average value of5.8± 0.7, in agreement with the expected value of 6.00for HCl q6H2O. If we regard experiment 4 as an outlierbecause it is barely inside the 2σ interval, we obtain anaverage value for the stoichiometry of the crystalline phaseof 6.2± 0.3, remarkably close to the expected theoreticalvalue considering the experimental uncertainty.
5.3 HCl / H2O phase diagram
As described in Sect. 4.3, the deconvolution procedure shownin Fig. 7 leads to observable HCl hexahydrate concentra-tions for all experiments conducted outside the known HHexistence area. They all pertain to binary HH–ice films,
and we, therefore, propose extending the existence area ofHCl q6H2O by modifying the HCl / H2O phase diagram toinclude the present results, as shown in Fig. 8 by the shadedarea. We preserve the slope of the coexistence line of hexahy-drate and trihydrate as calculated by Wooldridge et al. (1995)and simply apply a parallel displacement of the phase bound-ary whose slope depends on the stoichiometry of the two hy-drates and their enthalpies of sublimation.
Figure 9a shows the phase diagram as a function of theequilibrium vapour pressuresPeq(H2O) andPeq(HCl), re-constructed from Hanson and Mauersberger (1990). Theempty triangles represent the calculated values ofPeq(H2O)andPeq(HCl) for HH using the kinetic results for adsorptionand desorption obtained from the present work, according toEq. (11). The proposed extension of the HH existence area isrepresented as well. The quadruple points remain and are notaffected by the additional data. Figure 9b shows an exampleof two experiments as a time series when the temperature ofthe ice substrate is increased in the range 167 to 197 K. Bothexperiments have been performed as described in Sect. 3.3.
Before describing the two experiments represented by redand purple lines (Fig. 9b), it is important to understand thebehaviour of a sample in a simpler case. We will followthe black dotted line labelled “180 K” in Fig. 9a, whichrepresents the isotherm at temperatureT = 180 K. Alongthis line, Peq(HCl) may be increased up to approximately2.5× 10−7 Torr with no detectable change inPeq(H2O). Thesample behaves as pure ice even in the presence of smallamounts of HCl. When the phase boundary line is reached,the phase changes from “ice” to HH. Any further increase of
www.atmos-chem-phys.net/14/5183/2014/ Atmos. Chem. Phys., 14, 5183–5204, 2014
5196 R. Iannarelli and M. J. Rossi: The HCl / H2O phase diagram revisited
1236
Figure 8: Phase diagram of the HCl/H2O system. The shaded area is the proposed 1237
extension of the HH existence area according to the results of the present work. The 1238
quadruple points (black dots) have been preserved. 1239
1240
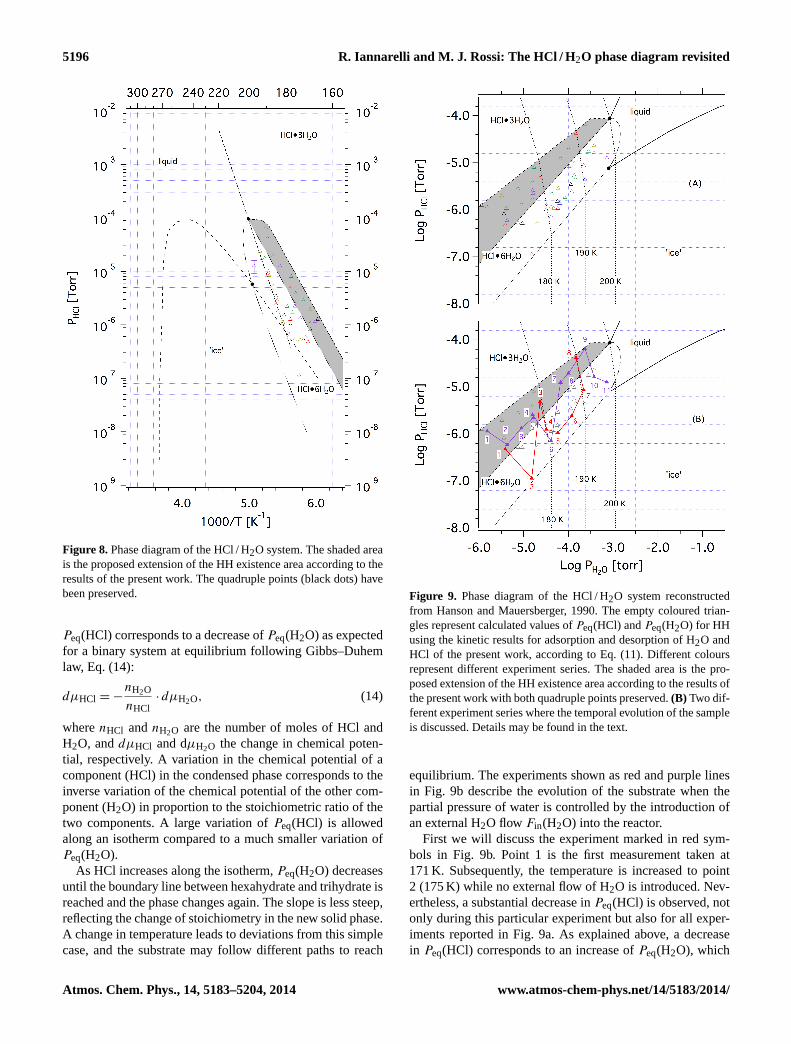
Figure 8. Phase diagram of the HCl / H2O system. The shaded areais the proposed extension of the HH existence area according to theresults of the present work. The quadruple points (black dots) havebeen preserved.
Peq(HCl) corresponds to a decrease ofPeq(H2O) as expectedfor a binary system at equilibrium following Gibbs–Duhemlaw, Eq. (14):
dµHCl = −nH2O
nHCl· dµH2O, (14)
wherenHCl andnH2O are the number of moles of HCl andH2O, anddµHCl and dµH2O the change in chemical poten-tial, respectively. A variation in the chemical potential of acomponent (HCl) in the condensed phase corresponds to theinverse variation of the chemical potential of the other com-ponent (H2O) in proportion to the stoichiometric ratio of thetwo components. A large variation ofPeq(HCl) is allowedalong an isotherm compared to a much smaller variation ofPeq(H2O).
As HCl increases along the isotherm,Peq(H2O) decreasesuntil the boundary line between hexahydrate and trihydrate isreached and the phase changes again. The slope is less steep,reflecting the change of stoichiometry in the new solid phase.A change in temperature leads to deviations from this simplecase, and the substrate may follow different paths to reach
1241
Figure 9: Phase diagram of the HCl/H2O system reconstructed from Hanson and 1242
Mauersberger, 1990. The empty coloured triangles represent calculated values of 1243
Peq(HCl) and Peq(H2O) for HH using the kinetic results for adsorption and desorption 1244
of H2O and HCl of the present work, according to equation 22. Different colours 1245
represent different experiment series. The shaded area is the proposed extension of the 1246
HH existence area according to the results of the present work with both quadruple 1247
points preserved. Panel (B) shows two different experiment series where the temporal 1248
evolution of the sample is discussed. Details may be found in the text. 1249
1250
Figure 9. Phase diagram of the HCl / H2O system reconstructedfrom Hanson and Mauersberger, 1990. The empty coloured trian-gles represent calculated values ofPeq(HCl) andPeq(H2O) for HHusing the kinetic results for adsorption and desorption of H2O andHCl of the present work, according to Eq. (11). Different coloursrepresent different experiment series. The shaded area is the pro-posed extension of the HH existence area according to the results ofthe present work with both quadruple points preserved.(B) Two dif-ferent experiment series where the temporal evolution of the sampleis discussed. Details may be found in the text.
equilibrium. The experiments shown as red and purple linesin Fig. 9b describe the evolution of the substrate when thepartial pressure of water is controlled by the introduction ofan external H2O flow Fin(H2O) into the reactor.
First we will discuss the experiment marked in red sym-bols in Fig. 9b. Point 1 is the first measurement taken at171 K. Subsequently, the temperature is increased to point2 (175 K) while no external flow of H2O is introduced. Nev-ertheless, a substantial decrease inPeq(HCl) is observed, notonly during this particular experiment but also for all exper-iments reported in Fig. 9a. As explained above, a decreasein Peq(HCl) corresponds to an increase ofPeq(H2O), which
Atmos. Chem. Phys., 14, 5183–5204, 2014 www.atmos-chem-phys.net/14/5183/2014/

R. Iannarelli and M. J. Rossi: The HCl / H2O phase diagram revisited 5197
implies the presence of a flow of H2O. The water is intro-duced into the reactor involuntarily across numerous smallair leaks owing to the presence of elastomeric seals (VitonO-rings), which add up so as to become non-negligible atthese low partial pressures of H2O. The typical H2O leak rateof the reactor against the atmosphere has been checked reg-ularly over time and found to be (5–10)× 10−6 Torr l s−1 inevery hardware configuration used. This corresponds to anair flow rate of (1.6–3.2)× 1014 molec s−1. Taking a typ-ical H2O vapour content of 3 % in laboratory air at ambi-ent temperature, we arrive at a H2O partial pressure of (4.3–8.6)× 10−7 Torr in the SFR without turning on the externalH2O flow. This corresponds to the equilibrium vapour pres-sure over pure ice at 155 to 165 K, which means that 165 K isthe lower limit beyond which we cannot perform ice experi-ments under controlled conditions. Consistent with this factis our observation of an increase of the thickness of the icefilm due to deposition of H2O onto the ice at temperatureslower than 175 K.
From point 2 to point 3 (180 K), the temperature is in-creased and only a small increase inPeq(H2O) is observedcompared to a large increase ofPeq(HCl). Between point 3and point 4,Fin(H2O) is introduced into the reactor at con-stant temperature. As a consequencePeq(HCl) decreasesalong the isotherm following the increase ofPeq(H2O) asexpected according to Gibbs–Duhem law, Eq. (14). Boththe temperature andFin(H2O) are increased from point 4to point 7 such thatFin(H2O) is kept approximately at 0.1 ·
Fev(H2O) at any temperature. After the measurement at point7, Fin(H2O) is halted and the system immediately respondsto the variation ofPeq(H2O) by increasingPeq(HCl) follow-ing the isotherm atT = 190 K, according to Gibbs–Duhemlaw, Eq. (14).
The experiment marked in purple symbols in Fig. 9b isperformed in a similar way as above (red symbols) with thedifference that the external flowFin(H2O) is a factor of 2lower with respect to the “red” experiment. From point 1 topoint 2, we observe a drop inPeq(HCl) due to backgroundH2O flow, and at point 6Fin(H2O) is introduced into the re-actor. A lowerFin(H2O) leads to higherPeq(HCl) comparedto the “red” experiment as is evident from points 7, 8 and 9that explore the hitherto unexplored space of the HCl hex-ahydrate phase diagram marked as shaded area in Fig. 9. Atpoint 10 the flowFin(H2O) is increased to approximately0.2· Fev(H2O) with a corresponding increase ofPeq(H2O)and decrease ofPeq(HCl) along the isotherm, once again ac-cording to Gibbs–Duhem law, Eq. (14).
5.4 α(HCl) scatter and HCl hexahydrate composition
Figure 5 shows the kinetic results for HH substrate experi-ments. Variations in the kinetic and thermodynamic parame-ters up to a factor of 10 for points at the same temperaturesoccur. The substrate is a binary system composed of a bulkpure ice film with a thinner HH film on top of it. According to
Gibbs’ phase rule, we have F = C− P + 2 = 2–3 + 2 = 1, whereF is the number of degrees of freedom, C the number of com-ponents, namely H2O and HCl, and P the number of phasesof the system at equilibrium, namely the binary condensate,the pure ice and the gas phase. The degree of freedom ofour system corresponds to the composition of the substrate,namely the mole ratio between pure ice and the HH film.Even though the growth protocol has been applied consis-tently to all experiments, the approach to the temperatures ofinterest and the exposure to transient supersaturation of gasesduring PV experiments, which all contribute to the “history”of the film, may lead to a different composition of the thinfilm at the same experimental temperature, which may ex-plain – at least in part – the scatter ofαice(HCl) as a functionof temperature. The decrease ofαice(HCl) in the aftermath ofa pulse may also be explained as a variation of the composi-tion of the interface, specifically the change from a H2O-richice film before the first pulse of HCl to a more H2O-deficientice film when the third HCl pulse is admitted due to evapo-ration of H2O and accumulation of HCl.
αice(H2O), on the other hand, does not present any scatter,and this may be due to the fact that the average molecular en-vironment for H2O is constant owing to its single-componentnature. In order to evaluate the ratio between pure HH andpure H2O ice, we have made use of the multidiagnostic ca-pabilities of the present system. We have selected experi-ments in five temperature ranges, and for each experiment wehave determined the number of HH molecules using Eq. (12),and similarly the number of molecules of H2O according toEq. (13).
The mole fractionχH2O of H2O in each HH film maybe calculated as the ratio of the number of moles of H2Omolecules to the total number of moles:
χH2O =NFTIR
H2O
NFTIRH2O +NFTIR
HCl
. (15)
Figure 10 shows the results obtained for the selected exper-iments.Peq(HCl) is reported as coloured circles, whereasα(HCl) is presented as coloured triangles according to thetemperature range. Temperature seems to have only a mod-est effect, whereas the history of the sample seems to havea larger impact on the film composition of every individualsample.
Peq(HCl) increases as the concentration of HCl in the filmincreases, as expected, according to the change in chemicalpotential in the binary system.α(HCl) decreases as excessH2O evaporates, and the concentration of HCl increases ac-cordingly because the faster H2O evaporation compared toHCl leads to a situation where decreasing amounts of H2Oare available in the condensate to accommodate the HClmolecules in the gas phase that hit the ice surface.
At high HCl concentration and OD at 3233 cm−1 lowerthan 0.15 absorbance units, which is when the film thicknessis less than 0.15 µm, we observe a decrease ofRev(H2O) as
www.atmos-chem-phys.net/14/5183/2014/ Atmos. Chem. Phys., 14, 5183–5204, 2014

5198 R. Iannarelli and M. J. Rossi: The HCl / H2O phase diagram revisited
1251
Figure 10: Peq(HCl) and α(HCl) as a function of mole fraction of H2O in HH film. 1252
The bottom and top axes indicate the H2O:HCl ratio and the H2O weight percentage 1253
in the film, respectively. Colours identify different temperature ranges and the broken 1254
lines just serve to guide the eye. Coloured arrows indicate an example of pairs of data 1255
points. 1256
1257
Figure 10.Peq(HCl) andα(HCl) as a function of mole fraction ofH2O in HH film. The bottom and top axes indicate the H2O : HCl ra-tio and the H2O weight percentage in the film, respectively. Coloursidentify different temperature ranges, and the broken lines just serveto guide the eye. Coloured arrows indicate an example of pairs ofdata points.
well as an increase ofRev(HCl) in agreement with Chiesaand Rossi (2013) and Delval et al. (2003). This is an indica-tion of a phase change, namely the conversion of HH into anamorphous mixture of higher HCl : H2O ratio.
Nevertheless, the composition of the HH film cannot com-pletely explain the scatter in the values ofα(HCl) andPeq(HCl) such as displayed in Fig. 5. McNeill et al. (2007)have observed variations up to a factor of 3 for the HCl par-tial pressure of smooth ice samples exposed to HCl vapourafter HH formation, and they have explained these variationsin terms of surface roughness and surface disorder of the icesubstrates. The scatter in our results may also be due in partto surface morphology variations or inhomogeneities of thefilm surface of each sample. The ice sample is repeatedlyexposed to a high supersaturation of HCl during PV exper-iments, and this may lead to surface liquefaction and/or re-construction coupled to concentration changes of the surfacecomponents compared to bulk composition in comparison tothe explanation given given by McNeill et al. (2007). In addi-tion, the pioneering and superb work of Kuhs et al. (2012) onthe structure of ice in terms of stacking faults of hexagonalice Ih masquerading as “cubic” ice Ic has to be consideredwhen investigating chemical reactions involving the evapo-ration and condensation of H2O in pure and doped ices. As aconsequence every reaction on and within ice, including thepresent thin ice films, has to be evaluated in terms of the “nat-ural” (i.e. spontaneous) conversion of “cubic ”ice to its ther-modynamically stable counterpart Ih. As a result, one cannotbe sure that laboratory-grown ice samples exclusively con-sist of pure stable ice Ih or a mixture mimicking the unstable,but more reactive phase Ic, without prior in-depth investiga-
tion of its structure. It may be that many previous laboratoryinvestigations may have to be reevaluated in that respect.
5.5 Composition of amorphous phase
In order to provide an estimate of the composition of theamHCl substrates, we compared the present spectra with theones from Xueref and Dominé (2003). In their work the au-thors grew doped ice films by co-condensation of gaseousmixtures HCl / H2O of 5 : 1, 1: 10, 1: 50 and 1: 200 compo-sition at 190 K. The condensation of the 5: 1 mixture leads toa solid that resembles HClq2H2O where partial crystalliza-tion takes place, whereas the condensation of gaseous mix-tures of HCl : H2O ratios of 1: 10, 1: 50 and 1: 200 leadsto the formation of non-crystalline solids whenever there isexcess H2O. In particular, the 1: 10 gaseous mixture leadsto a solid of composition in the range 1: 2 to 1: 4 regard-ing HCl : H2O, while the 1: 50 and 1: 200 gaseous mixturesboth lead to solids of composition in the range 1: 4 to 1: 6.
The above authors reason that, due to the excess of HClincorporation in the co-condensation process, H2O and HClare not in thermodynamic equilibrium. This may lead to theformation of a supersaturated homogenous solid solution ofHCl in ice or a solid solution of HCl in ice. This may be fol-lowed by diffusion to the surface of the excess HCl and itssubsequent escape into the gas phase, bringing the solutioninto thermodynamic equilibrium. Xueref and Dominé (2003)invoke the slightly larger HCl / ice accommodation coeffi-cientα(HCl) compared toα(H2O) on pure ice as the reasonof HCl enrichment in the condensed phase. While this goesinto the right direction, we think that this explanation is byfar insufficient to rationalize the large observed enrichmentfactors in laboratory studies as well as in field observationson snow and ice composition. In light of the present results,we provide an additional interpretation as follows: the higherRev(H2O) compared toRev(HCl) leads to rapid evaporationof water from the forming ice sample that is 2 orders of mag-nitude larger than HCl, as shown in Fig. 3. This large differ-ence betweenRev(H2O) andRev(HCl) effectively explainsthe large enrichment of HCl in the condensed phase (ice) de-spite the large atmospheric abundance of H2O vapour overHCl extending over several orders of magnitude. The factthat the present results have been obtained at temperaturesmuch lower than typical snow sampling data does not changethe conclusions because the ratio of the HCl and H2O evap-oration rates changes only little from 190 to 250 K.
In the present case we grew amHCl film by expos-ing a pure ice film of thickness in the range 1 to 2 µm(3 to 6× 10¹⁸ molecules) to a total dose of approximately3× 1017 molecules of HCl at 175 K. Our samples are there-fore a superposition of a bulk pure ice film with an amHClfilm on top of it. As the abundance of H2O decreases in thefilm, the spectroscopic characteristics of the film change aswell, as presented in Fig. 11, where the temporal evolutionof an amHCl film is shown under SFR conditions. A pure ice
Atmos. Chem. Phys., 14, 5183–5204, 2014 www.atmos-chem-phys.net/14/5183/2014/

R. Iannarelli and M. J. Rossi: The HCl / H2O phase diagram revisited 5199
1258
Figure 11: Evolution of amHCl film. The spectrum of a pure ice film is represented in 1259
black and the conversion of an amHCl from a H2O-rich film (purple spectrum) to an 1260
amorphous HCl/ice film (red spectrum) while pumping under SFR are displayed in 1261
colour. The spectra are colour-coded as a function of temperature in the range 175 to 1262
200 K, with each spectrum corresponding to a temperature increase of roughly 3 K. 1263
All spectra from blue to red have been measured in the aftermath of the first pulse in a 1264
series of consecutive PV experiments. A constant flow of HCl has been used in going 1265
from black (pure ice) to purple. 1266
1267
Figure 11. Evolution of amHCl film: the spectrum of a pure icefilm is represented in black, and the conversion of an amHCl froma H2O-rich film (purple spectrum) to an amorphous HCl–ice film(red spectrum) while pumping under SFR is displayed in colour.The spectra are colour-coded as a function of temperature in therange 175 to 200 K, with each spectrum corresponding to a tem-perature increase of roughly 3 K. All spectra from blue to red havebeen measured in the aftermath of the first pulse in a series of con-secutive PV experiments. A constant flow of HCl has been used ingoing from black (pure ice) to purple.
film (black spectrum) at 175 K is exposed to a flow of HCl of1× 1015 molec s−1 for roughly 10 min. Upon halting the HClflow, the following spectral changes (purple spectrum) ap-pear: a drastic decrease of the peak amplitude at 3233 cm−1
as well as an increasing shoulder at 3400 cm−1 and a broadband at 1700 cm−1 owing to the deposition of HCl. Whendeposition is halted, the desired temperature for PV experi-ments is set. The spectrum continues to change even after thehalt of the HCl flow, showing a further decrease of the peak at3233 cm−1 (blue spectrum) in the aftermath of the first pulseof an HCl PV series at 175 K. As the temperature increasesfrom 175 to 200 K, more excess H2O evaporates and the filmloses the characteristic peak of pure ice at 3233 cm−1 andconverts to a complete amorphous HCl / H2O mixture film asshown by the red spectrum, albeit at lower amplitude owingto evaporation of HCl and H2O.
In Fig. 12 we have compared the complete amHCl filmsfrom Fig. 11 in the temperature range 187 to 200 K withthe spectra recorded by Xueref and Dominé (2003). We onlyconsidered the spectra for the HCl / H2O gaseous mixtures ofratios 1: 200 (black line) and 1: 50 (grey line) as these arethe spectra that come closest to the expected composition ofthe present samples. Indeed, this is the case since all spec-tra are fairly similar. It therefore appears that all the presentsamples, once the excess H2O has evaporated, are in the com-position range 1: 4 to 1: 6 of HCl : H2O.
1268
Figure 12: Comparison of FTIR spectra of amHCl films. Our experimentally 1269
measured spectra are shown in colours according to temperature, whereas the dashed 1270
spectra correspond to samples made by condensing HCl:H2O gaseous mixtures of 1271
ratios 1:200 (black line) and 1:50 (grey line) at 190 K of Xueref and Dominé (2003). 1272
The temperature of the ice sample ranges between 187 and 200 K with each spectrum 1273
measured in the aftermath of the first pulse in a series of PV experiments at 1274
temperature intervals of roughly 3 K. 1275
1276
Figure 12.Comparison of FTIR spectra of amHCl films. Our exper-imentally measured spectra are shown in colours according to tem-perature, whereas the dashed spectra correspond to samples madeby condensing HCl / H2O gaseous mixtures of ratios 1: 200 (blackline) and 1: 50 (grey line) at 190 K of Xueref and Dominé (2003).The temperature of the ice sample ranges between 187 and 200 Kwith each spectrum measured in the aftermath of the first pulse in aseries of PV experiments at temperature intervals of roughly 3 K.
5.6 Kinetic and thermodynamic aspects of HCl / H2Ophase diagram
The progress that the present work represents over a sim-ilar recent investigation into the HClq6H2O vs. the amor-phous HCl / H2O phase lies in the thermochemical closure ofthe measured accommodation and evaporation kinetics of Xin the presence of pure ice with the measured partial pres-sure of species X of the binary system X = HCl, H2O. Inother words, independent measurements of bothα(X) andRev(X) lead to the equilibrium vapour pressurePeq(X) givenby the ratioRev(X) / α(X), which subsequently may be com-pared with independently measured values ofPeq(X) fromother sources. This comparison in an overdetermined systemis an excellent test of the self-consistency of the kinetic withthe corresponding thermochemical parameters. At least forH2O Figs. 3a and 5a provide good examples of the thermo-chemical consistency of the present data, both for pure ice(Marti and Mauersberger, 1993) as well as for HClq6H2Oand amHCl / H2O whose equilibrium vapour pressures areclose to the ones for pure ice (Hanson and Mauersberger,1990).
Figure 13a and b display both an Arrhenius plot ofJev(HCl) and van’t Hoff plot ofPeq(HCl) for the interactionof HCl with amHCl / H2O in comparison with results of anearlier Knudsen flow reactor study at steady-state address-ing a slightly different region of the HCl / H2O phase dia-gram, namely the HCl / H2O liquid–ice coexistence region(Flückiger et al., 1998; Chiesa and Rossi, 2013). The follow-ing equations define the corresponding straight lines based
www.atmos-chem-phys.net/14/5183/2014/ Atmos. Chem. Phys., 14, 5183–5204, 2014

5200 R. Iannarelli and M. J. Rossi: The HCl / H2O phase diagram revisited
1277
Figure 13: Arrhenius plot of Jev(HCl) (Panel A) and van‘t Hoff plot of Peq(HCl) 1278
(Panel B). Red triangles represent the results for the interaction of HCl with 1279
amHCl/H2O down to T = 175 K (this study) and green squares the results from a 1280
Knudsen flow reactor study addressing the HCl/H2O liquid-ice coexistence region 1281
(Flückiger et al., 1998). The equations for the fitting lines may be found in the text. 1282
1283
Figure 13. Arrhenius plot ofJev(HCl) (A) and van’t Hoff plot ofPeq(HCl) (B). Red triangles represent the results for the interactionof HCl with amHCl / H2O down to T = 175 K (this study) and greensquares the results from a Knudsen flow reactor study addressingthe HCl / H2O liquid–ice coexistence region (Flückiger et al., 1998).The equations for the fitting lines may be found in the text.
on the present (V/S = 1028.3 cm) as well as literature mea-surements (Flückiger et al., 1998;V/S = 122.0 cm) takingnote of the conversion of evaporation rate and flux, namely,Rev qV =Jev qA andR = 8.314 J K−1 mol−1. The best linearfit for the present measurements has been calculated usingthe iterative Levenberg–Marquardt least orthogonal distancemethod, which minimizes the orthogonal distance of eachpoint from the line of best fit. For the amHCl / H2O region(Eqs. 16 and 17) and ice–liquid coexistence line (Eqs. 18 and19), we find the following results:
logJev(HCl) [cm−2s−1] (16)
= (20.11 ± 0.46) − (21.73 ± 1.63) × 103/
(2.303· RT )
logPeq(HCl)[Torr] (17)
= (4.55 ± 0.39) − (35.76 ± 1.38) × 103/
(2.303· RT )
logJev(HCl)[cm−2s−1] (18)
= (20.62 ± 0.29) − (22.11 ± 1.09) × 103/
(2.303· RT )
logPeq(HCl) [Torr] (19)
= (1.92 ± 0.29) − (27.05 ± 1.11) × 103/
(2.303· RT ).
Jev(HCl) for amHCl / H2O (red triangles) resulting from thepresent work is a factor of 2.6 smaller than for HCl adsorbedon ice either in the HCl / H2O liquid phase or the H2O–icecoexistence line as displayed by green squares in Fig. 13a.Jev(HCl) values for both of these slightly different areas ofthe phase diagram have been found to be identical (Flück-iger et al., 1998). The kinetic results indicate that the slopesof both straight lines displayed in Fig. 13a corresponding tothe activation energy for HCl evaporation are identical withinthe given uncertainties, namely 21.7± 1.6 (this work, Eq. 16)and 22.1± 1.1 kJ mol−1 (Flückiger et al., 1998, Eq. 18). Al-though the evaporation process is identical in both cases,it suggests that some structural or compositional parame-ters such as the abundance of H2O on the surface mustbe different in both cases, thus accounting for the signifi-cant difference in the absolute values ofJev(HCl), Eqs. (16)vs. (18). The corresponding equilibrium vapour pressuresPeq(HCl) =Rev(HCl)/α(HCl), Eqs. (17) and (19), are inagreement with the published phase diagram (Molina, 1994)and point to a slightly higher value of the present data foramHCl / H2O (1H0
ev(HCl) = 35.8± 1.4 kJ mol−1) comparedto the Flückiger data (1H0
ev(HCl) = 27.1± 1.1 kJ mol−1) per-taining to the HCl / H2O liquid–ice coexistence line. Naively,one may think that the slightly higher value of1Hev(HCl)of the present work suggests a slightly lower HCl concentra-tion, i.e. slightly more diluted solution of the amHCl / H2O ofthe present work compared to the Flückiger data on the basisof the data on HCl standard heats of solution (1H0
soln(HCl))given in Wagman et al. (1982).
However, one would expect a slightly larger absolute valuefor 1H0
soln(HCl) for the HCl / H2O liquid–ice coexistenceline compared to amHCl / H2O. The caveat is that the ther-modynamic interpretation of the slopes in terms of1H0
ev isnot feasible because the coexistence line is the end point ofa family of different HCl isoconcentration lines of the liq-uid domain at different temperatures. However, a thermody-namic value may be determined from the difference of acti-vation energies for the evaporation (Eev, Eq. 18) and accom-modation (Eacc) rate of HCl on ice measured by Flückiger etal. (1998) and is calculated as1H0
ev = 1H0soln(HCl) = 22.11
− (−7.53) = 29.64 kJ mol−1 (Flückiger et al., 1998). Thisvalue is slightly larger than that given in Eq. (19).
Atmos. Chem. Phys., 14, 5183–5204, 2014 www.atmos-chem-phys.net/14/5183/2014/

R. Iannarelli and M. J. Rossi: The HCl / H2O phase diagram revisited 5201
1284
Figure 14: Arrhenius plot of Jev(HCl) for HCl•6H2O. Red triangles represent the 1285
results of this study and blue squares the results of Chiesa and Rossi (2013) obtained 1286
from the decay of crystalline HCl•6H2O. The equations for the linear fits may be 1287
found in the text. 1288
1289
Figure 14. Arrhenius plot ofJev(HCl) for HCl q6H2O. Red trian-gles represent the results of this study and blue squares the resultsof Chiesa and Rossi (2013) obtained from the decay of crystallineHCl q6H2O. The equations for the linear fits may be found in thetext.
This value closely corresponds to1H0ev of a 1:
1 = HCl : H2O concentrated aqueous solution ending up onthe ice–liquid coexistence line of the HCl / H2O phase di-agram (Wagman et al., 1982). When addressing the liq-uid domain of the phase diagram, Flückiger obtainedEev identical to the above value to Eacc measured as−12.97 kJ mol−1 such that1H0
ev(HCl) = 1H0soln(HCl) =
22.11 − (−12.97) = 35.08 kJ mol−1 was obtained, whichcompares favourably with the exponential term of Eq. (11),namely1H0
ev(HCl) = 35.76± 1.38 kJ mol−1.Figure 14 presents an Arrhenius plot ofJev(HCl) of the
crystalline phase over an extended temperature range thatgreatly exceeds the range covered by Chiesa and Rossi(2013) in their work on the decay of HClq6H2O by follow-ing the IR absorption specific to the metastable hydrate at3426 cm−1. Equation (20) presents the two-parameter rep-resentation of the Arrhenius line (Jev(HCl)) for crystallineHCl q6H2O, and Eq. (21) recalls the Arrhenius line of Chiesaand Rossi (2013) using V/A = 1506.4 cm:
logJev(HCl) [cm−2s−1] = (38.02 ± 4.82) (20)
− (87.03 ± 16.96) × 103/
(2.303· RT )
logJev(HCl) [cm−2s−1] (21)
= (36.31 ± 1.65) − (80.83 ± 6.01) × 103/(2.303· RT ) .
A look at Fig. 14 reveals considerable scatter of the data ofthe Arrhenius plot, which covers a fairly substantial tempera-ture range compared to the Chiesa and Rossi (2013) data. Thepossible reasons for this scatter have been discussed above inthe context of the kinetic parameters of HClq6H2O. This isreflected in the significant uncertainties of Eq. (20) comparedto the work of Chiesa and Rossi (2013) despite the narrow
temperature range covered in that work. Considering thesedifferences the agreement between both data sets is seen tobe very good so that we conclude that the rate-limiting stepin the decay of HClq6H2O is HCl evaporation, akin to theconclusions by Chiesa and Rossi (2013). This agreement be-tween both methods is quite satisfying given the fact thatChiesa and Rossi followed the destruction of the condensedphase, whereas the present work is conducted by observingthe behaviour of the gas phase in the presence of HClq6H2O.
A closer look at the data of Fig. 14 reveals that the ob-served positiveT dependence of HCl evaporation may turninto a negativeT dependence forT < 172± 2 K, whichis the limit between the stable and metastable domain ofHCl q6H2O (Chiesa and Rossi, 2013). It is possible that thelimit of thermodynamic stability is in some way connectedto the turnover in theT dependence of the rate of HCl evap-orationRev(HCl) of HCl q6H2O.
However, we are rapidly leaving the temperature range ofatmospheric interest. The comparison between Eev(HCl) inHCl q6H2O of approximately 87.0± 17.0 kJ mol−1 follow-ing Eq. (14) has to be contrasted with the standard heat ofsublimation of HCl calculated by Wooldridge et al. (1995) of65.8 kJ mol−1 at 200 K according to Reaction (R28), which,however, doesnot correspond to the usual definition of thestandard heat of sublimation of a compound because H2Ostays in the condensed phase:
HCl q6H2O(s) → HCl(g) + 6H2O(s). (R11)
This leads to an activation energy Ead of HCl insertionor adsorption, the inverse process of Reaction (R11), ofEad= (87± 17) − 65.8 = 21.2± 17.0 kJ mol−1, a decidedlypositive activation energy in contrast to most other adsorp-tion processes presented in this work. This peculiarity ofan intrinsic positive activation energy for the inverse pro-cess has already been mentioned by Chiesa and Rossi (2013)and may have to do with the high value of activation energyEev(HCl) out of the crystalline environment of HClq6H2O.In contrast, the corresponding activation energy Ead for thecase of the amorphous liquid is calculated as Ead = 21.7–35.8 =−14.1 kJ mol−1 using Eqs. (16) and (17), which is ex-pected behaviour for this type of process.
Finally, a comparison between the absolute value of Eevof the amHCl / H2O (Eq. 16) and HClq6H2O (Eq. 20) maybe considered. It is intuitively clear that HCl, which is sur-rounded by H2O molecules in a crystalline, albeit metastablehydrate shell may be more difficult to evaporate than HCl, ei-ther dissolved in a solution or adsorbed as a non-crystalline,which is in amorphous phase. It is important to realize thatthe “border areas” of the “ice” solid phase containing HClare in a disordered state (McNeill et al., 2006) and there-fore do not offer a crystalline environment to HCl, at leastat the interface. This means that the phase transition fromthe metastable crystalline (HClq6H2O) to a stable phase(amHCl / H2O in both the “ice” and crystalline HClq6H2O
www.atmos-chem-phys.net/14/5183/2014/ Atmos. Chem. Phys., 14, 5183–5204, 2014
5202 R. Iannarelli and M. J. Rossi: The HCl / H2O phase diagram revisited
phase domain) of constant composition will lead to an accel-eration ofJev(HCl) in contrast to the situation of the equi-librium vapour pressures displayed in Fig. 13a. It is satisfy-ing that kinetic, thermodynamic and structural properties ofthe relevant portions of the HCl / H2O phase diagram con-vey a unified physical picture based on diverse experimentalmethods as used by McNeill et al. (2006) and the present ki-netic/thermodynamic multidiagnostic investigations. Finally,we should point out that the question regarding the elec-trolytic dissociation of adsorbed HCl – that is, the prevalenceof ionic (H3O+Cl−) vs. molecular adsorption of adsorbedHCl – has been answered in a convincing way by Parent atal. (2011), at least for temperatures up to 115 K using FTIRabsorption in grazing incidence. It seems that, at tempera-tures typical of the UT/LS, HCl exclusively occurs in its ionicform.
5.7 Atmospheric implications
In this study we have confirmed the findings of Chiesa etal. (2013) that the structure of ice films (amorphous, poly-crystalline, Ih) doped with HCl is irrelevant for the nucle-ation and growth of HClq6H2O. Furthermore, in agreementwith previous studies (Ritzhaupt and Devlin, 1991; Koehleret al., 1993; Henson et al., 2004; Chiesa and Rossi, 2013),we have found that HClq6H2O requires an HCl supersatura-tion of the order of 10 or higher and temperaturesT ≤ 173 Kto nucleate. Exposure of ice films to HCl at temperatureshigher than 173 K invariably led to the formation of an amor-phous HCl / H2O phase. The crystalline HClq6H2O has al-ways been observed to convert to amorphous HCl / H2O attemperaturesT > 193 K under SFR conditions. On the otherhand, the conversion of amorphous samples into crystallineHCl q6H2O has never been observed under all explored ex-perimental conditions.
On the basis of these observations, we conclude that thenucleation of HClq6H2O is unlikely to occur under atmo-spheric conditions relevant for UT/LS, where the tempera-tures are rarely less than 180 K. Furthermore, the high nucle-ation barrier for HClq6H2O may be the reason for its kineticinstability leading to the inability of evaporating HCl to re-generate crystalline HClq6H2O when it condenses back atatmospheric temperatures. The amorphous HCl / H2O phaseis likely to be the relevant phase in the processes involvingHCl at UT/LS atmospherically relevant conditions.
6 Conclusions
In this work we have gone one step further compared to ourrecent work on the same subject using a stirred flow reactor(Chiesa and Rossi, 2013). The improvements may be sum-marized as follows: (1) combination of steady-state and tran-sient supersaturation experiments in order to measure mi-croscopic rates of evaporationRev and accommodationα,
both for HCl and H2O interacting with crystalline HH andamorphous HCl / H2O; (2) true multidiagnostic experimentaddressing gas phase and condensed phase under identicalreaction conditions (using FTIR absorption in transmission,we followed the gas-phase kinetics of both HCl and H2O to-gether with the changes in the corresponding FTIR absorp-tion spectra of the condensed phase); (3) spectral deconvo-lution of composite IR absorption spectra in terms of theconcentration or mole fraction of HCl and H2O such thateach measured point in the HCl / H2O phase diagram corre-sponded to a composite yet deconvoluted IR absorption spec-trum.
The obtained kinetics of the forward (accommodation)and reverse (evaporation) experiments are consistent with themeasured and/or previously known equilibrium vapour pres-sures. Among the most important experimental results thathave been obtained under the constraint of thermochemicalkinetics, we cite (a) HCl accommodation and evaporation ki-netics are significantly slower than for H2O in the coveredtemperature range, both for HClq6H2O and the amorphousmixture of HCl / H2O. This explains the persistence of HCl inthe condensed phase even under evaporation conditions. Thephase transition from crystalline HClq6H2O to the amor-phous HCl / H2O phase was controlled by the rate-limitingstep of HCl rather than H2O evaporation; (b) the kineticsof HCl evaporation during the HClq6H2O decay measuredover an extended temperature range closely corresponded toprevious experiments in which the decay of the optical den-sity of the crystalline HClq6H2O was recorded, albeit overa restricted temperature range; (c) as a result of using thepresent multidiagnostic approach, we have obtained an ex-tension of the phase diagram in the existence area of crys-talline HCl q6H2O. However, this extension leaves the twoknown quadruple points from previous work unchanged, asexpected.
The Supplement related to this article is available onlineat doi:10.5194/acp-14-5183-2014-supplement.
Acknowledgements.The authors would like to acknowledge theunfailing and generous support of this work over the years bythe Swiss National Science Foundation (SNSF) in the frameworkof projects 200020_125204 and 200020_144431/1. Moreover,we sincerely thank Alwin Frei for his support and patience overthe years during which the experiment was located in his laboratory.
Edited by: T. Bartels-Rausch
Atmos. Chem. Phys., 14, 5183–5204, 2014 www.atmos-chem-phys.net/14/5183/2014/

R. Iannarelli and M. J. Rossi: The HCl / H2O phase diagram revisited 5203
References
Abbatt J. P. D., Beyer, K. D., Fucaloro, A. F., McMahon, J. R.,Wooldridge, P. J., Zhang, R., and Molina, M. J.: Interaction ofHCl Vapor with Water-ice: Implications for the Stratosphere, J.Geophys. Res. 97, 15819–15826, 1992.
Ammann, M., Cox, R. A., Crowley, J. N., Jenkin, M. E., Mellouki,A., Rossi, M. J., Troe, J., and Wallington, T. J.: Evaluated kineticand photochemical data for atmospheric chemistry: Volume VI– heterogeneous reactions with liquid substrates, Atmos. Chem.Phys., 13, 8045–8228, doi:10.5194/acp-13-8045-2013, 2013.
Banham, S. F., Sodeau, J. R., Horn, A. B., McCoustra, M. R. S.,and Chesters, M. A.: Adsorption and ionization of HCl on an icesurface, J. Vac. Sci. Technol. A, 14, 1620–1626, 1996.
Broker, W. and Mossman, A. L.: Matheson Gas Data Book, 6th ed.,Matheson Gas Products Inc., Lyndhurst, NJ, 1980.
Carslaw, K. S., Peter, Th., and Clegg, S. L.: Modeling the composi-tion of liquid stratospheric aerosols, Rev. Geophys. 35, 125–154,1997.
Chiesa, S. and Rossi, M. J.: The metastable HClq6H2O phase – IRspectroscopy, phase transitions and kinetic/thermodynamic prop-erties in the range 170–205 K, Atmos. Chem. Phys., 13, 11905–11923, doi:10.5194/acp-13-11905-2013, 2013.
Chu, L. T., Leu, M.-T., and Keyser, L. F.: Uptake of HCl in water iceand nitric acid ice films, J. Phys. Chem. 97, 7779–7785, 1993.
Crowley, J. N., Ammann, M., Cox, R. A., Hynes, R. G., Jenkin,M. E., Mellouki, A., Rossi, M. J., Troe, J., and Wallington, T. J.:Evaluated kinetic and photochemical data for atmospheric chem-istry: Volume V – heterogeneous reactions on solid substrates,Atmos. Chem. Phys. 10, 9059-9223, doi:10.5194/acp-10-9059-2010, 2010.
Deitz, V. R. and Turner, N. H.: Introduction of water vapor into vac-uum systems and the adsorption by the walls, J. Vac. Sci. Tech-nol., 7, 577–580, 1970.
Delval, C., Flückiger, B., and Rossi, M. J.: The rate of water vaporevaporation from ice substrates in the presence of HCl and HBr:implications for the lifetime of atmospheric ice particles, Atmos.Chem. Phys. 3, 1131–1145, doi:10.5194/acp-3-1131-2003, 2003.
Delval, C: Study of the kinetics of Condensation and Evaporation ofWater Vapor over Atmospherically relevant Pure and Doped IceFilms: A Multidiagnostic Approach, Thèse EPFL (Ecole Poly-technique Fédérale de Lausanne) no. 3159, 2005.
Delzeit, L., Rowland, B., and Devlin, J. P.: Infrared spectra of HClcomplexed/ionized in amorphous hydrates and at ice surfaces inthe 15–90 K range, J. Phys. Chem. 97, 10312–10318, 1993.
Dushman, S. and Lafferty, J. M.: Scientific Foundations of VacuumTechnique, 2nd ed., John Wiley & Sons, New York, 1, p. 58,1962.
Flückiger, B., Thielmann, A., Gutzwiller, L., and Rossi, M. J.: Realtime kinetics and thermochemistry of the uptake of HCl, HBr andHI on water in the temperature range 190 to 210 K, Ber. Bunsen-ges. Phys. Chem. 102, 915–928, 1998.
Flückiger, B. and Rossi, M. J.: Common precursor mechanism forthe heterogeneous reaction of D2O, HCl, HBr and HOBr withWater Ice in the range 170–230 K: Mass accommodation coeffi-cients on ice, J. Phys. Chem. A 107, 4103–4115, 2003.
Friedl, R. R., Goble, J. H., and Sander, S. P.: A kinetic study ofthe homogeneous and heterogeneous components of the HCl+
ClONO2 reaction, Geophys. Res. Lett. 13, 1351–1354, 1986.
Graham, J. D. and Roberts, J. T.: Formation of HClq6H2O from iceand HCl under ultrahigh vacuum, Chemometrics and intelligentlaboratory systems 37, 139–148, 1997.
Gregg, S. J. and Sing, K. S. W.: Adsorption, Surface Area andPorosity, second edition, Academic Press, London, 195–207,1982.
Haynes, W. M., Bruno, T. J., and Lide, D. R. (eds.): Handbookof Chemistry and Physics, 94th Edition (Internet Version 2014),CRC Press/Taylor and Francis, Boca Raton, FL, 2668 pp., 2013.
Hanson, D. R. and Mauersberger, K.: HCl / H2O Solid-Phase VaporPressures and HCl Solubility in Ice, J. Phys. Chem. 94, 4700–4705, 1990.
Hanson, D. R. and Ravishankara, R.: Investigation of the reactiveand nonreactive processes involving ClONO2 and HCl on waterand nitric acid doped ice, J. Phys. Chem. 96, 2682–2691, 1992.
Henson, B. F., Wilson, K. R., Robinson, J. M., Noble, C. A., Cas-son, J. L., and Worsnop, D. R.: Experimental isotherms of HClon H2O ice under stratospheric conditions: Connections betweenbulk and interfacial thermodynamics, J. Chem, Phys. 121, 8486–8499, 2004.
Huthwelker, T., Malmström, M. E., Helleis, F., Moortgat, G. K.,and Peter, Th.: Kinetics of HCl Uptake on Ice at 190 and 203 K:Implications for the Microphysics of the Uptake Process, J. Phys.Chem. A 108, 6302-6318, 2004.
Hynes, R. G., Mössinger, J. C., and Cox, R. A.: The interaction ofHCl with water-ice at tropospheric temperatures, Geophys. Res.Lett. 28, 2827–2830, 2001.
Koehler, B. G., McNeill, L., Middlebrook, A. M., and Tolbert, M.A.: Fourier transform infrared studies of the interaction of HClwith model polar stratospheric cloud films, J. Geophys. Res.D98, 10563–10571, 1993.
Kuhs, W. F., Sippel, Ch., Falenty, A., and Hansen, Th. C.: Extentand relevance of stacking disorder in “ice Ic”, PNAS 109, 21259–21264, 2012.
Marti, J. and Mauersberger, K.: A Survey and New Measurementsof Ice Vapor Pressure at Temperatures Between 170 and 250 K,Geophys. Res. Lett. 20, 363-366, 1993.
McNeill, V. F., Loerting, T., Geiger, F. M., Trout, B. L., and Molina,M. J.: Hydrogen chloride-induced surface disordering on ice,Proc. Natl. Acad. Sci. USA, 103, 9422–9427, 2006.
McNeill, V. F., Geiger, F. M., Loerting, T., Trout, B. L., Molina, L.T., and Molina, M. J.: Interaction of hydrogen chloride with icesurfaces: The effects of grain size, surface roughness and surfacedisorder, J. Phys. Chem. A, 111, 6274–6284, 2007.
Molina, L. T., Molina M. J., Stachnik, R. A., and Tom, R. D.: Anupper limit to the rate of the HCl+ ClONO2 reaction, J. Phys.Chem., 89, 3779–3781, 1985.
Molina, M. J.: The Probable Role of Stratospheric ‘Ice’ Clouds:Heterogeneous Chemistry of the Ozone Hole, in: The Chemistryof the Atmosphere: Its Impact on Global Change, Blackwell Sci-entific Publications, London, ch. 3, 27–38, 1994.
Molina, M. J., Tso, T. L., Molina, L. T., and Wang, F. C. Y.: Antarc-tic stratospheric chemistry of chlorine nitrate, hydrogen chlo-ride and ice: release of active chlorine, Science, 238, 1253–1257,1987.
Parent, Ph., Lasne, J., Marcotte, G. and Laffon, C.: HCl adsorp-tion on ice at low temperature: a combined X-ray absorption ,photoemission and infrared study, Phys. Chem. Chem. Phys. 13,7142-7148, 2011.
www.atmos-chem-phys.net/14/5183/2014/ Atmos. Chem. Phys., 14, 5183–5204, 2014

5204 R. Iannarelli and M. J. Rossi: The HCl / H2O phase diagram revisited
Peter, Th.: Microphysics and heterogeneous chemistry of PolarStratospheric Clouds, Annu. Rev. Phys. Chem., 48, 785–822,1997.
Pouvesle, N., Kippenberger, M., Schuster, G., and Crowley, J. N.:The interaction of H2O2 with ice surfaces between 203 and233 K, Phys. Chem. Chem. Phys. 12, 15544–15550, 2010.
Répánszki, R., Kerner, Z., and Nagy, G.: Adsorption of fission prod-ucts on stainless steel and zirconium, Adsorption, 13, 201–207,2007.
Ritzhaupt, G. and Devlin, J. P.: Infrared spectra of nitric and hy-drochloric acid hydrate thin films, J. Phys. Chem., 95, 90–95,1991.
Sadtchenko, V., Giese, C. F., and Gentry, W. R.: Interaction of hy-drogen chloride with thin ice films: The effect of ice morphol-ogy and evidence for unique surface species on crystalline vapor-deposited ice, J. Phys. Chem. B 104, 9421–9429, 2000.
Seinfeld, J. H. and Pandis, S. N.: Atmospheric Chemistry andPhysics: From air pollution to Climate Change, 2nd ed., ch.5,John Wiley & Sons, New York, 2006.
Solomon, S., Garcia, R. R., Rowland, F. S., and Wuebbles, D. J.: Onthe depletion of Antarctic ozone, Nature 321, 755–758, 1986.
Toon, O. B., Tolbert, M. A., Koehler, B. G., Middlebrook, A. M.,and Jordan, J.: Infrared optical constants of H2O ice, amorphousnitric acid solutions, and nitric acid hydrates, J. Geophys. Res.99, 631–654, 1994.
von Hessberg, P., Pouvesle, N., Winkler, A. K., Schuster, G., andCrowley, J. N.: Interaction of formic and acetic acid with ice sur-faces between 187 and 117 K. Investigation of single species- andcompetitive adsorption, Phys. Chem. Chem. Phys., 10, 2345–2355, 2008.
Wagman, D. D., Evans, W. H., Parker, V. B., Schumm, R. H., Halow,I., Bailey, S. M., Churney, K. L., and Nuttall, R. L.: NBS tablesof chemical thermodynamic properties – Selected values for in-organic and C1 and C2 organic substances in SI units, J. Phys.Chem. Ref. Data, 11, Suppl. 2, 1982.
Winkler, A. K., Holmes, N. S., and Crowley, J. N.: Interaction ofmethanol, acetone and formaldehyde with ice surfaces between198 and 223 K, Phys. Chem. Chem. Phys. 4, 5270–5275, 2002.
Wooldridge, P. J., Zhang, R., and Molina, M. J.: Phase Equilibria ofH2SO4, HNO3 and HCl hydrates and the composition of polarstratospheric clouds, J. Geophys. Res., 100, 1389–1396, 1995.
Xueref, I. and Dominé, F.: FTIR spectroscopic studies of thesimultaneous condensation of HCl and H2O at 190 K – At-mospheric applications, Atmos. Chem. Phys., 3, 1779–1789,doi:10.5194/acp-3-1779-2003, 2003.
Zondlo, M. A., Hudson, P. K., Prenni, A. J., and Tolbert, M. A.:Chemistry and microphysics of polar stratospheric clouds andcirrus clouds, Ann. Rev. Phys. Chem., 51, 473–499, 2000.
Atmos. Chem. Phys., 14, 5183–5204, 2014 www.atmos-chem-phys.net/14/5183/2014/