habitat evaluation procedures (hep) report;
TRANSCRIPT

Habitat Evaluation Procedures (HEP) Report;
Iskuulpa Wildlife Mitigation and Watershed Project
Technical Report 1998 - 2003 January 2003 DOE/BP-00007514-2

This Document should be cited as follows:
Quaempts, Eric, "Habitat Evaluation Procedures (HEP) Report;; Iskuulpa Wildlife Mitigationand Watershed Project", 1998-2003 Technical Report, Project No. 199506001, 95 electronicpages, (BPA Report DOE/BP-00007514-2)
Bonneville Power AdministrationP.O. Box 3621Portland, OR 97208
This report was funded by the Bonneville Power Administration (BPA),U.S. Department of Energy, as part of BPA's program to protect, mitigate,and enhance fish and wildlife affected by the development and operationof hydroelectric facilities on the Columbia River and its tributaries. Theviews in this report are the author's and do not necessarily represent theviews of BPA.

Habitat Evaluation Procedures Report Iskuulpa Wildlife Mitigation & Watershed Project
Baseline Mitigation Credits and Futures Analysis
Confederated Tribes of the Umatilla Indian Reservation
Wildlife Program
Eric J. Quaempts, Project Biologist 2003
Project Number 1995-060-01 Contract Number 00007514
Abstract
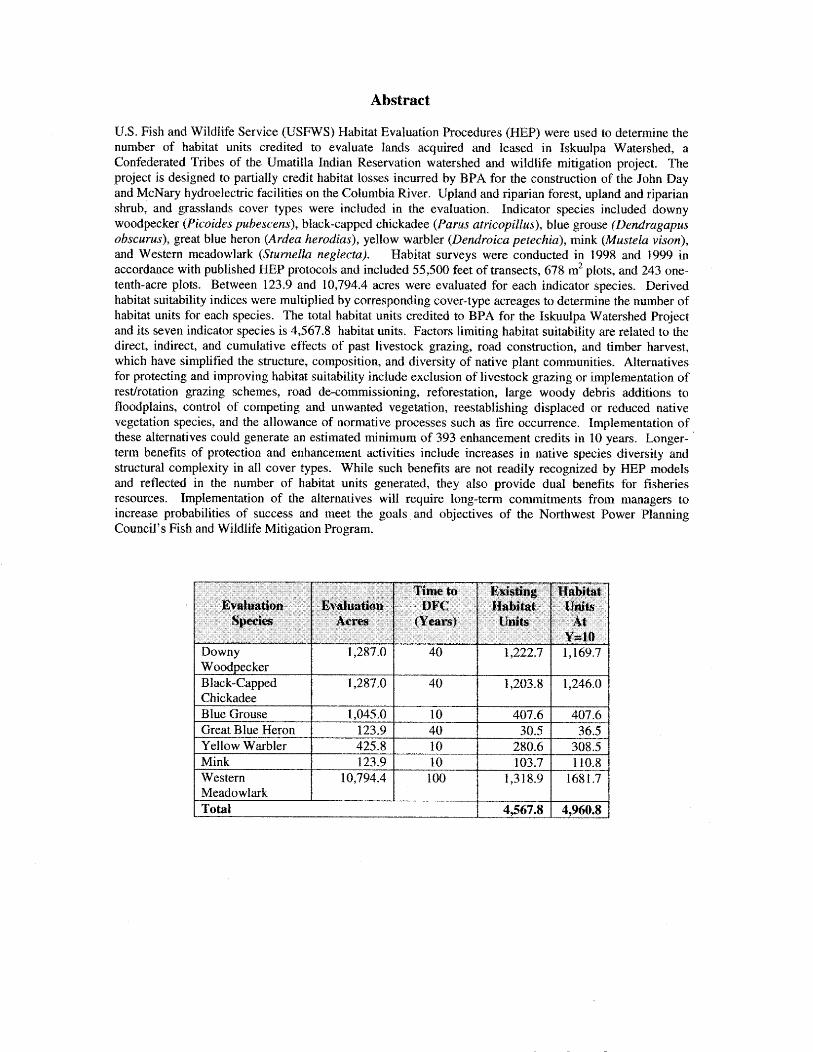
U.S. Fish and Wildlife Service (USFWS) Habitat Evaluation Procedures (HEP) were used to determine the number af habitat units credited to evaluate lands acquired and leased in Eskuulpa Watershed, a Confederated Tribes of the Umatilla Indian Reservation watershed and wildlife mitigation project. The project is designed to partially credit habitat losses incurred by BPA for the construction of the John Day and McNary hydroelectric facilities on the Columbia River. Upland and riparian forest, upland and riparian shrub, and grasslands cover types were included in the evaluation. Indicator species included downy woodpecker (Picuides puhescens), black-capped chickadee (Pams atricnpillus), blue grouse (Beadragapus obscurus), great blue heron (Ardea herodias), yellow warbler (Dendroica petschia), mink (Mustela vison), and Western meadowlark (Sturnello neglects). Habitat surveys were conducted in 1998 and 1999 in accordance with published HEP protocols and included 55,500 feet of transects, 678 m2 plots, and 243 one- tenth-acre pIots. Between 123.9 and f 0,794.4 acres were evaluated for each indicator species. Derived habitat suitability indices were multiplied by corresponding cover-type acreages to determine the number of habitat units for each species. The total habitat units credited to BPA for the Iskuulpa Watershed Project and its seven indicator species is 4,567.8 habitat units. Factors limiting habitat suitability are related to the direct, indirect, and cumulative effects of past livestock grazing, road construction, and timber harvest, which have simplified the structure, coinposition, and diversity of native plant communities. Alternatives for protecting and improving habitat suitability include exclusion of livestock grazing or in~plementatian of restlrotation grazing schemes, road de-commissioning, reforestation, large woody debris additions to floodplains, control of competing and unwanted vegetation, reestablishing displaced or reduced native vegetation species, and the allowance of normative processes such as fire occurrence. Implementation of these alternatives could generate an estimated minimum of 393 enhancement credits in 10 years. Longer- term benefits of protection and enhancement activities include increases in native species diversity and structural complexity in a11 cover types. While such benefits are not readily recognized by HEP models and reflected in the number of habitat units generated, they aIso provide dual benefits for fisheries resources. ImpIemenbtion of the alternatives will require long-term comrnitrnents from managers to increase probabilities of success and meet the goals and objectives of the Northwest Power Planning Council's Fish and Wildlife Mitigation Program.
Western 10,794.4 1 00 318.9 1681.7 Meadowlark Total I 4,567.8 4,960.8

Table of Contents
Introduction .............................................................................................. The Need for Fish and Wildlife Mitigation 1
...................................................................................................................... Wildlife Loss Assessments 1 Northwest Pawer Planning Council Gods & Objectives ......................................................................... 1
...................................................................... ............................... The Iskuulpa Watershed Project ... 2 Cover Types and Target Wildlife Species ................................................................................................ 2
............................................................................................................... Crediting Habitat Units to BPA 2
............................................................................................................... Benefits to Fisheries Resources 4 Report Organization ................................................................................................................................. 4
Physical Environment Project Location ....................................................................................................................................... 4
................................................................................................................................................... Climate 4 Temperature & Precipitation .................................................................................................................... 7
.............................................................................................................................................. Topography 7 Fire Occurrence Rates ............................................................................................................................. 8
................................................................................................................................................ Hydrology 9 .............................................................................. Streamflow Regime ............... ..... .................. ..... 9
Water Quality ......................................................................................................................................... 1 1 ............................................................................................................................... Stream Morphology 1 1 .............................................................................................................................. B-Stream Types 12
C - Stream Types ............................................................................................................................ 12 Un-surveyed Tributaries ................................................................................................................. 13
......................................................................... Floodplain, Channel, and Riparian Characteristics 13 Floodplain and Channel Manipulations - Reach 2 ............................................................. 13 Floodplain and Channel - Reaches 3 - 5 ............................................................................... 14
.............................................................................................................. Streambank Stability 14 ......................................................................................................... l3oodplain Connectivity 14
................................................................................................................. WidtNDepth Ratio 14 Substrate Distribution ............................................................................................................. 15
............................................................................................. Pool Frequency and Area 1 5 ............................................................................................................... Off-Channel Habitat 15
....................................................................................................................................................... Soils 15
Biological Environment .................... .................................................................................... Cover Type Characteristics .,.. 17
.............................................................................................................. The Plant Association Concept 17 Plant Series ..................................................................................................................................... 18 Plant Association Groups ................................................................................................................ 18
.......................................................................................................... Potential Vegetation Groups 18 ........................................................................................................................... Forested Communities 18
Upland Shrub Communities ................................................... .. .............................................................. 19 ......................................................................................................... FlnodplaidRiparian Communities 19
...................................................................................................................... Grassland Communities 21
Methods Forest and Upland Shrub Habitat Surveys ............................................................................................. 22
..................................................................................................... Floodplain/Riparian Habitat Surveys 23 .............. .........................................*....................*.*...............**......*............ Grassland Habitat Surveys .. 24

Office Methods .................................................................................................................................... 25
Results ............................................................................... ........................ Forest Structural Characteristics ........ 26
............................................................................................................................ Downy Woodpecker 2 7 .............................................................................................. Baseline Habitat Indices and Units 2 7
................................................................................................................. Habitat Limiting Factors 28 .............................................................................................................. Desired Future Conditions 29
............................................................................................... Enhancement Strategies 30 ...................................................................................................................... Black-Capped Chickadee 3 1
Baseline Habitat Indices and Units ................................................................................................. 31 ............................................................................................................... Habitat Limiting Factors 31
.............................................................................................................. Desired Future Conditions 32 .................................................................................................................. Enhancement Strategies 33
.......................................................................................................................................... Blue Grouse 3 3 Baseline Habitat Indices and Units ............................................................................................... 33
................................................................................................................ Habitat Limiting Factors 34 .......................................................................................................... Desired Future Conditions 3 5
.................................................................................................................. Enhancement Strategies 36
.......................................................................................... FloodplaidRiparian Habitat Characteristics 36 .................................................................................................................................. Great Blue Heron 3 6
Baseline Habitat Indices and Units .............................. .: ................................................................. 36 Habitat Limiting Factors ................................................................................................................. 37
........................................................................................................... Desired Future Conditions 3 8 .................................................................................................................. Enhancement Strategies 39
Yellow Warbler .................................................................................................................................... 39 Baseline Habitat Indices and Units ............................................................................................. 39
......................................................................................... Habitat Limiting Factors ............. .... 41 .............................................................................................................. Desired Future Conditions 42
.................................................................................................................. Enhancement Strategies 42 Mink ....................................................................................................................................................... 43
Baseline Habitat Indices and Units ...................................... .. ......................................................... 43 ................................................................................................................. Habitat Limiting Factors 43
.............................................................................................................. Desired Future Conditions 43 ................................................................................................................. Enhancement Strategies -44
Grassland Habitat Structural Characteristics ................................................................................................. 45 ........................................................................................................................... Western Meadowlark 45
Baseline Habitat Indices and Units ................................................................................................. 45 .............................................................................................................. Habitat Limiting Factors -45
........................................................................... ........................ Desired Future Conditions ... 50 ................................................................................................................. Enhancement Strategies -50
Habitat Units Summary ............ .. ............................................................................................................... 51
....................................................................... Consistency with NPPC Fish 8r Wildlife Program Goals 52
.......................................................................................................................................... Literature Cited 5 6
................................................................................................................................................... Appendices 59
List of Maps IskuuIpa NEP Crediting Lands .............................................................................................................. 3
............................................................................................................................... Project Location Map 5 Project Area Map ..................................................................................................................................... 6
................................................................................................... Iskuuipa Watershed Stream Network 10 Iskuulpa Watershed Project Area Cover Types .................................................................................. 20
.............................................................................. Forest Cover Type Transects 2 7 FloodplainIRiparian Cover T y p Transects ........................................................................................... 39 Grassland Cover Type Transects .......................................................................................................... -48
List of Figures .......................................................................... Figure 1. Example of Plant Association Organization 18
Figure 2. Forest and Upland Shrub Transect Diagram ....................................................................... 23: Figure 3 . Floodplainmiparian Transect Diagram ...................... ,. ....... ,., 2 4 Figure 4. Grassland Transect Diagram .................................................................................................. 25 Figure 5. Season Long Grazing and the Perennial Crass Life Cycle .................................................... 48 Figure 6. Example of Plant Association Organization ................................. ., .................................... 53
Aclmo wfedgements Neal Anderson, Brandon Spencer, Walter Broncheau, Toby Patrick, Virgil Tsosie, Matt Farrow Jr., and Randy Alexander, CTUIR Wildlife Technicians, collected field data that form the basis of this analysis.
Paul Ashley, Wildlife Biologist, Washington Department of Fish and Wildlife, provided instruction in survey methodologies and advice in utilizing Habitat Evaluation Procedure models.
Matt Farrow 3r. conducted a file search of Oregon Department of Forestry, PendIeton Ofice records that provided the basis for the fire occurrence rate analysis.
Randy Alexander conducted file searches at the Bureau of Indian Affairs, Umatilla Agency Office, and discovered Soil Conservation Service reports and timber contract files that proved invaluable in identifying and quantifying historical causal factors affecting habitat structure and diversity in the Iskuulpa Watershed.
Atlen Childs, CTUIR Wildlife Biologist, provided planning for HEP surveys, field instruction, assistance in running models, and provided valuable document review and editorial recommendations.
James Webster, CTUIR Hydrologist, provided document review and editorid recommendations.

Introduction
The Need for Fish and Wildlife Mitigation The development of dams for hydropower, navigation, flood control, and irrigation in the Columbia River Basin resuited in widespread inundation of riparian, riverine, and upland wildlife habitats (NPPC 1994; BPA et. al., 2993). The 1980 Power Act established and charged the Northwest Power Planning Council (NPPC or Council) with the task of developing a comprehensive fish and wildlife mitigation program to protect, mitigate, and enhance fish and wildlife habitat in the Columbia Basin (Power Act 1980, Section 4 (H)(1 )(A), page 12; NPPC 1994, Section 2, page 2- 1). This program, initially adopted in 1982, was amended in 1984.1987, 199 1-1 993,1994, and 2000.
Consistent with Section 1003(7) of the Power Council Fish and Wildlife Program, BPA is authorized and obligated to fund implementation of projects that will help reach the Power Council wildlife mitigation goals and objectives. The 1997 Final Environmental Txnpact Statement far the Wildlife Mitigation Program (Bonneville Power Administration, 1997), states as follows:
"Bonneville Power Administrution (BPA) is responsible for mitigating wildlife habitat loss caused by the development ofthe Federal Columbia River Power System. BPA meets this responsibility by funding projects submitted to and recommended by the Northwest Power Planning Courzcil. ''
Wildlife Lass Assessments The Wildldfe Impact Assessments for the John Day arid McNary Projects (Rassmussen and Wright, 1990b and d), provide estimated losses of 36,555 and 23,545 Habitat Units resulting from the John Day and McNary Hydroelectric facilities, respectively. Habitat losses included mainland, island, and riverine habitats. Mainland habitats, totaling an estimated 20,858 acres for the John Day facility and 12,898 acres for the McNary facility, consisted of shrub/steppe grassland, riparian hardwood, riparian shrub, riparian herb, emergent wetland, sand dune, sandlgravellcobblelmud, disturbed/bare/riprap, and open water cover types. Approximately 6,708 acres of island habitats associated with the John Day facility and 2,74 1 acres associated with the McNary hciIity were impacted.
Northwest Power Planning Council Goals and Objectives In its 2QQO Program, the Council adopted the following vision for its Fish and Wildlife Mitigation Program:
"The vision for this program is a Columbia River ecosystem that sustains an aburz.dant, productive, cad diverse community ofjish and wildlife, mitigating across the basin for the adverse efects to fish and wildlfi? caused by the development and operation of the hydrosystem and providing the benefits from fish and wildlife valued b-y the people of the region. This ecosystem provides abundant opportunities for tribal trust nad treaty right hawest and for non-tribal krvest and the conditions that allow for the recovery ofthe fish and wildl$e afected by the operation of the hydrosystem and listed under the Endangered Species Act. Wherever feasible, this program will be accomplished by protecting a d restoriizg the natural ecologicalfunctions, habitats, and biological diversity ofthe Columbia River Basiiz. In those places where this is not feasible, other methods that are compatible with naturally reproducing fish and wildlEfe populations will be used. Where impacts have irrevocably changed the ecosystem, the p q r m will protect and enharace the habitat and species assePnbkages compatible with the altered ecosystem. Actions taken under this progi-am must be cost-eflective and consistent with an adequate, eficient, eco~zomical and reliable electrical power supply.
This is u habitat-based program, rebuilding healthy, naturally producing fish and wildlife populations by protecting and restoring habit~ts and the biologicat systems within them, including anadrornous fish migration corridors."
The NPPC also established four biological objectives for the Fish and Wildlife Program. They are:
1 . A Columbia River ecosystem that sustains an abundant, productive, and diverse community of fish and wildlife.

2. Mitigation across the basin for the adverse effects to fish and wildlife caused by the development and operation of the hydrosystem.
3. Sufficient populations of fish and wildlife for abundant opportunities for tribal trust and treaty right harvest and for non-tribal harvest.
4. Recovery of the fish and wildlife affected by the development and operation of the hydrosystem that are listed under the Endangered Species Act
With specific regards to the NPPC's commitment and obligation to mitigate for wildlife habitat losses, objectives are to:
I . Quantify wildlife losses caused by the construction, inundation, and operation of the hydropower projects.
2. Develop and implement habitat acquisition and enhancement projects to fully mitigate for identified losses.
3. Coordinate mitigation activities throughout the basin and with fish mitigation and restoration efforts, specifically by coordinating habitat restoration and acquisition with aquatic habitats to promote connectivity of terrestrial and aquatic areas.
4. Maintain existing and created habitat values.
5. Monitor and evaluate habitat and species responses to mitigation actions.
The Iskuulpa Watershed Project The Iskuulpa Watershed Project (formerly Squaw Creek Watershed Project) was devetoped by the CTUIR to offset habitat losses related to the John Day and McNary hydroelectric projects. The project area is located outside the Columbia River corridor, and therefore provides off-site mitigation. Individual habitat types and species impacted by hydroelectric development will be addressed by this project, thereby providing in-kind mitigation. Iskuulpa is a fifth-order subbasin located in the Urnatilla River Basin encompassing approximately 24,200 acres.
Cover Types and Wildlife Species In-kind habitats and cover types provided by the project include riparian shrub and hardwood, sand/graveI/cobble/mud, and grasslands. Out-of kind cover types include coniferous forest. Primary HEP species selected to represent these habitats include the downy woodpecker (Picoides pubeseens), yellow warbler (Dendruica petechia), great blue heron (Ardea herodi~s), mink (Mustela vison), Western meadowlark (Sturnella neglectu), black-capped chickadee (Parus atricopillus), and blue grouse (Dondragupus obscurus).
Crediting Habitat Units to BPA The Iskuulpa Watershed Project includes three classes of land ownership; 1) fee lands, 2) CTUIR Tribal Trust lands, and 3) CTUIR-member allotments. The Iskuulpa Watershed Project emphasizes two strategies for acquiring, protecting, and enhancing habitat, including fee acquisitions and leasing Bureau of Indian Affairs (BIA) administered grazing allotments and resting them from livestock use. The 1997 Memorandum of Agreement between BPA and the CTZTTR differentiates how BPA receives mitigation credit for acquired and leased lands. For fee lands acquired through the NPPC's Fish and Wildlife Mitigation Program, BPA receives full credit for acquisition, protection and enhancement. For leased lands (e,g. grazing leases), the CTUTRBPA MOA states as follows:

Irkuulpb Watershed - 24*m Acrw
Mitigation L and5 - 5,936 acres rn CR& - Acguisilion, P s ~ c ~ m z d ~ e l s e n t
a 1AIlotd Lands - 9,664 Acres Pro;bec&rt and ES.lhwtcemmt Credits h v e Baseline
a T&alTMstLads-909Acres E k h a n c e ~ e n t Gredas Above Baselhe
0 Ion-Cwdated Lands

"G. For Squaw Creek leases, BPA shall receive full credit for pi-otectirtg HU's (habitat urzits) o f rangeland species aflected by grazing, and full credit for hbitut irnproven-lenbs to all habitats in the leased area. For a61 other non-Irzterin~ Agreement leases, BPA shall receive fill credit for improvement NU'S. v a n acre by acre crediting method is used, BPA shall receive 1 acre of credit far every 3 acres ofirnp~.ovem~nts when the activities needed to bring about the improvements are complete."
Species with habitat parameters affected by grazing include the western meadowlwk, yellow warbier, mink, and blue grouse and crediting for the benefits of acquiring grazing leases will be limited to these species. Parameters addressed in habitat models for the great blue heron, downy woodpecker, and black- capped chickadee are focused primarily on the structure and/or arrangement of tree stands, and are not therefore included. A map of land ownership and credited lands is displayed on page 3.
Benefits to Fisheries Resources Though this report will summarize HU's for wildlife species, it is important to recognize that this watershed project was from the outset established to provide benefits to resident and anadromous fish resources as well as terrestrial wildlife. The project is consistent with the Council's stated objective of "coordinating habitat restoration and acquisition with aquatic habitats to promote connectivity of terrestrial and aquaiic areas." The Iskuulpa subbasin contains approximately 23 miles of anadromous and resident fish habitat and over 50 miles riverine habitat. The subbasin supports the highest density of spawning Threatened summer steelhead in the Umatilla Basin, and provides habitat for bull trout, native redband and rainbow trout, and re-introduced spring chinook and coho salmon.
Report Organization The remaining sections of this report are organized as follows: 1) Study Area - Physical Environment, 2) Study Area - Biological Environment, 3) Methods; 4) Results, and 5) Consistency with NPFC Program.
Study Area-Physicall Environment
Project Location The Iskuulpa Watershed Project area is located approximately 20 miles east of Pendleton, Oregon. The legal description of the project area is: Township 1 North, Range 35 East, all or portions of Sections 2 - 4, 1 1 , 14, 16,21 - 23,26 and 28; Township 2 North, Range 35 East, all or portions of Sections 1 - 3,8 - 16, and 21 - 24; and Township 2 North, Range 36 East, portions of Section nineteen (see Project Location and Area Maps, Pages 5 and 6).
The confluence of Iskuulpa Creek at the Umatilla River occurs at approximately River Mile (RM) 78 of the Urnatif la River.
Climate The folIowing climate description is excerpted fiom Plant Associations of the Blue and Ochoco Mountains (Johnson and Clausnitzer, 1992).
The relief of the Blue Mounatins creates several localized climatic affects. The diversity of landscapes between moutain ranges, rolling topography and deep, dissected canyons influences local climatic patterns. The major influence to the regional climate is provided by the Cascade Mountains lying nearly 200 miles to the west. This mountain range forms a barrier against potential modifying effects of warm, moist fronts emanating out of the Pacific Ocean. As a result, the overall climate of the Blue Mountains is labeled Temperate Continental - cool summer phase (Trewartha, 1968 j. Mean temperature is less than 72 degrees F in the warmest month and 50 F for more than 3 months. Light precipitation, low relative humidity, rapid evaporation, abundant sunshine, and wide temperature and precipitation fluctuations are characteristic of this climate.


Iskuulpa Watershed
f l lskuulpa Watershed - 24,2013 Acms
4 Range Unit Borndarks - 20,117 Ac2es
Fo~est Cover - 3,539 a c m
n Grarskndcovsr - 10,991 Acres
##f#f R.ipaxianHardmob,- 9 A c w s
Piparim Shmb -335 Acres

A break in the Cascadian barrier is provided by the Columbia River Gorge. This topographic feature and the associated Columbia River provide an opportunity for marine climatic conditions to reach the northern Blue Mountains and strongly influence the vegetation. This climate is labeled Temperate Oceanic (Trewartha, 1968) and differs significantly from the Temperate Continental climate in providing greater cloudiness, increased precipitation and higher relative humidities with less tluctuation in winter temperatures. The oceanic influence provides the environment for vegetation more common to the western Cascades to occupy portions of the northern and northwestern Blue Mountains. Exampfes of this vegetation are grand firlsword fern-ginger, grand fir/oak fern and grand firlfalse bugbane.
The high percentage of cloud days attributed to the temperate Oceanic climate, versus the high percentage of clear, winter days and nights of Temperate Continental climates, has dramatically influenced the kind of vegetation found in the northern Blue Mountains. Daubenmire (1956) determined that the oceanic climate promoted the grasslands and rhizomatous shrublands characteristically found in the foothills, slopes and ridgetops of the Blue Mountains adjacent to the Palouse. The continental climate, on the other hand, promotes sagebrush and juniper so commonly found in the Great Basin to the south of the Blue and Ochoco Mountains.
The majority of annual precipitation falls as snow during winter. Late summer and early autumn provide the area with convectional storms resulting from masses of cool air crossing the Cascades and passing over the Blue and Ochoco Mountains at high elevations. The hot, dry surface air violently mixes with this cool. moist upper air mass to provided lightening storms. These events have provided a cyclic, annual abundance of natural fires. The fires historically burned extensively and provided the renovating and rejuvenating force behind the development and composition of Blue Mountain and Ochoco Mountain vegetation.
Temperature and Precipitation Temperature and precipitation records me available from two point sources near the project area. Data was recorded at Meacham, Oregon, located approximately 2 miles southeast of the watershed, for the period 195 f -75. These records represent temperature and precipitation conditions in the upper portion of the study area (elevations > 3,800 feet), while lower elevations may be more closely represented by data collected at Pendfeton, Oregon, approximately 20 miles to the west. Obviously a continuum of precipitation levels would occur along the elevational gradient, but the best avaiIable information is provided by these two points.
At Meacham, the average winter temperature for the period was 29 F, with an average daily minimum of 23 F, and an average daily maximum of 73 F. Lowest temperatures occur in January, and the highest temperatures in August. The total annual precipitation for the period was 33 inches, with 30 percent measured between April and September. The average seasonal snowfall was 146 inches.
At Pendleton, the average winter temperature for the period 195 1-1981 was 36 F, with an average daily minimum of 29 F, and an average daily maximum of 7 1 F. Lowest temperatures occur in January, and the highest temperatures in August. The total annual precipitation at Pendleton for the period was 12 inches, with 30 percent measured between April and September. The average seasonal snowfall was 18 inches.
Topography The project is located on the west slope of the Blue Mountains within the fJrnatilla River Subbasin. The Iskuulpa Watershed orientation is from south to north. Elevations within the project area range from approxirnateIy 1,660 feet at its confluence with the Umatilla River to approximately 4,2W feet an Gibbon Ridge. Slope dasses were summarized for broad classes in Table I .

ulpa Watershed.
Topography of the Iskuulpa Watershed is typical of the Blue Mountain foothills, with broad flat ridges dissected by steep canyons with a variety of aspects. Aspect classes are distributed in the watershed as foIlows:
Table 2. A s ect Classes for the Iskuulpa Watershed. ~spect hrcent of '
Dqgrees Watershed
-
I Total I I -
I 1 100.0 I Aspect and elevation combine to provide similar or compensating environmental factors (temperature and moisture) that contribute to site productivity and the suitability of a site for a given plant community. As a combination of these factors is repeated across the landscape, a predictable plant community will occupy those sites given time and varying frequencies of disturbance (Johnson and Clausnitzer 1992).
Fire Occurrence Rates A fire history analysis was conducted for Isuulpa Creek Watershed and adjacent Blue Mountain foothills. The analysis area included approximately 67,840 acres (106 square miles) bounded on the north by the Umatilla River, on the east by Meacham Creek, on the south by Interstate-84, and on the west by Highway 337 (Old Emigrant Highway). The evaluatin area was expanded beyond the Iskuulpa Watershed in an attempt to get a more representative fire occurrence rate.
The fire history analysis was conducted using Oregon Department of Forestry fire records for a 26-year period spanning from 1972 - 1998. During the period, 99 fires were recorded in the analysis area for an average of approximately four fires per year. Seventeen of 99 known fires (17.2%) were identified as lightening-caused, while the remaining 82 fires (82.8%) were human caused. Human-caused fires included railroad (23 fires), motor vehicles (I4 fires), utilities (6 fires), lost agricultural burns (3 fires), and various other human-causes (36 fires).
Fourteen fires were recorded in Iskuulpa subbasin or on its boundary for the period. Fire sizes ranged from less than one-tenth acre to approximately 683 acres. Four of the fires were caused by lightening, with the largest growing to approximately 587 acres. Two of the fires were caused by utilities, two by vehicles, and six were classified as various ot-her human causes. The largest fire, 683 acres, was caused by utilities.

Hydrology Within its elevation range, the maill hydrologic influence for the Iskuulpa Watershed is rainfall with a chance of flood events due to rain-on-snow in the upper elevations. The combination of relatively shallow soils, a perpendicular orientation to storm front movement, and the elongated, trellis flow pattern can result in erratic fluctuations in stream flow.
Streandlow Regime Distinct strearnflow regimes can be determined from streamflow records. Stream flow exerts a stxong influence on channel morphology, aquatic habitat, and riparian vegetation. Streamflow categories include: (E) ephemeral, (I) intermittent, (P) perennial, and (S) subterranean; with specific notations for streamflow patterns dominated by 1) snow~nelt, 2) stormflow, 3) glacial melt, 4) spring-fed, 5) ice flows, 6) tidal influence, 7) regulated flow, 8) streamflow patterns altered by development.
The mainstem of Iskuulpa has a perennial flow regime with variations in streamflow dominated primarily by snowmelt run-off. Its primary tributaries, Little Iskuulpa and Bachelor Canyon, possess intermittent regimes dominated primarily by snowmelt run-off. All three streams have segments with subterranean flow, where water flows below and parallel to the ground surface. Jn rnainstetn Iskuulpa, the greatest number of subterranean flow segments occurs in Reach 5 (see map, page 10).
A US Geological Survey stream-flow gaging station was installed at RM 2 in Squaw Creek in 1998. Data for water discharge for the f 999 and 2001 water years (October I - September 30) is available for the 32.6 square miles of drainage area located above the gaging station.
I Annual Mean Ccfs) 1 33.3 1 35.5 1 19.0 1 29.3 1
1 10-Dav Minimum Icfs) 1 9 1 .94 1 .92 1 .94 1
Highest Daily Mean (cfs) I 830 Lowest DaiIv Mean icfs) .89
Regression equations based on other gaging stations in the vicinity have been utilized to estimate flow discharge for specific return intervals on Iskuulpa Creek. The most reliable of these equations are published in Magnitude and Frequency of Floods I'a Eastern Oregon (Harris and Hubbard, 3983). The equations used to calculate the return flow discharges shown in table I are for the North Central Region of Eastern Oregon and include data from 43 gaging stations. The stations range kern areas southeast of Bend, Oregon to Hood River, Oregon and over to WaIla Walla, Washington. The large area of coverage and the variability in the stream types and flow regimes explains the high range of error for calculated flow estimates.
285 .9 1
Annual Runoff (AcreIFeet) 1 24,140 ] 25,750 Annual Runoff (inches) 1 13.89 / 24.81
Experience in the Urnatilla River basin has shown that calculated discharges are significantly lower than actual discharge. Analyzing data collected fur 64 years from the Umatilla River above Meacham Creek
132 .86
13,760 7.9
415.7 -89
21,216.7 15.5

Iskuulpa Watershed Sream Netvvwk
Iskuulpa Watershed - 24,200 Acns
i--,( Ephmerals a Fish Habitat SrweyReach B ~ a k s

near Gibbon, Oregon produced a 100-year return interval discharge of 5880 cfs. Using USGS regression equations, a calculated 100-year flow event for the same site is 3677 cfs. The actual flow at this site was a 60% positive error from the calculated value. Actual discharges in Squaw Creek may be closer to the upper limit of the error range shown in Tdble 4 for each return interval; applying a positive error of 60% yields a discharge of 2,113 CFS .
The following table summarizes the number of dry units recorded during 1994 fish habitat surveys. Dry units are defined as sections of stream separating wetted channel units. Typical examples included riffles with subsurface flow or portions of side channels separated by isolated pools. The greatest number of dry units occurred in Reach 5 of the survey area.
Other tributaries are typically ephemeral, with patterns dominated by snowmelt,
Water Quality Water quality data is somewhat limited for the Squaw Creek. In 1997, stream temperatures were recorded at RM 2 and RM 9. Water temperature at Rn 2 (in Reach 2), recorded from May 21 to October 26, had a seven day maximum average temperature of 24. 1°C (75.4' F) and a high of 2 5 . 0 ' ~ (77.0%) on August 6". At River Mile 9 (break of Reaches 4 and 5) a seven day maximum average temperature of 26.8''' (80.2' F) and a high of 28.1'~ (82.6%) on August Sixth. Temperatures at RM 9 were recorded from May 22 to November 6, 1997.
Stream Morphology Fish habitat surveys conducted in 1984 provide surrogate information for developing a preliminary morphological description of the mainstern of Iskuulpa Creek. Approximately 1 1.8 stream miles of the mainstem were swveyed as illustrated on page 10. The morphological description summary is baed on the Rosgeu (1996) stream classification, and is intended to be useful in identifying areas of sediment supply, stream reaches sensitive to disturbance, potential channel response to changes in flow regime, fish habitat potential, and potential for natural recovery (Rosgen, 1996).
"Reach 3 contains a transition from the B-Type to C-Type. The original reach breaks in the habitat were not ba5ed the classification system.

B-Stream Type The "B" stream as described by Rosgen (1996) exists on moderately steep to gently sloped terrain, with the predominant landform seen as a narrow and moderately sloping basin. These types are moderately entrenched, have low channel sinuosity, and exhibit a "rapidsw-dominated bed morphology. Bedfonn morphology, which may be influenced by debris constriction and local confinement, typically produces scour poals (pocket water) and characteristic rapids. Streambank erosion rates are normally low, as are the channel aggregation/degradation process rates. Pool-to-pool spacing generally decreases with slope increases.
Reach 3, which includes a transition between channel types, includes what might best be categorized as a B4 channel, which includes moderately entrenched systems in narrow, moderately steep, cutluvial valleys, with gravel-dominated channel materials, and width/depth ratios greater than 12. This type is considered to be relatively stable and is not a high sediment supply stream. Large, woody, debris is an important component for fisheries habitat when available.
Based on the dominance of the channel material by cobble, these reaches might be categorized as B3 stream types. Channel bed morphology in these types is dominated by cobble materials and characterized by a series of rapids with irregular spaced scour pools. The average pool-to-pool spacing for this type is 3- 4 bank-full widths. Pool-to-pool spacing is generally 4-5 bank-full channel widths. Pool to pool spacing adjusts inversely to gradient. This type has a moderate width/depth ratio and sinuosity greater than 1.2. Channel materials are composed primarily of cobble with a few boulders, lesser amounts of gravel and sand. The bed and bank materials are stable and contribute only small quantities of sediment during run-off events. Large woody debris is an important component of fisheries habitat when available.
C-Stream Type These types are located in narrow to wide valleys, constructed from alluvial deposition. They have a well- developed floodplain (slightly entrenched), are relatively sinuous with a channel slope of 2% or less, and a bed-form morphology indicative of a rifflefpool configuration. Primary features of this type are a sinuous, low-reIief channel, well-developed floodplains built by the river, and point bars within the active channel. Channef aggradation/degradation and lateral extension processes are dependent on the stability of strearnbanks, upstream watershed conditions, and flow and sediment regime. Channels of this type cart be significantly altered and rapidly de-stabilized when the effects of imposed changes in bank stability, watershed condition, or flow regime combine to cause an exceedence of a channel stability threshold.
The valley bottom below the confluence of Bachelor Canyon is composed of it deep layer of alluvial material that was moved from the upper watershed and tributaries. Depositional processes through this stream reach are influenced by a combination of roughness elements in the stream and gradient changes. The removal or addition of large material within the active floodplain greatly influences the spatial and temporal distribution of fluvial sediments. This is especially true on the alluvial fan that has developed at the canyon opening near the confluence of Iskuulpa Creek and the Umatilla River.
Reaches 1 and 2 might best be preliminarily categorized as a C4 stream type. Rosgen (1996) describes these types as follows:
These types have gentle gradients of less than 2%, a high width-depth ratio, and generally possess higher meander width ratio than C1, C2, C3 stream types. Streambanks are generally composed of unconsolidated, heterogeneous, nun-cohesive, alluvial materials that are finder than the gravel- dominated bed material. Consequently, the stream is susceptible to accelerated bank erosion. Rates of lateral adjustment are influenced by the presence and condition of riparian vegetation. Sediment supply is moderate to high, unless stream banks are in a very low erodibility condition. This type, characterized by point bars and other depositional features, is very susceptible to shifts in both lateral and vertical stability caused by direct channel disturbance and changes in flaw and sediment regimes of the contributing watershed.

Un-surveyed Tributaries Major tributaries, which include Bachelor Canyon Creek and Little Iskuulpa Creek while not surveyed, would probably best be categorized as B3 types, as they are located in narrow, moderately steep valleys, cobble-dominated channel materials with lesser amounts of boulder, gravel, and sand. The stream banks of these tributaries are also stable due to their coarse material.
Numerous, non-fish-bearing tributaries contributing to these streams are typically A-type channels. These types are generally ephemeral, flowing only in response to precipitation, or intermittent, flowing seasonally or sporadically. A-type channels are characterized as entrenched channels with low width/depth ratios, low sinuousity, and steep slopes generally ranging from 4 - 1095, and sometimes exceeding 10%. In the Iskuulpa watershed, the dominant materials in A-type channels may include cobble, gravel, or residual soils for the A3, A4, and AS-Types. These types may provide relatively high sediment supply.
The table below summarizes Rosgen's management interpretations for classifications occurring is Iskuulpa Watershed. Stream types occurring in lskuulpa are shown in. bold.
A3 Very High A4 Extreme A5 Extreme A6 Winh B3 f Low B4 Moderate C4 Very High
stations {Rosgen 1996).
Very High Moderate ;;High ;;; Moderate Low High Very high
Floodplain, Channel, and Riparian Structural Characteristics Riparian conditions in the wildlife area range from very poor to fair. Past road construction (associated primarily with timber harvest and scattered, infrequent housing) has disconnected streams from their floodplains, constrained hydrologic processes, removedkeduced structural stability provided by both live and dead vegetation (large woody debris), and increased potential for erosion and sediment delivery to streams.
Floodplain and Channel Manipulations - Reach 2 Railroad and highway grades are constructed acrass the top of the developed alluvial fan and perpendicular to Iskuulpa Creek approximately .75 miles upstream of its confluence with the Umatilla River (within Reach 2). Although the stream channel across this fan is a single channel that is well developed, its historic location and form on the fan was likely tsansient with the possibility of multiple braid-form due to frequent changes and shifts in bedload stores. Bridges constructed over Iskuulpa Creek for both the railroad and highway, have locked the location of the channel in one place.
The highway bridge is able to pass a larger discharge with less hydraulic pressure than the railroad bridge due to the larger cross-sectional area. With frictional resistance taken into account, the highway bridge was calculated to pass 330% more flow than the railraad bridge. The calculated absolute discharge value of 3479.8 cfs for the highway bridge appears to be adequate to pass a 100-year flow event while the calculated discharge of 809.1 cfs for the railroad bridge would only pass an estimated 5-10 yew flow event.
Additional problems exist with a situation where the most downstream of two structures is the most constrictive. During flow events that approach the capacity of the limiting structure, hydraulic head increases fiom that structure and moves upstream. Flow velocity is reduced at the structure and also moves upstream. This causes sediment and bedload being moved by higher velocities ta drop ccut and be

deposited above the structure. In this situation, much of the inaterial is deposited under and adjacent to the upstream structure and increases the potential for overbank flow upstream of both structures. As matelid builds in elevation under the upper structure, its capacity is reduced; flow velocity is further reduced, hydraulic head increases, and the potential for overbank flow increases.
Overbank flow above the two bridge crossings provides significant energy relief for the stream channel. A floodplain with healthy vegetation provides a relatively low elevation, near channel region that slows flow velocity and diverts flow energy in multiple directions without eroding. A floodplain with healthy soils also should provide a large storage area for overbank flow.
Creating large structures in the floodplain that concentrate flows and increase hydraulic head should be avoided at all cost. Efforts with the purpose to improve floodplain function should focus on breaking up stream energy, reducing overland flow veIocities, and minimizing erosion. Dikes and levees above the bridges will not increase discharge capacity through the bridge crossings. Dike construction within the f oodplain will protect the dwelling and roadways by providing additional ponding storage in the floodplain only during stream discharge events that do not exceed the dike elevation. Once the dikes are overtopped, flow velocities will be higher than before due to the increased hydraulic head and local gradient; erosion and scour would be much worse than before. The existing roadbeds currently act as dikes and already limit the floodplain significantly.
A gravel-surfaced road parallels the length of Reach 2 on the east side of the stream, providing access to four dwellings. The roads and associated development reduce available floodplain habitat in this Reach. Each mile of road equates to approximately 4 acres of floodplain habitat, therefore the road occupies approximately 17.8 acres of floodplain.
Floodplain and Channel Manipulations - Reach 3 - 5 From Reach 3 to Reach 5, the road reverts to a noon-maintained, native-surface road (soil) with multiple, undeveloped stream crossings. The road occupies an estimated 27.72 acres of habitat. Whild most of the road is located in the floodplain, portions are located on the adjacent toe slope. The initial construetian of this road, primarily for timber harvest, resulted in the removal of present (dead trees) and future (live tree) sources of large-wood supplies to the Iskuulpa Creek floodplain. Restoration and reforestation of flood plain terraces is recommended to address the deficient supply of large wood in the long term and to create intact, near channel areas that slow water velocities and divert stream energies during high flow events.
Streambank Stability 1994 Fish habitat surveys documented that approximately 18% of the streambanks of Iskuvlpa Creek were actively eroding. Approximately 2-9% of the streambanks in the surveyed reaches were classified as undercut.
Fjaadplain connectivity A road parallels Iskuulpa Creek for approximately Z 1.4 miles of the surveyed total length. The first three miles of the road are gravel-surfaced and are infrequently maintained, the remainder however is native surfaced. The maintained portion constrains the movement of the stream flow, particularly in Reaches One and Two. The roads also intercept flow from adjacent springs. In Reaches Three though Five, the native surface road is not maintained. The road has multiple stream-crossings, is capable of channelizing stream flow during flood events, and contributes to sediment production and delivery to streams.
WidtWpth ratio The following table summarizes channel width and depth characteristics for each surveyed reach, and provides an average for the entire survey area.
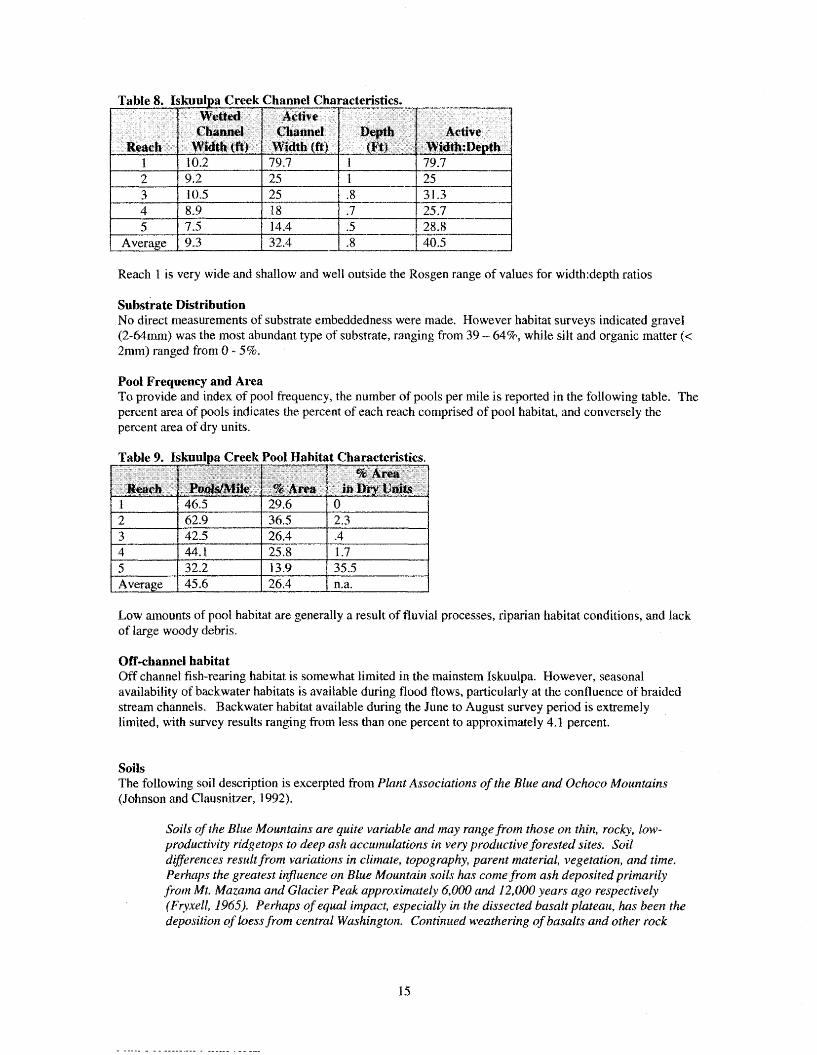
Table 8. Iskuull~a Creek Channel Characteristics.
I Average 1 9.3 I 32.4 1 -8 1 40.5 1 Reach 1 is very wide and shallow and well outside the Rosgen range of values for width:depth ratios
Substrate Distribution No direct measurements of substrate ernbeddedness were made. However habitat surveys indicated gravel (2-64mm) was the most abundant type of substrate, ranging from 39 - 6496, while silt and organic matter (< 2mn1) ranged from 0 - 5%.
Pool Frequency and Area To provide and index of pool .frequency, the number of pools per mile is reported in the following table. The percent area of pools indicates the percent of each reach comprised of pool habitat, and conversely the percent area of dry units.
Table 9. Iskuulpa Creek Pool Habitat Characteristics.
1 Average 1 45.6 1 26.4 1 n.a. I
Low amounts of pool habitat are generally a result of fiuvial processes, riparian habitat conditions, and lack of large woody debris.
Off-channel habitat Off channel fish-rearing habitat is somewhat limited in the mainstem Iskuulpa. However, seasonal availability of backwater habitats is available during flood flows, particularly at the confluence of braided stream channels. Backwater habitat available during the June to August survey period is extremely limited, with survey results ranging from less than one percent to approximately 4.1 percent.
Soils The following soil description is excerpted from Plntrt Associations of the Btue and Ochoco Mountains (Johnson and Clausnitzer, 1992).
Soils of the Blue Mountains are quite variable and may rarzge from those on thin, rocky, luw- productivity ridg~tops to deep ash accumulations in very productive forested sites. Soil diflerences result from variatio~ls in climate, topography, parent material, vegetation, and time. Perhaps the greatest influence on Blue Mountain soils has come from ash deposited primarily from Mt, Mazanta and Glacier Peak uppro-xiinutely 6,000 cnnd 12,000 years ago respectively (Fryxell, 1965). Perhaps of equal impact, especinll~j in the dissected basalt plateau, h a s been the depusitioczva of bess from central Washingtoa. Co~ztinued weathering I;lfba,~alts and other rock

types has resulted in a nzixing of wind-borne ash and loess with rocky colluvium in many areas. Consequeratly, soils fall urader one of the following broad categories:
I . Residual - derived in place fnsm predominately bedrock or colluvial rock materiuls. 2. Ash-hess - derivedfrorn deposited and accumulated ash andor loess over older
buried soil material. 3. Mixed - derived from colluvium, ash and/or loess mixed well in su$aca layers over
older buried soil material (Johnson and Simon, 1987).
Ofthe varied geologic material available for soil fbrmation, basalt and andesite are the most common in the Blue Moun~airas (Johnson and Clausnitzer, 1994). Residual soils formed from these muterial diflerfrom the volcanic c~sh and loessial soils in several respects: 1)finer textured in the upper profile, 2)increased structure, 3) higher coarse fragments, 4) lower water-holding capacity, and 5 ) higher hulk densities. Other nzaterials may provide locally important substrates that impart cl?aracteristic attributes to soils.
In the Blue Mountains, the productivity or expression of plant communities is closely reIated to ash and loess content in soils (Johnson and Clausnitzer, 1994). Ash soils possess properties of 1 ) high water holding capacity, 2) high water infiltration rates, 3) low compactability, 4) high detachability, and 5) high amounts of nutrients in upper surface layers. Under undisturbed conditions, these soils support good vegetative cover which protects the ash from erosion (USDA, 1'385).
Other soil properties that appear i~rtportant to plant community distribution and productivity include rock fiagment content, depth ofsu73cuce soil material, rooting depth, and presence of clay concentrations. All of these properties have some influence on water holding capacity which is especially critical where summer precipitation is @erz limited, Rock fragments of all sizes detract from the total soil volume a d can substantially reduce the water storage capacity of soils. Rock fragment sizes affect the movement of water through the soil. Size a d percentage of rock fragments cut2 be used as indicators of dryness of sites. Total soil depth nwy be misleading when determining productivity diflerences between sites because soil water and nutrients am held most abunQantl-y in only upper portions of the soil. Depth of surfuce soil material and rooting depth are used to indicate this zone of more available soil and water. Rooting b~yond these levels into subsurjiace water sources is also indicated in some types. The last property to demonstrate soil moisture capability is clay content. Clay layers tend to hold large quantities of water, altough some ofthis water may be unavailable to plants. On otherwise rocky, dry soils, clay m y ameliorate site conditions mkirlg it possible for less drought tolerant plants and commlanities to exist.
Loess also provides many important qualities to sails. Loessid deposits are usually ])high i ~ z base saturation (can hold a large amount of nutrients), 2) have a high content of weathered minerals arid thus are high in nutrient reserve, and 3) generally have excellent physical properties.
Soils napped in the fskuulpa subbasin are highly variable, reflecting both parent nlaterial and soil development. Upland soils have formed over dissected basalt and andesitic bedrock, and tend to be shallow on steep slopes and moderately deep to deep on benches and flats of uplands. Riparian flood plain soils are formed in deep alluvium and colIuvium. Ash is a major component of all soils and is most apparent in deeper soils of forested areas.
Floodplain soils are recent and variable and consist primarily of xerofluvents. The surface Iayer ranges from loamy sand to very cobbly loam, and the underlying layer ranges from extremely gravely sands to very cobbly loams. The substratum is a coarse sand, and permeability therefore ranges from moderate to very rapid. A seasonal high water table is common, and soils are subject to perids of flooding in the winter and spring,

Soils on steep side slopes adjoining the main valley are typically shallow on the south slopes and moderately deep to deep on the north slopes. Coarse fragments are common throughout the protlle, particularly on shallow soils. The surface layer is a silt loam over a heavier cobbly silty clay loam subsoil. The substratum is fractured bedrock.
Upland soils range from shallow on rangelands to deep on woodlands. Shallow and moderately deep soils typically they have a silt loam or silty clay loam surface with a pickup of clay in the subsoil. Deep soils are formed in ash and have a silt loam surface and subsoil over a buried silt foam subsoil.
Soil complexes mapped for the subbasin include Waha-Roc kl y and Albee-Bocker-Anatone, as well Tolo- Klicker Association and Umatilla-Kahler-Gwin Associations. If the understory of plant communities of these soils is overgrazed, the proportion of preferred forage plants decreases and that of less preferred forage plants increases. Livestock grazing, if prescribed, should 1) be delayed until the preferred forage plants have achieved sufficient growth to withstand grazing pressure, and 2) include a rest-rotation system to allow preferred forage plants seasons of non-use by domestic livestock.
Soils characteristics interact with other environmental factors (aspect, slope position, and precipitation) to define the distributional limits of plant communities and their individual species (Johnson and Clmsnitzer, 1986).
Biological Environment
Cover Type Characteristics For the purposes of this analysis, the biological environment will be described by the amount of forested, upland shrub, grassland, and riparian cover types, and their species composition and ecological condition. The basis for defining and mapping the cover types in the study area was a 1998 polygon-class, existing vegetation theme utilized in the Arcview Geographic Information Systems (GIs) program. The theme includes classifications for vegetation size, structure, and species. A detailed listing of the "existing vegetation theme" properties is provided in Appendix A. A map of the cover types and their relative amounts is shown on page 20.
Plant communities will be described within the plant association concept (Johnson Clausnizter, 1994) and grouped within biophysical environments and potential natural vegetation communities.
The Plant Assmiation Concept The plant community is a general term for an assemblage of plants living together and interacting among themselves in a specific location (Johnson and Clausnitzer 1992). It is not a taxonomic unit, has no successional status, and may not be recognized by all investigators.
The plant association concept differs in that its purpose is to segment the t e m p e r a t u r e - o s t gradient through recognition of indicative plant species so as to provide easier recognition of similar environments across the landscape (Johnson and Clausnitxer 1992). As a combination of similar or compensating environmental factors is repeated across the landscape (e.g. elevation, slope position, aspect), a predictable plant community will occupy those sites given time and varying frequencies of disturbance (Johnson and Clausnitzer 1992). This community will then have similar physiognomy (form and structure) and floristics; and may also be called a climax community (Allaby, 1994). It is believed that: I ) the individual species in the association are, to some extent, adapted to each other; 2) the association is made up of species that have similar habitat requirements; and 3) the association has some degree of integration (Kirnrnins, 1997).
Because environmental conditions vary continuousfy across the landscape, the resulting plant composition also varies, For that reason, a plant association is not rn exact assemblage of species from one location ta another. However, sites in the same plant association differ less than sites from different associations (Powell, 1998).
Plant associations are named for their dominant averstury (tree) and undergrowth (herb or shrub) plants, such as Grandfir/Twinflower plant association. It is assumed that the dominant @ee species (grand fir)

represents an area's macroclimate, m d the undergrowth indicator plant (twinflower) the area's microclimate and soits.
Plant Series Plant associations are grouped into series, which are aggregates rrf taxonomically related plant associations. The name of the series is that of the climax species dominating the principal layer. The naming convention is based on temperature/maisture regimes of the environment supporting the plant association. An example would be the g r ~ n d f i r series in which all ABGR plant associations are arrayed, as well as the sera1 plant community types related to grand fir climax vegetation (Johnson and Clausnitzer, 1994).
Plant Association Groups Plant associations may be aggregated into plant association groups (FAG), classifications that have similar ecological environments. A Grand Fir/Pacific Yew/Twinflower plant association would occur in the Grand Fir series, and would be grouped into the "Coal Wed" plant association group.
Potential Vegetation Groups Finally, plant associations may be classified into Potential Vegetation Groups (PVG), a group of potential vegetation types that have similar environmentaE conditions and are dominated by similar types of plants. Groupings are often m d e using similar Z$e forms. Continuing with the example, the "Cool Wet" PAG is located within the " m i s t Forest" Potential Vegetation Croup. This organization is illustrated in Figure 1.
Figure 1. Example of Plant Association Organization.
Forested Communities Forest cover types are generally located on easterly to northwesterly aspects, resulting in a grass-timber mosaic characteristic of the Blue Mountains. The study area contains approximately 3,539 acres of forested habitat. Forested piant associations observed during the course sf surveys (n= number of observations) and their relation to plant association groups and potential vegetation groups are displayed in the following table. Detailed descriptions of each plant association are presented in Appendix B.
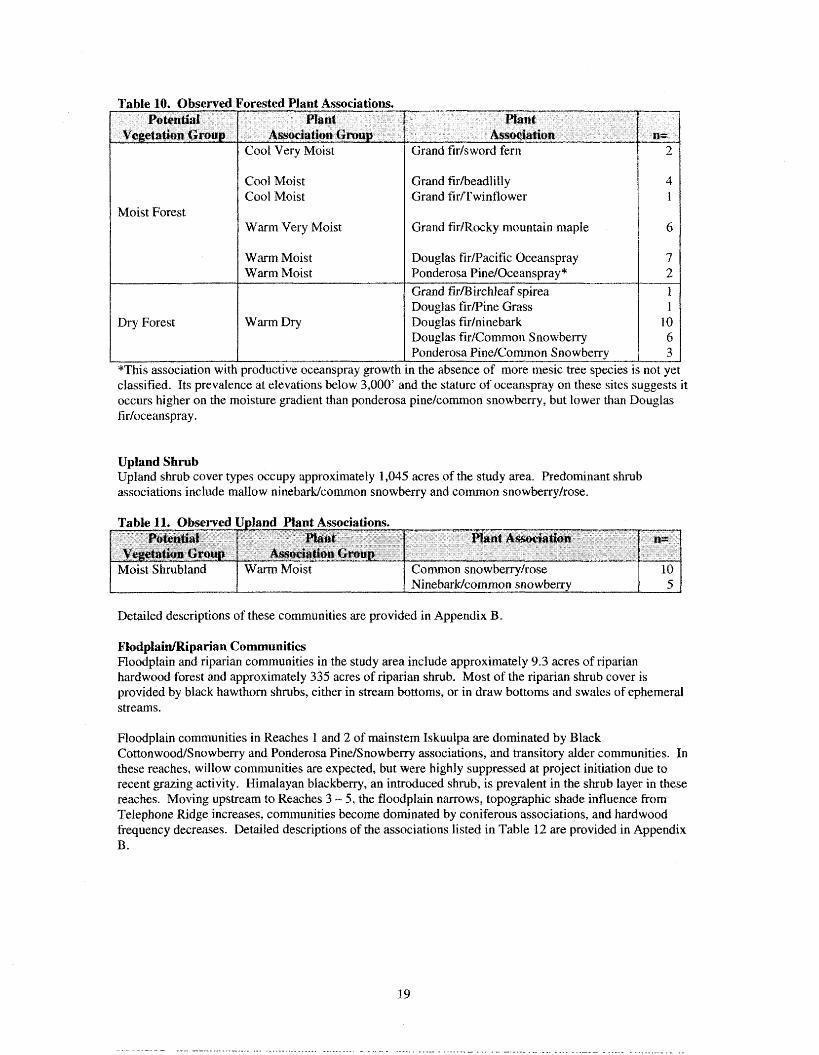
Table 10. Observed Forested Plant Associations.
Cool Moist Grand fir/beadlill y 4 Cool Moist Grand firmwinflower 1
Moist Forest W m Very Moist Grand firtRocky mountain maple 6
Warm Moist Douglas firfpacific Oceanspray 7 Warm Moist Ponderosa PineIOcestnspray* 2
Grand firmirchleaf spirea 1 Douglas fir/Pine Grass 1
Dry Forest Warm Dry Douglas firlni nebark 10 Douglas Eir/Common S nowbelly 6 Ponderosa Pine/Common S nowberry 3
*This association with productive oceanspray growth in the absence of more mesic tree species is not yet classified. Its prevalence at elevations below 3,000' and the stature of oceanspray on these sites suggests it occurs higher on the moisture gradient than ponderosa pinefcommon snowberry, but lower than Douglas
Upland Shrub Upland shrub cover types occupy approximately 1,045 acres of the study area. Predominant shmb associations include mallow ninebarkfcommon snowberry and common snowberrylrose.
Table 11. Observed Upland Plant Associations.
Detailed descriptions of these communities are provided in Appendix B.
Moist Shrubland
Fladplitifliparian Communities Hoodplain and riparian communities in the study area include approximately 9.3 acres of riparian hardwood forest and approximately 335 acres of riparian shrub. Most of the riparian shrub cover is provided by black hawthorn shrubs, either in stream bottoms, or in draw bottoms and swales of ephemeral streams.
Floodplain communities in Reaches 1 and 2 of mainstem Iskuulpa are dominated by Black CottonwoodlSnowberry and Ponderosa PinefSnowberry associations, and transitory alder communities. In these reaches, willow communities are expected, but were highly suppressed at project initiation due to recent gazing activity. Himalayan blackberry, an introduced shmb, is prevalent in the shrub layer in these reaches. Moving upstream to Reaches 3 - 5, the floodpIain narrows, topographic shade influence from Telephone Ridge increases, communities become dominated by coniferous associations, and hardwood frequency decreases. Detailed descriptions of the associations listed in Table 12 are provided in Appendix B.
Warm Moist Common snowbenylrose Ninebarldcommon snowberry
10 5

Isladpa Watershed Project Area Covu Types
f l Iskuulpa Watershed - 24a200 Acres
4 Range Unit Boundaries - 20,117 Acres
Fovest Cover - 3,539 acres
U p h d Shrub Cover - 1,045 A c e s
a GrasskndConr - 10,991 Acres
f#### Riparian Hardwood - 9 Acles
&paxian Shrub - 335 Acms

Moderate soil moisture
I 1 Warm Wet RF, Low I Douglas-firlcomrnon snowberry-floodplain / 3-4 1 I I soil moisture I I I
L I I I I
*Iskuulpa Creek reach breaks as described previously.
Black cottonwood/comrnon snowberry - floodplain
i I
Dry Riparian Shrub
Grassland Communities Grasslands are the dominant cover type in the study area, comprising approximately 10,991 acres. Associations surveyed in the Iskuulpa Watershed included the Bluebunch Wheatgrass/Sandberg's bluegrass and Idaho fescue Bluebunch wheatgrass associations. Grassland communities typically occur on westerly to southeasterly slopes and ridgetops.
Dry Riparian Forest
Generally, grassland communities in the watershed have regressed into annual-dominated grass communities as a result of past grazing.
Hot Dry RF, Moderate Soil Moisture
Hot Dry RF, Low Soil Moisture Hot Dry, Low Soil Moisture
Detailed descriptions of these communities are included in Appendix B.
Ponderosa pine/common snowberry - floodplain Black hawthorn
/ Dry Grassland I Hot Dry I Bluebunch Wheatgrass/Sandberg7s Bluegrass 1 28 1
Methods A preliminary HEP analysis for Iskuulpa Watershed was conducted for use in the development of the BPNCTUIR Memarandurn of Agreement. Conducting the preliminary HEP analysis included development of base maps, cover typing, and estimating habitat suitability indices. Cover types were delineated utilizing aerial photos and 1:24,000 USGS quad maps based on the presence of tree, shrub, and grass cover. The minimum number of credits estimated for the Tskuulpa Watershed was 3,128 habitat units.
More detailed cover type data was obtained through the development of a Geographic Information System (GIS) vegetation data theme in 1998. The theme is a polygon-feature class them with "good" data confidence (accuracy of vegetation identification) and "excellent" locational confidence. The theme was scaled at 1:24,000, and projected in Universal Trans Mercator (UTM) 2 1.
Prior to conducting field surveys, wildlife technicians were trained in the appropriate survey protocols for each model. Surveys were conducted consistent with Habitat Evaluation Procedures models for each species. To improve survey efficiency, an attempt was made to combine measmments for as many species' habitat variables as possible for each cover type. Surveys were conducted with teams of 2-4

technicians, generally with one team member recording data as other team rnernber(s) conducted variable measurements, species identification, and ocular estimates of cover.
Forested and Upland Shrub Habitat Surveys The protocol for forested and upland shrub cover types was based on Habitat Evaluation Procedures (HEP) models for blue grouse, and downy woodpecker. Habitat variables and measurement techniques are displayed in the following table. Habitat suitability curves for ail mitigation species are presented in Appendix C.
Blue Grouse
Downy Woodpecker
V2: Percent Shrub Crown Cover V3: Average Height Shub Canopy V4: Percent Herbaceous Cover V5: Average Height Herbaceous Canopy V6: Diversity Herbaceous Species
Line intercept Line intercept, rod. Square Meter, Ocular Estimate Graduated Rod or Tape Count
V7: Distance to Forest Cover GIs Software V1: Basal Area (Sq Ft) Prism, 10 factor
1 V2: Snags/Acre I Count within fixed radius plot [
Starting points for line transects were generally established in a pre-field review. Line intercept transects were established at a starting point 300 feet within the cover type to avoid the influence of ecotone gradients and anthropogenic factors such as roads. Trmsects were a minimum of 1000 feet in length with 100 foot sub-segments. Final transect lengths were determined using a "running mean" to estimate variance, with a sampling goal of 95% probability of being within 10% of the true mean for percent herbaceous cover.
Shmb intercept, measured in I Oths of a foot (i.e. 1.6 feet), was recorded by species along entire transect. A graduated rod was used to measure shrub height where shrub foliage intercepted the transect line.
Circular plots and associated robe1 pole location points on transects were selected from a random numbers table. For example, if the first number selected from the random numkrs tables was 23, then circular p~ot/robe~ pole measurements were taken at the 23" ft mark of the first 100' sub-segment. Two square meter plots and one robel pole point were measured in each 100' sub-segment. The circular plots, used to make ocular estimates of herbaceous cover, were offset 5' perpendicular to the transect tine. The robe1 pole was used to measure visual obstructions and hiding cover. At a distance of 15 feet, two measurements were taken from the transect line in opposite directions from the robel pole, and two measurements perpendicular to the transect line in opposite directions from the pole. For each point, the percentage of the robe1 pole obscured by vegetation or other cover was measured, then the mean obstruction value was cafculated from the four measurements.
Tree basal area was measured from plot center using a factor 10 prism, and the square feet of basd area summed for the plot. Measurements were taken facing in the transect line direction of travel, then counts were made rotating clockwise, making sure to keep prism over plot center. Basal area was recorded for live trees only.
Tree canopy clasure was recorded at 3 0 foot intervals along transect using moosehorn densiometer, and a running tally maintained for the entire transect length. Average canopy closure was cdculated for each 100 foot intercept segment (i.e., 6 hitdl0 readings = 60% canopy closure) and the entire transect.
Using the random numbers table as described above, fixed radius plot (37.5 feet) were established at random points on each 100' sub-segment of the transect. Facing transect origin, surveyors rotated clockwise and collected and recorded square feet of basal area and snags within the plot, Far each plot, tree species, average tree diameter, and average tree height were recorded.

Figure 2. Forest and Upland Shrub Transect Diagram. . - - -
1 100' Timber I Sub-segment
\andom Point -Robel pole point -Center fixed radius pls t
In the forested cover type, 20,300 feet of transects, 101 one-tenth acre plots, and 406 square meter plots were completed.
Hoodplain/Riparian Habitat Surveys FloadpIaidRiparian survey protocols were based on HEP models for the yellow warbler, downy woodpecker, and mink. Associated habitat variables and measurement techniques are displayed in the following table. Habitat suitability curves for all mitigation species are presented in Appendix C.
Downy I V I : Basal Area (Sq Ft) I Prism, 30 factor
Yellow Warbler
Vl: Percent Deciduous Shrub Crown Cover V2: Average Height Deciduous Shrub Canopy V3: Percent Shrub Canopy Composed of Hyrophytic Shrub
woodpecker Mink
Line Intercept Line Intercept, Rod. Line Intercept
V2: Percent Tree Canopy Cover V3: Percent Shrub Canopy Cover V4: Percent Canopy Cover of Emergent Vegetation V5: Percent Cover TreesJShrubs w/in 100 meters of Water's Edge.
Heron
V2: SnagsIAcre VI: Percent of year with surface water present
Habitat Surveys Moosehorn Densiorneter Line Intercept Line Intercept Moosehorn Densiometer
Great Blue
Plot Count USGS Guage, Fish
Initial survey starting points were identified during pre-fkld review, then finalized in the field by establishing line-intercept transects at the high water mark. Transects were run in 100 foot lengths with a total length of 1000 feet. Intercept was recorded in 10 th of feet (i-e., 1.6) for all objects providing hiding cover for mink (i-e., tree, shrub, grass, overhang, rock, etc) within 3 feet of high water mark.
V6: Percent Shore Line Cover wllin I M of High Water Mark. V1: Distance between patentid nest sitedforaging areas V2: Presence of water body with suitable prey po~ulation V3: Disturbance free zone w/in I00 meters of foraging area V4: Presence of tree cover type within 250 meters of water body V5: Presence of disturbance free zone around potential nest sites V6: Proxirnitv of activel~otential nest sites
Line Intercept Aerial Photo Interpretation Fish Population S\lrveys GIS Sofeware GIS Software Aerial Photo Interpretation GIs Software
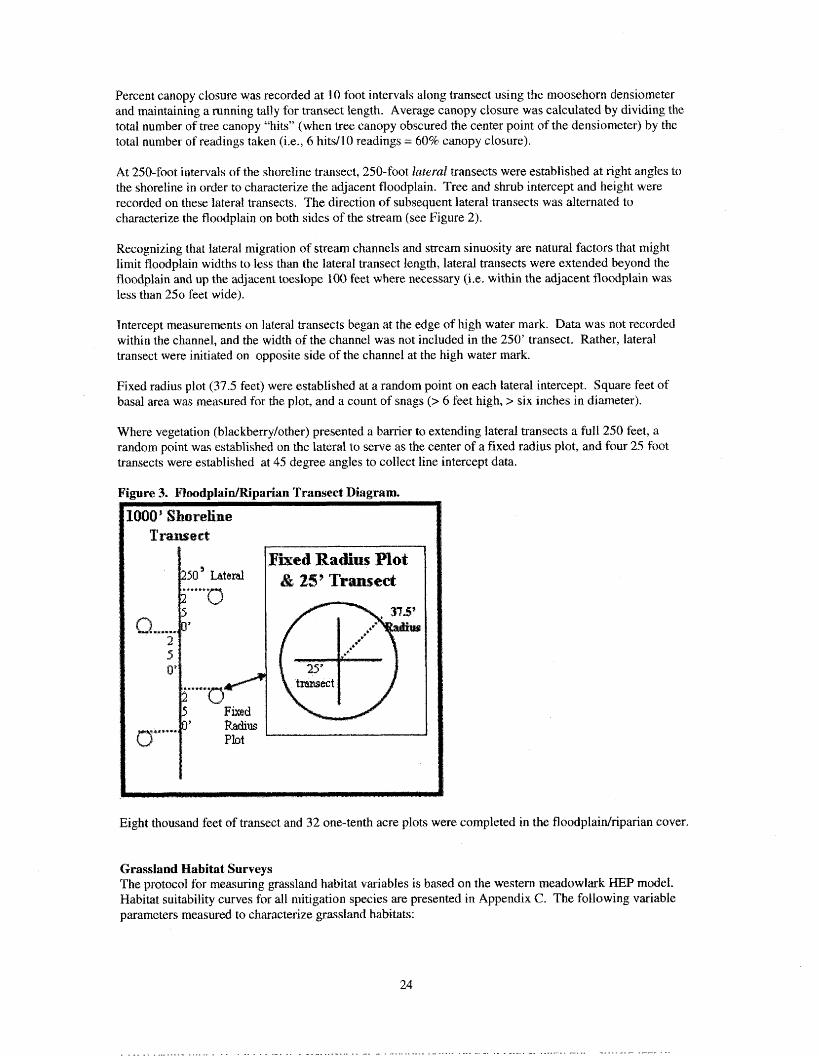
Percent canopy closure was recorded at 10 foot intervals along transect using the moosehorn densiometer and maintaining a running tally for transect length. Average canopy closure was calculated by dividing the total number of tree canopy "hits" (when tree canopy obscured the center point of the densiometer) by the total number of readings taken (i.e., 6 hits/IO readings = 60% canopy closure).
At 250-foot intervals of the shoreline transect, 250-foot larerul transects were established at right angles to the shoreline in order to characterize the adjacent floodplain. Tree and shrub intercept and height were recorded on these lateral transects. The direction of subsequent lateral transects was alternated to characterize the floodplain on both sides of the stream (see Figure 2).
Recognizing that lateral migration of stream channels and stream sinuosity are natural factors that might limit floodplain widths to less than the lateral transect length, lateral transects were extended beyond the floodplain and up the adjacent toeslope I00 feet where necessary (i.e. within the adjacent floodplain was less than 250 feet wide).
Intercept measurements on lateral transects began at the edge of high water mark. Data was not recorded within the channel, and the width of the channel was not included in the 250' transect. Rather, lateral transect were initiated on opposite side of the channel at the high water mark.
Fixed radius plot (37.5 feet) were established at a random point on each lateral intercept. Square feet of basal area was measured for the plot, and a count of snags (> 6 feet high, > six inches in diameter).
Where vegetation (blackberry/other) presented a barrier to extending lateral b-ansects a full 250 feet, a random point was established on the lateraf to serve as the center of a fixed radius plot, and four 25 foot transects were established at 45 degree angles to collect line intercept data.
Figure 3. FIoodplain/Riparian Tramsect Diagram.
X000"horelirre Transeet
Eight thousand feet of transect and 32 one-tenth acre plots were completed in the floodplaidriparian cover,
Grassland Habitat Surveys The protocol for measuring grassland habitat variables is based on the western mc=adowlmk HEP model. Habitat suitability curves for all lnitigation species are presented in Appendix C. The following variable parameters measured to characterize grassland habitats:

I Western I V1: Percent Cover Herbaceous Plants. I Square meter hoop f Meadowlark V2: Percent Cover Composed of Grass. Square meter hoop
V3: Average Height Herbaceous Canopy- Robe1 Pole V4: Distance to Perch Site. Square meter hoop V5: Percent Shrub Canopy Cover.
Starting points for grassland surveys were established during pre-field reviews. Transect length was determined using a "running mean" to estimate variance with a sampIing goal of 95% probability of being within 10% of the true mean for percent herbaceous cover. Every 50 meters, a square meter plot was established to measure cover values.
Square meter hoop plots were established perpendicular to main transect, offset by one meter, and placed on alternating sides of the main transect during the survey. The square meter hoop was used to prc3vide a visual reference to allow surveyors to estimate percent cover of herbaceous plants by species, shrub canapy cover by species, and percent of plot composed of grass vs. non-grass species.
A meter tape was used to measure the distance to the nearest perch from plot center. Perch sites were defined to include rock outcrops, fence posts, shrubs, with a height greater than the measured average height of the herbaceous canopy within the square meter plot.
The robel pole was erected at plot center to measure visual obstructionshiding cover. At a distance of 10 feet, two measurements are taken from the transect line in opposite directions from the robel pole, and two perpendicular to the t-ransect line in opposite directions from the pole. For each point, surveyors determined the percentage of the robel pole obscured, and calcuIated a mean value for all four measurements.
The average and greatest height of the herbaceous canopy was measured within the plot using graduated rods or folding rule-tapes
Figure 4. Grassland Transect Diagram
Alternate to other side of tsmsect.
Office Methods Transect and plot data were entered into spreadsheet s developed using Microsoft Excel. Data management and production of habitat suitability indices, habitat units, and tables were also accomplished using Excel.

Arcview Geographic Information Systems software, 1 :24,000 USGS topographic data, and digital ortho- quad images was used to develop cover type maps and acreages for cover types and crediting classes. Sorne subjective analysis of cover type conditions was based on a combination of professional judgment and best available published literature. Details involving subjective analysis is detailed in the "Results - Baseline Habitat Indices and Units" section below for each wildlife mitigation species.
Transect and plot data were used to identify plant associations and communities provided in the "Biological Environment" section of this report. Published data for plant association structural characteristics was used to identify habitat limiting factors for wildlife mitigation species and to develop objectives for improving habitat suitability in the futures analysis.
Results - Forest Structural Characteristics Forested surveys were initiated July 7, 1999, and completed August 17, 1999. Transects were completed on 12 fee-tracts purchased for mitigation purposes. A summary of the survey accomplishments is provided in Table 17. Timing of surveys in tree and shrub communities is less time-sensitive because perennial, woody, deciduous species have a much later senesance period than forbs and grasses. Survey effort is summarized below.
Table 17. Forest Survey Accomplishments.
Survey results for upland forest overstory and understory structural attributes are summarized by transect and habitat parameter and displayed in Tables 18 and 19.
Table 18. b l a n d Forest Cover Overstorv Structural Characteristics.
I Mean I 71.7 1 48.1 81.0 7.3 I

Table 19. b l a n d Forest Cover Understow Structural Characteristics.
Survey results for floodplain forests are summarized by transect in Table 20.
Mean I 45.8 I 58.9 1 .3 1 23.2 I 4.6 1 Downy Woodpecker
Baseline Habitat Indices and Units For crediting purposes, the Downy Woodpecker Model only applies to fee lands acquired for wildlife mitigation. On fee Iands acquired for mitigation purposes, there are approximately 1,254 acres of forested habitats. While BPA leases additional Bureau of Indian Affairs-administered grazing lands, the benefits of those leases (grazing rest and subsequent changes in herbaceous and shrub communities) do not extend to forested habitats and the Downy Woodpecker model, where habitat variables include tree basal area and snag density.
For the forest cover types, snag density data and corresponding Habitat Suitability Indices were separated far floodplain forests and upland forests. This was necessary to reflect the marked differences in Habitat Suitability Indices between the two sites. Habitat suitability indices and habitat units for the downy woodpecker ase presented in Table 2 1 .

Table 21. Downv Wood~ecker Habitat Suitabilitv Indices and Units.
[ Area (acres) 1 1221.0 I 33.0 1 V1: Basal Area (Sq Ft/Ac) V2: Number SnagsfAc (=>6" diameter)
I H.S.12 Lower of Vl and V2 1 1.0 1 -0s I I Relative Area 1 97.4% 1 2.6% 1
Habitat Limiting Factors The habitat limiting factor for the downy woodpecker on forested floodplains is the number of snags per acre for forested floodplains (O.J/ac), The optimum suitability is defined in the model as 5 snags per acre. On forested floodplains, the lowest life requisite value was 0.05, while on forested uplands the lowest value was 0.62, twelve times greater. The difference in values is attributed to differences in the intensity of past timber harvest, road construction, and woodcutting between the two sites. Upland forests had greater snag densities, and though some upland coniferous forest stands have experienced timber harvest in the past, their steep slopes likely discouraged the intensity of activities associated with timber harvest (road construction, snag rernaval, and subsequent woodcutting) when compared to the floodplains within the project area.
Weighted H.S.1 = Weighted H.S.I.= Number of Habitat Units (.98 * 1,254 ac)
A review of past timber harvest contracts provides an example of the impact of timber harvest on snag habitat in the study area. A 1959 timber sale contract between the CTUIR and a private purchaser for the "Squaw Creek Logging Unit" included more than 10,000 acres of tribd lands in the subbasin, and contained a provision requiring the following: "The purchaser shall fell all snags that are more than 14 inches in diameter at breast height and more than 16 feet in height on the area cut over unless relieved in writing by the Superintendent on specifically designated areas of tribal land at the request of the tribal governing body, or on specifically designated allotments at the request of allotment owners, when snags are desired for firewood by the Iocal enrolled Indian residents."
I
(1.0)(.974)+(.05)(.026) ,98
1222.7
A 1964 '‘Summary of Operations" for the Squaw Creek Logging Unit indicates approximately 12 million board feet of timber was scaled from the Unit between 1959 and 1963. The harvested volume consisted of ponderosa pine (50961, Douglas fir (37%), grand fir (5%), and western larch and engleman spruce (8%). The road network to support the removal of timber included an "improved dirt road" paralleling the entire length of the mainstem, and an unimproved road up the entire length of Bachelor Canyon Creek. Field surveys indicate togging skid trails and downhill tractor skidding extended up many side drainages from the road network to support timber removal. As road construction requires the removal of trees, and typically the subsequent removal of hazard trees (snags) within falling distance of the road, these activities combined to produce the low number of snag levels observed in floodplain habitats. Harvest of non-Indian fee lands also occurred in the watershed, though records are not readily available.
*Floodplain Forest
Snags are a dynamic resource, with old snags falling and living trees dying to hecome new snags. Snag- dependent wildlife therefore need a continual supply of snags over time to meet their life history requisites. To provide that continuum of snag habitat, future snags must be planned for by leaving green trees to eventually become snags in managed stands (Bull, et a1 1997). Because woodpeckers are territorial, snags need to be distributed across the landscape to attain the maximum density of cavity nesters. Retaining snags close to living trees provides cover for cavity users that are less likely to nest in open areas (Bull, et al, 1997).
Snag longevity, or the amount of time a snag stands, is an essential consideration in managing for snag habitat. Snag longevity is a function of many factors, including diameter and height, percentage of

heartwood, cause of death, soil type and moisture, forest type, surrounding stand conditions, and prevalence of windstorms (Bull et al, 1997). Most studies suggest that 50% of ponderosa pine snags killed by fire or beetles fall within 10 years (Bull et al, 1997).
Limited information is available an numbers of snags to retain for wildlife species in the interior Columbia Basin (Bull et a1 1997). Thomas and others (1979) prescribed a snag density of 3 snagsjacre greater than 6 inches in diameter for the downy woodpecker. However, those numbers were based on a hypothetical, untested model and did not include any snags far foraging. It is now known that the numbers presented by Thomas and others (1 979) is inadequate because of a lack of foraging strata and invalid assumptions used in the model (Bull et a1 1997). Three studies conducted in northeastern Oregon have shown that retaining foraging structure is essential, in addition to nest and roost trees (Bate 1995, Bull and Holhausen 1993, Dixon 1995).
Existing basal area values for both upland and floodplain forest are within the optimum 44-87 square feet per acre defined as optimum in the model. Considering the timber harvest that occurred in the watershed from 1959- 1964, it is understandable that current, primarily second-growth forests are within the optimum basal area range. However, as forest stands mature and basal area increases, suitability for the downy woodpecker (in terms of basal area) will decrease according to the model. Table 22 below provides a range of naturally sustainable, basal area values that can be expected for forested plant associations In the Iskuulpa Watershed.
Table 22. Gross Basal Area Values lSauare feet mrr acre) for Selected Forested Plant Associations.
Cool Moist Cool Moist
Moist Forest Warm Very
I I Moist
Warm Moist
I
Dry Forest Warm Dry
Grand firheadlilly Grand fir/Twinflower
Grand fir/Rocky mountain maple / Douglas firPacific Oceanspray Grand firmirchleaf spirea
Douglas fir/Cornmon Snowberry 26
(Johnson and Clausnitzer, 1992).
Desired Future Conditions Forested sites will possess an average of 5 snags per acre greater than 6" in diameter-at-breast-height within 40 years, and a corresponding snag habitat suitability leveI of 1.0. Current second-growth forest stands will continue to develop and stem exclusion will occur. Stern exclusion may occur on dry sites, where moisture is the limiting factor, or on moist sites, where light is the limiting factor. An expected consequence of stem exclusion is tree mortality and therefore snag recruitment. Other processes that may contribute to snag recruitment include root rot, endemic or epidemic populations of insects, floods, drought, and wildfire. These mortality agents may tmget different tree species and age classes; thus resulting in a mix of snag species and sizes across the landscape (Bull, et al. 1997). Events and decay processes that create dead tree habitat will maintain the snag resource through time.
Basal area on sites with dry forest vegetation potential will possess a minimum 60-80 square feet of basal area, and a with a carresponding suitability index af 1.0, while cool moist forest sites will possess a minimum of 100 - 1.20; square feet per acre, with a corresponding suitability index ranging from 0.4 - 0.8.

Table 23. Downv Wood~ecker Futures Analvsis Based on DFC's ftime=40 vears).
I Area (acres) 1 1221.0 1 33.0 1 Vl: Basal Area (Sq Ft/Ac) V2: Number SnagdAc ( = > f i n diameter) H.S.1 = Lower of VI and V2
I Relative Area 1 97.4% 1
1 Estimated Change in Habitat Units for t=4O 1 -213 1
If a suitability of 1.0 is attained for "V2: Number of snags/acre," then basal area becomes the determinant factor for habitat suitability. After basal area exceeds 130 square feet per acre, the suitability index for this variable maintains a value of 0.5. The higher basat area values are consistent with the site potential for these associations, are therefore regarded as naturally sustainable and appropriate for the desired future condition.
Estimated 10-Year Change in Habitat Units Number Habitat Units in 10 Years
Enhancement Strategies Management activities for maintaining and improving snag density on forested floodplains and therefore habitat suitability include: 1) discouraging woodcutting to prevent further losses of snag habitat; 2) maintaining green trees to allow for natural. snag recruitment; and 3) creating snag habitat [e.g. topping, fungal inoculations).
-53.3 1,169.4
Woodcutting generally occurs where roads and slopes provide motor vehicle access for the activity. The road paraflefing the mainstern of Iskuutpa Creek has led to woodcutting in years past. Limiting access on this raad, and rehabilitating unnecessary segments (road obliteration and floodplain reforestation) wiIl contribute to the pratection of existing snag habitat levels and improve future snag recruitment.
If stands are devoid of snags, the option is to alter or kill live trees. Three primary considerations in creating wildlife trees are: 1) the target wildlife species for which the structure is being created; 2) the tree characteristics (species, size, habitat locality most likely to be used by the target species); and 3) the method of altering or killing trees that is most likely to produces long-standing trees (Bull et a! 1997).
Bull and Partridge (1986) investigated six methods of killing ponderosa pine. They determined topping trees with either a chainsaw or explosives produced snags that stood the longest and received the greatest nest use by woodpeckers, In the study, fungal inoculation and beetles attracted by pheromones did not consistently kill the tree. Trees killed by girdling or silvicides fell over too quickly to provide wildlife 'enst trees.
Recent work by Parks and others (1996a, 1996b) documents a new method of inoculating live trees with decay fungi. Six years after inoculation of 60 living western larch, 14% contained woodpecker cavities near the inoculation site. These trees may stand for decades, with a pocket of decay that woodpeckers can utilize far nesting. These study results indicate that for western larch, inoculation produces desirable wildlife trees at a lesser cost than killing trees to create snags.
R e ~ n i n g existing snags and providing for snag recruitment are the most ecologically sound and economical approaches to providing wildlife trees (Bull et a1 1997). Considering that only 2.6% of the analyzed area was deficient in snag habitat levels, and the high unit costs of snag creation, protecting

existing snags allowing for natural snag recruitment is the prudent and preferred alternative for obtaining the desired fbture condition.
Black Capped Chickadee
Baseline Habitat Indices and Units During riparian habitat surveys, tree heights were unintentionally omitted from data collection. To address this data need, average tree height data collected from upland forested sites was also used for forested floodplain cover types. In the absence of actual measured data, this surrogate data is deemed acceptable because the same species (Douglas fir, ponderosa pine, and grand fir) occur on floodplains and upland sites. While recognizing that floodplain sites may be more productive (due to soil depth and available sail moisture) and therefore may pruduce taller trees, the habitat suitability index curve is probably not sensitive enough to recognize differences in average tree height between the two sites, particularly when the suitability indices are weighted based on acreage, and the floodplain represents 2.6% of the cover type acreage and the forest 97.4% of the acreage.
For crediting purposes, BPA receives Black-capped chickadee credits for those lands acquired far fish and wildlife mitigation. Mitigation credits for this species will not be received for allotted lands included in livestock grazing leases as the benefits of leasing these allotments and resting them from livestock use do not extend to the tree component of forested cover types.
Table 24, Black-Gamed Chickadee Habitat Suitabilitv hdices and Units. Evergreen
Area an*9atity Xardtm 1 ~ ~ ~ ~ ~ i F ~ ~ ~ # ~ d 1 , -JFtumt Wetfmd*
1 Number of Habitat Units (.96 * 1,254 ac) I 1203.8 *Floodplain forest.
Habitat Limiting Factors As for the downy woodpecker, the habitat limiting factor is the number of snags per acre on forested floodplains, where the habitat suitability index is 0.13. The explanation for the difference in snag density on the sites is explained in the downy woodpecker section above. The difference between snag habitat suitability index values for the downy woodpecker and black-capped chickadee is explained by differing life history requirements provided in their respective models. The downy woodpecker model requires 5 snags/acre for a habitat suitability of I .O while the black-capped chickadee model only requires 2 snags/acre for a habitat suitability of 1.0. Therefore, the snag habitat suitability value for the black-capped chickadee is . I 3, while for the downy woodpecker it was only -05
Forested sites that do not meet the objective will be moved toward the objective by: I ) protecting existing snags; 2) maintaining remnant mature and second-growth green tree stands to provide replacement snag habitat; and 3) reforestation of previously harvested floodplains to provide future sources for snag recruit~nent.
Considering that only 2.6% of the analyzed area was deficient in snag habitat levels, and the high unit costs of snag creation, allowing for natural snag recruitn~ent is prudent. When current, second-growth stands on floodplains enter the stern-exclusion stage of plant succession, mortality is expected to occur in the understory and provide suitable snag habitat for the black-capped chickadee. Additionally, stochastic

events, such as insect infestations, outbreaks of root rot, or wildfire, may occur and naturally increase snag density.
Acceptable ranges of tree canopy closure are displayed in Table 25. Comparing measured canopy closure values to values measured by Johson and Clausnitizer (1 992) for the same plant associations indicates that forested plant associations within Iskuulpa Watershed are within their expected range, and that increases in canopy closure for all forested associations in the Iskuulpa Watershed can be expected.
Grand fir/beadlill y Grand fir/Twinflower
rand firmocky mountain maple
cruglas firlPine Grass ouglas firhinebark ouglas fw/Csrnmon Snowberry
Desired Future Conditions Tree canopy closure on dry forest potential sites will possess a minimum of 35% tree canopy closure, with a corresponding habitat suitability index of 0.7, while moist forest potential sites will posses a rnini~num average canopy closure of 50% with a corresponding habitat suitability index of 1.0.
Forested floodplains will possess an average of 5 snags per acre greater than 6" in diameter-at-breast-height within 40 years, and a corresponding habitat suitability Ievel of 1 .O. Events and decay processes that create dead tree habitat will maintain the snag resource through time. Current second-growth forest stands will continue to develop, and as stem exclusion occurs, resulting in tree mortality and snag recruitment. Other processes that may contribute to snag recruitment include root rot, endemic or epidemic populations of insects, floods, drought, and wildfire. These mortality agents may target different tree species and age classes; thus resulting in a mix of snag species and sizes across the landscape (Bull, et al. 1997).
For crediting purposes, BPA will receive credit for habitat enhancement occurring on Trust lands, which provides an additional 461 acres of forest cover type.

Table 26. Downv Wad~ecker Futures Analvsis Based on DFCs (timed0 vears).
Area (acres) I 1,682.0 1 33.0 V 1 : Percent Tree Canopy Cover -96 ( 1 .O
Enhancement Strategies Strategies for improving habitat conditions for the black-capped chickadee are the same as those for the downy woodpecker.
V3: Number SnagsIAc (=>4-10 " diameter) Relative Area
Blue Grouse
Baseline Habitat Indices and Units The blue grouse was included as an evaluation species to represent the upland shrub cover type because it is a native species cammon to the project area, a vertical migrant that utilizes the elevational range of the watershed, and because the other evaluation species in this analysis do nat represent the upIand shrub cover type. Use of the blue grouse as an evaluation species therefore expands the scope of this analysis and provides habitat crediting for the upland shrub cover type, which would not have been otherwise credited.
1 .O 98.0%
Using the Blue Grouse HEP model requires evaluating forested and non-forested (shrub and grass) cover types and their spatial arrangement - the model user cannot evaluate one cover type done. However, for crediting purposes in this analysis, habitat credits for the blue grouse will only be applied to the upland shrub cover type. Therefore, the model was used to develop a suitability index for all cover types within the analysis area, that index value was then multiplied by the number of acres of upland shrub ta determine the number of habitat units for the upland shrub cover type.
1.0 2.0%
I V5: Average Height of Herbaceous Cano~v Cover I .75 1 [ V6: Diversity of Herbaceous Vegetation .93 1 I V7: Distance to Forest Cover Type I
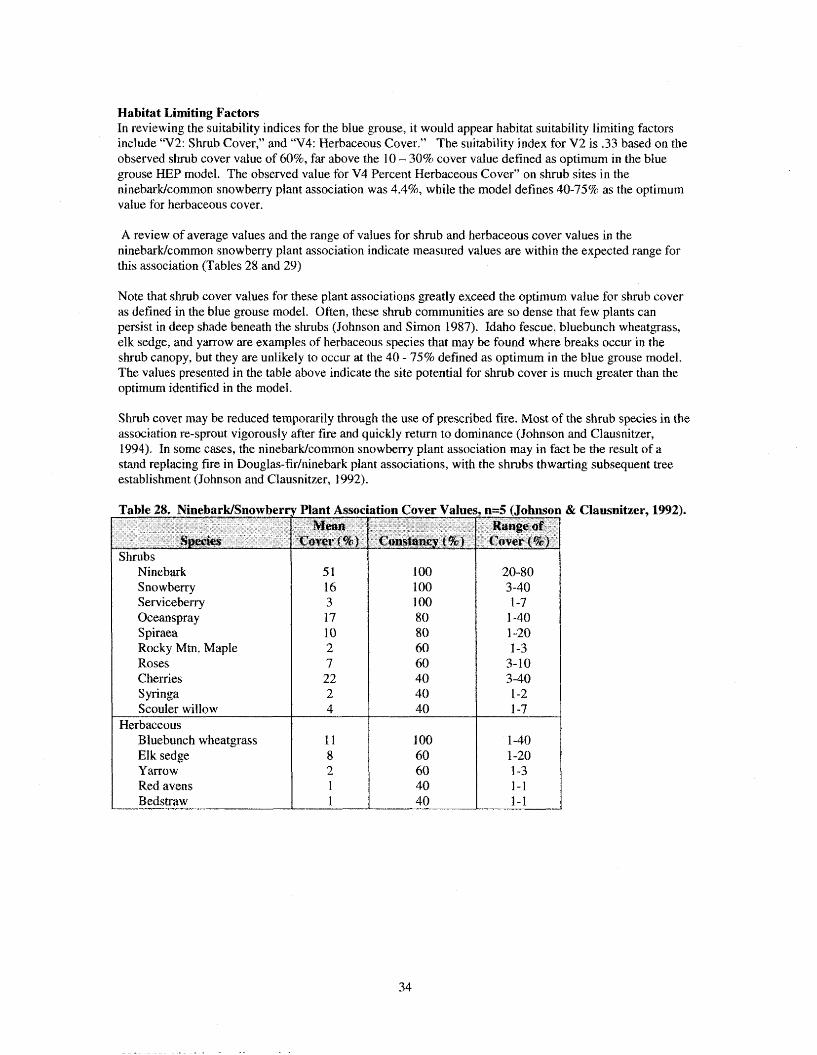
Habitat Limiting Factors In reviewing the suitability indices far the blue grouse, it would appear habitat suitability limiting factors include "V2: Shrub Cover," and "V4: Herbaceous Cover." The suitability index for V2 is .33 based on the observed shrub cover value of 60% far above the 10 - 30% cover value defined as optimum in the blue grouse HEP model. The observed value for V4 Percent Herbaceous Cover" on shrub sites in the ninebarklcommon snowberry plant association was 4.4%, while the model defines 40-75% as the optimum value for herbaceous cover.
A review of average values and the range of values for shrub and herbaceous cover values in the ninebak/comrnon snowberry plant association indicate measured values are within the expected range for this association (Tables 28 and 29)
Note that s h b cover values for these plant associations greatly exceed the optimum value for shrub cover as defined in the blue grouse model. Often, these shrub cammunities are so dense that few plants can persist in deep shade beneath the shrubs (Johnson and Simon 1987). Idaho fescue, bluebunch wheatgrass, elk sedge, and ymow are examples of herbaceous species that may be found where breaks occur in the shrub canopy, but they are unlikely to occur at the 40 - 75% defined as optimum in the blue grouse model. The values presented in the table above indicate the site potential for shrub cover is much greater than the optimum identified in the model.
Shrub cover may be reduced temporarily through the use of prescribed fire. Most of the shrub species in the association re-sprout vigorously after fire and quickly return to dominance (Johnson and Clausnitzer, 1994). In some cases, the ninebarWcornrnon snowberry plant association may in fact be the result of a stand replacing fire in Douglas-firhinebark plant associations, with the shrubs thwarting subsequent tree establishment (Johnson and Clausnitzer, 1992).
Shrubs Ninebark Snowberry Servicebeny Ocemspray Spiraea Rocky Mtn, Maple Roses Cherries Syringa Scouier willow
Herbaceous Bluebunch wheatgass Elk sedge Yarrow Red avens Bedstraw
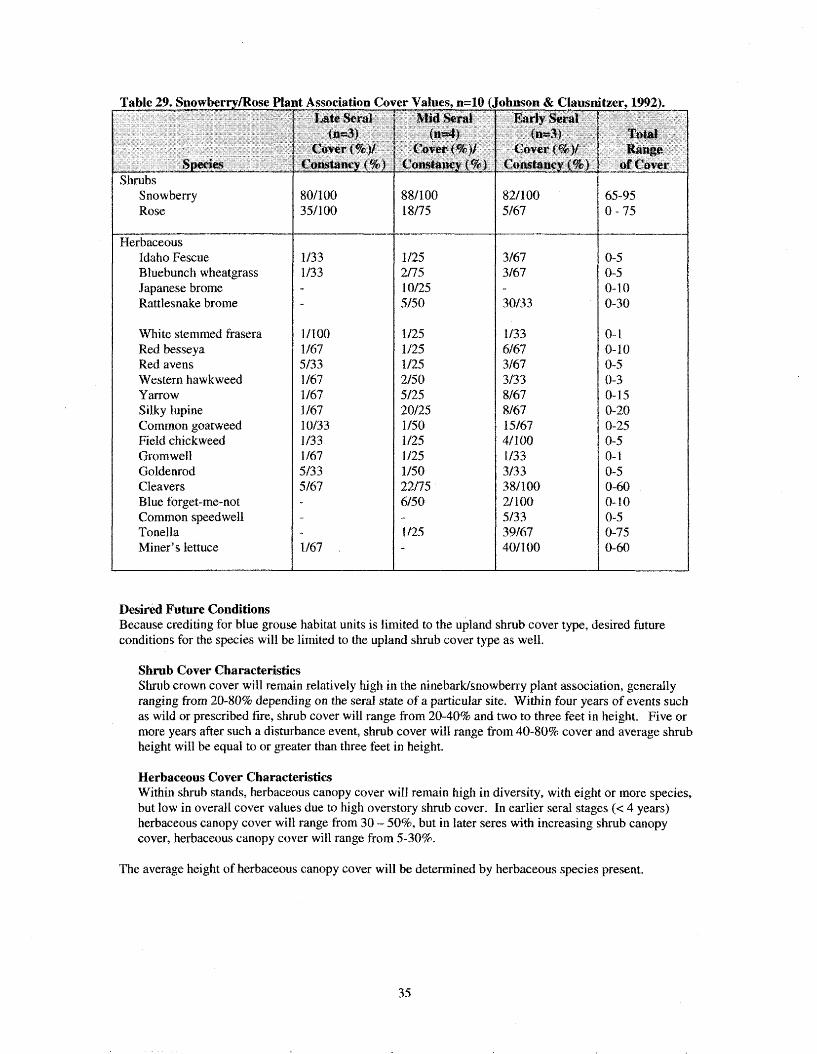
Shrubs Snow berry Rose
Herbaceous Idaho Fescue Bluebunch wheatgrass Japanese brome Rattlesnake brorne
White stemmed frasera Red besseya Red avens Western hawkweed Yarrow Silky lupine Cammon goatweed Field chickweed Cromwell Goldenrod Cleavers Blue forget-me-not Common speedwell Tonella Miner's lettuce
Desired Future Conditions Because crediting for blue grouse habitat units is limited to the upland shrub cover type, desired future conditions for the species will be limited to the upland shrub cover type as weH.
Shrub Cover Characteristics Shrub crown cover will remilin relatively high in the ninebarkknowberry plant association, generally ranging from 20-80% depending on the sera1 state of a particular site. Within four years of events such as wild or prescribed fire, shrub cover will range from 20-40% and two to three feet in height. Five or more years after such a disturbance event, shrub cover will range from 40-80% cover and average shrub height wit1 be equal to or greater than three feet in height.
Herbaceous Cover Characteristics Within shrub stands, herbaceous canopy cover will remain high in diversity, with eight or more species, but low in overall cover values due to high overstory shrub cover. In earlier sera1 stages (c 4 years) herbaceous canopy cover will range from 30 - 50%, but in later s e r a with increasing shrub canopy cover, herbaceous canopy cover will range from 530%.
The average height uf herbaceous canopy cover will be determined by herbaceous species present.

Number of Predicted Habitat Units I 407.6 407.6
V6: Diversity of Herbaceous Vegetation V7: Distance to Forest Cover Type Herbaceous Food/Cover Component Shrub FoadfGover Component Relative Area
.93 -88
.3
.6 8.1 %
Enhancement Strategies Existing habitat suitability values can be maintained by 1) continuing to rest range units from livestock grazing, 2) employing livestock grazing with rest-ratatinn periods that allow for shrub recovery from herbivory on a scheduled basis, and 3) use of prescribed fire. Periodic use of prescribed fire in shrublands would provide a mix of conditions in which some shrublands are high in shrub cover and low in herbaceous cover and areas that are lower in shrub cover and higher in herbaceous cover. It should be recognized that the benefit of prescribed fire wauld be transient, as shrubs in these associations return to dominance rapidly and again limit the cover of herbaceous species.
Change in Habitat Units for t=10 10-Year Change in Habitat Units
Number Habitat Units in 10 Years
Currently, land ownership patterns, consisting of tribal trust lands, tribal member allotments, md fee lands, and the lack of a Reservation prescribed fire policy and program, makes the application of prescribed fire for habitat enhancement difficult. Until the necessary policies and programs are developed, it is not anticipated that shrublands will be treated with prescribed fire, Therefore, no changes in habitat suitability are predicted, though stochastic events such as wildfire could occur to return shrublands to early sera1 states.
0 0
407.6
FloadplaidRiparian Structural Characteristics Riparian habitat surveys were initiated September 2, 1998, and completed by September 16, 1998. Eight transects, each 1,000 feet long, were completed on fee parcels acquired for mitigation purposes. Additionally, 32 on-tenth acre plots were completed to characterize the shrub and tree layers of the floodplain, Survey results for riparian structural characteristics are sum~narized by transect and habitat parameter and displayed below.
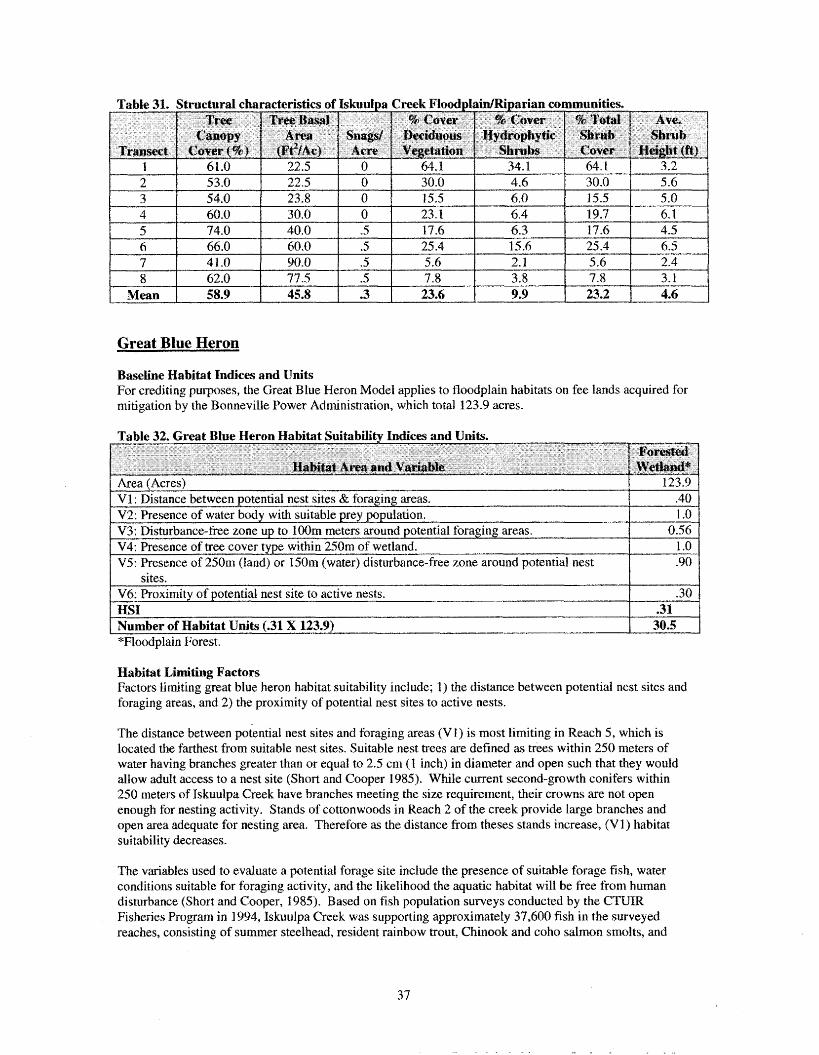
Great Blue Heron
Baseline Habitat Indices and Units For crediting purposes, the Great Blue Heron Model applies to floodplain habitats on fee lands acquired for mitigation by the Bonnevilie Power Administration, which total 123.9 acres.
Table 32. Great Blue Heron Habitat Suitabilitv Indices and Units.
sites. I V6: Proximity of potentid nest site to active nests. .30
V4: Presence of tree cover type within 250m of wetland. V5: Presence of 250111 (Land) or 150m (water) disturbance-free zone around potential nest
1 .O -90
Habitat Limiting Factors Factors limiting great blue heron habitat suitability include; 1) the distance between potential nest sites and foraging areas, and 2) the proximity of potential nest sites to active nests.
HSI Number of Habitat Units (.31 X 123.9)
The distance between potential nest sites and foraging areas (VI) is most limiting in Reach 5, which is located the farthest from suitable nest sites. Suitable nest trees are defined as trees within 250 meters of water having branches greater than or equal to 2.5 cm ( 1 inch) in diameter and open such that they would allow adult access to a nest site (Short and Cooper 1 985). While current second-growth conifers within 250 meters of Iskuulpa Creek have branches meeting the size requirement, their crowns are not open enough for nesting activity. Stands of cottonwoods in Reach 2 of the creek provide large branches and open area adequate for nesting area. Therefore as the distance from theses stands increase, (Vl ) habitat suitability decreases.
.31 30.5
The variables used to evaluate a potential forage site include the presence of suitable forage fish, water conditions suitable for foraging activity, and the likelihood the aquatic habitat will be free from human disturbance (Short and Cooper, 1985). Based on fish population surveys conducted by the CTUR Fisheries Program in 1994, Iskuulpa Creek was supporting approximately 37,600 fish in the surveyed reaches, consisting of summer steelhead, resident rainbow trout, Chinmk and coho salmon srndts, and
*Floodplain Forest.

sculpin. Water conditions throughout Reaches 1 - 4 are most stable and suitable for feeding habitat, and Reaches 3 - 5 have limited vehicle traffic due to seasonal road closures and primitive road conditions.
Reach 5 of mainstem Iskuulpa provides the lowest suitability for feeding habitat of all five surveyed reaches, The foraging behavior of the great blue heron is successful only in shallow (up to -5 m deep), clear water with a firm substrate and a huntable population of small fish (<= 25 cm in length) (Short and Cooper, 1985). Stream flows are subsurface in much of Reach 5 during base flow periods, reducing the amount of potential feeding habitat. Approximately 35.5% of the reach was classified as "dry units" in the fish habitat survey, pool frequency (pools per mile) is the lowest of all five reaches at 32.2, and percent area of pools was the lowest of all five reaches at 13.9 percent. Table X displays data comparing pool conditions throughout five surveyed reaches of mainstem Iskuulpa Creek.
Table 33. ~skuul~a Creek - Pools Der mile and drv channel area.
1 Average 1 45.6 1 26.4 1 n.a. 1
At project acquisition, variable "V3: Disturbance-free zone up to l O m meters around potential foraging areas," was a limiting factor in Reaches 1 and 2 of the study area. Reaches 1 and 2 contain permanent residences accessed by a maintained, county road. Reaches 3 - 5 contain an unimproved road infrequently accessed by four-wheel and off-road vehicles. Short and Cooper (1 985) characterized a "disturbance-free" zone as potential foraging areas that are generally free from human disturbances during the four hours following sunrise and preceding sunset. Habitat suitability is scored as "1.0" if there is usually no human disturbance near the potential foraging zone during the four hours following sunrise or preceding sunset or the foraging zone is generally about 100 meters from human activities and habitation or about 50 meters from roads with occasional, slow-moving traffic. The suitability is scored as "0.0" if the above conditions are not met. Because of the n m o w width of the Iskuulpa Creek floodplain, maintained and unimproved roads are within usually within SO meters of the potential great blue heron feeding habitat.
To determine the suitability index for V3, potential foraging habitat in Iskuulpa Creek can be divided into areas that scored a "1.0" for disturbance-free areas, and "0.0" for areas not meeting the condition. Approximately 69.5 (56%) acres of floodplains in Reaches 3 - 5 would provide suitable foraging habitat free from disturbance or "occasionaI slow-moving traffic," and 54.4 acres (44% j in Reaches 1 and 2 would not meet requirements for disturbance-free zones due to the presence of a county road and regular traffic to permanent residences. The weighted average for the floodplain habitats is therefore expressed as the foklowing:
Another limiting factor, "V6: Proximity of potential nest site to active nests" is based on a straight line- distance of 15 kilometers fro~n a known rookery on the mainstem Umatilla River. Cottonwood galleries exist along the Umatilla River, including its confluence with IskuuIpa Creek, and provide suitable habitat for rookeries. These stands may be used in the future, though there is no predictive ability to estimate when such use might occur, what the distance to the rookery might be, and what the subsequent change in suitability for V6 might be.
Desired Future Conditions In 40 years, great blue heron feeding habitat will be increased in Reach 5 of Iskuulpa Creek by reducing the amount of dry channel area from 35.5 percent to 20 percent. Ponderosa pine associations located within

250 meters of the stream will possess crowns suitable for heron nesting habitat. Disturbance in potential foraging areas will be reduced in Reaches 3 through 5 of Iskuulpa Creek through access and travel management so that mator vehicle disturbance does not reduce the suitability of potential feeding habitat.
I s e n c e of 250111 (land) or 150m (water) disturbance-free zone around potential nest I -90 1
Enhancement Strategies The amount of potential great blue heron feeding habitat in the project area wili be increased in Reach 5 of Iskuulpa Creek by increasing pool frequency and reducing the amount of dry channel in the reach. Floodplain enhancements will be achieved through large woody material additions and reduction of compacted areas (roadbeds) in the floodplain (sub-soiling, obliteration).
Floodplain restoration and enhancement will facilitate a reduction in stream width:depth ratios, improved access of the channel to the floodplain, and thus increased potential for seasonal flooding, subsequent water storage, increased groundwater elevation, and ultimately increased stream baseflows. By increasing baseflows, the amount of potential heron feeding habitat: would increase, and the distance between potential nesting and feeding habitat would be reduced.
Disturbance to suitable habitat will be minimized through access and travel management and road obliterations. Seasonal road closures will limit access beyond the first three miles of county road. The current road closure period is March 3 1 to July 3 1 of each year, though the closure has been extended during periods of extreme fire danger. Road segments extending beyond (upstream) of the end of the county road will be obliterated where feasible to reduce trespass, and will be returned to production of appropriate plant associations.
The distance to the nearest active rookery is not a variable that can be readily addressed through management actions other than protecting existing, potential nest habitat, and promoting hardwood and coniferous forest establishment and growth (tee planting, thinning and protection) where it is currently lacking. .
Yellow Warbler
Basdine Habitat Indices and Units The Yellow Warbler HEP model has three variables; I ) percent deciduous crown cover, 2) average height of deciduous shrub canopy, and 3) percent of deciduous shrub canopy comprised of hydrophytic shrubs. Hydrophytic vegetation is defined as follows:
"Hydrophytic Vegetation - The sum total of macrophytic plant life that occurs in areas where the frequency and duration of inundation or soil saturation produce germanently or periodically

saturated soils of sufficient duration to exert a controlling influence on the plant species present (Corps of Engineers Wetland Deli neation Manual, 1987)."
'Wydrophyte - Any macrophyte that grows in water or on a s~kbstrate that is at least periodically deficieptt in oxygen as a result of excessive water content- "
Determining hydrophytic vegetation requires identifying plant species that occur in wetlands at minimum levels of probability, and detern~ining the dominance of those species for each vegetative stratum fi.e. herbaceous, shrub, or tree). The Corps of Engineers Wetland Delineation Manual (1987) was referenced for determination of hydrophytic vegetation. The Manual provides the following criteria:
More than 50% of the dominant plant species from all strata (herbaceous, shrub, tree) are obligate wetland plants (OBL), facultative wetland plants (FACW), or facultative plants (FAC).
OBL - Obligate wetland plants. Plants that occur almost always (estimated probability > 99%) in wetlands under natural conditions, but which may also occur rarely (estimated probability < 1 % in non-wetlands).
FACW - Facultative wetland plants. Plants that occur usually (67% < probability <= 99%) in wetlands, but also wcur f 1 % < probability <= 33%) in non-wetlands.
FAC - Facultative plants. Plants with a similar likelihood (33% probability 67%) of occurring in both wetlands and non-wetlands.
For each stratum in the plant community, dominant species are the most abundant plant species (when ranked in descending order of abundance and cumulatively totaled) that immediately exceed 50% of the total dominance measure for the stratum, plus any additional species comprising 20% or more of the total dominance measure for the stratum.
FAC n.aA2 n.a. FAC n.a. No ~ndicato? FAGU-, FAC/OBL FAC- n.a.
Crdo Hodi Pipo PoXX Psme
Rog y Rudi2 Salix spp S anic5
' Reed, 1998. 2 Not on National List - does not occur in wetlands in any region. 3 Insufficient information available to determine indicator status.
Doulglas hawthome Oceanspray Ponderosa pine Cotton wood Douglas-fir Wo~d 's rose Himalayan blackberry Willow Elderberry
Therefore, based an the habitat survey results for Tskuulpa Creek riparian habitats, alder, Douglas hawthome and willow species qualify as hydrophytic shrubs when and where they dominate the shrub strata. Dominance is based on a measure of percent cover obtained thraugh line intercept trarasects.
S yal Common snowberry
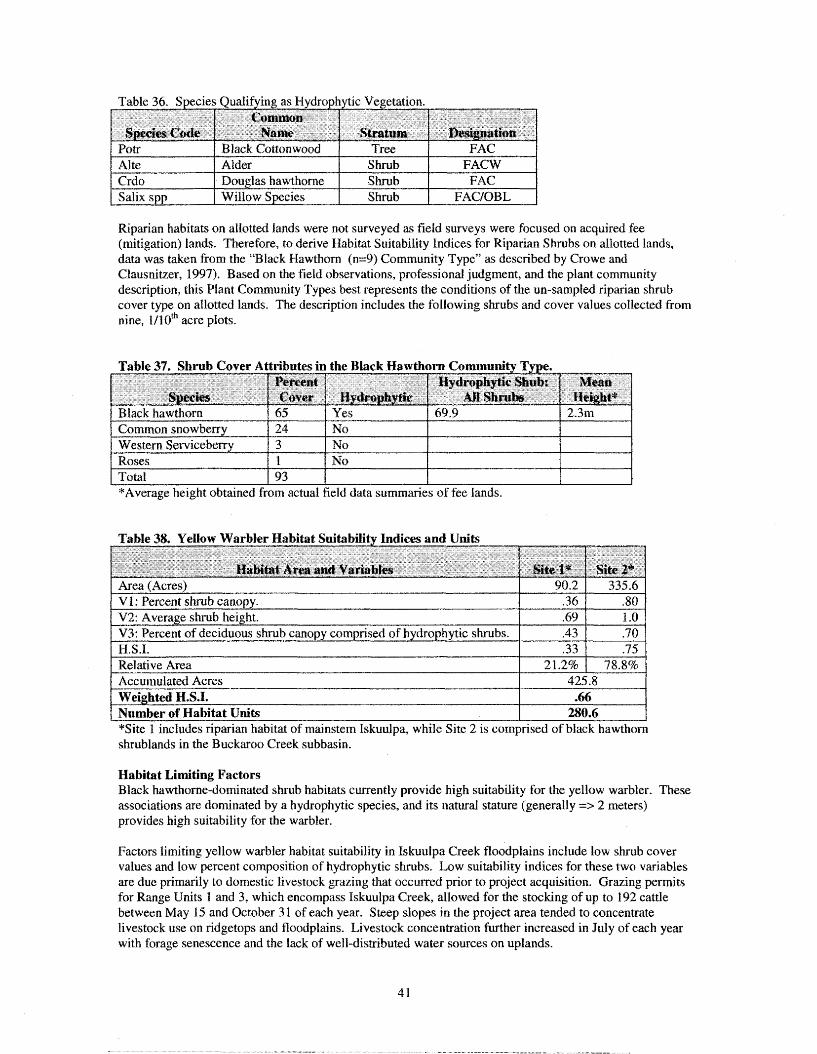
Table 36. Species Qualifying as Hydrophytic V~etat ion. ~:ommon
1 Black Cottonwood I Tree I FAC I
Riparian habitats on allotted Iands were not surveyed as field surveys were focused on acquired fee (mitigation) lands. Therefore, to derive Habitat Suitability Indices for Riparian Shrubs on allotted lands, data was taken fiom the "Black Hawthorn (n=9) Community Type" as described by Crowe and Clausnitzer, 1997). Based on the field observations, professional judgment, and the plant community description, this Pfant Cornnullity Types best represents the conditions of the un-sampled riparian shrub cover type on allotted lands. The description includes the following shrubs and cover values collected from nine, 1/10" acre plots.
1 Black hawthorn 1 65 I Yes I 69.9 I
*Average height obtained from actual field data summaries of fee Iands.
1 Weighted H.S.I* I .66 I
Relative Area Accumulated Acres
1 Number of Habitat Units I 280.6 I
21.2% '0 78.8% 425.8
*Site 1 includes riparian habitat of mainstem Iskuulpa, while Site 2 is comprised of black hawthorn shrublands in the Buckaroo Greek subbasin.
Habitat Limiting Factors Black hawthorne-dominated shrub habitats currently provide high suitability for the yellow warbler. These associations are dominated by a hydrophytic species, and its natural stature (generally => 2 meters) provides high suitability for the warbler.
Factors limiting yellow warbler habitat suitability in Tskuulpa Creek floodplains include !ow shrub cover values and low percent composition of hydrophytic shrubs. Low suitability indices for these two variables are due primarily to domestic livestock grazing that occulred prior to project acquisition. Grazing permits for Range Units 1 and 3, which encompass Iskuulpa Creek, aIlowed for the stocking of up to 192 cattle between May IS and October 3 1 of each year. Steep slopes In the project area tended to concentrate livestock use on ridgetops and floodplains. Livestock concentration further increased in July of each year with forage senescence and the lack of welldistributed water sources on uplands.

As cattle graze riparian areas, changes in herbaceous plant stubble heights and greenness become critical and cattle forage preference shift from grasses to shrubs. Preference begins to change as stubble heights are lowered to 3 inches, because vegetation is too short to be pulled in by the cow's tongue (Hall and Bryant, 1995). Foraging becomes less efficient, and as a result cattle shift to more readily eaten vegetation. If herbaceous vegetation dries, cattle preference for shrubs may even occur when grass stubble heights are greater than 3 inches (Hall and Bryant, 1995). This shift in foraging preference reduces total and hydrophytic shrub cover.
Desired Future Conditions Black-hawthorne shrub colnrnunities will possess miniinurn deciduous shrub cover values of 50%, with 70% of the shrub layer composed of hydrophytic species. Shrub heights will average 6 feet or more.
Floodplains in Reaches 1 and 2 of Iskuulpa Creek will possess average deciduous shrub cover values of 60% with 70% of the shrubs composed of hydrophytic species. Piant associations in this reach include the bIack cottonwood/snowberry and ponderosa pinehnowberry associations, which include hydrophytes such as willow and black hawthorne. Average Shrub heights will range from 4 to 6 feet in these reaches.
Floodplains in Reaches 3 - 5 of lskuulpa Creek will possess 50% average deciduous shrub cover, with hydrophytic shrubs comprising up to 50% of the total shrub cover. Plant asso,ciations in these reaches, including the Douglas &/snowberry, Douglas fidrocky mountain maple, and grand fir/rocky mountain maple associations, tend to be lower in hydrophytic species. Average shrub heights will range from 4 - 6 feet in these reaches.
Table 39. Yellow Warbler Futures Andvsis Based on DFC's (t=10). -- u
fiabitat A m and Variables I Area (Acres) 90.2 1 335.6 1 [ V 1 : Percent shrub canopy. 1.0) 301
V2: Average shrub height. V3: Percent of deciduous shrub canopy comprised of hydryhytic shrubs. Habitat Suitability Index Relative Area Accumulnted Acres
-80 .70 .63
21.2% 1 78 .82 425.8
Weighted M.S.I. ((.212*.63)+(.788*.75)) = Estimated Habitat Units in t=10 years Existing Habitat Units Change in Habitat Units
Enhancement Strategies Increases in deciduous and hydrophytic shrub cover will be achieved through acquisition of grazing leases and rest (livestock exclusion), large wood additions to floodplains, and obliterating floodplain roadbeds and planting deciduous and hydrophytic shrubs. Rest of the grazing units will reduce browse pressure and allow shrub canopy cover to increase. Additions of large woody debris are expected to increase sediment storage within the floodplain, increase channel sinuosity, and associated water storage area. This in turn will facilitate the establishment and development of riparian vegetation, including deciduous and hydrophytic shrubs.
1 .O -70 .75
-72 308.5 280.6 +27.9
10-Year Change in Habitat Units Number Habitat Units in 10 Years
28 308.5
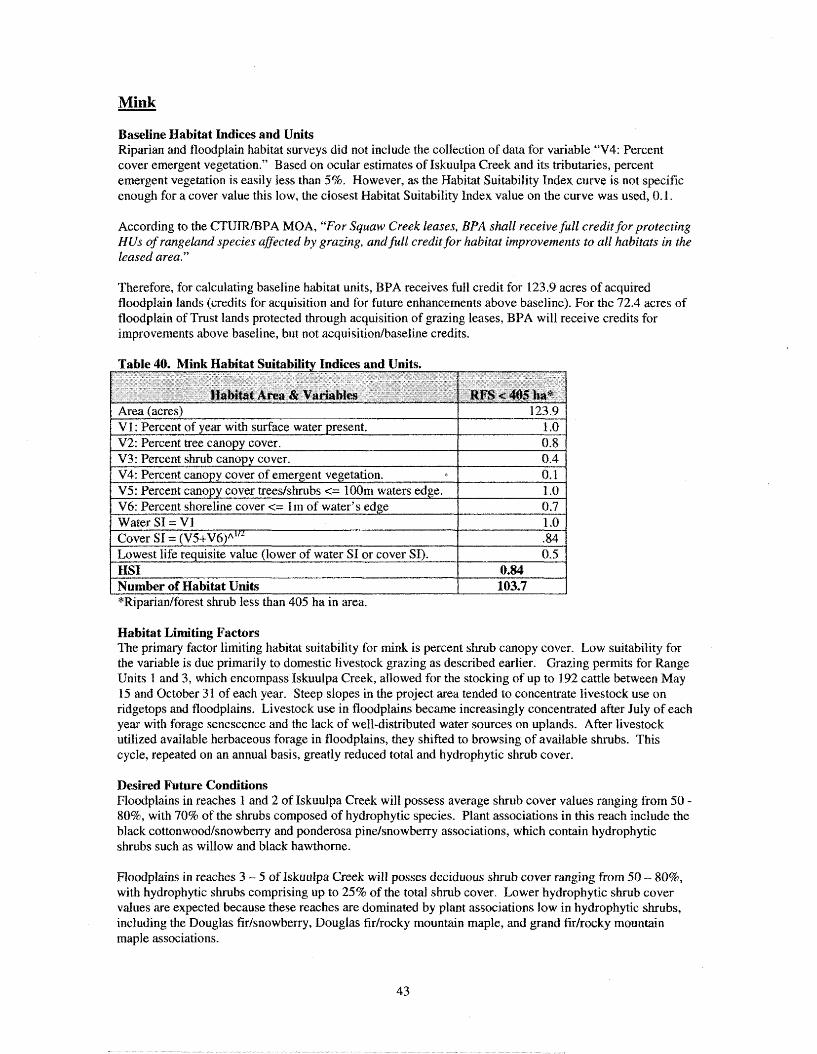
Baseline Habitat Indices and Units Riparian and floodplain habitat surveys did not include the collection of data for variable '374: Percent cover emergent vegetation." Based on ocular estimates of Eskuulpa Creek and its tributaries, percent emergent vegetation is easily less than 5%. However, as the Habitat Suitability Index curve is not specific enough for a cover value this low, the closest Habitat Suitability Index value on the curve was used, 0.1.
According to the CTUIWBPA MOA, "For Squaw Creek teases, BPA shall receivefull creditforprotecting HUs of rangeland species affected by grazing, and full credit for habitat improvements to all habitats in the lensed area."
Therefore, for calculating baseline habitat units, BPA receives full credit for 123.9 acres of acquired floodplain lands (credits for acquisition and for future enhancements above baseline). For the 72.4 acres of floodplain of Trust lands protected through acquisition of grazing leases, BPA will receive credits for improvements above baseline, but not acquisitionfbaseline credits.
Table 40. Mink Habitat Suitabilitv Indices and Units. Y
Hal,itat Ares & Variables - 1 Area (acres) I 123.9 1 1 V1: Percent of year with surface water present. 1.0 ] / V2: Percent tree canopy cover. 0.8 ]
Habitat Limiting Factors The primary factor limiting habitat suitability for mink is percent shrub canopy cover. Low suitability for the variable is due primarily to domestic livestock grazing as described earlier. Grazing permits for Range Units 1 and 3, which encompass Xskuulpa Creek, allowed for the stocking of up to I92 cattle between May 15 and October 3 I of each year. Steep slopes in the project area tended to concentrate livestock use on ridgetops and floodplains. Livestock use in floodplains became increasingly concentrated after July of each year with forage senescence and the lack of well-distributed water sources on uplands. After livestock utilized available herbaceous forage in floodplains, they shifted to browsing of available shrubs. This cycle, repeated on an annual basis, greatly reduced total and hydrophytic shrub cover.
V3: Percent shrub canopy cover. V4: Percent canopy cover of emergent vegetation. r3
V5: Percent canopy cover trees/shrubs <= 100111 waters edge. V6: Percent shoreline cover <= 1 In of water's edge Water SI = V1 Cover ST = (v5+v6)"ln Lowest life requisite value (lower of water SI or cover SX).
Desired Future Conditions Floodplains in reaches 1 and 2 of Xskuulpa Creek will possess average shrub cover values ranging from 50 - 80%, with 70% of the shrubs composed of hydrophytic species. Plant associations in this reach include the black cott.tonwood/snowberry and ponderosa pine/snowbeny associations, which contain hydrophytic shrubs such as willow and black hawthorne.
0.4 0.2 1 .O 0.7 1.0 -84 0.5
Floodplains in reaches 3 - 5 of lskuulpa Creek will posses deciduous shrub cover ranging from 50 - 80%, with hydrophytic shrubs comprising up to 25% of the total shrub cover. Lower hydrophytic shrub cover vdues are expected because these reaches are dominated by plant associations low in hydrophytic shrubs, including the Douglas fir/snr>wberry, Douglas firlrocky mountain maple, and grand fir/rocky mountain maple associations.
HSI Number of Habitat Units
0.84 1 103.7 -
*Riparian/forest shrub less than 405 ha in area.

Total shoreline cover, including vegetation, large woody debris, herbaceous vegetation, and rock, will average 80 percent.
I H.S.1 = Lowest life reauisite value (lower of water S1 or cover SI). I .89 1
Area (acres)
I Estimated Number of Habitat Units at t=10 vears. I 110.8 I
123.9
I Existing Habitat Units 1 103.7 1 Change in Habitat Units for time=lO years +7.1
Annual Change in Habitat Units (7.1 /lo) .71 lOIYear Change in Habitat Units -7 1
V1: Percent of year with surface water present.
- t Number Habitat Units in 10 Years I
110.8
1.0
Because the existing suitability values for "V5:Percent canopy cover of trees/shrubs" and "V6:percent shoreline cover within 1 meter of the water's edge" are optimum or near optimum, the model does not respond to respond to increases in shrub and tree cover identified in the desired future conditions.
Enhancement Strategies Increases in deciduous and hydrophytic shrub cover wilI be achieved through acquisition of grazing leases and rest (livestock exclusion), large wood additions to floodplains, and obliterating floodplain roadbeds and planting deciduous and hydrophytic shrubs. Rest of the grazing units will reduce browse pressure and allow shrub canopy cover to increase. Additions of large woody debris are expected to increase sediment storage within the floodplain, increase channel sinuosity, and associated water storage area. This in turn will facilitate the establishment and development of riparian vegetation, including deciduous and hydrophytic s h b s .
V2: Percent tree canopy cover. V3: Percent shrub canopy cover. V4: Percent canopy cover of emergent vegetation. V5: Percent canopy cover treeslshrubs <= 1 OOm waters edge. P
0.8 0.4 0.1 1 .O
V6: Percent shoreline cover <= lrn of water's edge Water SI = V 1 Cover SI = ( ~ 5 + ~ 6 ) " " ~
0.8 1 -0 .89

Grassland Habitat Structural Characteristics Grassland surveys were initiated June 2, 1998, reinitiated on June 4, 1999, and completed June 15, 19%. Surveys in grassland cover types were conducted prior to senesance of forbs and grasses. Seventeen transects covering 27,200 linear feet were completed. Additionally, 272 square-meter plots and 1 10 one- tenth acres plots were completed.
Western Meadowlark Credits for the western meadowlark apply to all grassland cover types of acquired lands and for all allotted lands incf uded within Bureau of Indian Affairs-administered grazing leases.
Area (acres) V 1 : Percent cover herbaceous plants. V2: Percent canopy cover grass. V3: Average height herbaceous .canopy cover. V4: Distance to perch.
Number of Habitat Units 1 1,318.9 1
1 0,99 1 .t6
0.09 0.4 I .O
V5: Percent shrub canopy cover. BSI = (VI xV2xV3xV4)1/4xV5
Habitat Limiting Factors Primary habitat suitability limiting factors include V1- percent cover of herbaceous plants, and V2- percent cover of herbaceous grasses, with the average height of herbaceous cover a secondary limiting factor.
1.0 0.12
In lskuulpa habitat evaluation transects and ecological reconnaissance plots, observed plant associations included the Bluebunch wheatgrass/SandbergYs bluegrass association, recorded in 15 or 17 grasdand transects (88%) and 13 of 14 on-tenth acre plots (93%), and the Idaho-fescue/Blue-bunch wheatgrass association was recorded in 2 of 17 transects (12%) and 1 of 14 tenth-acre plots (7%). However, annual

vegetation (Ventenata, Medusahead, Bromes) dominated the landscape, with bluebunch wheatgrass and Idaho fescue averaging only 4% cover.
Current grassland conditions are likely a result of the combined effects of severe over-grazing at the turn of the century, consequent invasions by annual, exotic vegetation, and more contemporary, season-long grazing practices that have inadvertently maintained perennial grasslands in their annual grass-dominated state.
A 1935 Soil Conservation Service repot prepared by W.B. Nelson describes management practices at that time and consequent changes in vegetative conditions of the Iskuulpa (Squaw Creek) watershed:
"Vegetative Stage: Improper range practices over a lortg period of years UFZ the Indian Reservation have resulted in a general regression of the vegetation of the area. Bedgrounds, driveways, trails to and from water holes, and many of the more accessible slopes and ridge tops have been divested of perennial grasses, and, in some cases, completely denuded of vegetation.
Weedy annuals dominate over a great majority ofthe area, and only on the more inaccessible slopes are found any of the once-dominant burrrhgrasses. This type of range has been grossly mistreated by constant, long contin~led overgrazing.
In general the degree of utilization is largely dependent on the accessibility, and management practices, which, as a rule, have been extremely competitive, and without arty serrtblanee ofproper range mnagernent
History of Range Use: The Squaw Creek area has been subjected to grazing by Indian horses and wild game for m n y years before the advent of white settlers in 1860 or thereabouts. Numerous delupitated cabins on the area at present bespeak of its early settlement. n e s e settlers surged into the c~zdfle bu~iness, grazing large herds throughout the urea of which the Squaw Creek country is part; and gradually choked the Indians from their domin. However, the Government stepped in to set a side a large portion of the Squaw Creek area, and adjacent territory, as the Urnatitla Irtdian Reservation, and thus protect the rapidly diminishiplg range resources of the Indians. Since that time, the area has been grazed by increased numbers of sheep. The cattle now on the area are largely I.D. cattle, given to the Indians by the federal governmerrt, in return for which each Indian, by the terns of the grunt, must repay a calffor each breeding cow within a stipulated length of time. Cattle are marketed at all ages, and at varyirzg weights according to age. Horses are allowed to run loose; the quality of this stock is so low that there is now market d~mand, except for canning or some such special purpose, and only a few are sold. The sheep on the area are the property of the permittees, und are sold as fall bmbs at the age of six to eight months and an average weight of from 70 to 80 pounds.
Grasslands: Over most ofthe grassland type, the once dominant bunchgrasses h v e been supplanted by communities of invaders, beca~se of overgrazing, trampling, erosion, and other contributing factors. Important species now found on the area include Bro~nus tectorum, Festuca pacifica, Poa secunda, Grindelia spg., Madia g lmerata, Wyethia amplexicnulis, Cogswellia spp., with sub-dominants of Agropyron inerme, Festuca Idahoensis, Brornus mollis, l3romus brizaeforvnis, Epibolium spp., Achillea lanulosa, Balsamorhiza sagittata, Erigoniurn spp., Arnsinokiu internedirt, and other species of weedy forage. In localized inaccessible areas, the vegetation consists largely of Agropyron- Festuca-Poa association.
ZV. Range and Pasture Management: Past - Since the beginning of grazing on the area, the supervision and management practices have been too loosel~j organized for arty benefits to accrue from such practices. From 4,000 to 8,000 head of sheep, together with 600 - 1,400 head of horses, and 800 to 1,000 head of cattle have greatly overgrazed the forage of the area. This heavy use h s been given range having a very low percentage of ground cover. It has given rise lo erosion of the thin rocky soil, accelerated run-ofJI reduction of the carrying capacity, and vegetative regression. Water development has been neglected It is a common practice to bed bands sheep in one spat near a spring for three or four weeks at a time, resulting in
varying degrees of denudation of these bedground areas. No drift fences hive been built, and no attempts made to secure the optimum utilization by proper salting practices. All in all, it appears that little consideration has been given to the upkeep of range for future use.
Present - At present the numbers of stock have been somewhat decreased, principally because of a lack offorage rather than any considera#iorz cffiture benefits. The land on the Indian reservation is leased to one sheep company, who are supposedly bonded to take care ofthe range. Aside from this stipulatbn, no limitailuns as to the number or season of ~ s e are set by the Indian service. The practice of early spring grazing and over-stocking has destroyed much ofthe original forage rover. H e a ~ f a U grazing has reduced the amount crf vegetation leJCt on the area to hold the snow and ret~rd run-ofl- In addition, the Indian allottees have run many horses on the range. None ofthe area isfenced, so all of the stock except herded sheep roam freely over the raege.
The Forest Service regulations have halted the regression of the vegetation within the boundaries of the Umatilka National Forest. However, evidences of excessive trailing and bedding f i r too long a time in one place are found in the forest. Twelve hundred head of sheep normally gmze this area.
The privately owned land south ojtha Reservation is generally fairly well caredfor. A few of the springs on this area have been partially developed, some drip fenc~s constructed, a~td a f m salt grounds esta blished to aford better utilization of the area. The area is an example of the improvement possible even under a loose grazing plan. Small herds of cattle and flocks of sheep, and some pasture stock are rzuw using the area. The late date at which the srzow leaves the area, and the earltness of snow in the full have protected this range to ~ 7 . large degree. Eighty-fie cattle and 400 to 600 sheep in small Jocks are grazed on this portion of the area. Stock is put on the area too early in the spring, and this practice hm accelerated erosion of the ridge tops and higher slopes."
Recent domestic livestock grazing practices have included stocking up to 192 head of cattle Erom May 15 to October 31 of each calendar year. The potential consequence of implementing such a grazing schedule on an annual, indefinite basis is the continued suppression of perennial grasses. Figure 5 illustrates this process with the grazing season (light blue zone) imposed over the perennial bunchgrass life cycle (yellow line). Note that the life cycle is impacted through all stages where reserves are developed. Season-long grazing can prevent seedhead elangation and seed set from occurring in bunchgrasses, and Iirnit the development of reserves (proteins, carbohydrates, and fats) needed for leaf growth, seed development, and root system maintenance. If this occurs on an annual basis, the plant enters and emerges from dormancy with decreasing reserves, which can then result in a reduction of root masses, seed production, and ptant vigor. Combined, these effects can reduce the ability of perennial grass stands to maintain themselves and compete with annual exotic grasses.

Figure 5. Season-Long Grazing and the Perennial Grass Life-Cycle (NRCS - Or, 1999).
Jan Fob Mar April b y June July Aug Sepk Oct DC3C
Calendar Year
As stated previously, annual vegetation (Ventenata, Medusahead, Bromes) dominates the grasslands of Iskuulpa Creek. The B luebunc h wheatgrasdsandberg ' s bluegrass and Idaho fescue/Bluebunch w heatgrass associations that occur in the area average only 4% bunchgrass cover. These perennial bunchgrass associations, when occurring in less disturbed and more intact conditions, typically provide much higher cover values for perennial bunchgrasses and forbs as shown in the Tables 44 and 45 below.
Table 44. Cover Values Observed in Bluebunch Wheatgrass/Sandberg's bluegrass Plant Association
Bluebunch W heatgrass Sandberg's Bluegrass

Table 45, Cover Values Observed in Idaho Fescue/Bluebunch wheatgrass Plant Association, n= 29 C-lohnson and Clamsnitzer. 1992).
When the native vegetation is replaced by aliens or when the potential dominant plants decline to a point where the cause of the change is so severe as to eliminate any opportunity for resurgence to former dominance - a threshold has been reached and passed (Johnson, 2001).
Grasses Idaho Fescue Bluebunch Wheatgrass Sandberg's Bluegrass Prairie Jungegrass Annual Bromes
In the example of bunchgrasses, annual forbs or annual grasses may eliminate the opportunity for perennial bunchgrasses to regain dominance of the site. This has occurred over large expanses of the ridgetops, canyon bottom and even on steep slopes of Iskuulpa Creek. In our classification of seral stages, when the perennial potential bunchgasses cease to occur at 5% or greater coverage, we determine that the site can no longer sustain those bunchgrasses unless managers intervene with cultural practices to restore the grassland (Johnson, 2001 ).
23 17 12 5 9
Table 46 below provides approximate landscape acreage (or percentages) that may have been present prior to the 1800s. It is based on topographic setting - not vegetation groups per se. A predictable pattern involves the role of natural fire and native grazing animals to maintain the majority of a given landscape in mid seral stages of successional development. Another pattern that emerged is that the gentle ground (slope = 15% or less) tends to be where early and very early seral vegetation is most prominent. Steep canyon slopes and ridge tops (removed from water) tend to support the highest percentages of late seral vegetation.
Table 46. Provosed Historic Ranees of Variabilitv* Llohnson. 2001).
Forbs Y m o w Creamy Buckwheat Phlox B iquitroots Hawksbeards Arm wleaf BaIsamroot Serrated Balsamroot Pale Agoseris Lupines Fleabanes
.- Seral Sate 1 , -. l-i--T3-&-] .. - I....
LSgpgg 5%
3 8 5 3 1 1 4 2 5 1
[ Early Seral 10-30(20) 1 5-15(10) 1 20-30(25) 1 5-15(10) 1 10-30(20) 1 Late Sera1 1 25-35(30) I 30-40(35) Mid Sera1 1 35-55(45) / 40-60(50)
[ V.Early Sera1 1 5-15(10) 1 3-7(5) 1 5-15(10) 1 5-15(10) 1 5-15(10) 1 * Figures are in percent with the WRV given first with the mean value shown in parentheses.
15-25f20) 50-60(55)
Seral stages for grasslands are defined as follows. In the case of Iskuulpa Creek, the decreasers are Idaho fescue, bluebunch wheatgrass, and to a limited extent, Sandberg's bluegrass.
25-35(30) 40-60(50)
5-25(lS) SO-60(55)

Early Seral - Climax bunchgasses are subordinate ta increasers, absent, or so few as to make natural re- colonization unlikely (especially forbs); increasers and invaders usually dominate the community (bunchgrasses - 0-15% cover, increasers and invaders - greater than 50% cover).
Mid Seral - Climax bunchgrasses are present; increasers (especiaily forbs) are co-dominant or dominant (bunchgrasses - greater than 15% cover but less than 25% cover. Increasers and invaders - greater than 25% cover but less than 50% cover).
Late Seral - Climax bunchgrasses are dominant; invading and increasing species are subordinate (bunchgrasses - greater than 25% cover, increasers and invaders - less than 25% cover).
Recognizing that less than 10% of the grasslands are probably in mid to late seres now, a rational objective would be to seek a goal of 20% by the year 21 00 (Johnson, 2001).
Desired Future Conditions Approximately 20% of the grassland cover type will possess between 15 - 25% native perennial bunchgrass cover in approximately 100 years. Increasers and invaders (especially forbs) will be eo- dominant at will occur at 25-50% cover. The remaining 80% of the grassland cover type will have perennial grass cover <=IS%, with annual, exotic gasses and forbs comprising approximately 50% of the vegetative cover. The estimated habitat units produced by achieving the desired future condition are displayed in the table below.
[ Number Habitat Units in 10 Years 1681.7
The estimated increase in habitat units is based on an increase in average perennial grass cover from 4% to 15%, a total herbaceous cover of 40%!, and increase in percent cover composed of grass from 18.7% to 30% on enhanced grasslands.
Enhancement Strategies Once perennial bunchgrass cover drops below 5% in Idaho fescue and bluebunch wheatgrass plant associations, management intervention is the only salvation for initiating an upward successional trend. Grazing rest or grazing annual grasses early can help provide a competitive advantage for bunchgrasses where the grazing subsides prior to bunchgrass seed set and seedhead elongation. Prescribed burning may also be a tool to stimulate bunchgrass seedhead formation and reduce annuaf litter - thereby providing bare soil for seed germination.
The manager can also look beyond bunchgrasses for improving grassland ecosystems. Perennial forbs prominent at mid sere may be desirable for wildlife species. The grasslands of Squaw Creek and Rainwater

contain viable populations of lupine, balsamroot, and Mules ears, which add to the vitality of the overdl perennial community.
Managers should emphasize segments of the landscape where the fastest improvements can occur (deep soils, stable, low ungulate impact) and seek to eliminate or minimize degrading disturbances. Restoration should focus on areas with the highest cover of desired perennials where the highest chance of success is afforded. Although lupine or balsamroot may dominate at undesired levels for a decade or two, they at least will be helping to provide insulation by retaining moisture and coolness to the site in promotion of the germinating perennial bunchgrass.
The road back toward a greater mix of sera1 stages where mid and late seres are increased will take many decades. It will only happen through adherence to a long term plan that goes beyond lives of resource managers (Johnson, 200 1).
Habitat Units Summaw U.S. Fish and Wildlife Service (USFWS) Habitat Evaluation Procedures (HEP) were used to determine the number of habitat units credited to the Bonneville Power Administration (BPA) for lands acquired and leased in Iskuulpa Watershed, a Confederated Tribes of the Umatilla Indian Reservation watershed and wildlife mitigation project. The project is designed to partially credit habitat losses incurred by BPA for the construction of the John Day and McNary hydroelectric facilities on the Columbia River. Upland and riparian forest, upland and riparian shrub, and grasslands cover types were included in the evaluation. Indicator species included downy woodpecker, black-capped chickadee, blue grouse, great blue heron, yellow warbler, mink, and Western meadowlark.
Habitat surveys were conducted in 1998 and 1999 in accordance with published HEP protocols and included 55,500 feet of transect, 678 mZ plots, and 243 one-tenth-acre plots. Between 123.9 and 10,794.4 acres were evaluated for each indicator species. Habitat suitability indices derived for each species rnodel were multiplied by corresponding cover-type acreages to determine the number of habitat units for each species. The total habitat units credited to BPA for the Iskuulpa Watershed Project and Its seven indicator species is 4,132 habitat units.
1 Blue Grouse 1 1.045.0 1 10 1 407.6 1 407.6 1 1 Great Blue Heron 1 123.91 40 1 30.5 f 36.5 f
Woodpecker I
I Yellow Warbler I 425.8 1 10 1 280.6 1 308.5 1
Black-Capped Chickadee
1,246.0 1,287.0 I
I Meadowlark I 1 I 1 f
40
---.
Mink Western
1 Total I 4,567.8 / 4,960.8 1
1,203.8
Implementation of enhancement stxategies could generate an estimated 393 enhancement credits in 10 years. Longer-term benefits of protection and enhancement activities include increases in native species diversity and structural complexity in all cover types. While such benefits are not readily recognized by HEP models and reflected in the number of habitat units generated, they are consistent with the NPPC Program. Implementation of the alternatives will require long-term coinmitments from managers to increase probabilities of success and meet the goals and objectives of the Northwest Power Planning Council's Fish and Wildlife Mitigation Program.
L
223.9 10,794.4
I
10 100
103.7 1,318.9
110.8 1,681.7
Consistency With the NPPC Fish and Wildlife Program Goals Additional analysis was conducted to insure consistency with the scientific principles developed by the Northwest Power Planning Council and incorporated into the Council's Program in 2000. Plant community conditions in the study area were compared to data collected from USDA Forest Service-maintained, permanent reference plots in the Blue Mountains. Plots and reference plots were chaxacterized using the plant association concept, and data from reference plots was used as aid in characterizing the ecological condition of plant associations in the Iskuulpa Watershed. The approach used in this HEP analysis is consistent with the following NPPC Principles (NPPC Propam, 2000):
Principle 1. The abundance, productivity and diversity of organisms are integrally linked to the characteristics of their ecosystems. The physical and biological components of ecosystems together produce the diversity, abundance am' productivity of plant and animal species, including hurmns. The combination of suitable habitats and necessary ecological finctions forms the ecosystem structure and conditions needed to provide the desired abundance and productivity of spec@c species.
Xn this report we have attempted to characterize physical (climate, precipitation, soils) and biological {plant associations) components of habitats evaluated for mitigation wildlife species. The purpose of this effort was to; 1) identify how ecological functions and human activities have influenced present habitat suitability, and 2) determine appropriate habitat suitability indices (desired future conditions) within the context of site potentials of habitats within the project area.
Principle 2. Ecosystems are dynamic, resilient and develop over time. Although ecosystems ltave definable structures and characteristics, their behavior is highly dynamic, changing in response to internal and exteniat factors. The system we see today is the product of its biological, human and geological legacy. Natural disturbance and change are normal ecological processes and are essential to the structure and maintenance of habitats.
Inherent in the plant association concept is the recognition that plant communities move through sera1 stages over time depending on the frequency and intensity of disturbance. For example, in the Douglas firhinebark association, Johnson and Clausnitzer (1994) describe the role and effect of fire on overstory Douglas fir stands and the composition of the understory:
Successional Relationships: Stand replacing fir has been principal rnodifiing event. Stands are replaced with shrubfields dominated by ninebark, oceanspruy, Scouler willow, Rocky Mountain maple, cherry, and serviceberry. The pinegrass-elk sedge stand may also be promoted by tree- replacement burns. Forbs exhibiting an increase with fire.. .are firewee, peavines, etch, heartleaf arnica, and asters.. . Fire will promote shrubfields with a grass-sedge mosaic. These plants are rhizomatous and competition is intense. Very dificult to regenerate trees in less than 10 years. These early successional communities provide valuable browse for deer and elk. Older stands provide hiding or thermul cover. A reiatively droughty forest; mistletoes and root rots are common.
Consistent with Principle 2, we have quantified, where possible, human activities that have influenced the structure, conzposition, and diversity of habitats within the study area. In effect, identifying habitat conditions that are a product of human influences as well as other biologic or geologic factors.
Principle 3. Biological systems operate on various spatial and time scales that can be organized hierarchical&. Eccrsy,rtems, larzdscapes, communities and populations are usefull~l described as hierarchies of nested components distinguished by their appropriate spatial and time scales. Higher-level ecological patterns and processes constrain, and in turn reflect, localized putterns and processes. There is no single, intrinsically correct description of an ecosystem, only orae that is usefkl to management or scient$ic research. The hierarchy should chrify the higher-level constraints as well as the localized mechanisms behid the problem.

Powell (1998) described the organization of "Plant Associations" into 'TPlant Association Groups" that represent ecological environments (temperature and moisture gradients such as "cool/wetl' or "warm/rnctist"), which are in turn grouped into "Potential Vegetation Groups," defined as vegetation types having similar environmental conditions and dominated by similar types of plants (for example "'moist/forest" or "drylshrubIanb"). An example of this organization is again presented in Figure 6 with selected plant association groups of the moist forest potential vegetation group.
Figure 6. Organization of Plant Associations within the Moist Forest Potential Vegetation Group.
The scale at which plant associations occur is determined by temperature-moisture gradients (spatial) and the role of disturbance regimes in plant succession (temporal). Disturbance regimes include characteristics of spatial distribution of disturbance, frequency (the number of disturbances that occur within a given time interval, or the probability of a disturbance occurring); return interval (mean time between disturbances); rotation period (how long it would be until an area equivalent to the size of the study area was disturbed); size; and the magnitude of force of the disturbance.
The plant association concept, when used to describe ecosystems, is useful to management because it segments the temperature-moisture gradient through indicative plant species and provides easier recognition of similar environments across the landscape (Johnson and Clausnitzer 1992). As a combination of similar or compensating environmental factors is repeated across the landscape, such as elevation, slope position, and aspect, a predictable plant community wiXl occupy those sites given time and varying frequencies of disturbance (Johnson and Clausnitzer 1992). This community will then have similar physiognomy (form and structure) and floristics; and may also be called a climax community (Allaby 1994). It is believed that I ) the individual species in the association are, to some extent, adapted to each other; 2) the association is made up of species that have similar habitat requirements; and 3 ) the association has some degree of integration (Kimmins, 1997). Because environmental conditions vary continuously across the landscape, the resulting plant composition also varies. A plant association is therefore not an exact assemblage of species kom one location to another. However, sites in the same plant association differ less than sites from different associations (Powell, 1998).
The hierarchy clarifies constraints on habitat suitability by characterizing the site potential of habitats based on their location along the temperaturelrnoisture gradient and their current successional status as determined by disturbance events, or a lack thereof. For example, the ponderosa pinehluebunch wheatgrass association, located in the "Hot, Dry Plant Association Group" within the "Dry Forest Potential Vegetation Croup" would not be expected to produce as much basal area or canopy cover as a Grand Fir/Pacific Yew/Queen9s Cup Beadlily plant association in the "Cod Wet Plant Association Group" of the "Moist Forest Potential Vegetation Group," Because moisture is more limited on the ponderosa

pinebluebunch wheatgrass site, the site potential for basal area, rtnd consequently canopy cover, decreases, Converse1 y, the open canopy nature of the "Ponberosa PinelB tuebunch Wheatgrass" association allows greater light availability to the understory, and therefore the site potential for herbaceous cover is higher than in the Grand FirRacific Yew/Queen's Cup Beadlily plant association .
Finally, application of the concept is useful to management because current HEP Modeis rue only intended to relate life history requisites of selected species to habitat structure, they do not relate habitat structure to contextualized bio-physical environments and human influences.
Principle 4. Habitats develop, and are maintained, by physical and biological processes. Habitczts are created, altered and maintained by processes that operate over a range ofscales. Locally observed conditions oj?en reflect m r e expansive or non-local processes and influences, including huntan actions. The presence of essential habitat features created by these processes determines the abundance, prod~ctivity and diversity of species and communities. Habitat restoration actions are most eflective when undertaken with an understanding and appreciation of the underlying habitat-forming processes.
This principle has been addressed in this report by characterizing the bio-physical environment and addressing human influences on current habitat conditions in forested, riparian shrub, and grassland habitats, Changes in structure and species diversity for these habitats were in part linked to historical timber harvest, livestock grazing, and contemporary grazing schemes.
Principle 5. Species play key roles in developing and maintaining ecological conditions. Each species has one or more acoEogical functions t h t m y be key to the development and mintenance of ecological conditions. Species, in eflect, have a distinct jab or occupation that is essential to the stmcture, sustainability and productivity of the ecosystem over time. The existence, productivity and aburdance of specific species depend on these functions. In turn, loss of species and theirfinctions lessens the ability of th.e ecosystem to withstand disturbance and change.
Principle 7. Ecological management is adaptive and experimental. The dynamic nature, diversity, and conzplexiiy of ecolugicul systems routinely disable attempts to commund and control the environment. Adaptive management - the use of management experiments fn investigate biological problems and to test the eficacy of manugernent programs - provides a model for experimental management of ecosystems. Experimental management does nut mean pnssiz~e "learnirtg by doing," but rather a directed program aimed at understanding key ecosystem dynamics and the impacts of h u m n actions using scientific experimentation a d inquiry.
In this study we have utilized the plant association concept to investigate the biological problems of: 1 ) determining normative ranges of habitat suitabilities; 2) identifying additive factors beyond site potential that are currently limiting suitability; and 3) developing sustainable habitat objectives (indices) within the constraints of the normative site potential. In doing so, we have improved the effectiveness of using HEP analysis as a means of developing objectives for habitat suitability.
Permanent plots provide the means for repeating ecological reconnaissance monitoring and understanding ecosystem dynamics (i.e. succession), the influence of normative processes, and the impacts of human actions such as timber harvest and livestock grazing.
Principle 8. Ecosystem function, habitat structure and biological performance are affected by human actions. As humans, we often view ourselves us separate and distinctfrnm the natural world. Howuver, we are integral parts of ecosystems. Our actions have a pervasive impact on the structure and function of ecosystems, while at she same time, our health a d well being are tied to these conditions. These actions must be rnanuged in ways that protect and restore ecosystem structures and conditions izecessary for the survival and recovery offish and wildlife in the basin. Success depends on the extent to which we choose to control our impacts so as to balance rhe variuus sewices potentially provided by ihe Columbia River Basin.

This Habitat Evaluations Procedures report has attempted to document, where possible, the manner and magnitude in which human actions have affected the habitat structure and therefore biological and ecological functions in the Iskuulpa Watershed. Primary anthropological factors limiting ecosystem function, habitat structure, and biological performance are related to the direct, indirect, and cumulative effects of past livestock grazing, road construction, and timber harvest, which have simplified the structure, composition, and diversity of native plant communities.
Finally, use of the plant association concept to evaluate existing conditions and develop desired future conditions is also consistent with NPPC Habitat Strategies, which include the following:
"Use Native Species Wherever Feasible Even in degraded or altered environments, native species in native habitats provide the best starting point and direction for needed biological conditions in most cases.
Restore Ecosystems, Not Just Single Species Increasi?zg the abundance of single populations may not, by itseEf; result in long-term recovery. Restumtiorz eflorts must focus on restoring habitats and developing ecosyste?n conditions and functions that will allo~lfur expanding and maintaining a diversity within, and among, species in order to srtstai?~ a system of robust populations in the face of environmental variation."
Using plant association classifications and the corresponding data allows managers to not only compare the structural characteristics of study and reference sites, but also species richness and diversity.
Achieving consistency with the NPPC's Habitat Strategies implies that effective and responsible mitigation requires more than addressing habitat suitability far selected targets species, it also requires commensurate efforts to restore ecosystem diversity.

Literature Cited
AHen. 1986. Habitat Suitability Index Models: Mink. U.S. Fish Wildl. Serv. 6 p.
Bonnevjlle Power Administration. June 1997. DOEEIS-0246. Final Environmental Impact Statement for the Wildlife Mitigation Program.
Bmet T.M. 2001. Models of Vegetative Change for Landscape Planning: A comparison of FETM, LANDSUM, SLMPPLLE, and VDDT. Gen. Tech. Rep. RMRS-GTR-76-WWW. Ogden, UT: U.S. Department: of Agriculture, Forest Service, Rocky Mountain Research Station. 14 p.
Bate, L. J. 2995. Monitoring Woodpecker Abundance and Habitat in the Central Oregon Cascades. Moscow, ID: University of Idaho. 116 p. M.S. thesis.
Bull, EL and Holthausen, 1993. Habitat Use and Management of Pileaated Woodpeckers in Northeastern Oregon. Journal of Wildlife Management. 57: 335-345.
Bull, E.L., Parks, C.G., and R.F. Torgersen. Trees and Logs Important to Wildlife in the Interior Columbia Basin. Gen, Tech. Rep. PNW-391. Portland, OR: U.S. Department of A,giculture, Forest Service, Pacific Northwest Research Station. 55 p.
Bull E.L., and A.D. Partridge. 1986. Methods of Killing Trees for Use by Cavity Excavators. Wildlife Society Bulletin, 1 4: 142-146.
Bonneville Power Administration. June 1997. DOE/ElS-0246. Wildlife Program Final Environmental Impact Statement and Record of Decision.
Corps of Engineers Wetland Delineation Manual. 1987. Technical Report Y-87-1. January.
Crowe, Elizabeth A., Clausnitzer, Rodrick R, 1997. Mid-montane wetland plant associations of the Malheur, Umatilla, and Wallowa-Whitman National Forests. Technical Paper R6-NR-ECOL-TP-22-97. Baker City, OR: U.S. Department of Agriculture, Forest Service, Pacific Northwest Region, Wdlowa- Whitman National Forest. 299 p.
Daubenmire, R. 1956. Cimate as a Determinant of Vegetation in Eastern Washington and Northern Idaho, k o l . Mono. 26: 13 1-1 54.
Dixon,R.D. 1995. Ecology of white-headed woodpeckers in the Centxal Oregon Cascades. Moscow, ID: University of Idaho. 148 p. M.S. Thesis.
Fryxell, R. 1965. Mazama and Glacier Peak Volcanic Ash Layers: Relative Ages. Science, Vol. 147.
Hall, Fredrick and C. Bryant L. 1995. Herbaceous Stubble Height as a Warning of Impending Cattle Grazing Damage to Riparian Areas. Gen. Tech. Rep. PNW-362. Portland, Or. U.S. Department of Agriculture, Forest Service, Pacific Northwest Research Station. 9 p,
Harris, D.D. and L.E. Hubbard. 1983. Magnitude and Frequency of Floods in Eastern Oregon. Water Resources Investigations Report 82-4078, U.S.G.S. Portland, OR. 39pp
Johnson. Charles G. 2001. Ecological Reconnaissance Survey Summaries. Final Report for the Iskuulpa and Rainwater Watershed Projects.
Johnson, Charles Grier, Jr.; Clausnitzer, R o h c k R. 1992. Plant associations of the Blue and Qchoco Mountains. Publication R6-ERW-TP-036-92. Portland, OR: U.S. Department of Agriculture, Forest Service, Pacific Northwest Region, Wallowa-Whitman National Forest. 164 p.

Johnson, Charles G., Jr.; Simon, Steven A. 1987. Plant associations of the Wallowa-Snake province. Pub. R6-ECOL-TP-22Sb-86. Baker City, OR: U.S. Department of Agriculture, Forest Service, Pacific Northwest Region, Wallowa-Whitman National Forest. 272 p.
Johnson, Charles C. Jr. 2001. Final Report: EcoIogical Reconnaissance Survey Results for the Squaw Creek and Rainwater Wifdlife Mitigation Projects. Confederated Tribes of the UmatilIa Indian Reservation Wildlife Program . PO Box 638, Pendleton, OR. 97801.3 p.
NaturaI Resources Conservation Service. 1995. Oregon.
Nelson, W.B. 1935. Erosion-Range Survey Report, Gibbon Project, Umatilla County Oregon. Soil Conservation Service. Pullman, Wa. 18 p.
Northwest Power Planning Council. 1994. Columbia River Basin Fish and Wildlife Program.
Northwest Power Planning Council. 2001. Draft Wildlife Mitigation Program, Basin-Wide Provisions and Strategies. http://www.nwcouncil.org/library/2~0/200- 1 9fbasinwide.btm
Parks , C.G.; Bull, E.L.,; Fillip, G.M. 1996. Using Artificially Inoculated Decay Fungo to Create Wildlife Habitat. In: Bradford, Perter; Manning, Todd; I'Anson, Bill, eds. Wildlife tree/stand-level biodiversity workshop praceedings; 1995 October 17- 18; Victoria, BC. Victoria, BC: British Columbia Environement: 87-89.
Powell, D. 1998. Potential Natural Vegetation of the Umatilla National Forest. Urnatilia N.F. Supervisor's Office. Pendleton, OR. 31 p,
Rassmussen, 2. and P. Wright. 1990a. Wildlife Impact Assessment, Bonneville Project, Oregon and Washington. Prepared by U.S. Fish and Wildlife Service for U.S. Department of Energy, Banneville Power Administration, Portland, OR. 37 p.
Rassrnussen, L. and P. Wright. 199Ob. Wildlife Impact Assessment, John Day Project, Oregon and Washington. Prepared by U.S. Fish and Wildlife Service for U.S. Department of Energy, Bonnevifle Power Administration, Portland, OR. 27 p.
Rosgen, D. 1996. Applied River Morphology. Wildland Hydrology. Pagosa Springs, CO. 341 p.
Schroeder, R.L. 1982. Habitat Suitability Index Models: Black-Capped Chickadee. U.S. Dept. Tnt., Fish WildI. Serv. Biol. Rep. FWS/OBS-82/10.37. I2 p.
Schroeder, R.L. 1982. Habitat Suitability Index Models: Downy Woodpecker. U.S. Dept. Int., Fish Wildl. Serv, Biol. Rep. FWSJOBS-82J10.38. 10 p.
Schroeder, R.L. 1982. Habitat Suitability Index Models: Yellow Warbler. U.S. Dept. Jnt., Fish Wildl. Serv. Biol. Rep. FWS/OBS-82/10.27. 7 p.
Short, H.L., and R.J. Cooper. 1985. Habitat Suitability Index Models: Great Blue Heron. US. Fish Wildl. Serv. Biol. Rep. 82(10.99). 23 p,
Thomas, J.W., Anderson, R.G., Maser, C., and E.L. Bull. 1979. Snags. In: Wifdlife Habitats in Managed Forests: the Blue Mountains of Oregon and Washington. Agric. Randb. 553. Washington, DC: U.S. Dept. of Ag., Forest Service: 60 - 77.
Trewartha, Glenn T. 1968. An Introduction to Climate. McGraw-Hill, New York New York. 408 p.

Werner, K., Beukema, S., Merzenich, J., Arbaugh, M,, and S. Schilling. 1999. Long Range Modeling of Stochastic Disturbances and Management Treatments Using VDDT and TELSA. Society of American Foresters National Convention: Landscape Andysis Session. Portland, Or. Sept. 1 4 . 7 ~ .
USDA FS-R6 Staff. 1985. Draft Management Guidelines: for soils derived from volcanic ash in the Blue Mountains of Oregon and Washington - USDA Forest Service. 266 p.
USDOT. Fish Wildl. Serv. 1984. Habitat Suitability Index Models: Blue Grouse. FWS/OBS-82/10.8 1. 19 P .
USDOI, Fish Wildl. Serv. 1984. Habitat Suitability Index Models: Western Meadowlark. FWS/OBS- 82/10.81. 3 p.
USDOI USFWS. National List of Plant Species that Occur in Wetlands: Northwest (Region 9). Biological Report gg(26.9). May 1988.
USGS. 1983. Magnitude and Frequency of Floods in Eastern Oregon.
Reed, P.B, Jr. 1988. National List of Plant Species that &cur in Wetlands: Northwest Region (9). U.S. Fish Wildl. Serv. Biol, Rep. 88(26.9). 89 p.

Appendix A Vegetation Theme Properties
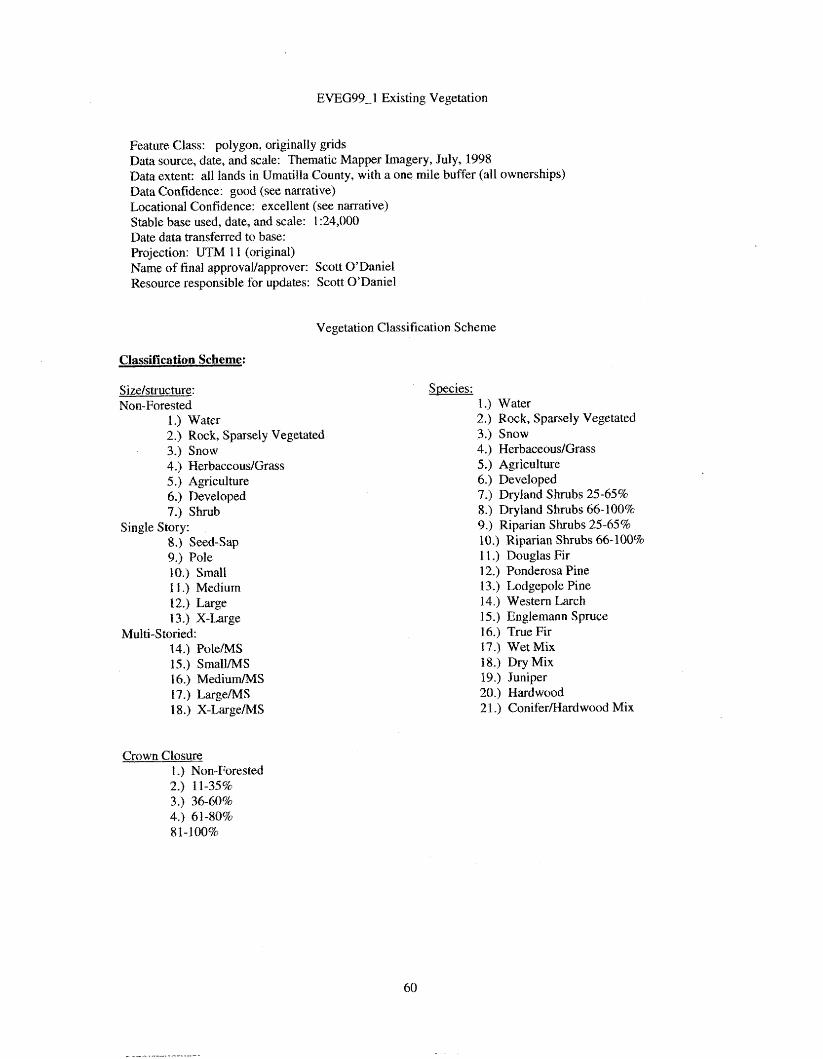
EVEG99-1 Existing Vegetation
Feature Class: polygon, originally grids Data source, date, and scale: Thematic Mapper Imagery, July, 1998 Data extent: all lands in Urnatiila County, with st one mile buffer (all ownerships) Data Confidence: good (see narrative) Lacational Confidence: excellent (see nanative) Stable base used, date, and scale: 1 :24,000 Date data transferred to base: Rojection: UTM 1 I (original) Name of final approvallapprover: Scott O'Daniel Resource responsible for updates: Scott O'Daniel
Vegetation Classification Scheme
Classification Scheme:
Sizelstructure: Non-Forested
I.) Water 2.) Rock. Sparsely Vegetated 3.) Snow 4.) HerbaceouslGrass 5.) Agriculture 6.) Developed 7.) Shrub
Single Story: 8.) Seed-Sap 9.) Pole 10.) Small 1 I .) Medium 12.) Large 13.) X-Large
Multi-Storied: 14.) Pole/MS 15.) SmallMS 16.) Medium/MS t 7.) LargeMS 2 8.) X-LwgeMS
Species: 1 ,) Water 2.) Rack, Sparsely Vegetated 3.) Snow 4.) HerbaceouslGrms 5 .) Agriculture 6.) Developed 7,) Dryland Shrubs 25-65% 8.) Dryland Shrubs 66-100% 9.) Riparian Shrubs 25-65% 1 0.) Riparian Shrubs 66- 100% 1 I .) Douglas Fir 12.) Ponderosa Pine 13.) Lodgepole Pine 14.) Western Larch 15.) Englelnann Spruce 1 6.) True Fir 17.) Wet Mix 18.) Dry Mix 19.) Juniper 20.) Hardwood 2 1 .) Conifer/Hardwood Mix
Crown Closure f .) Non-Forested 2.) 11-35% 3.) 3660% 4.) 61-8096 81-100%

Classification Key:
Following are the tree diameters ranges corresponding to the sizelstructure classes identified in the ctassification key below:
Seedling-Sapling(SD-SP) 0-4.9" dbh Pole (PL) 5.0 - 9.9" dbh Small (SM) 10.0 - 14.9" dbh Medium (MD) 15.0 - 19.9" dbh Large (LG) 20 - 29.9" dbh X-Large (XL) 30" + dbh
Non Forest - If the total tree crown closure is 2 10% then the site is labeled with the appropriate Non Forest class
Canopy Layer - After making a call for total tree crown closure, allocate the percent cover into three layers by dividing the height of the tallest trees into 3 equal parts. The sum of the layers must equal the total tree crown closure.
If > 85% of the total tree crown closure is present in one canopy layer then single-story ELSE Multi-storied.
Single-Stor1 Tf > 50% of the total tree crown cover is in a single diameter class choose class for a label. Else if 2 70% of the total crown cover is in two adjacent classes choose the Iabel based on the
largest crown closure contribution. In cases of tie, choose the largest diameter class. In cases where three adjacent diameter classes combine to make 2 70% total tree crown closure
choose the label based on the largest closure contribution. In cases of ties, choose the largest diameter class.
Multi-Storied (MS) If X-Large (XL) 2 15% crown cover, then X-Large Else If Large (LG) 2 15% crown closure, or if 2 25% crown cover in LG and XL then Large/MS ELSE If Medium (MD) 2 15% crown cover or > 25% crown cover in MD ..... XL - then MediumRMS ELSE If S~nall (SM) 2 15% crown cover >. 25% crown cover in SM ...... XL then SmallMS ELSE If Pole (PL) 2 15% crown cover > 25% crown cover in PL ...... XL then Pole/MS ELSE choose the label based on the largest closure contribution
IF SEED-SAP THEN SEED-SAP/SS
Species: Sites are described by percentage tree crown cover by species class as seen above (i-e., as seen from an aerial photo). Total crown cover can not exceed 100%. Sites with < 11 5% total tree crown cover are considered Non Forest. This includes both sites that do not naturally support tree crown cover and managed sites with less than 11% tree crown cover.
If total tree crown cover is < 11 %
then if < 25% herbaceouslgrass or shrub Labd either Water

Rock, Sparsely Vegetated Snow Agriculture and Developed as appropriate.
Else if 25% - 65% dryland shrub crown closure label as Dryland Shrubs 25-65 %
Else if > 65% dryland shrub crown closure label as Dryland Shrubs 66-100%
Else if 25% - 65% riparian shrub crown closure labe1 as Riparian Shrub 25-65%
Else if > 65% riparian shrub crown closure label as Riparian Shrub 66-100%
Else if 2 25% herbaceous/pass crown closure label as Hcrbaceous/Grass
If total tree crown closure is > I 1 %
Then 2 80% of the total tree crown closure is in hardwood species then Hardwood
Else if 2 50% of the total tree crown closure is in hardwood species then ConiferMardwood Mix
Else if 2 80% of the total tree crown closure is in a single conifer species then label becomes that single species.
Else if 30-80% of the total tree crown closure True Fir then Wet Mix
Else if c 30% True Fir of the total tree crown closure and (PP-tDF-t-WL-tLP) of the total tree crown closure r 50% then Dry Mix
Else Other Conifer Mix
Crown Cover: Crown cover will be classified according to the sum of ail conifer crown cover plus crown cover of hardwood species > 5" dbh. However, if there is > 11% total crown cover in pole of larger hardwood, then all hardwood (including those < 5" dbh) are considered as trees and tallied accordingly.

Shrub Types:
A. Major Eastern Oregon Dryland Shrubs 1. Bitterbrush 2. Manzanita 3 . Ceanoths 4. Mt Mahogany 5. Low Sagebrush 6. Stiff Sagebrush 7. Big Sagebrush 8. Silver Sagebrush 9. Ninebask 10. Snowberry 1 1 . Spiraea 12. Big huckleberry 1 3. Low huckleberry
B. Major Eastern Oregon Riparian Shrubs 1 . Plum 2. Cherry 3. Serviceberry 4. Shrub aspen 5. Alder 6. Cottonwood 7. Willow 8. Rocky Mt Maple 9. Hawthorne

Appendix B Plant Association Descriptions

Forested Associations (in Johnson and Clausnitter, 1992)
Grand Fir/Sword Fern-ginger - ABGRIPOMU-ASCA3 (A bies Grandis/Polystichum muniturn- Asarum caudatun)
Vegetation Composition: Low elevation sites, on steep, northerly slopes near canyon bottoms support this type of the northern Blue Mountains. Grand fir is associated with Rocky Mountain. Maple and a wealth of shrubs. Common snowberry and twinflower are usually abundant. Herbaceous vegetation is dominated by sword fern, ginger, queen's cup beadlily, Hookers fairybells, foamflower and starry Solomon's seal. The sword fern - ginger coxnmunity reflects the influence of warm, maritime climate in the northern Bfue Mountains and a species composition more comnlon in the Cascades.
Typal Comparisons: The presence of Rocky Mountain Maple and Pacific yew here are not indicative of those types using these species as indicators. The indicators of ABGRIPOMU-ASCA3 are sword fern- ginger herbs which reflect the environment as a w m , maritime climate. The association flora is more common to the west side of the Cascades to the BIue Mountains.
Successional Relationships: Douglas-fir and larch are serd to grand fir. Reflecting the drier canyon slope influence from adjacent communities are ninebark, oceanspray, and woods strawberry. Wet conditions of the riparian bottoms provide red alder, Pacific yew, and black cottonwood Incursions. Shrublands of Rocky Mountain maple, big huckleberry, scauler willow, and Sitka aEder may dominate in early seral stages following burns.
Management Considerations: The riparian nature of this type increases its management sensitivity. Appropriate management systems should consider wildlife, watershed, aesthetic, recreational, and biological diversity values inherent to sites supporting the Grand Fir/Sword Fern-ginger association. A diverse habitat provides for bear, deer, elk, grouse, and passerines. Thermal cover for ungulates during summer months may be provided. Forage production for domestic stock is low, although herbage production is high within these wet drainages.
Grand Fir/Cup Beadlily - ABGWLUN - (Abies grandidClintonia uniflara)
Vegetation Composition: Grand fir occurs with spruce usually associated. Shrubs are few with big huckleberry (VAME), baldhip rose (ROGY) and twinflower (LIB02) often present. The herbaceous layer contains a variety of plants adapted to cool, most environments. Queen's cup beadlily (CLUN), starry SoIornon's seal (SMST), trail plant (ADBI) and foam flower (TITRU) are indicative of this environment.
Typal Comparisons: The tall shrub, AGCL - indicative of the ABGWACGL association, is usually absent fram the ABGWCLUN type. VAME may occur but queen's cup beadlily beneath the scattered shrubs indicate the mesic-site conditions of this plant association. Sites have moderate soil depth and are among the highest for tree production in the Blue Mountains (ABGR/CLUN) is very high in productive potential).
Successional Relationships: Western larch and Douglas-fir usually precede grand fire successiondly. Principal shrubs which are promoted witb surface disturbance on these sites are big hucklebeny (VAME), common snowberry (SYAL), Oregon boxwood (PAMY), Rwky Mountain maple (AGCL), spiraea (SPBE), swamp gaoseberry (RILA) and Scouler willow (SASC). Disturbance of the herbaceous layer may promote heartleaf arnica (ARCO) strawberries, vetch (VIAM), lupines, bracken (PTAQ), coneflower (RUOC) and golden pea (THMO).
Management Considerations: Silvicultural options to utilize the productive capabilities of these sites are varied dependent upon the succession stiltus of stands and management objectives. Concern for

competition with seedlings may be concentrated on sera1 shrubs promoted by ground disturbanci and burning. Composition of late seral stands on some sites may lead to insect defoliation by spruce budworm or Douglas-fir tussock moth and pathogen problems. Notably Indian paint fungus. Later sera1 and climax stands as well as densely canopied stands produce low amounts of forage for domestic livestock; stands are used for cover and browse by deer and elk. Huckleberries provide food for grouse and bear. Fire leads to dominance by sera1 tree species, lodgepole pine, DougIas-fir, or western larch. Engeln~ann spruce is a mid to late-sera1 tree.
Relationship to Other Studies: Pfister, et a1 (1 977) described ABGRiCLUN with 3 phases in Montana. SteeXe (1 981) and Cooper et a1 (1987) described ABGR/CLUN in north central and cenh-ai Idaho. Johnson and Simon (1987) described ABGRfCLUN as the most mesic of the grand fir associations in the Wallowa-Snake classification.
Grand FirrSwinflower - ABGWLIB02 - Abies grandishimsea borealis
Vegetation Comvosition: Grand fir is associated with Douglas-fir, larch, and spruce. Twinflower (LIB02) is always present. Depending on tree canopy density, big huckieberry may dominate or be absent from ABCWLIB02 communities. Herbaceous vegetation is usually scattered at low coverage or in limited patches due to depauperate nature of many sites. The more prevalent shade-tolerant forbs are sidebells pyrola (PYSE), rattlesnake plantain (GOOB) and mitelia (MIST2).
Typal Comparisons: This type, MGRNAME, does not have the subshrub, twinflower (LIB02), present; VAME may be abundant within the ABGRLIBO2 association. This type occurs on mid- elevation slopes with moderate ash depths and is perhaps the most widespread plant association of the Blue and Ochoco Mountains.
Successional Relationships: Western larch, lodgepole pine, ponderosa pine, and Douglas-fir are key sera1 tree species. The PICONAME-LIB02 plant cornunity type is assigned to this plant association. Early seral ABGIULIB02 communities may be dominated by shrubfields of big huckleberry (VAME), common snowberry (SYAL), spiraea (SPBE), or pinemat manzanita (ARNE). Disturbed forest understory may result in the promotion of heartleaf arnica (ARCO), pinegrass (CARU), elk sedge (CAGE), meadowrue (TWOC), fireweed (EPAN), aster, goXden pea (THMO).
Management Considerations: Silvicultural options for these sites are varied dependent upon the successional status of stands and management objectives. Seral shrubs and huckleberry may compete with tree seedlings during establishment following clearcutting. Camposition of late seral stands, where tolerant grand fir dominates, promote defoliation by spruce budwork and Douglas-fir tussock moth and pathogen problems (Indian paint fungus). The tree species, PSME, PICO, PTPO, and LAOC are favored by fire - ABGR is susceptible to fire. Little forage is available in late seral or climax standards; browse and cover are provided big game. Huckleberries are food source for grouse and bear.
Relationship to Other Studies: The ABGRLIB02 plant association was described by Hall (1973) in the Blue Mountains, by Pfister, et a1 (1977) in Montana, by Steele (1981) in central Idaho, by Cooper et a1 (1 987) in N. Idaho, by Clausnitzer and Zamora (1 987) in N. Washington, and by Johnson and Simon (1987) in the Wallowas and Seven Devils.
Grand Fir-RockyMountain Maple - ARGWACGL - Abies grandis1Acer glabrum
Vegetation Composition: Grand fir dominates on mountain slopes with Rocky Mountain maple. Engelmann spruce may occur. Shrub layer also contains big huckleberry (VAME). Queen's cup beadlily (CLUN) and twinflawer (LIB02) are often associated.
Typal Comparisons: Less mesic than ABGR/POMU and ASCA? of the low elevations in northern Blue Mountains. In the ABGRIACGL plant association, the moist-site herbs, POMU and ASCA3, so

prevalent in the ABGR/POMU-ASCA3, are absent. The tall shrub, Rocky Mountain maple, is typical of the physiognomy presented by stands of this association. Stands have high timber production capability.
Successional ReIationships: Larch and Douglas-fir are seral to grand fir. Occasionally, ponderosa pine may pioneer when the type occurs on seepage sites adjacent to warmer, drier slopes. Shrubfields may precede tree emergence and are dominated by Rocky Mountain maple (ACGL), big huckleberry (VAME), common snowberry (SYAL), Oregon boxwood (PAMY), spiea (SPBE), t h i m b l e b e (RUPA), ninebark (PHMA), and/or aceanspray (HODI). Sudace disturbance of the forest understory may promote heartleaf arnica (ARCQ), strawberries (FRVI, FRVE), vetch (VIAM) fireweed (EPAN), bracken (PTAQ) or golden pea (THMO).
Management Considerations: Where this association occurs on the upland, opportunities for silviculhrral treatments are varied; they are lessened when this type occurs as riparian stringers. Post- harvest tall and medium shrub responses indicate considerations of appropriate site preparation and conifer release methods for plailtation establishment. The sites provide habitat for bear, gouse, big game, and passerines. Members of the understory readily sprout following f ~ e , Douglas-fir, ponderosa pine, western white pine, larch, and spruce occur as scral trees.
Relationship to Other Studies: Steele ( 1 981) described a ABGRIACGL habitat type in central Idaho. Johnson and Simon (1987) described the ABGR/ACCL plant association in the Wallowas and Seven Devils.
Douglas Fir/Oceanspray - PSME/HODI - Pseudastuga rnenziesiiMIoltdscus discolor
Vegetation. Composition: A common community on lower canyon slopes and bottoms in the Northern Blue Mountains. Douglas-fir and ponderosa pine co-dominate aver a shrub-grass mosaic in the understory. Oceanspray (HODI). Serviceberry (SYAL), spiraea (SPBE), and common snowberry (SYAL) are the principal shrubs. Pinegrass (CARU) elk sedge (CAGE), Calumbia brome (BRVU), woods strawberry (FRVE), and western fescue (FEOC) are the more common herbs.
-1 Cam~arisons: This plant association is found an moderately warm sites; elevations range lowest of the series and exposures are principally southerly. HOD1 dominates the tall shrub component; PHMA, if present, has less than 5% coverage. Basal areas, tree productivities, and stockability are the highest of the PSME series for Douglas-fir and ponderosa pine.
Successional Relationships: Ponderosa pine is seral to Douglas-fir. Ungulate disturbance to these communities may provide increased dominance by pinegrass, elk sedge, Oregon-grape (BERE), blue wildrye (ELGL), heartleaf arnica (ARCO), bracken (PTAQ) and long stalked clover (TRLO).
Management Considerations: Silviculturally, a wide range of even-aged and uneven-aged systems are appropriate. Other resource values of individual stands are considerations to limit application. Winter habitat for deer and elk, summer forage for ungulates, aesthetics, and recreation are a few associated with sites supporting this plant association. Plant species we fire-resistant; many resprout readily or, for tree species, are protected by thick bark. Competition from shrubs and grasses should be considered during regeneration activities.
Relationship to Other Studies: First described by Hall (1973) in the northern Blue Mountains; described by Clausnitzer and Zamora (1987) on the Colville Indian Reservation in northern Washington; and described in the Review Draft for the Yakima Indian Reservation of west central Washington by John and Tart (1986).

Grand Fir/Birchleaf Spirea - ABGRBPBE - Abies grandidspiraea betulifolia
Vegetation Composition: Grand fir and Douglas-fir tend to co-dominate. Birchleaf spiraea (SPBE) and common snowbeny (SYAL) provide a shrub domination beneath grand fir stands. Pinegrass (CARU), elk sedge (CAGE) and heartfelt arnica (ARCO) are present; often at higher coverages that the shrubs. The ABGR/SPBE plant association has close affinities to the Douglas-fir series vegetation as exemplified by high constancies of species more regularly associated with Douglas-fir plant associations.
Typal Comparisons: The ABGR/SPBE association differs from ABGR/CARU in the occurrence and abundance of spiraea in the former type. The spiraea is the dominant and constant member of a diverse shrub group including snowbeny, rose, huckleberry, boxwood, prince's pine, and willow. While these two associations are similar in distribution, ABGR/SPBE appears to have a deeper ash cap and greater soit water-holding capacity than ANGWCARU. Tree productivities are similar.
Successional Relationships: Larch, Douglas-fir and ponderosa pine are all important seral tree species in this type. Oregon boxwood (PAMY), serviceberry (AMAL), and pinemat manzanita (ARNE) are important seral shrub species. Herbs which tend to increase with soil surface disturbance and ungulate use are northwestern sedge (CACQ), heartleaf arnica (ARCO), strawberries, lupines, vetch (VIAM) peavines (LATHY) and long stalked clover (TRL03).
Management Considerations: Droughty soils, warm aspects, and competition from rhizomatous understory shrubs and herbs are concerns for successful natural and artitjcial regeneration following harvest activities. Douglas-fir, ponderosa pine, and larch are seral trees in this association. Stand af grand fir and DougIas-fir are susceptible to the insect defoliators, spruce budworm and Douglas-fir tussock moth. Surface fires have historically favored the seral trees and the rhizomatous understory vegetation. There is seasonal use of the understory by both domestic Iivestock and big game; passerines, grouse, and bear find food in the associated shrubs.
Relationship to Other Studies: Steele (1981) described AEiGWSPBE in central Idaho; Cooper et a1 (1987) classified ABCRISPBE as a minor habitat type in north Central Idaho; Johnson and Simon (1987) classified ABGWSPBE in the southern Wallowa Mountains. Ha11 (1973) did not describe ABGIUSPBE but included this vegetation within the mixed conifer-pinegrass plant community type of the Blue Mountains.
Douglas-fir/Pinegrass - PSMEICARU - Pseudostuga menzeisiUCaEamagrostis rubescens
Vev. Composition: Ponderosa pine commonly dominates in PSMEICARU stands fiom its greater fire resistance. Douglas-fir is the climax dominant, however. Common snowberry (SYAL) and creeping Oregon-grape (BERE) are common but in low coverage within the pinegrass-elk sedge dominated ground cover. Heartleaf arnica (ARCO) is the most prevalent forb.
'Fypal Comparisons: Understory dominance by the rhizomatous grass and sedge, CARU and CAGE, typifj stands representing this plant association. Low shrubs, while ubiquitous, are somewhat inconspicuous in the pinegrass dominated understory. Sites supporting this type represent some of the highest elevation occurrences of the PSME series in the Blue Mountains. Most sampled stands had soils with a mantle of volcanic ash. Overstory productivity is moderate.
Successional Relationships: Ponderosa pine is the principal seral tree species. Spiraea (SPBE) and Oregon-grape (BERE) may be more abundant in early seral stands. Pinemat manzanita (ARNE) and ceanothus (CEVE) are pioneers following fire along pinegrass-elk sedge. Peavines (LATHY), vetch (VIAM), tailcup lupine (LUCA) and heartleaf arnica (ARCO) are forbs that increase with disturbance in the type.

Management Considerations: Regeneration activities that consider competition fiorn rhizomatous grasses and sedges, potential pocket gopher papulations, wildlife and cattle damage of seedlings, and soil drought are appropriate in the PSMEICARU plant association. Big game and cattle make heavy seasonal use of the understory grasses, sedges and associated forbs. The association recovery quickly from fire; ponderosa pine, pinegrass, and sera1 shrubs (CEVE and SASC) are promoted by recurrent fire. Buckbrush serves as passerine habitat as we11 as a nitrogen-fixer for the site.
Relationship to Other Studies: Daubenmire (1 968) described the PSMEICARU habitat type in eastern Washington; Hall (1973) incorporated PSMEKARU in the mixed conifer-pinegrass p.c.t, in the BIue Mountains; Pfister, et a1 ( I 977) describes PSMElrCARU in Montana; (StoeIe (1 98 1) considered PSME/CARU a major habitat type in central Idaho; Cooper, et a1 (1987) found it to be incidental in northern Idaho; Williams and Lilybridge (1983) and Williams, et a1 (1991), described it in northern Washington. Clausnitzer and Zarnora described PSME/CARU on the Colville Indian Reservation. Johnson and Simon (1.987) described it in the Wallowas.
Douglas Firminebark - PSME/PHIMA - Psedastuga menziesiilPhysocarpus malvaceus
Vegetation Composition: A steep canyon slope forested community dominated by Douglas-fir with ponderosa pine usually associated; larch is infrequent. Ninebark (PHMA), common snowberry (SYAL), spiraea (SPBE), serviceberry (AMAL), and baldhip rose (ROGY) are the principal shrubs. Principal herbs are pinegrass (CARU), etk sedge (CAGE), woods strawberry (FRVE), and heartleaf arnica (ARCO). Aspect strongly controls the distribution of these communities.
Typal Con~varisons: Physiognomy and composition are similar to PSMEEIODI stands but the tall shrub component is dominated by ninebark, not oceanspray. Three productivities arr: moderate in this association with PIPO, PSME, and LAOC all showing similar potential.
Successional Relationshius: Stand replacing fir has been principal modifying event. Stands are replaced with shrubfields dominated by ninebark, oceanspray, Scouler willow, Rocky Mountain maple, cherry, and serviceberry. The pinegrass-elk sedge stand may also be promoted by tree-replacement burns. Forbs exhibiting an increase with fire in PSME/PHMA are fireweed (EPAN), peavines (LATHY), vetch ( V I M ) , heartleaf arnica (ARCO), and asters.
Management Considerations: Steep slopes and shrub grass competition create concerns for timber management. Silvicultural operations that consider stocking requirements, operability constraints, and animal-related problems are applicabIe in this type. Plant species are fire-resistant and post-fire recovery occurs relatively quickly in most situations. Fire will promote shrubfields with a grass-sedge mosaic, These plants are rhizomatous and competition is intense. Very difficult to regenerate trees in less than 10 years. These early successional communities provide valuable browse for deer and elk. Older stands provide hiding or thermal cover. A relatively droughty forest; mistletoes and root rots are cornon.
Relationship to Other Studies: Described in eastern Washington by Daubenrnire (1968); by Wall (1973) in the northern Blue Mountains; by Pfister, et a1 (1 977) in Montana: by Steele (1 98 3 ) in central Idaho; by Cooper et a1 (1987) in northern Idaho; by Williams and Lilybridge (1983) and by Clausnitzer and Zarnora (1987) in northern Washington; and by Johnson and Simon (1987) in the Wallowa Mountains.
Douglas Fir/Common Snowberry - PSMEfSYAZ - Psedostuga menziesii /Symphoricarpus albus
Vegetation Composition: Douglas-fir and ponderosa pine are common on these sites: ponderosa pine may dominate (but Douglas-fir demonstrates potential to succeed), Common snowberry (SYAL) and spiraea (SPBE) form a shrub layer, elk sedge (CAGE) and pinegrass (CARU) dominate the herbaceous vegetation, Baldhip rose (ROGY), creeping Oregon grape (BERE) and serviceberry (AMAL) are prominent shrubs at low coverage.

Typal Comparisons: This plant association is characterized by the occurrence and abundance of rhizomatous low shrub layer dominated by common snowberry on warm, mesice sites. Tree productivities, basal area, and stockabiIity are similar to the psme/phma plant association.
Successional Relationships: Ponderosal pine generally precedes Douglas-fir as the principal seral tree species. Forbs abundant inearly seral stages are asters, peavines, heartleaf arnica (ARCO), tailcup lupine, (LUCA) vetch (VIAM), strawberries, and medowrue (THOC). Smooth brome (BRZN), mountain brome (BRCA) and Kentucky bluegrass (POPR) often increase with disturbance.
Management Considerations: As in the Douglas-fir/tall shrub association, competition form rhizomatous understory vegetation (syal, spbe, cam, and cage) and animal use are factors to consider in choosing appropriate timber management systems. Plant species are fire-resistant, recurrent fire promotes ponderosa pine and pinegrass on this type. Animal use is high - deer, elk, cattle, grouse, and passerines all utilize this habitat seasonally.
Relationship to Other Studies: Described by Daubenmire (1968) in eastern Washington; by Pfister, et al (1977) in Montanna, by Steele (1981) in central Idaho; by Cooper, et al(l987) in northern Idaho, Williams and Lilybridge (1983) in north central Washington; Willimas, et al (1991) and Clausnitzer and Zamora (1987) in northeast Washington. Johsnson and Simon (1987) described PSME/SYAL in the Wallowas of noftheast Oregon.
Ponderosa PindCommon Snowberry - PIPO/SYAL - Pinus ponderosa/Symphoriearpus atlbus
Vegetation Composition: Ponderosa pine is climax; Douglas-fir may occur at low coverage. Comn~on snowberry, spiraea (SPBE), baldhip rose (ROGY) and serviceberry (AMAL) are principal, shrub components. Elk sedge is the principal herb. Shrubs are usually present at lower coverages unless the understory has been disturbed.
Typal Comparisons: PIPO/SYAL occurs at the lowest mean elevation of any PIPO plant association (3,995 ft). It occurs principally in the north and central Blue Mountains on gentle to steep slopes at all slope positions. It occurs on deep soils over varying geologic substates. The PIPO/SYAL community occurs on the deepest soils of any PTPO series vegetation and is considered the most rnesic of the PIPO plant associations. Site index, stockability, and the productivity index are the highest of the PTPO series,
Successional Relationships: Mountain brome (BRCA) and blue wildrye (ELGL) are grasses that tend to increase disturbance. Forbs which may be more abundant at lower seral stages are vetch (VIAM), heartleaf arnica (ARCO), tailcup lupine (LUCA) and yarrow (ACMIL).
Mana~ement Considerations: Tree regeneration success is limited by SYAL, CARU, and CAGE competition. Clumps of pine regeneration can cause stagnation requiring stocking level control. Ungulate use is high (proximity is to adjacent bunchgrass). CARU used late in season after frost; SYAL use is high by deer, elk, grouse, and passerines. Often used for bedding and shading. Fire promotes CARU, PIPO regeneration and bunchgrasses. Use of prescribed fire promotes vigor of rhizomatous shrub, grass, forb species. Additionally, fire maintains community vigor and develops the unevenaged character of the PIPOISYAL plant community. This one of the highest herbage producing plant association of the ponderosa pine series.
Relationship to Other Studies: The PIPO/SYAL habitat type was described by Daubenmire (1968) in eastern Washington and northern Idaho; Pfister, et a1 (1977) in Montana; Steele (1981) in central Idaho; Johnson and Simon (1987) in the Wallowa-Snake of northeast Oregon; Clausnitzer and Zamora f 1987) on the Colville Indian Reservation of northern Washington.

Upland Shrub Associations (in Johnson and Simon, 1987)
C~mmon Snowberry- Rose - (SYAL-ROSE) - Symphoricarpus albudRose spp.
These stands appear to have increased throughout the canyonlands of the Blue Mountains. This increase may be the result of fire removal fiom the ecosystem or as a response to overgrazing of deep- soil mesic grassland communities (i.e. Idaho fescue - prairie junegrasss FEID-KOCR). It is also possible that the shrubs are responding to more favorable moistuse, indicating either a wetter period of a climatic cycle, a change in distribution, timing of precipitation, or a combination of all three factors. These shrublands are not considered to be future ponderosa pine - common snowbeny forest communities.
The mount of herbage produced in these communities is inversely related to canopy cover of the dominant shrubs. Dense common snowbeny - rose shrub communities produce very little herbaceous forage. However, very early seal communities with low shrub cover may produce substantial amounts of forbs and grasses. Browse production by snowberry can also be significant In all seral stages.
These shrublands provide a diversity for wildlife habitat (i.e., browse, hiding cover). Common snowbeny is palatable to cattle and big game. It can withstand normal grazing well, but heavy grazing will eradicate it. Periodic heavy grazing of some stands may promote production of favorable grasses. Common snowberry is resistant to fire and sprouts vigorously after burning. Roses are moderately resistant to fire and develop basal sprouts following fire.
Nincbark - PHMA - Physocarpus malvstceus
Vegetation Composition - The PHMA-SYAL shrubland may be the result of stand replacement fire in the PSMmHMA conmunities or may be the result of severe competition imposed by ninebark to thwart tree establishment. The PWMA-SYAL shrubland may contain ponderosa pine and/or Douglas- fir trees at low coverage. Ninebark (PHMA), common snowberry (SYAL), oceanspray (HODE), spiraea (SPBE), and serviceberry (AMAL) are the most common shrubs of the community type. Roses, cherries, Rocky Mountain Maple (ACGL) and synnge (PHLE2) are often present. Beneath the shrubs, herbaceous growth is restricted. Elk sedge (CAGE) and Bluebunch wheatgrass (AGSP) occur from adjacent comrnuni ties.
Typal Communities - Ninebark-snowberry shrublands occur primarily in the northern Blue Mountains on steep canyon slopes at upper, mid, and lower slope elevations. Soils are deep loess and ash over basalt. Sampled elevations ranged from 1,750 to 4,775 feet (mean = 2,635).
Successional Relationships - Fire periodically consumes PHMA-SYAL shrublands. Most of the associated shrub species resprout basally following fire, quickIy returning the shrubland to vigorous growth. Cyclic fire events may help discourage tree establishment. Initial pioneering plants following fire are variIeaf phacelia (PHHE), fireweed (EPAN) and annual bromes. Rocky Mountain maple presence indicates a moist phase of this type.
Management Considerations - Principal use is for big game cover and shading. These communities provide wildlife habitat and add diversity to the canyon landscape. Silivculturaf activity may be cost ineffective based on the intense shrub competition and difficulty of access. Value to watershed for slope stability and water quality is high.

Grassland Associations (in Johnson and Clausnitzer, 1992)
Bluebunch Wheatgrass/Sandberg's bluegrass - AGSPPOSA - Agropyron spicatum/Poa sandbergii
The blubunch wheatgrass/Sandberg's bluegrass association-represents one of the highest elevational extensions of the AGSP-POSA3 communities. The highest bluebunch wheatgrass (mean: 54%) and Sandberg's bluegrass (mean: 7%) cover among these communities is usually found in late seral communities on basalt substrates.
Perennial grasses and forbs common to this plant association include yarrow, creamy buckwheat, and biquitroots.
When these communities degenerate, bluebuch wheatgrass and mosses decline. Early seral stages may show greater frequency of annual bromes (BRBR, BRTE), yarrow, arrowleaf balsamroot, tall annual willowweed, deerhorn, and blepharipapus, Sandberg's bluegrass is not able to persist well on steep slopes, and becomes less fiequent as the slope length increases down from ridge tops.
Hot rmge fires and severe over-grazing by cattle will often promote dense homogeneous stands of cheatgrass in this type. If the bunchgrass seed source is not lost, these sites may succeed to the bluebunch wheatgrasslsandberg's bluegrass domination again, but only after a very long period of time (estimate: 50 to 100 years).
Overall herbage production is moderately high in this association. However a significant decrease in production for all forage species may occur in early seral communities.
Cattle prefer bluebunch wheatgrass in these communities. They may also reduce the amount of Sandberg's bluegrass in the type through overgrazing and trampling. Sheep tend to utilize cheatgrass. the primary increaser in these communities. On sheep range, Sandberg's bluegrass may tend to increase as a result of sheep usage where preference is to competing succulent annual vegetation.
Bluebunch wheatgrass is the species to manage since it supplies a majority of the total forage produced and is the most preferred species for both domestic and wild ungulates. Utilization by winter grazing livestock should cease prior to onset of the boot stage (usually in May to early June). Use on summer ranges should be initiated following the flowering period of bluebunch wheatgrass.
Annual bromes in this association provide early spring grazing forage, especially in early seral communities where cheatgrass may dominate and desirable perennials are fewer. Fire cannot be used to convert annual brorne stands to native bunchgrass vegetation. To reclaim perennial bunchgrasses herbicidal use, plowing under of the annual gasses and re-seeding with wheatgrass will be required.(Johnson son and Simon, 1987).
Management Considerations - Light burns occurring after seed maturity can enhance the competitive ability of Bluebunch wheatgrass. Where cattle, deer and elk graze, and use is heavy, Sandberg's often declines from continued overgrazing and trampling. Early season use on steep slopes can also negatively impact the smaller Sandberg's bunchgrasses. Especially impacted are the south slopes where elk and deer congregate in early spring when soils are saturated with moisture and plants are prone to damage. Plant loss from uprooting due to use by animals and slope movement is especially high at this time.
Idaho Fescud Bluebunch Wheatgrass - FEIDfAGSP - Festuca idahoensis/Agropyron spicatum
This plant community is transitional between the Idaho fescue/bluebunch wheatgrass communities of the steep canyon slopes and the Idaho fescue/ ( kocr ) or Sandberg's bluegrass-(DAUN) gentle ridgetop communities. It is likely that associations on these ridgetops iire a result of overgrazing with

subsequent soil loss such that the junegass union of plants is unable to persist in the droughtier environment. These transitional Idaho fescuehluebunch wheatgrass communities usually occur adjacent to thinner soil sites dominated by Sandberg's bluegrass-DUAN, other communities to droughty for fescue, or deeper soils dominated by GEID-KOCR communities. The occurrence of significant dry rocky site plants in a fescue community is significant. Onespike oatgrass occurring with fescue is very indicative of this type.
Total forage production in late seral communities is only slightly more that that measured in POSA- DAUN scabtands. Bluebunch wheatgrass and Idaho fescue provide most of the forage in later seral stages. Very early seral communities typically provide half as much total forage: with fescue often completely absent.
Trampling damage may be most severe in saturated soils early in the season resulting in compaction and/or plant upheaval. Repeated heavy use pf these gentle slopes by wild and domestic ungulates at the early spring period may create retrogression. The principal increaser for the type is silky lupine which is toxic when seeds and fruits are eaten in quantity by cattle, horses, or sheep. These transitional communities are easily degraded with minimal use owing to their scant vegetative cover and location on wind-swept ridgetops. Fire may be difficult to use owing to the uneven nature of bunchgrass and the consequent difficulty in achieving consistent fire spread.
Degraded stands (overgrazing, rotational slumping) aften show increases in annual bromes , bulbous bfuegass, Kentucky bluegrass, lupines, fleabanes, phlox, yarrow, creamy buckwheat, red avens, cinquefoils, and milkvetches. Balsam roots and mule's ears form extensive stands on some sites that have been severely overgrazed.
Early grazing may deter seed formation and be detrimental to bunchgrass vigor if continued over several seasons. Early seral stages are likeIy from continued grazing on gentle slopes and ridgetops. More diverse mid-seral vegetation may be promoted by dual use of fire and grazing to achieve increased forbs and annual vegetation.
Floodplain/Riparian Communities (in Crowe and Clausnitzer, 1997)
Grand FidRocky Mountain Maple (Floodplains) -ABGR/ACGL - Abies grandidAcer glabpm
Physical Environment - The grand firlrocky Mountain maple-floodplain plant association occurs on low to mid-elevation streambanks, floodplains, and terraces in the northern and central portions of the study area. Elevations range fiarn 2500 to 4500 feet. Low to moderate gradient, V-shaped valleys over 1000 feet wide. Soils are silt Iums, sandy loams, and clay loams over gravel and cobbles. Depth to this course alluvium varies from 4 to f 6 inches. Stream types identified include Rosgen's A2a, A4, B2, B4, C3, and C4 types. Stream widths range Erom 1 -50 feet.
Vegetation Composition - Grand fir dominates the overstory in climax stands of the ABGWACGL- Floodplain association. Engelmann spruce is a late-sera1 overstory component with Douglas-fir, ponderosa pine, and western larch occurring earlier in the (Cliausnitze 1992). A diverse group of tall shrubs is characterized by Rocky Mountain maple. Mallow ninebark is a late-seraurninor climax shrub on some sites. Common snowberry, bald-hip rose, Lewis' mockorange, and western thimble-berry are occasionalIy abundant. Western serviceberry, birch-Ieded spirea, and oceanspray me common or well represented on about half the sites. While herbaceous richness is high in this association, most species have low abundance individually, Sweet-scented bedstraw is constant in the understory with mean coverage of 4%. Mountain sweet-cicily, woods strawberry, starry fdse-solomon's seal, trail plant, stream violet, heartleaf arnica, and baneberry are often associated in the understory.

Management Considerations - Rocky Mountain maple is an important browse species for wild ungulates and provides food cover for birds, squirrels, and chipmunks (Uchtyil 1989). Associated shrubs provide similar habitat for wildlife. These shrubs hinder rapid tree establishment in post-harvest communities. Silvicultural systems should consider appropriate treatments to affect plantation establishment. Streamside stands provide shade, woody debris, and stream bank stability for associated fish habitat.
USDI Wetland Classification
System - Palustrine Class - Forested Wetland Subclass - Needle-leaved Evergreen Water Regime - (nontidal) Temporarily Flooded to Intermittently Flooded.
Other Studies The ABGRTIACGL-Floodplain is defined as the riparian element of the ABGWACGL plant association (Steele and others 1981, Johnson and Simon 1987, Johnson and Clausnitzer 1992).
Douglas-fir/Cornmon Snowberry (Floodplains) - PSME/SYAL Psedostmga menziesii /Symphoricarpus albus
Physical Environment The Douglas-fir/Common Snowberry-Floodplain plant association was found in the northern portion of the study area at elevations from 3300-4500 feet. Floodplain and terrace sites are located I very narrow to very broad V-shaped valleys from 15 to 1000 feet wide. Low (1%) to very high (10%) gradient valleys were sampled. Soils generally consist of fine textured silt loam and loams over sandy loams, coarse sands, gravels, and cobbles. Distances from the surface to coarse alluvium range from 8 to 3 1 inches. Adjacent streams are 1 to 30 feet wide and classified as B3, C2, C3, or F4 stream types.
Vegetation Composition This floodplain association is dominated by Douglas-fir in the overstory. Sera1 tree species such as ponderosa pine or western larch are important overstory components in successional stands. Common snowberry is the most abundant shrub species under late-sera1 or climax conditions. Two species are abundant in sera1 tall shrub layers: water birch and black hawthorn. These shrubs will diminish in importance as stands move sucessionally toward Potential Natural Vegetation Red-osier dogwood, bald-hip rose, and western thimbleberry are important shrub components of this plant association. Sampled stands generally consist of mountain sweet-cicely, broad-petal strawberry, yarrow, northern bedstraw, and sweet-scented bedstraw in the forb layer. Important grasses and sedges include blue wifdrye, orcutt brome, Kentucky bluegrass, western fescue, elk sedge, and Dewey's sedge.
Management The PMSY/SYAL-Floodplain plant association provides habitat for an assortment of wildlife species. Passerines, grouse, woodpeckers, deer, elk, squirrels, chipmunks, cattle all utilize this habitat seasonally (Johnson and Clauksnitzer 1992). In addition, this streamside association provides shade, streambank stability, and woody debris for fish habitat in adjacent streams. Overuse by grazing animals will lead to reduction of snowberry abundance and an increase in Kentucky bluegrass. Some overgrazed sites are characterized by abundant western blue flag. Plant community components are fire-resistant and will resprout following fire. Insects and disease may impact overstory trees stressed by recurrent drought.
USDI Fish and Wildlife Service Classification S ysten - Palustrine Class - Forested Wetland Subclass - Needle-leaved Evergreen Water Regime - (non-Tidal) Temporarily Flooded to Intermittently Flooded.
Other Studies The PSME/SYSAL-Floodplain plant association has not been described.
Black Cattonwood/Common Snow berry - Floodplains - POTR2fSYAL Populoides trichwarpaiSymphoricargus albus
Physical Environment - Theis type occurs on lo elevation, gentle terraces along major rivers and streams. Valley widths are usually broad (300 - J ,000 feet), but this type has been sampled in the maderate width valleys of 100 feet. The community occupies deep alluvial soils of fine-textured surface horizons with sands, gravels, and rocks below. Sites are flooded infrequently, and the water table was below soil depths sampled on study plots. Mottling was evident, however, in one profile. Plots occurred along B2, C I , C4 and D3 Rosgen stream types. Stream widths varied from 5 - 1 0 0 feet.
Vegetation Composition - Black cottonwood dominates a tree overstory with conifers present in all layers. While irregular in occurrence, the conifer species (ponderosa pine, Douglas-fir, and grand fir) may indicate community potential on these terrace sites. The shrub component is dominated by common snowberry with scattered black hawthorn and western serviceberry creating a diverse shrub canopy beneath the cottonwood. The black hawthorn is seral in this community byt may form climax riparian stringers at lower elevations. Starry false-soIomon's seal is a regular member of the herbaceous understory. Less common in occurrence is butterweed groundsel, cowparsnip, sweet- scented bedstraw, and western meadowrue. Kentucky bluegrass, blue witdrye, and red fescue are abundant where they occur in the understory.
Management considerations - The shrub understory of this community type provides nesting habitat and food for both nongame and game birds while the overstory is used by woodpeckers, raptors, and other bird species for foraging, nesting, and roosting (Snyder 1991). Understory cottonwood and shrubs are browsed by both domestic and wild ungulates. Continuous and severe grazing results in a decline in the snowbeny component while Kentucky bluegrass increases in abundance. The overtstory of cottonwoods will decline in vigor onver time unless management alternatives are developed to maintain the seral nature of these stands.
USDX Fish and Wildlife Service Wetland Classification System - Palustrine Class - Forested Wetland Subclass - Broad-leaved deciduous Water Regime - (nontidal) Intermittently flooded.
Ponderosa PineKomrnon Snowberry-Floodplains - PIP6JSYAL Pinus Ponderosa/ Symphoricarpus albus
Physical Environment The ponderosa pine/common snowberry-floodplain association occurs on floodplains and terraces throughout the study area. It is found principally from 2800 to 5300 feet in elevation in V-shaped, trough-shaped, or flat-shaped low gradient valIeys. Valley widths range from very narrow (15 feet) to very broad (>1000). Soil texture varies from silt Ioams to sandy clay loams over sands, cobbles, and stones. Depth to cobble and stones ranges from 15 to 24 inches. Mottling was present in one-half of the sampled soil profiles. The water table was 27 inches below the surface in June-July. Rosgen stream types of B2, £33, B5, E3, and F4 were identified and stream widths varied from 5 to 30 feet.
Vegetation Composition Stands representing this association are dominated by ponderasa pine in the overstory and common snowberry in the shrub layer. Other trees occur rarely; Douglas-fir, grand fir, and quacking aspen are scarce and western juniper ~ccasionally well represented. Black hawthorn, a persistent early-sera1 s h b of this association, is abundant on some plots. The herbaceous layer is dominated by Kentucky

bluegrass, a naturalized Eurasian grass. Yarrow, broad-petal strawberry, northern bedstraw, northern cinquefoil, starry false-solomon' seal, and blue wildrye are occasionally well represented in the understory.
Management This type is similar to the PIPOISYAL plant association described in upland classifications, but is separated by its occurrence in stream bottoms and the occurrence of more music-site species (i.e., meadow rue and starry false-solomon's seal) in the community. These floodplain communities provide important habitat for deer, elk, game birds, songbirds, and woodpeckers, The streamside association may be a. valuable source of shade, woody debris, and stream stability for fish habitat. Livestock use the understory layer and can cause common snowberry to decline if n pattern of overs use is established (Kovalich 1987). Kentucky bluegrass will eventually dominate such communities.
USDI Wetland Classification
System CIassification - Palustine Class - Forested Wetland Subclass - Needle-leaved Evergreen Water Regime (NON-TIDAL) - Temporarily Flooded to Intermittently Flooded.
Other Studies The PIPOISYAL-Floodplain plant association was described for central Oregon by Kovalich (198'7). It appears related to the PIPO/PRVI habitat type of Hansen and others (1991).
Black Hawthorn - CRDO - Crataegus douglasii
Physical Environment The black hawthorn community type was sampled at low to moderate elevations in the Wallowa Mountains (Wallowa Valley and Pine RDs and Hells Canyon NRA Wallowa-Whitman NF). Valleys in which the black hawthorn community type occurs are low to gradient (1-7%), moderately wide, and V- or flat-shaped with moderately step to steep side slopes. Fluvial surpdces are terraces, floodplains, and most basins. Soils and Mollisols, Andisols, Entisols, and Inceptisols, consisting of silt loam to loamy gravel mineral material that ranges from 0 to more than 60 cm deep over the old stream bed. These sites are infrequently flooded as the water table is 2-5 ft. below the soil surface by mid summer. Rosgen stream types of adjacent streams are A3,33, B4, C2 and C3. Streams are 5-30 ft wide with less than 10% of the active channel affected by woody debris.
Composition - The black hawthorn communities that were sampled are disturbance-induced sera1 stages of various shrub and forest plan associations. Black hawthorn forms dense thicket over shrub understories of common snowberry, alder-leaved buckthorn, or mallow ninebark. These understory shrubs may indicate the potential vegetation on the site (e-g., ALLNISYAL, PSME/SYAL, PIPOISYAL, PSMERHMA). Herbaceous species include sweet-scented bedstraw, mountain sweet-cicily, woods' strawberry, western meadowrue, feathery Solomonplume, blue wildrye, and Kentucky bluegrass. The grasses often increase in cover with grazing under these strands. Black hawthorn may be a climax species in non-forested landscapes.
Management - Total dry herbaceous biomass ranged from 100 to 2301 (avg. 962) Ibs/acre. Black hawthorn foliage is readily eaten by livestock when it is available (Habeck 199 1). Common strawberry is browsed by deer, elk, and cattle. It is a nutritious species for cattle late in the season but probably sustains the least damage if grazed in the spring. Common snowberry reproduces mainly by rhizomes and can increase or decrease following heavy grazing depending on the season and yearly moisture conditions (Snyder 1991). Mallow ninebark i s little browsed by livestock and wild ungulates (Hakck 1992).

Although the above-ground plant parts of black hawthorn are killed by even low intensity fires, some plants may survive and resprout from the root crown. Fire can be used to reduce or contain a black hawthorn population (Habeck 199 1). Fires of low to moderate intensity will generally cause snowberry to sprout vigorously from its rhizomes. Severe fires may kill snowberry plants (Snyder 1991). Mallow ninebark is fire resistant and will resprout vigorously from horizontal rhizomes following fire (Habeck 1 992).
Black hawthorn is a valuable source of food and cover for wildlife. Fruits are eaten by blue and sharp- tailed grouse, mule deer, and small mammals. The dense branching in a hawthorn thicket provides good nesting for black-billed magpies and thrushes, long-eared owls, and other birds. Mice, voles, deer, and birds use hawthorn thickets for hiding and thermal cover (Habeck 1991). Snowberry provides good nesting cover for small mammals and many birds including grouse, wild turkeys, and various songbirds. The fruits are eaten by quail, pheasant, grouse, and other animals (Snyder 1991).
USDI Fish and Wildlife Service Wetland Classification System - Palustrine Class - Scrub-shrub Subclass - Broad-leaved Deciduous Water Regime - (non-tidal) Temporarily Flooded to Intermittently Flooded.
Other Studies Hansen and others (1991) described a Cratuegus succelenta community type for Montana that includes Craetagus dougiasii stands and is essentially tbe same community type as that described above.

Appendix C Habitat Suitability Curves

Downy Woodpecker Habitat Suitability Curves. - ---
V1: Basal Area I
I t
44 87
Basal Area {f?lac)
V2: Number of Snags 3 15 cm dbhl0.4 ha 6 inches dbhll.0 acre]
0 1 2 3 4
Number of Snags r t5 cm ctbhM.4 ha [> 6 inches dbW9 .O acre) I

Black-Capped Chickadee Habitat Suitability Curves.
V1: Percent Tree Canopy Closure -- V2: Average Height of Overstory Trees
'16 4 32.8 492 1 Average Height of QwrstDry Trees [ft) 1
V4: Number of SnagslAc (4-10" DBH) 1
1
Number of SnagdAc (4-10" DBH)

Blue Grouse Habitat Suitability Curves.
Vl : Percent canopy cover of evergreen and aspen trees over entire area
25 50 75
Percentage
V3b: Average height of herbaceous canopy i (summer)
0 -
I Height (cetltirnete~nches)
1 V3a: Percent Herbaceous Canopy Cover 1

Blue Grouse Habitat Suitability Curves Can't.
V3b: Average height of herbaceous canopy (summer)
I 0 12.7 25.4 38.1 50.8 63.5 76.288.9
0 1 5 10 15 20 25 30 35 40 45 50 / 55 60 Herg hth (centlrneterslinches)
L-
V3c: Diversity of herbaceous vegetation per Cover Type (number of species)
1 a Number of Species
1 t V4: Distance to Forest or Tree Savanna Cover
i Type
Distance (krnlm iles)

Great Blue Heron Habitat Suitability Curves.
V1: Distance Between Foraging Areas and Heronry Sites
Distance (km] 1: V2: No suitability curve. Presence of water body with suitable prey population and foraging substrate.
V3: No suitability curve. A disturbance-free zone up to 100 meters around potential foraging areas.
V4: No suitability curve. Presence of tree cover type within 250 meters of wetland. Trees provide suitable structure for nest sites.
V5: No suitability curve. Presence of 250 meter ( l a d ) or 150 meter (water) disturbance-fkee zone mound potential nest sites.
V6: Distance Between a Potential Nest Site and an Active Nest Site
1 a:: 10 15 20
I Distance [km)
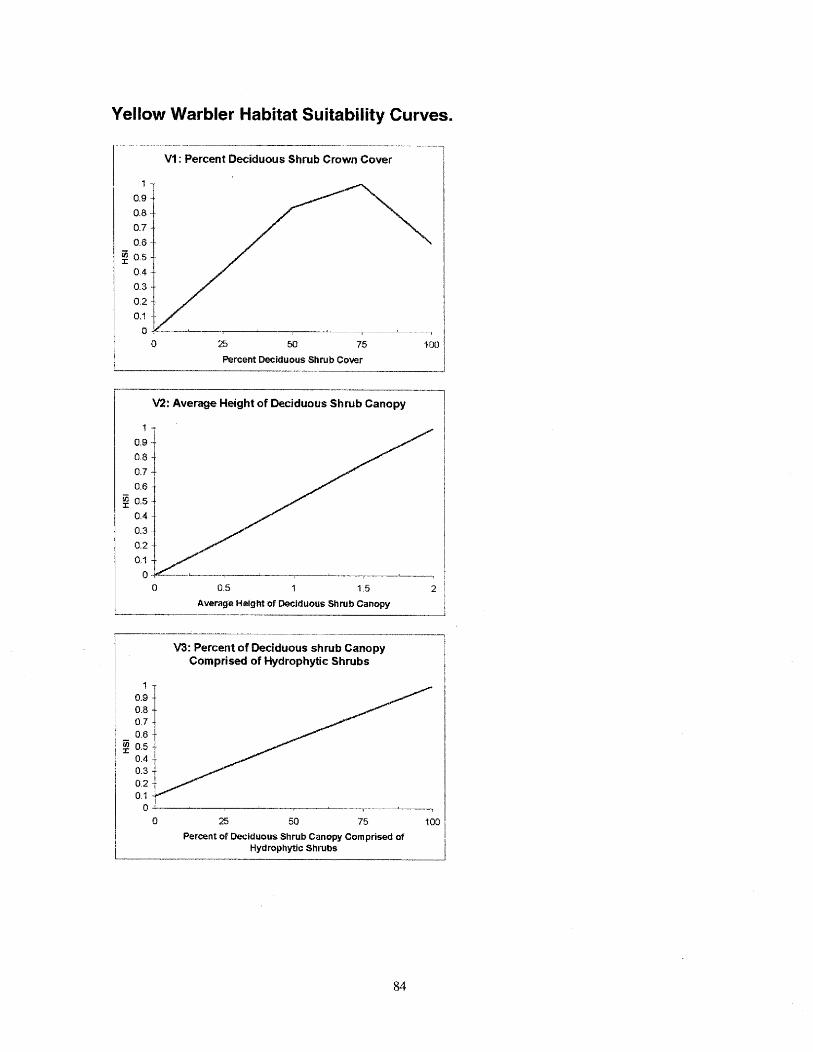
Yellow Warbler Habitat Suitability Curves.
r -.---
V1: Percent Deciduous Shrub Crown Cover 7 I
25 50 75
Percent Deciduous Shrub Cover
V2: Average Height of Deciduous Shrub Canopy
Average Height of Deciduous Shrub Canopy I
V3: Percent of Deciduous shrub Canopy Comprised of Hydrophytic Shrubs
0 I d 1
25 50 75 100
1 Percent of Deciduous Shrub Canopy Comprised of
i Hydraphytic Shrubs

Mink Habitat Suitability Curves.
I " --
Vl : Percent of Year With Surface Water -1
Percent of Ysar with Surface Water Present i
1 V2: Percent Tree Canopy Cover
L
0 25 50 75 1 00
Percent Tree Canopy Cover
V3: Percent Shrub Canopy Cover
25 50 75
Percent Shrub Canopy Cover

Mink Habitat Suitability Curves Con't. --
V4: Percent Canopy Cover of Emergent r -- Vegetation
I 0 m 50 75 loo i L Percent Canopy Cover of Emergent Vegetation
I V 5 Percent Canopy Cover of Trees and Shrubs within la0 m of the Wettands's Wdge I
I Percent Canopy cover of Trees and Shrubs within I00 m of 1 the Wetlands's Edge i

Western Meadowlark Habitat Suitability Curves.
V l : Percent Cover of Herbaceous Plants
Percent Canopy Cowr of Herbaceous Plants 1 V2: Percent Herbaceous Canopy Cover
Composed of Grass
D 10 20 30 40 50 69 70
Percent of Herbacwus Canopy Cover Camposed of Grass
V3: Average Height of Herbaceous Canopy I
0 7 14 21 28 35 1 Average Height of Herbaceous Canopy [in)
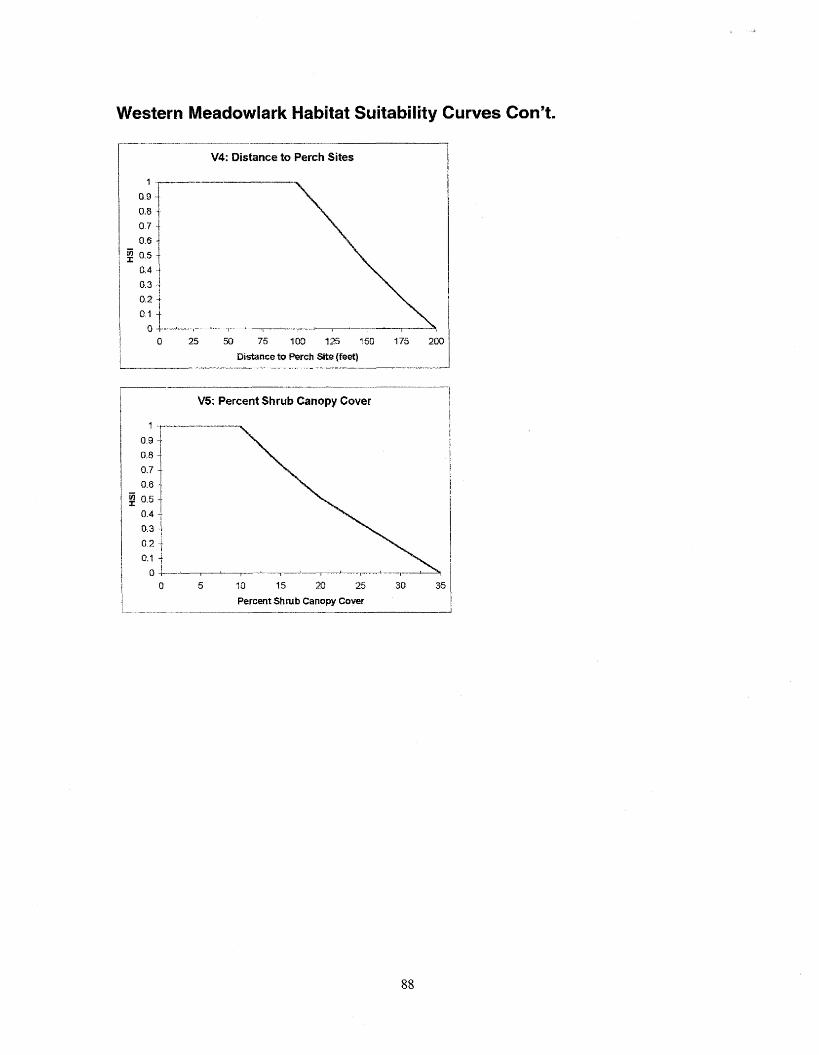
Western Meadowlark Habitat Suitability Curves Con't.
V4: Distance to Perch Sites
0 25 9 75 100 125 150 175
Distance to mrch Site (feet)
1 V5: Percent Shrub Canopy Cover
0 5 70 15 20 25 30
Percent Shrub Canopy Cover - -~