hanadi khadawardi - nvivo day 2
TRANSCRIPT

1 NVIVO University of Southampton
NVivo Workshop (Day 2)
Presented by Hanadi Khadawardi PGR Training - Faculty of Humanities

WORKSHOP AIMS (Day 2)
• Memos, annotation and links • Creating nodes • Coding to new nodes • Queries • Creating report • Creating models • Visualising: Chart
NVIVO University of Southampton 2

NVIVO University of Southampton
NVivo
3

Memos, annotation and links
1. Highlight a word, phrase or sentences that needs further definition
2. Right click 3. Select Links 4. Click Annotation 5. Click New Annotation 6. At the bottom of Detail
View in the Annotation tab enter to write your comments
NVIVO University of Southampton
https://www.youtube.com/watch?v=MtyzXTnw9Yw
4

Creating nodes
https://www.youtube.com/watch?v=4crQbeHKhtk
A node is made for each concept, theme, idea or category you find in your data. NVivo stores references to the coded data in the nodes. The source thus remains intact, even though the reference to the data is decontextualized. (Free Nodes/Tree Nodes)
NVIVO University of Southampton 5

Create nodes without coding to them initially
1. Right click on the node list pane
and select New Node
This displays the new free node dialog
1. Name the node 2. click OK The new node will be created in the node list.
NVIVO University of Southampton
Creating nodes
6

Coding to New Nodes (text)
1. Click on Sources from
the navigation pane 2. Chose a document 3. Double click to open the
document 4. find a sentence, word or
phrase which seems to suggest an idea or theme in your data.
5. Highlight the sentence. 6. Right click on the
selection
NVIVO University of Southampton 7

NVIVO University of Southampton
1. Right click on the highlighted content
2. Select Code Selection
3. Select selection at New Node
Coding to New Nodes (text)
8

The displays the New Node dialog box. 1. Type name for
your node 2. Click OK
NVIVO University of Southampton
Coding to New Nodes (text)
9

Coding to Nodes (Picture)
NVIVO University of Southampton
https://www.youtube.com/watch?v=domX-waoadA
1. Select part of the picture
2. Select Layout 3. Select Insert Row 4. Write comments 5. Adjust the
shading 6. Code the picture
and the comments
10

Coding to Nodes (Video)
NVIVO University of Southampton 11

Viewing a Node (Coding Stripes)
1. Select View 2. Click the
Coding Stripes button
3. Select the type of coding stripes required
NVIVO University of Southampton 12
Auto Coding
NVIVO University of Southampton
It is possible to automate coding in some circumstances. Where the text is from documents that have been structured using Microsoft Word’s heading styles, the Auto-code function can automatically code the documents to nodes based on the headings entered.
https://www.youtube.com/watch?v=8Z0CMiNzgSQ
13

Auto Coding
NVIVO University of Southampton
1. Click on Sources
2. Select all the documents to be auto-coded
3. Right click 4. Click on the
Auto code button
14

Auto Coding
The heading styles that you have created in the document will be displayed on the window on the left 1. Select the items to auto
code 2. Create that in New Node 3. Click OK When the auto coding has finished 1. Click on the Nodes
button. 2. The auto coded node will
be present in the list
NVIVO University of Southampton 15

Queries
Queries enable you to question your data to help you find patterns and unifying concepts. If coding is regarded as being the splitting up and decontextualising of your sources, then running queries is the recontextualisation and bringing together of your data into different patterns of understanding and deeper insight. There are five different types of query you can run in Nvivo; Coding Queries Text search Query Matrix Coding Queries compound query coding comparison query
NVIVO University of Southampton 16

Queries
http://help-nv10.qsrinternational.com/desktop/concepts/about_queries.htm
NVIVO University of Southampton 17

Text search Queries
Text queries enable you to search sources for specific words or phrases. 1. Click on Query in
the navigation view
2. Right click on the empty area
3. Click New Query 4. Select Text Search
https://www.youtube.com/watch?v=CkRXmwqjATk
NVIVO University of Southampton 18

Text Queries
1. Type the word
2. Choose the source
3. Click Run
NVIVO University of Southampton 19

20
Text Queries
NVIVO University of Southampton

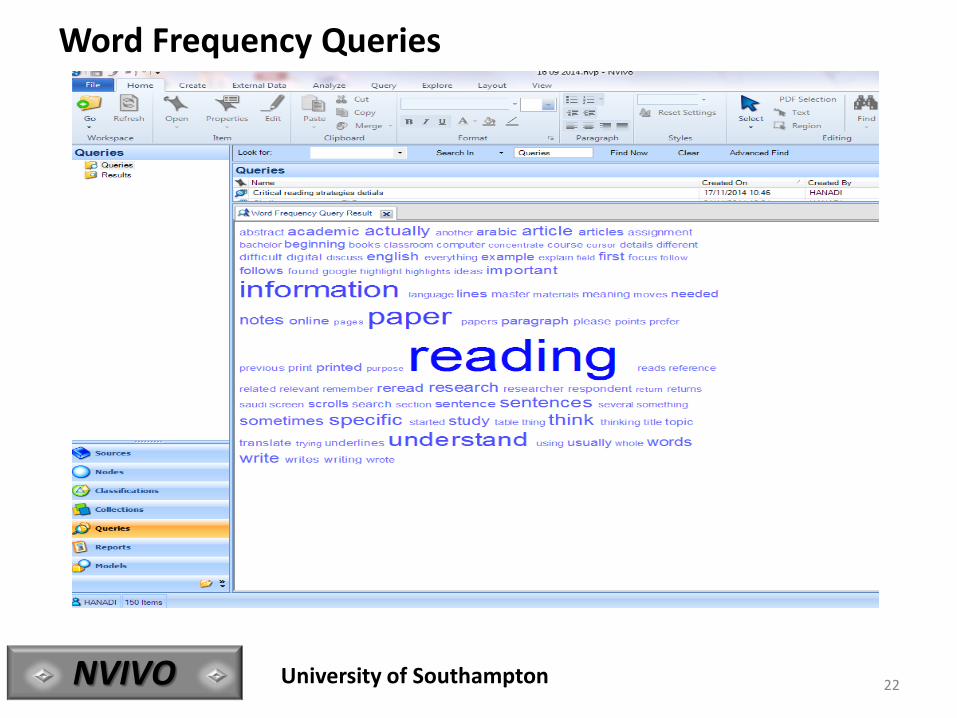
Word Frequency Queries
https://www.youtube.com/watch?v=vb76fkNYwGU
1. Click Query tap 2. Select word
frequency 3. Only exact word 4. Select the sources 5. Choose a certain
number of the most frequently words ex. (50)
6. Set up the minimum length of the word character, ex. 4
University of Southampton NVIVO 21
22
Word Frequency Queries
NVIVO University of Southampton

Coding Queries
Looks for the intersection between two nodes or between a node and an attribute, in order to explore some questions
https://www.youtube.com/watch?v=M2_wGRrGwx8
https://www.youtube.com/watch?v=_N4lCuPrAfg
NVIVO University of Southampton 23

Coding Queries
1. Click on Queries in the navigation pane
2. Right click on the list pane.
3. Select New Query
4. Select Coding
NVIVO University of Southampton
https://www.youtube.com/watch?v=M2_wGRrGwx8
24

Matrix Coding Queries
Matrix coding queries enable you to compare what different demographic groups may have said about a topic. You can therefore find out what different groups may have said about an experience or event, and compare reactions between groups. The matrix coding query produces a cross tabulation. Usually, the results of a node (or nodes) give the rows of the matrix, and the attributes the columns.
https://www.youtube.com/watch?v=9l00TGaEIz4
https://www.youtube.com/watch?v=a6mqjNl1UWE
NVIVO University of Southampton 25

1. Select Matrix Coding
2. Select the Rows 3. Select the
Columns
Matrix Coding Queries
NVIVO University of Southampton 26

Creating report
NVIVO University of Southampton
One of the important things to do during a project is to take a step back and review your progress and whether it matches your research question. There are a number of tools which help you do this in NVivo.
https://www.youtube.com/watch?v=C3y4tcgM7pI
http://help-nv10.qsrinternational.com/desktop/procedures/create_reports_using_the_report_wizard.htm
27

Creating report
1. Click on the Reports button
2. Select the Node Summary Report
3. Right click on the report
4. Choose Run Report
NVIVO University of Southampton 28

Creating report
NVIVO University of Southampton
Export the report to a word document.
29

A model is a way of visualising your data and the connections between it. It is very easy, while analysing your data to loose track on the overall view and interconnectedness of the information. Models are a way of stepping back and taking a broader view. Models can also be used in the design stage of your project, as a means of exploring the conceptual space you will be working in.
NVIVO University of Southampton
Create Models
https://www.youtube.com/watch?v=nUBu-eQ40NA
30

Create Models
1. Click on Models in the navigation view,
2. Right click in the list view area
3. Select New Model…
NVIVO University of Southampton 31

Create Models
NVIVO University of Southampton 32

33
Visualising: Chart
NVIVO University of Southampton
https://www.youtube.com/watch?v=3UFgzDdKXbw

34 NVIVO University of Southampton
Visualising: Chart
• Export the chart

Qualitative Data Analysis with NVivo edited by Patricia Bazeley, Kristi Jackson https://books.google.co.uk/books?id=Px8cJ3suqccC&printsec=frontcover&dq=nvivo&hl=en&sa=X&ei=h_oJVfWUHuOz7gbDpoDQBw&ved=0CDMQ6AEwAA#v=onepage&q=nvivo&f=false NVivo 10 Essentials By Bengt Edhlund, Allan McDougall https://books.google.co.uk/books?id=8xH_AwAAQBAJ&pg=PA18&dq=nvivo+10&hl=en&sa=X&ei=O_sJVYGYHsy67gaJhIHoDA&ved=0CDoQ6AEwAQ#v=onepage&q=nvivo%2010&f=false Research Methods in Second Language Acquisition: A Practical Guide edited by Alison Mackey, Susan M. Gass https://books.google.co.uk/books?id=h8LTZ4eyF7QC&pg=PA229&dq=nvivo+10&hl=en&sa=X&ei=O_sJVYGYHsy67gaJhIHoDA&ved=0CGMQ6AEwCA#v=onepage&q=nvivo%2010&f=false
References
35 NVIVO University of Southampton
