hapmap and association studies for complex diseases two examples augustine kong
TRANSCRIPT

HapMap and Association Studies for Complex Diseases
Two Examples
Augustine Kong

Mapping of a susceptibility gene for Type 2 Diabetes Mapping of a susceptibility gene for Type 2 Diabetes
Reynisdottir et al, AJHG 2003;73:323-35• Also observed in Mexican Americans

Locus-wide association studyLocus-wide association study
• High density of markers – 10.5 Mb region
• Typed 228 microsatellite markers
• Average density = one marker every 46 kb
• 1185 T2D patients and 931 population controls

AlleleAffected freq
(n=1185)Control freq
(n=931)Relative Risk
(multiplicative) Two sided p-val
0 0.636 0.724 0.67 2.1×10⁻⁹
4 0.005 0.002 2.36 0.12
8 0.093 0.078 1.21 0.09
12 0.242 0.178 1.48 4.6×10⁻⁷
16 0.022 0.015 1.53 0.076
20 0.001 0.003 0.39 0.17
DG10S478 : Iceland DG10S478 : Iceland

DG10S478 : IcelandDG10S478 : Iceland
• DG10S478 genotyped in the CEPH Utah (CEU) HapMap samples– SNP1 - allele G - correlated with allele 0 of DG10S478 (R2 = 0.95, P = 5.53×10-38)– SNP1 - allele T - correlated with the other alleles
• Risk conferred by alleles 8 and 12 of DG10S478 do not differ significantly (P = 0.3).
• Phylogenetic analysis of haplotypic variation within the LD block where DG10S478 resides
– all haplotypes carrying DG10S478 non-0 alleles and SNP1 T in the CEU samples belong to a single, clearly defined monophyletic lineage – i.e. they share a relatively recent common ancestor within the phylogeny
• Reasonable to collapse all the non-0 alleles of DG10S487 into composite allele X.

AlleleAffected freq
(n=1185)Control freq
(n=931)Relative Risk
(multiplicative) Two sided p-val
0 0.636 0.724 0.67 2.1×10⁻⁹
4 0.005 0.002 2.36 0.12
8 0.093 0.078 1.21 0.09
12 0.242 0.178 1.48 4.6×10⁻⁷
16 0.022 0.015 1.53 0.076
20 0.001 0.003 0.39 0.17
X 0.364 0.276 1.50 2.1×10⁻⁹
DG10S478 : Iceland DG10S478 : Iceland

Allele Affected freq (n=228) Control freq (n=539)Relative Risk
(multiplicative) One sided p-val
0 0.669 0.740 0.71 0.0024
4 0.002 0.004 0.59 0.310
8 0.070 0.048 1.49 0.046
12 0.239 0.190 1.34 0.016
16 0.020 0.018 1.12 0.390
X 0.331 0.260 1.41 0.0024
DG10S478 : DenmarkDG10S478 : Denmark

Allele Affected freq (n=361) Control freq (n=530)Relative Risk
(multiplicative) One sided p-val
-4 0.001 0.000 - -
0 0.615 0.747 0.54 1.7×10⁻⁹
4 0.003 0.004 0.73 0.358
8 0.085 0.049 1.79 0.001
12 0.256 0.180 1.57 6.2×10⁻⁵
16 0.040 0.020 2.07 0.006
X 0.385 0.253 1.85 1.7×10⁻⁹
DG10S478 : USA DG10S478 : USA

Genotype RR
Cohort 00 0X XX PAR
Iceland 1 1.41 2.27 0.21
Denmark 1 1.37 1.92 0.17
USA 1 1.64 3.29 0.28
Combined 1 1.45 2.41 0.21
DG10S478 : DG10S478 : Estimates of the Genotype relative risksEstimates of the Genotype relative risks
• Estimated relative risks between cohorts - not significantly different (P > 0.05)
• Combining the results from all 3 cohorts yields an overall two-sided P of 4.6×10⁻¹⁸
– Given that the original 228 microsatellite markers tested have a total of 1664 alleles and allele X is the complement of allele 0, applying Bonferonni adjustment gives a P of 7.7×10⁻¹⁵

Only one gene in the LD BlockOnly one gene in the LD BlockTCF4TCF4 (official gene symbol: (official gene symbol: TCF7L2TCF7L2))
DG10S478

Correlation of five selected HapMap SNPs with DG10S478Correlation of five selected HapMap SNPs with DG10S478(with highest R(with highest R22 among the Phase I SNPs) among the Phase I SNPs)
CEPH Utah HapMap cohort Combined Icelandic and US cohorts
R2 R2
SNP1 0.95 0.93
SNP2 0.78 0.72
SNP3 0.61 0.65
SNP4 0.43 0.44
SNP5 0.42 0.45

Association of the at-risk alleles of the five selected HapMap SNPs Association of the at-risk alleles of the five selected HapMap SNPs and the composite allele X of DG10S478 to T2D in both Iceland and and the composite allele X of DG10S478 to T2D in both Iceland and
the US the US
• All five SNPs show association to T2D, but none exhibit stronger association to T2D than DG10S478
• Strength of the association to T2D corresponds monotonically to the correlation between each SNP and DG10S478
Subsets: Iceland (331 patients, 320 controls) US (226 patients, 210 controls)

Further Search of the Causal VariantFurther Search of the Causal Variant
DG10S478
• Exon 4 mutation ruled out• All other exonic mutations ruled out• Pooled sequencing across LD block reveals no better SNP
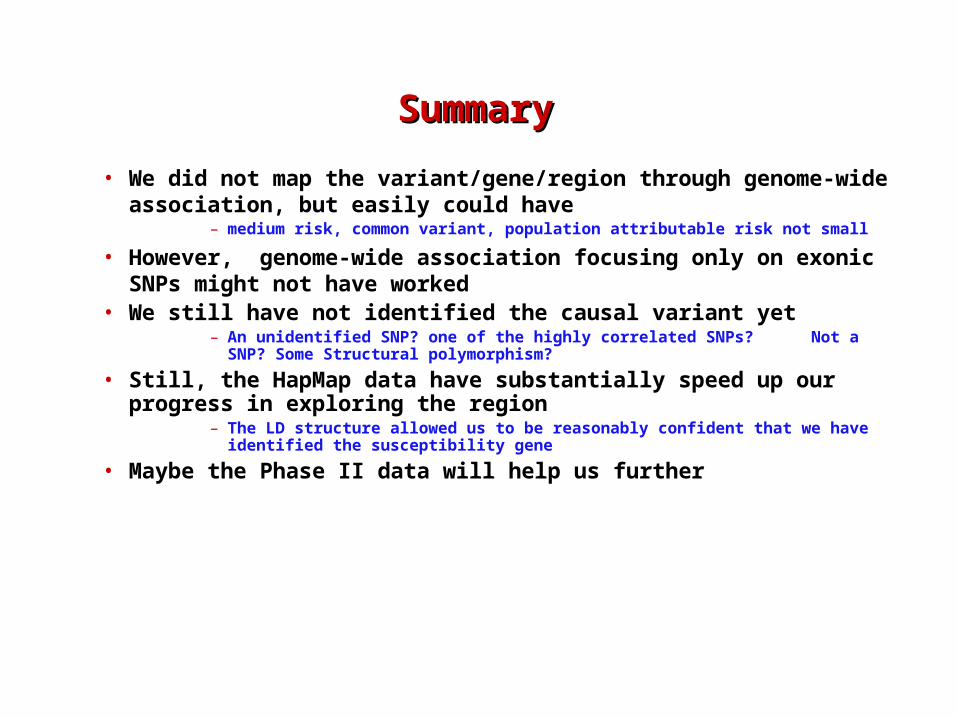
• We did not map the variant/gene/region through genome-wide association, but easily could have
– medium risk, common variant, population attributable risk not small
• However, genome-wide association focusing only on exonic SNPs might not have worked
• We still have not identified the causal variant yet– An unidentified SNP? one of the highly correlated SNPs? Not a SNP? Some
Structural polymorphism?
• Still, the HapMap data have substantially speed up our progress in exploring the region
– The LD structure allowed us to be reasonably confident that we have identified the susceptibility gene
• Maybe the Phase II data will help us further
SummarySummary

Variant of a gene located on chromosome 10q confers Variant of a gene located on chromosome 10q confers risk of type 2 diabetes mellitus risk of type 2 diabetes mellitus
Saturday Session #63Saturday Session #63
Struan F.A. Grant1, G. Thorleifsson1, I. Reynisdottir1, R. Benediktsson2,3, A. Manolescu1, J. Sainz1, H. Stefansson1, V. Emilsson1, A. Helgadottir1, U. Styrkarsdottir1, M.P. Reilly4, D.J. Rader4, Y. Bagger5, C. Christiansen5, V. Gudnason2, G. Sigurdsson2,3, U. Thorsteinsdottir1, J.R. Gulcher1, A. Kong1, K. Stefansson1
1) deCODE Genetics, Reykjavik, Iceland; 2) Icelandic Heart Association, Reykjavik, Iceland; 3) Landspitali-University Hospital, Reykjavik, Iceland; 4) University of Pennsylvania Health System, Philadelphia, USA; 5) Center for Clinical and Basic Research A/S, Ballerup, Denmark

Leukotriene A4 Hydrolase (LTA4H) gene Candidate Gene for Myocardial Infarction
Resides in one LD block where there is no other gene
LTA4H structure with exons shown as colored cylinders, and the position of all genotyped SNPs relative to exons shown as green lines. The SNPs and alleles defining HapK are SG12S16 (C) (positioned in NCBI human assembly build 34 on chr. 12 94.896055 Mb), rs2660880 (G), rs6538697 (T), rs1978331 (A), rs17677715 (T), rs2247570 (T), rs2660898 (T), rs2540482 (C), rs2660845 (G), and rs2540475 (G), respectively. The relative position of SNPs typed in the HapMap project (Phase I, version 16c.1) are shown as grey lines.
10 SNPs from sequencingcapturing the haplotype diversity
HapMap SNPs
defines HapK

Frequency of HapK
Cohorts (n) Patients Controls RR P-value
Icelanders
All MI (1553/863) 0.113 0.104 1.1 0.36
MI and additional CVD (325/863) 0.145 0.104 1.45 0.0091
Icelandic Association
Additional CVD – Peripheral vascular disease and/or Stroke
P-value of 0.0091 becomes 0.035 after adjusting for multiple haplotyes tested
Marginal significance and very modest risk. Needs replication!

Frequency of HapK
Cohorts (n) Patients Controls RR P-value b
European Americans
Philadelphia
All MI (728/430) 0.186 0.143 1.37 0.0051
Cleveland
All MI (627/792) 0.166 0.151 1.12 0.15
MI and additional CVD (144/792) 0.193 0.151 1.34 0.046
Atlanta
All MI (236/553) 0.135 0.143 0.94 0.64
MI and additional CVD (39/553)
CombinedAll MI coh adj (cohort adjustment, Mantel-Haenszel)
MI and additional CVDa coh adj
0.173 0.143 1.25
1.161.31
0.25
0.0180.037
a Additional CVD, Cleveland and Atlanta cohorts only; no information for Philadelphiab P-values for replication are one-sided
Replication Cohorts: European Americans

Frequency of HapK
Cohorts (n) Patients Controls RR P-value
African Americans
Philadelphia
All MI (105/127) 0.103 0.017 6.5 0.000067
Cleveland
All MI (53/111) 0.122 0.072 1.78 0.11
MI and additional CVD (13/111) 0.152 0.072 2.31 0.14
Atlanta
All MI (39/149) 0.075 0.015 5.21 0.018
MI and additional CVD (8/149) 0.202 0.015 16.36 0.0039
African Americans
Is this real or is this a consequence of some bias such as imperfect matching ofcases and controls? Note that frequency of HapK is substantially lower in theAfrican Americans compared to the European Americans.

Haplotype Diversity in the HapMap SamplesBig differences among populations
CEU (60) HCB (45) JPT (45) YRI (60)
Haplotype (10 SNPs) Frq Frq Frq Frq
CGTATTTTAG 37.50% 3.30% 3.00% 8.20%
CGTATTTCGG 18.30% 36.80% 50.30% -
CGCGTTGTAG 7.50% 2.00% 4.40% 13.10%
TGTGCCGTAA 7.00% 1.10% - -
TGTGCCGCGG 5.80% - - -
TATGTCGTAA 3.50% - - -
CGTGTCTTGG 3.10% - - 8.20%
CGTGTCTTAG 2.60% 2.30% 10.70% 23.90%
CGTATTTTAA 2.50% 2.10% 2.80% 1.80%
CGTGTTTTGG 2.50% - - 2.70%
CATGTCGTAA 1.80% - - -
CGTATTTCAG 1.70% 1.10% - -
CGTGTCGTGG 1.00% - - -
TATGTCGTAG 0.90% - - -
TGTGCCGTAG 0.90% - - -
CGCGTTGTAA 0.80% 29.50% 17.20% -
CGTATTTCGA 0.80% 2.60% 1.80% 0.80%
CGTGTTTTAG 0.80% - - 10.70%
others 0.00% 19.00% 9.80% 27.00%
HapK

A phylogenetic network representing the genealogical relationship between haplotypes in the LTA4H region (based on the HapK SNPs which we typed for the HapMap samples plus the HapMap SNPs)
Investigating Ancestry and Admixture Investigating Ancestry and Admixture FractionsFractions
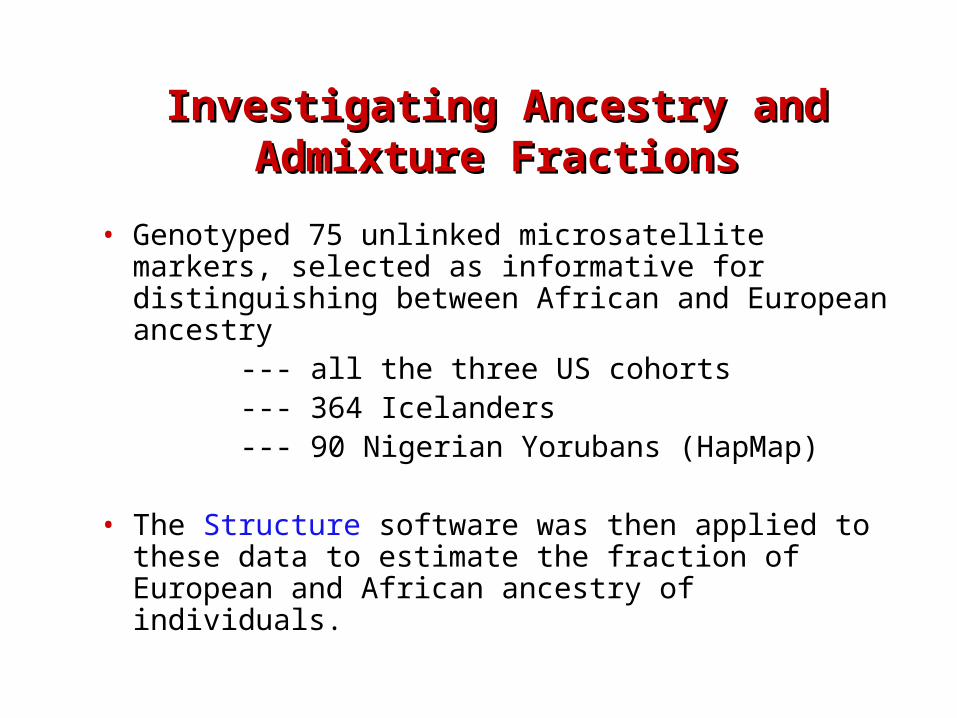
• Genotyped 75 unlinked microsatellite markers, selected as informative for distinguishing between African and European ancestry
--- all the three US cohorts --- 364 Icelanders --- 90 Nigerian Yorubans (HapMap)
• The Structure software was then applied to these data to estimate the fraction of European and African ancestry of individuals.

Distribution of estimated individual European ancestry b
Cohort
Self-Reported Ethnicity
Disease status
WLS group estimate of European ancestry
(Std. Err.)a Mean
Std. Deviatio
n Median
25-75 percentile
range
Yoruban Nigerians
African N/A N/A 0.036 0.024 0.03 0.019-0.043
Iceland Eur. N/A N/A 0.991 0.015 0.994 0.990-0.996
All American
Eur. Am. Patients 0.98 (0.0083) 0.965 0.083 0.991 0.977-0.995
All American
Eur. Am. Controls 0.979 (0.0079) 0.969 0.07 0.992 0.979-0.995
All American
Afr. Am. Patients 0.243 (0.0138) 0.223 0.184 0.178 0.108-0.282
All American
Afr. Am. Controls 0.213 (0.016) 0.199 0.145 0.174 0.094-0.267
Philadelphia Afr. Am. Patients 0.252 (0.0178) 0.235 0.195 0.188 0.121-0.288
Philadelphia Afr. Am. Controls 0.213 (0.0217) 0.186 0.137 0.157 0.082-0.257
Cleveland Afr. Am. Patients 0.232 (0.0222) 0.21 0.174 0.16 0.096-0.282
Cleveland Afr. Am. Controls 0.239 (0.0219) 0.223 0.136 0.191 0.127-0.281
Atlanta Afr. Am. Patients 0.226 (0.0246) 0.206 0.166 0.167 0.098-0.283
Atlanta Afr. Am. Controls 0.198 (0.0128) 0.193 0.155 0.161 0.086-0.252
Distribution of genetically determined European ancestry in MI case-control cohorts

Adjusting for Ancestry and Admixture Adjusting for Ancestry and Admixture FractionsFractions
• The African American patients do have on average a slightly higher fraction of European ancestry compared to controls
--- 22.3% versus 19.9%• Difference can largely be accounted for by a handful of
individuals who have a relatively large estimated European ancestry. Removing them
--- 20.0% versus 19.2%• Either by excluding potentially misclassified individuals or by
using individual ancestry estimates as covariate (Pritchard et al AJHG 2000), the impact on the association results is very modest

Frequency of HapK
Cohorts (n) Patients Controls RR P-value
African Americans
Philadelphia
All MI sre (105/127) 0.103 0.017 6.5 0.000067
All MI admix adj 6.34 0.0001
Cleveland
All MI sre (53/111) 0.122 0.072 1.78 0.11
All MI admix adj 1.75 0.11
MI and additional CVD sre (13/111) 0.152 0.072 2.31 0.14
MI and additional CVD admix adj 2.27 0.16
Atlanta
All MI sre (39/149) 0.075 0.015 5.21 0.018
All MI admix adj 5.08 0.019
MI and additional CVD sre (8/149) 0.202 0.015 16.36 0.0039
MI and additional CVD admix adj 16.67 0.0035
sre: self reportedadmix adj: admixture adjustment using estimated European ancestry as covariate

Frequency of HapK
Ethnic groups (n) Patients Controls RR (95% CI) P-value PAR
European Americans
All MI (1591/1775) 0.171 0.148 1.19 (1.04, 1.36) 0.006
All MI coh adj, admix adj 1.16 (1.01, 1.34) 0.017 0.05
MI and additional CVD (183/1345) b 0.192 0.15 1.35 (1.00, 1.81) 0.026
MI and additional CVD coh adj, admix adj 1.32 (0.98,1.78) 0.035 0.09
African Americans
All MI (197/387) 0.105 0.032 3.52 (1.96, 6.29) 1.2×10⁻⁵
All MI coh adj, admix adj 3.50 (1.90, 6.43) 2.9×10⁻⁵ 0.14
MI and additional CVD (21/260) b 0.176 0.041 4.94 (1.58, 15.43) 0.003
MI and additional CVD coh adj, admix adj 4.17 (1.21, 14.30) 0.012 0.22
b Cleveland and Atlanta cohorts only; information from Philadelphia not available
Combining results from the three American cities
Note that for All MI, the RR confidence intervals for the European Americans and African Americans do not overlap (P < 0.001)

SummarySummary
• A variant/haplotype apparently European in origin confers much higher risk of MI in African Americans than in European Americans
• An Example of gene-gene(s) interaction? --- requires further investigations• Ethnicity can sometimes be a useful, but
imperfect, surrogate for certain genetic variants or combination of genetic variants.

A variant of the gene encoding Leukotriene A4 Hydrolase confers ethnic specific risk of myocardial infarction
Poster # 962
Anna Helgadottir1, Andrei Manolescu1, Agnar Helgason1, Gudmar Thorleifsson1, Unnur Thorsteinsdottir1, Daniel F. Gudbjartsson1, Solveig Gretarsdottir1, Kristinn P. Magnusson1, Gudmundur Gudmundsson1, Andrew Hicks1, Thorlakur Jonsson1, Struan F. A. Grant1, Jesus Sainz1, Stephen J. O’Brien2, Sigurlaug Sveinbjornsdottir3, Einar M. Valdimarsson3, Stefan E. Matthiasson3, Allan I. Levey4, Gudmundur Thorgeirsson3, Jerome L. Abramson4, Murdach Reilly5, Viola Vaccarino4, Megan Wolfe5, Vilmundur Gudnason6, Arshed A. Quyyumi4, Eric J. Topol7, Daniel J. Rader5, Jeffrey R. Gulcher1, Hakon Hakonarson1,Augustine Kong1, Kari Stefansson1.
1deCODE genetics Inc, Reykjavik, Iceland 2Laboratory of Genomic Diversity, National Cancer Institute.3National University Hospital, Reykjavik, Iceland 4Emory University School of Medicine, Atlanta, GA,USA5University of Pennsylvania School of Medicine, Philadelphia, PA, USA 6Icelandic Heart Association, Reykjavik, Iceland7Cleveland Clinic Foundation, Cleveland, OH, USA