harnessing community assets to improve transport ... · the transformation of nsw’s ... 8 mckell...
TRANSCRIPT

THEMcKellInstitute
THEMcKellInstitute
T H E M C K E L L I N S T I T U T E
Two Birds, One StoneHarnessing Community Assets to Improve Transport Connectivity in New South Wales.
M A Y 2 0 1 6
THEMcKellInstitute
THEMcKellInstitute
1. IntroductionAbout the McKell Institute The McKell Institute is an independent, not-for-profit, public policy institute dedicated to developing practical policy ideas and contributing to public debate. The McKell Institute takes its name from New South Wales’ wartime Premier and Governor–General of Australia, William McKell.
William McKell made a powerful contribution to both New South Wales and Australian society through significant social, economic and environmental reforms.
For more information phone (02) 9113 0944 or visit www.mckellinstitute.org.au
Background This report has been funded directly by The McKell Institute and has not been commissioned by any of our sponsors or supporters. The authors of this paper have utilised a range of publicly available information and our own analysis in compiling this paper.
The opinions in this report are those of the authors and do not necessarily represent the views of the McKell Institute’s members, affiliates, individual board members or research committee members. Any remaining errors or omissions are the responsibility of the authors.
THEMcKellInstitute
THEMcKellInstitute

T H E M C K E L L I N S T I T U T E
THEMcKellInstitute
Two Birds, One StoneHarnessing Community Assets to Improve Transport Connectivity in New South Wales.
M A Y 2 0 1 6
4
M C K E L L I N S T I T U T E Two Birds, One Stone: Harnessing Community Assets to Improve Transport Connectivity in New South Wales.
ContentsForeword ..........................................................................................................................................................................................................6
Executive Summary ..................................................................................................................................................................................7
Introduction ....................................................................................................................................................................................................8
Sydney’s Buses ...................................................................................................................................................................................10
Park & Ride Facilities .........................................................................................................................................................................10
Recommendations .............................................................................................................................................................................11
Section 1 - Sydney’s Traffic Problem .........................................................................................................................................13
Congestion ............................................................................................................................................................................................13
Driving to Work ....................................................................................................................................................................................14
Transport Disadvantage ...................................................................................................................................................................15
An Ageing Population .......................................................................................................................................................................15
Sydney’s Public Transport System is Underutilised ...............................................................................................................16
Utilisation Rates ...................................................................................................................................................................................17
Section 2 – Harnessing Community Vehicles to Enhance Transport Network Interconnectivity ....18
The NSW Bus System ......................................................................................................................................................................18
Existing Private Contracts ..............................................................................................................................................................18
Cost of Bus Procurement and Maintenance ...........................................................................................................................21
Future Strategy of the Bus System .............................................................................................................................................22
Integrated Network Model .............................................................................................................................................................24
Local Bus Routes ..............................................................................................................................................................................24
Failures of the Current Bus System ............................................................................................................................................24
Community Transport ......................................................................................................................................................................26
Community Transport in Rural and Regional NSW ...............................................................................................................26
Utilisation of Community and Privately-owned Shuttle Buses in the NSW Bus Network .......................................27
Club Courtesy Buses .......................................................................................................................................................................27

5
M C K E L L I N S T I T U T E Two Birds, One Stone: Harnessing Community Assets to Improve Transport Connectivity in New South Wales.THEMcKellInstitute
Nursing Home Buses .......................................................................................................................................................................28
School Buses ......................................................................................................................................................................................29
Community Transport Accreditation ...........................................................................................................................................30
Section 3 - Encouraging Public-Private Partnerships to Improve Transport Network Accessibility and Ridership .......................................................................................................................................31
Park & Ride Facilities ........................................................................................................................................................................31
Existing Park & Ride Facilities in NSW .......................................................................................................................................32
Bankstown Sports Early Bird Parking Facility .........................................................................................................................33
Proposed M4 Park & Ride .............................................................................................................................................................33
Sydney Olympic Park & Ride ........................................................................................................................................................33
Rosehill Racecourse Park & Ride ................................................................................................................................................34
Section 4 – Regions That Would Benefit from Additional Connectivity .............................................................35
URBAN CASE STUDIES ...............................................................................................................................................................35
Sydney’s Inner-West .........................................................................................................................................................................35
Toongabbie ..........................................................................................................................................................................................35
Sutherland Shire ................................................................................................................................................................................36
Rooty Hill ..............................................................................................................................................................................................36
Hills Shire ..............................................................................................................................................................................................37
REGIONAL CASE STUDIES ........................................................................................................................................................39
Newcastle & Hunter Region ..........................................................................................................................................................39
Wollongong & Illawarra Region ....................................................................................................................................................39
Port Kembla ........................................................................................................................................................................................39
Thirroul ..................................................................................................................................................................................................40
Uralla ......................................................................................................................................................................................................41
Concluding Remarks .............................................................................................................................................................................42
References ..................................................................................................................................................................................................44
THEMcKellInstitute
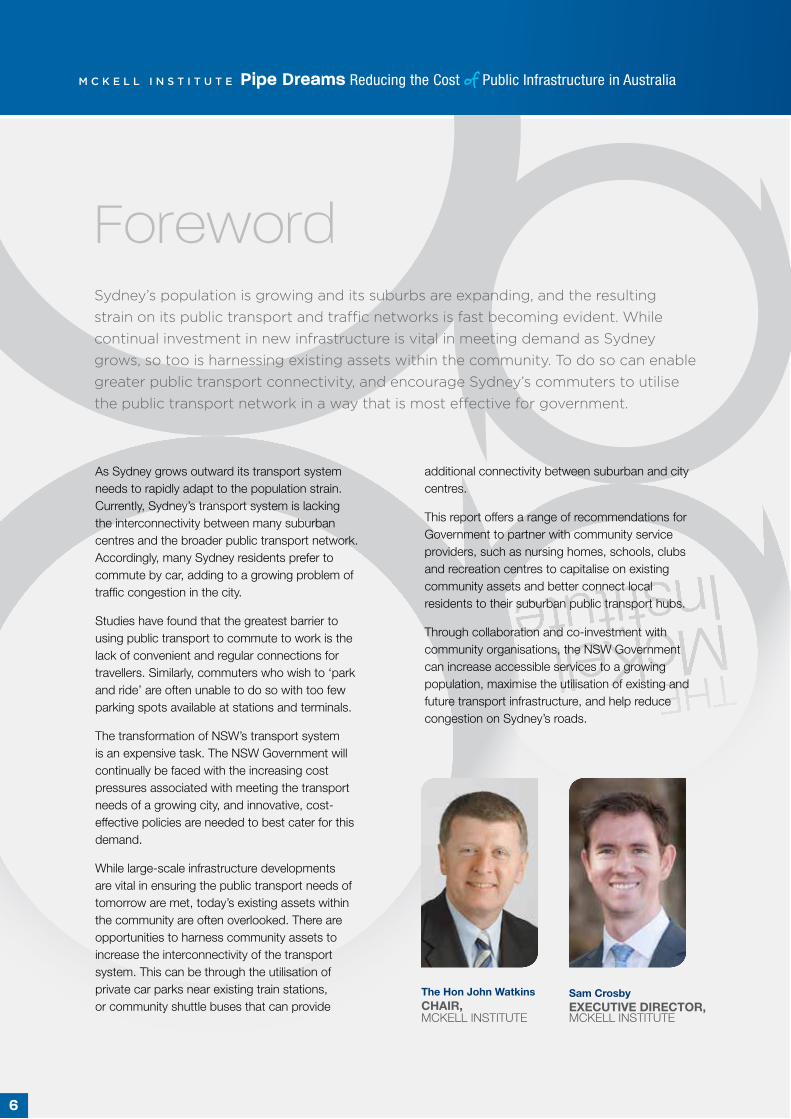
As Sydney grows outward its transport system needs to rapidly adapt to the population strain. Currently, Sydney’s transport system is lacking the interconnectivity between many suburban centres and the broader public transport network. Accordingly, many Sydney residents prefer to commute by car, adding to a growing problem of traffic congestion in the city.
Studies have found that the greatest barrier to using public transport to commute to work is the lack of convenient and regular connections for travellers. Similarly, commuters who wish to ‘park and ride’ are often unable to do so with too few parking spots available at stations and terminals.
The transformation of NSW’s transport system is an expensive task. The NSW Government will continually be faced with the increasing cost pressures associated with meeting the transport needs of a growing city, and innovative, cost-effective policies are needed to best cater for this demand.
While large-scale infrastructure developments are vital in ensuring the public transport needs of tomorrow are met, today’s existing assets within the community are often overlooked. There are opportunities to harness community assets to increase the interconnectivity of the transport system. This can be through the utilisation of private car parks near existing train stations, or community shuttle buses that can provide
additional connectivity between suburban and city centres.
This report offers a range of recommendations for Government to partner with community service providers, such as nursing homes, schools, clubs and recreation centres to capitalise on existing community assets and better connect local residents to their suburban public transport hubs.
Through collaboration and co-investment with community organisations, the NSW Government can increase accessible services to a growing population, maximise the utilisation of existing and future transport infrastructure, and help reduce congestion on Sydney’s roads.
Sydney’s population is growing and its suburbs are expanding, and the resulting strain on its public transport and traffic networks is fast becoming evident. While continual investment in new infrastructure is vital in meeting demand as Sydney grows, so too is harnessing existing assets within the community. To do so can enable greater public transport connectivity, and encourage Sydney’s commuters to utilise the public transport network in a way that is most effective for government.
Foreword
The Hon John WatkinsCHAIR, MCKELL INSTITUTE
Sam CrosbyEXECUTIVE DIRECTOR, MCKELL INSTITUTE
M C K E L L I N S T I T U T E Pipe Dreams Reducing the Cost of Public Infrastructure in Australia
6

As Sydney’s population grows, so too does the pressure on public transport networks and the city’s infrastructure. The key to meeting this demand lies not only in the ongoing procurement of traditional transport assets, such as trains and buses and associated infrastructure, but also in harnessing existing assets that are already in use throughout the community.
Executive Summary
THEMcKellInstitute
7
This report offers a suite of recommendations aimed at effectively capitalising on existing community assets, such as shuttle buses and car parking facilities, to best provide the necessary services for a growing urban population.
This report first outlines the growing challenges to Sydney’s traffic and transport network. It is widely acknowledged that Sydney’s traffic network is under strain due to excess vehicles on major arterials. There is a need to further encourage and incentivize public transport use amongst commuters throughout the Greater Sydney area, as well as incorporate community transport options more comprehensively into the transport network. Community transport provides an essential service to the New South Wales community, with over 1.4 million trips made across the state each year . However, many community transport organisations are also under strain, and require further assistance from government to continue to adequately provide vital services.
This report highlights areas in which the NSW Government can invest in collaboration with community organisations, such as clubs, schools, nursing homes and entertainment precincts to make the most of existing community assets.
A major challenge to the Sydney transport network is ensuring interconnectivity. Many suburban areas are poorly connected to the wider transport network, forcing commuters into their cars instead of often underutilised bus and train services. The distance between many residential properties and bus stops within suburbs discourages commuters from riding on public transport.
To meet this challenge, more consistent intra-suburban services – between residences and transport hubs – are required. Existing privately operated shuttle services could be expanded to enhance intra-suburban public transport and promote greater connectivity between residences and transport hubs.
Such assets could also be used in providing a bridge between registered clubs, schools or other community centres and train stations, which often do not have adequate parking facilities to encourage commuters to ‘park and ride’.
Community centres – particularly registered sports, recreation and RSL clubs – often have car parking facilities within the vicinity of transport hubs. This report suggests that greater cooperation between such clubs and the NSW Government could foster the enhanced utilisation of car parking spots within the vicinity of train stations, ferry terminals and bus interchanges. Ample parking is central to encouraging commuters to ‘park and ride’, and is vital to limiting congestion on Sydney’s roads.
This report concludes by outlining notable transport trouble spots in the Greater Sydney area, and how harnessing community assets could substantially improve the public transport services in these communities.
By collaborating with the operators of existing community assets, the NSW Government could better connect Greater Sydney’s transport network and encourage higher utilisation rates of existing assets, limiting Sydney’s congestion and benefiting the lives of ordinary commuters.

8
M C K E L L I N S T I T U T E Two Birds, One Stone: Harnessing Community Assets to Improve Transport Connectivity in New South Wales.
IntroductionThe NSW Transport System is undergoing significant changes in an attempt to accommodate the city’s growing population. Sydney’s roads remain some of the most congested in Australia, costing the economy as much as $13.74 billion in 2011 alone.1
Congested roads could cost the economy as much as $53.5 billion by 2031 if appropriate strategies in transport design are not implemented.2 Sydney commuters also spend as much as three full weeks a year just getting to and from work: the number of commuters who spend more than 10 hours a week commuting rose from 22% in 2002 to 29% in 2012.3
Sydney’s congestion has also been rated as one of the worst in the Western world, coming in at 7th worst globally, just behind Los Angeles.4
A dynamic and flexible public transport network is vital for Sydney’s future. However, in recent years Sydney’s public transport uptake has been outpaced by the other major Australian capital cities.
Road space comparison of 69 bus passengers on a single bus, 69 pedestrians, 69 bicycle riders and 40 cars. Canberra ACT. Courtesy Cycling Promotion Fund.

9
M C K E L L I N S T I T U T E Two Birds, One Stone: Harnessing Community Assets to Improve Transport Connectivity in New South Wales.THEMcKellInstitute
Source: Australian Bureau of Statistics, Australian Social Trends 2008.
Sydney has a higher proportion of public transport users than other major capital cities in Australia. However, the growth in public transport users in the decade to 2006 was significantly slower than in Melbourne, Brisbane or Adelaide. If public transport uptake continues to grow at the current rate, there will be another 950,000 cars on Sydney’s roads by 2046.5
The Department of Infrastructure and Transport released a report into active travel in 2013, finding that there are seven main barriers to using public transport and engaging in active travel, namely:
Lack of continuous, convenient connections
Lack of physical safety
Lack of personal safety and comfort
Lack of awareness
Lack of skills
Lack of motivation
Poor governance6
This report identifies two public transport options that could benefit from the harnessing of existing community assets: Sydney’s bus network, through the incorporation of community shuttle buses into localised routes, and Sydney’s train network by encouraging more ‘park and ride’ options through partnership with community organisations.
FIGURE 1: THE PROPORTION OF ADULTS USING PUBLIC TRANSPORT FOR THEIR USUAL TRIP TO WORK OR FULL-TIME STUDY.
1996 %
2000 %
2003 %
2006 %
CHANGE BETWEEN 1996 AND 2006 (c)
%
Sydney 23.4 25.0 25.9 26.3 12.4
Melbourne 13.1 15.9 15.3 17.7 35.1
Brisbane 14.3 11.6 15.7 17.5 22.4
Adelaide 12.2 10.6 13.4 14.4 18.0
Perth 10.5 11.3 10.5 10.7 1.9
Hobart 12.8 5.2 6.9 10.3 -19.5
Canberra 11.4 8.2 8.1 7.9 -30.7
Total capital cities (a) 16.3 17.2 17.9 19.1 17.2
Other areas (b) 2.7 1.9 2.4 1.7 -37.0
AUSTRALIA 11.9 12.2 13.0 13.5 13.4
(a) Excludes Darwin(b) Includes Darwin and all other places outside capital cities.(c) Represents the change in the proportion of adults using public transport for their usual trip to work or study.
10
M C K E L L I N S T I T U T E Two Birds, One Stone: Harnessing Community Assets to Improve Transport Connectivity in New South Wales.
Sydney’s Buses
Due to Sydney’s geography and low urban density compared to similar sized global cities, the bus network continues to be a central mode of public transport in the city. The bus network must be as accessible and as connected as possible for the future transport needs of Sydney commuters.
The NSW Government released a report at the end of 2013 entitled Sydney’s Bus Future with a focus on increasing the connectivity of Sydney’s local, suburban and rapid transportation routes. The report has placed an emphasis on providing an integrated bus network that will deliver bus services within 400 meters of all Sydney residences. An effective bus service system requires frequent services that provide consistent localised transportation, linking major transport hubs to local residences.
Enhancing localised bus services has often required the procurement of new vehicles. However, many of these new, larger commuter buses are expensive and are ultimately underutilised. In these areas, smaller shuttle services with lower capacity, but greater route flexibility, could be more cost-effective and practical for intra-suburban commuting. As most of Sydney’s buses operate under private contracts, the NSW Government should investigate alternative avenues to meet its requirements to increase services on local routes.
The ABS estimates that as of January 2015, there were 25,249 buses registered in NSW.7 Of those, approximately 4,909 buses are in the public transport fleet.8 The remainder are buses owned by private organisations and community groups and used for a variety of purposes.
Many of these privately-owned buses, particularly those owned and operated by community organisations such as clubs, schools or nursing homes, could be further utilised in transporting commuters.
Certain areas of Sydney remain extremely limited in their access to the public transport network could benefit from such reforms. One example is Toongabbie, a suburb 32 kilometres west of the Sydney CBD, which has extremely limited transport
services and is regarded as a transport black spot. From certain areas within Toongabbie, residents are required to walk over one kilometre to reach the nearest bus stop or train station.
However, Toongabbie is also in the vicinity of several clubs which possess courtesy shuttle buses for club patrons. Most of the shuttle bus services are only operated after 5pm on certain nights of the week, leaving the buses sitting idle for most of the week. There is the potential for the NSW Government to contract these shuttle buses during daylight hours to connect residents of Toongabbie with transport hubs, thereby encouraging further uptake of public transport use within this suburb. This is a model that could be replicated in other suburban areas throughout the state.
Enhancing local transport services is one of the goals identified in the report, Sydney’s Bus Future. Community buses are a latent asset that can be used to fill gaps in intra-suburban routes where public transport is irregular or non-existent, helping to achieve the objective laid out by the NSW Government
Park & Ride Facilities
Many train stations and transport hubs around Sydney operate park and ride facilities which allow commuters to drive to the hub, park their car for the day, and catch public transport for the majority of their journey to and from work. These facilities work particularly well in the outer suburbs of Sydney where local suburban transport services are irregular or add too much time to a daily commute to be worthwhile for passengers to use.
However, there are many stations and transport hubs that do not have sufficient car parking close by to encourage commuters to use public transport. This is most notable for many of Sydney’s ferry wharves – the high-value land close to the water often supports high-density residential buildings and high-value housing. However, some of the ferry wharves around Sydney are close to private car parking that goes unused for most of the day.

11
M C K E L L I N S T I T U T E Two Birds, One Stone: Harnessing Community Assets to Improve Transport Connectivity in New South Wales.THEMcKellInstitute
One such example is the wharf at Abbotsford, on the Parramatta River in the inner west. The Abbotsford ferry wharf is 50m from the Sydney Rowing Club, which is a combined venue that boasts a café, bar and restaurant as well as rowing club facilities. This club also has onsite parking for 101 cars. The state government could work with this venue and others to allow commuters to park onsite for a nominal fee on weekdays, thereby giving more commuters access to public transport that is convenient, regular and inexpensive.
Additionally, the state government to work closely with private and community organisations to
approve development applications for new carpark facilities, or for the extension of existing carparks, on the condition that the facilities can be used by commuters. Such developments are mutually beneficial to the government, clubs, and commuters alike, as they would allow for the most efficient use of community resources and encourage greater public transport patronage.
This report notes that there are multiple opportunities for the NSW government to partner with private organisations who own and operate vital community infrastructure, such as shuttle services and car parks, to allow a greater number of commuters to access Sydney’s public transport.
RECOMMENDATION 1 The NSW Government should explore the option of contracting smaller community shuttle buses to enhance local intra-suburban public connectivity.
RECOMMENDATION 2 The NSW Government should investigate the viability of contracting community and privately-owned buses for use in peak-hour. These buses could be used to provide local shuttle services between poorly-serviced suburbs and local transport hubs.
RECOMMENDATION 3 Local clubs and the NSW Government should investigate collaborating to offer shuttle bus services between clubs and major transport hubs in an effort to address the issue of parking shortages.
RECOMMENDATION 4 The NSW Government should partner with private organisations and community groups that own car parks close to public transport hubs in Sydney to allow a greater number of commuters to access parking during weekdays.
RECOMMENDATION 5 The NSW Government should work with local governments to fast-track development applications for parking facilities close to transport hubs, on the condition that such facilities will allow for commuters to park during weekdays.
RECOMMENDATION 6 The NSW Government should expand its priority areas in community transport investment to include investing in existing community transport assets such as shuttles buses owned and operated by private organisations such as clubs, schools, nursing homes and hospitals, among others.
RECOMMENDATION 7 The NSW Government should make access to appropriate community transport accreditation streamlined and more readily available to ensure all private operators are able to efficiently negotiate the accreditation process.
RECOMMENDATIONS

12
M C K E L L I N S T I T U T E Two Birds, One Stone: Harnessing Community Assets to Improve Transport Connectivity in New South Wales.
13
M C K E L L I N S T I T U T E Two Birds, One Stone: Harnessing Community Assets to Improve Transport Connectivity in New South Wales.THEMcKellInstitute
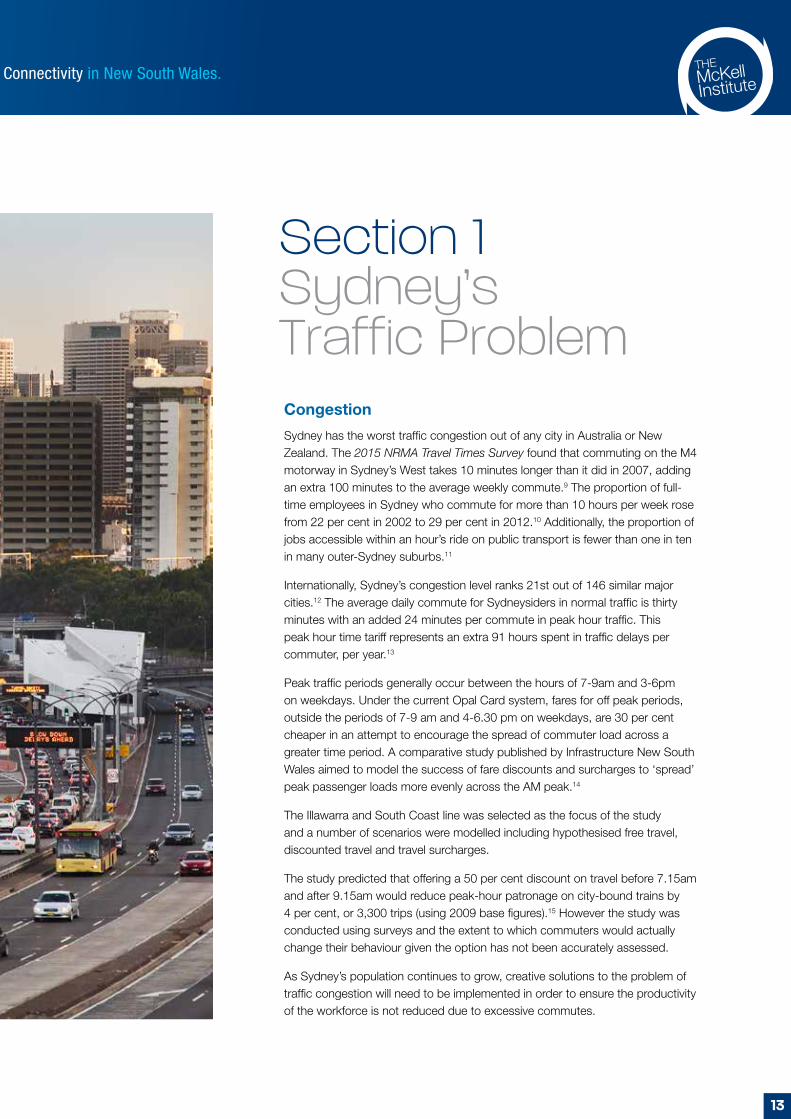
Congestion
Sydney has the worst traffic congestion out of any city in Australia or New Zealand. The 2015 NRMA Travel Times Survey found that commuting on the M4 motorway in Sydney’s West takes 10 minutes longer than it did in 2007, adding an extra 100 minutes to the average weekly commute.9 The proportion of full-time employees in Sydney who commute for more than 10 hours per week rose from 22 per cent in 2002 to 29 per cent in 2012.10 Additionally, the proportion of jobs accessible within an hour’s ride on public transport is fewer than one in ten in many outer-Sydney suburbs.11
Internationally, Sydney’s congestion level ranks 21st out of 146 similar major cities.12 The average daily commute for Sydneysiders in normal traffic is thirty minutes with an added 24 minutes per commute in peak hour traffic. This peak hour time tariff represents an extra 91 hours spent in traffic delays per commuter, per year.13
Peak traffic periods generally occur between the hours of 7-9am and 3-6pm on weekdays. Under the current Opal Card system, fares for off peak periods, outside the periods of 7-9 am and 4-6.30 pm on weekdays, are 30 per cent cheaper in an attempt to encourage the spread of commuter load across a greater time period. A comparative study published by Infrastructure New South Wales aimed to model the success of fare discounts and surcharges to ‘spread’ peak passenger loads more evenly across the AM peak.14
The Illawarra and South Coast line was selected as the focus of the study and a number of scenarios were modelled including hypothesised free travel, discounted travel and travel surcharges.
The study predicted that offering a 50 per cent discount on travel before 7.15am and after 9.15am would reduce peak-hour patronage on city-bound trains by 4 per cent, or 3,300 trips (using 2009 base figures).15 However the study was conducted using surveys and the extent to which commuters would actually change their behaviour given the option has not been accurately assessed.
As Sydney’s population continues to grow, creative solutions to the problem of traffic congestion will need to be implemented in order to ensure the productivity of the workforce is not reduced due to excessive commutes.
Section 1 Sydney’s Traffic Problem

14
M C K E L L I N S T I T U T E Two Birds, One Stone: Harnessing Community Assets to Improve Transport Connectivity in New South Wales.
Driving to Work
More than two thirds of Australians drive to work and nearly nine in ten adults use a car to get to places other than work.16 More than half of the adults surveyed indicated that they did not use public transport to get to and from work because there was no service that existed, or, where it did, the service times did not suit their needs.17
Over the five years to 2014, the percentage of people using their car to commute in Australia rose about 0.8 per cent. In addition, about 20 per cent of train commuters also use their car to get to work; and about 10 per cent of bus users drive to their local bus stop from home.18
In 2014 the NSW Bureau of Transport Statistics released modelling predicting travel figures for the
next 30 years in Sydney. By 2046, the AM two-hour peak travel period (7-9am) is expected to record growth of nearly 950,000 more cars on the road, from 1.9 million car driver journeys in 2011, to 2.8 million in 2046, in the Sydney Greater Metropolitan Area alone. Although other forms of transport to work are also expected to grow: patronage on rail, light rail and ferries is expected to grow by 91.1 per cent with 240,000 more people expected to use one of these mediums to travel to work. Bus usage is also expected to grow, albeit at a slightly slower rate, with an extra 130,000 people taking the bus to work in 2046 than in 2011.19 In order to keep up with the demand for transport, Sydney’s policymakers will need to implement creative solutions in public transport.
FIGURE 2: GREATER SYDNEY: TOP 5 METHODS OF TRAVEL TO WORK IN 2011 (EMPLOYED PERSONS AGED 15 YEARS AND OVER)
Source: Australian Bureau of Statistics Census 2011 Fact Sheet.
2011 2006
Car, as driver 1,106,968 (53.7%) 1,019,116 (53.5%)
Train 187,760 (9.1%) 152,723 (8.0%)
Bus 107,895 (5.2%) 92,353 (4.9%)
Car, as passenger 93,538 (4.5%) 107,191 (5.3%)
Walked only 84,557 (4.1%) 79,571 (4.2%)
TOTAL PERSONS 2,063,270 (100%) 1,903,527 (100%)
Transport by car continues to be the most commonly reported method of travel to work. More than half (58.2%) of employed persons reported that they travelled to work by car (either as driver or a passenger) on 9 August 2011.
The number of persons who walked to work has increased slightly from 79,571 in 2006 to 84,557 in 2011. The proportion of persons who walked to work declined slightly between (4.2%) and 2011 (4.1%) reflecting a greater increase in reporting for some of the more popular forms of transport.
15
M C K E L L I N S T I T U T E Two Birds, One Stone: Harnessing Community Assets to Improve Transport Connectivity in New South Wales.THEMcKellInstitute
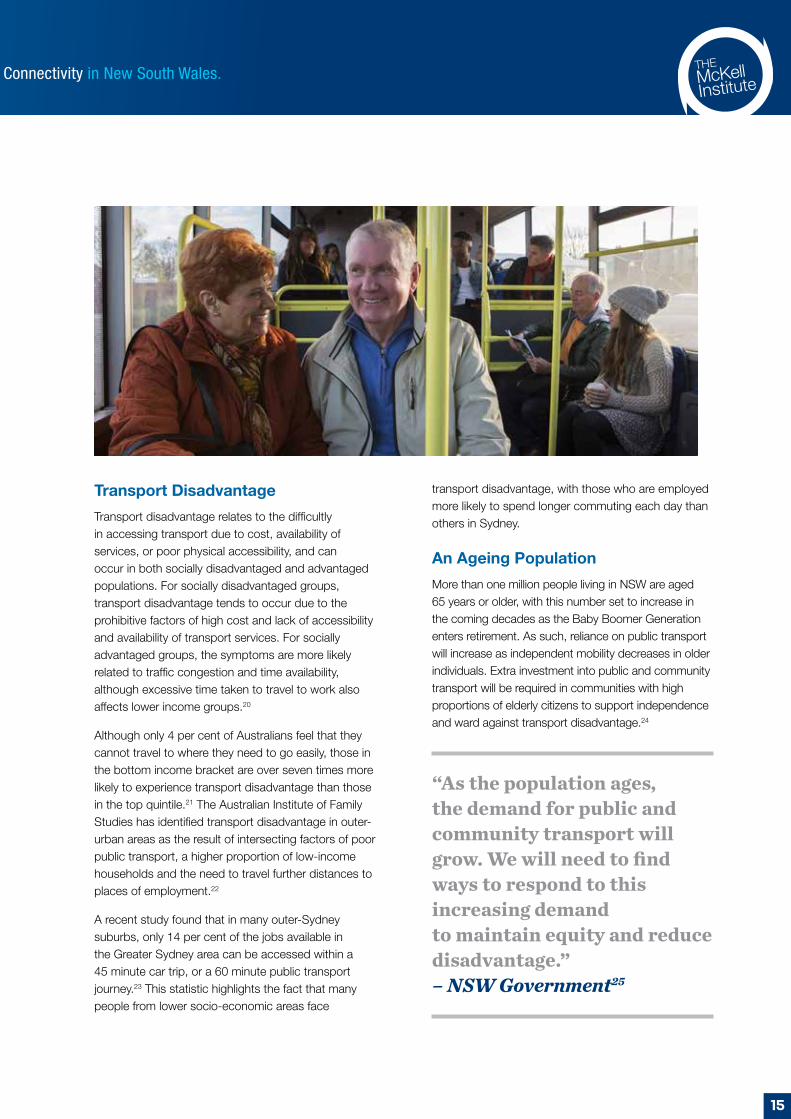
Transport Disadvantage
Transport disadvantage relates to the difficultly in accessing transport due to cost, availability of services, or poor physical accessibility, and can occur in both socially disadvantaged and advantaged populations. For socially disadvantaged groups, transport disadvantage tends to occur due to the prohibitive factors of high cost and lack of accessibility and availability of transport services. For socially advantaged groups, the symptoms are more likely related to traffic congestion and time availability, although excessive time taken to travel to work also affects lower income groups.20
Although only 4 per cent of Australians feel that they cannot travel to where they need to go easily, those in the bottom income bracket are over seven times more likely to experience transport disadvantage than those in the top quintile.21 The Australian Institute of Family Studies has identified transport disadvantage in outer-urban areas as the result of intersecting factors of poor public transport, a higher proportion of low-income households and the need to travel further distances to places of employment.22
A recent study found that in many outer-Sydney suburbs, only 14 per cent of the jobs available in the Greater Sydney area can be accessed within a 45 minute car trip, or a 60 minute public transport journey.23 This statistic highlights the fact that many people from lower socio-economic areas face
transport disadvantage, with those who are employed more likely to spend longer commuting each day than others in Sydney.
An Ageing Population
More than one million people living in NSW are aged 65 years or older, with this number set to increase in the coming decades as the Baby Boomer Generation enters retirement. As such, reliance on public transport will increase as independent mobility decreases in older individuals. Extra investment into public and community transport will be required in communities with high proportions of elderly citizens to support independence and ward against transport disadvantage.24
“As the population ages, the demand for public and community transport will grow. We will need to find ways to respond to this increasing demand to maintain equity and reduce disadvantage.” – NSW Government25

16
M C K E L L I N S T I T U T E Two Birds, One Stone: Harnessing Community Assets to Improve Transport Connectivity in New South Wales.
Sydney’s Public Transport System is Underutilised
There are a variety of factors that act as a barrier to more Sydney residents using public transport. The Australian Bureau of Statistics 2011 Census data revealed that the most common reason is because there is no service or the services available are not convenient to passengers.
Another reason frequently cited for not using public transport is the lack of facilities available at major transport hubs, such as train stations and bus
depots. NRMA’s Seeing Red on Rail report in 2014 found that, for the second year in a row, safety at train stations and lack of adequate parking facilities were the two greatest concerns for people using the rail network.26
For the NSW Government to address the issues of congestion, transport disadvantage and pollution caused by an excess of cars on Sydney’s roads, there must be a greater investment made into creating a more efficient and accessible public transport system. The following section tables several reform options that will assist in achieving this goal.
FIGURE 3: SELECTED REASONS FOR NOT USING PUBLIC TRANSPORT TO WORK OR FULL TIME STUDY (AUSTRALIA)
Source: ABS Waste Management, Transport and Motor Vehicle Usage Use Survey.
PER CENT
(a) A person may report more tha one reason for not using public transport.(b) For people who drove to work or study, as a driver or passenger.
No service available at all
Convenience, comfort, privacy
No service at right/convenient time
Travel time too long
Own vehicle needed
Need to carry passengers, equipment or tools
0 10 20 30 40 50

17
M C K E L L I N S T I T U T E Two Birds, One Stone: Harnessing Community Assets to Improve Transport Connectivity in New South Wales.THEMcKellInstitute
Utilisation Rates
Central to ensuring that Sydney’s public transport needs are met is the efficient utilisation of existing and future transport services.
Sydney’s population is expected to continue to grow at between 1.4 to 1.6 per cent per annum between 2016 and 2031,27 causing an increase in traffic congestion and an increased need for more public transport services and vehicles.
Sydney’s bus utilisation rate is relatively low compared to similar cities around the world. On average, a bus in Sydney carries 100,000 passengers per year, or 274 passengers per day.29 This figure is considerably lower than in cities of a similar size. Singapore, for example, carries close to 300,000 passengers on each bus annually. Even smaller cities, such as Vancouver and Barcelona, demonstrate greater utilisation rates than Sydney, carrying over 115,000 passengers annually.30 These figures indicate that there is considerable scope for the more efficient use of Sydney’s bus fleet.
While utilisation rates have remained relatively static over time, the size of the fleet and overall patronage has increased. Between 2002 and 2014, annual ridership grew from approximately 164 million to 316 million per year. The overall fleet grew to accommodate this increase, and now stands at approximately 4,909 vehicles.31
However, while the fleet and overall ridership has grown, the stagnant utilisation rates suggest that procurement of new vehicles could have been more effectively targeted. Many of these extra vehicles service routes during peak periods with substantially less than 50 per cent occupancy.
FIGURE 4: BUS PATRONAGE SINCE 2001-2002
Source: Charting Transport28
200%
190%
180%
170%
160%
150%
140%
130%
120%
110%
100%
90%
80%
2001-0
2
2006-
07
2002-
03
2007-
08
2003-
04
2008-
09
2004-0
5
2009-
10
2005-
06
2010
-11
2011-
12
2012
-13
2013
-14
Melbourne Perth
Hobart Wellington
South East QLD
Sydney Adelaide
Auckland ChristchurchCanberra
RE
LAT
IVE
TO
20
01-
02
PAT
RO
NA
GE

18
M C K E L L I N S T I T U T E Two Birds, One Stone: Harnessing Community Assets to Improve Transport Connectivity in New South Wales.
The NSW Bus System
The NSW Government’s bus system consists of a fleet of 4,909 buses spread across the state.32 The operation of this fleet is mostly subcontracted, with the rest operated under the banner of State Transit.
Sydney’s bus network consists of more than 600 bus routes across the metropolitan area, with a variety of bus services offered within that. Additionally, more than 220 million bus trips are made across Sydney each year.
The vast layout of Sydney as a low-density city requires the operation of buses in a connected transport system. Examining past trends, it would take 75 years of continued population growth to achieve a density similar to Paris and 1,000 years to reach the density of Hong Kong.33 A highly connected and flexible bus network will therefore be central to Sydney’s public transport strategy over the next few decades.
In 2013 the NSW Government released a report entitled Sydney’s Bus Future, which focused on redesigning the bus network to better meet customer needs of convenience, frequency and reliability, connectivity, and comfort.34
Existing Private Contracts
The NSW bus network is primarily operated by private bus companies. The Metropolitan Bus System Contract, which includes rural and regional NSW, divides the city into fifteen regions, with each region sub-contracted to either a private or public provider.35 Only four of the fifteen bus regions are operated by the government-operated Sydney Buses; the rest are subject to private operating leases.
Small organisations on individual operating contracts with the government historically operated private buses. Since 2013, these contracts have undergone a process of competitive tendering resulting in improved customer service, stronger Key Performance Indicators (KPIs), and an increase in the quantity of buses in each region.
Despite the fact that 74 per cent of the Sydney Metropolitan bus service is operated on private contracts, all metropolitan bus services operate under standard service contracts which ensure the provision of consistent fares, concessions and service standards for customers on both public and private bus services.
Section 2 Harnessing Community Vehicles to Enhance Transport Network Interconnectivity

19
M C K E L L I N S T I T U T E Two Birds, One Stone: Harnessing Community Assets to Improve Transport Connectivity in New South Wales.THEMcKellInstitute
Gosford
Picton
Gordon
Epping
Central
Penrith
Berowra
Hornsby
Woy Woy
Richmond
Engadine
Chatswood
Bankstown
Fairfield
Liverpool
Glenfield
Blacktown
Town Hall
Helensburgh
Springwood
Sutherland
Hurstville
Parramatta
Strathfield
Mount Druitt
Olympic Park
North Sydney
Campbelltown
KSA
1
4
15
2
10
36
8
7
9
1214
13
5
6
8
9
OMBSC Contract 8 - Blue Mountains - Blue Mountains Bus Co.
OMBSC Contract 9 – North Wollongong – Northern Wollongong Area Management Pty Ltd
OMBSC Contract 6 – Central Coast – Busways Central Coast Pty Ltd
Sydney Metropolitan Bus Service Contracts 2012.
0 5 102.5Km
Produced by TfNSW, Bureau of Transport Statistics Req12/562, Date 20/11/2012
Contract 1 – Busways Blacktown Pty Ltd
Contract 2 – Area 2 Management Company Pty Ltd
Contract 3 - Transit (NSW) Liverpool Pty Ltd
Contract 4 - Hillsbus Co Pty Ltd
Contract 5 - Punchbowl Bus Company Pty Ltd
Contract 10 - Veolia Transport NSW Pty Ltd
Contract 12 - Transdev NSW Pty Ltd
Contract 14 - Forest Coach Lines Pty Ltd
Contracts 6 - 9 - State Transit Authority of NSW
Contract 13 - Veolia Transport NSW Pty Ltd
Contract 15 - Busways Campbelltown Pty Ltd
! Major Train Stations
Main Road
CityRail Network
Source: NSW Transport
FIGURE 5: SYDNEY METROPOLITAN CONTRACT REGIONS 1-15

20
M C K E L L I N S T I T U T E Two Birds, One Stone: Harnessing Community Assets to Improve Transport Connectivity in New South Wales.
FIGURE 6: PRIVATE AND PUBLIC BUS OPERATORS FOR NSW BUS SERVICES
Source: NSW Transport36
REGION BOUNDARIES OPERATOR START DATE OF TENDERED CONTRACT
1 2,3,4,15 Busways 6 October 2013
2 1,2,13,15 Interline 1 June 2014
3 1,2,4,13 Transit Systems Sydney 13 October 2013
4 1,3,7,12,13 Hillsbus 1 August 2013
5 6,7,10,13 Punchbowl Bus Company 1 July 2014
6 5,7,9,10,13 Sydney Buses 1 July 2013
7 4,6,8,9,12,14 Sydney Buses 2 July 2013
8 7,9,14 Sydney Buses 3 July 2013
9 6,7 Sydney Buses 4 July 2013
10 5,6,11,13 Manibar Bundeena and Transdev 1 January 2013
11 10 Manibar Bundeena and Transdev 2 January 2013
12 4,7,8,14 Transdev NSW 1 June 2013
13 2,3,5,6,10 Transdev NSW 1 May 2013
14 7,8,12 Forest Coach Lines 1 April 2013
15 1,2 Busabout 1 June 2014

21
M C K E L L I N S T I T U T E Two Birds, One Stone: Harnessing Community Assets to Improve Transport Connectivity in New South Wales.THEMcKellInstitute
Cost of Bus Procurement and Maintenance
The Sydney Metropolitan and Outer Metropolitan Service Contracts stipulate that average bus fleet age should be no more than 12 years. As of June 2015, the average fleet age of State Transit’s bus fleet was 10.1 years.
The incorporation of a maximum age in both the public contracts handled by State Transit, as well as private contracts, will consequently lead to a constant need to replace existing buses, as well as acquire new buses to meet the increased patronage, and increased routes.
The McKell Institute has conducted a case study into the procurement costs of a Scania K280UB model bus based on figures sourced from within the bus manufacturing industry.
PROCUREMENT COSTS OF A SCANIA K280UBThe procurement and maintenance of a single bus is a significant cost to government. The Scania K280UB4 is one of Sydney Buses’ most procured units: the model is 12.5m in length and provides a capacity of 47 seats (60 person total capacity). Scania, the manufacturer of the K280UB4, estimate that this vehicle represents 98 per cent of their sales to government, with the other 2 per cent coming from longer, articulated buses with larger seating capacities.
Procurement of a single Scania K280UB costs government up to $495,000 including GST. Currently, 219 Scania K280UB’s are found in the Sydney Buses fleet, suggesting procurement of this vehicle alone has cost the government approximately $108,405,000 since 2011, when the vehicle first came into operation.
While a significant cost, the Scania K280UB makes up only 10.1 per cent of Sydney Buses’ operational fleet of 2168 buses. As the fleet ages and has to be upgraded and eventually replaced by newer models such as the K280UB, the scale of the financial burden of maintaining and replacing a modern, efficient and accessible bus fleet becomes apparent.
Although it is important to continually upgrade and maintain the Sydney Buses vehicle fleet, the cost of the K280UB demonstrates the cost to government of consistently procuring new high capacity vehicles, many of which are underutilised for the majority of their period in operation.
Disclaimer: All information in this case study was gathered first hand from sources within the bus procurement industry.
CASE STUDY:

22
M C K E L L I N S T I T U T E Two Birds, One Stone: Harnessing Community Assets to Improve Transport Connectivity in New South Wales.
Future Strategy of the Bus System
In 2013 the NSW Government released a report outlining the future strategy of Sydney’s bus network. Entitled Sydney’s Bus Future,37 the report details the challenges facing the bus network and the measures the NSW Government intends to roll out in subsequent years.
Sydney’s Bus Future lists passenger priorities as:
Convenience – “Bus services that are close to their home or workplace, arrive frequently and regularly, and get them from the start to the end of their journey faster and on schedule.”
Frequency and Reliability – “Regular bus services and expect them to run on schedule.”
Connectivity – “Opportunities to interchange easily onto another bus, train, ferry or light rail service.”
Comfort – “Modern, safe buses that have climate control, sufficient personal space and a clean seat plus a comfortable ride and friendly service from the driver.”
In prioritising passenger feedback, the NSW Government also has to meet the needs of a growing patronage, which grew by 14 per cent from 2008-13.
The report noted that two of the most important service features that customers desire in their bus network are convenience and connectivity. A lack of both of these features results in a smaller patronage on the network than might be possible.
The NSW Government notes that their future strategy is based on attracting ‘more customers to use bus services throughout Sydney.’38 Central to this is the integrated bus network.

23
M C K E L L I N S T I T U T E Two Birds, One Stone: Harnessing Community Assets to Improve Transport Connectivity in New South Wales.THEMcKellInstitute
FIGURE 7: SYDNEY BUSES INTEGRATED NETWORK MODEL.
Source: NSW Transport.
Figure 7 shows an area of metropolitan Sydney in more detail. It shows how Rapid, Suburban and Local bus services work together to form a complete bus network that integrates with other forms of public transport, plus walking and bicycle access.

24
M C K E L L I N S T I T U T E Two Birds, One Stone: Harnessing Community Assets to Improve Transport Connectivity in New South Wales.
Integrated Network Model
In 2013, Sydney Buses released a new strategy aimed at reducing the length of the daily commute for an average customer catching a bus in metropolitan Sydney. The length of bus journeys to and from the Sydney CBD has been a serious disincentive for commuters, many of whom choose to drive to work rather than use Sydney’s bus system. The ‘Integrated Network Model’ implemented by Sydney Buses aims to address the length of the commute, by creating more routes with less stops, and improving access to ‘rapid route bus stops’, which will greatly benefit suburban hubs that offer quicker services to and from the Sydney CBD or other major urban centres.
The Integrated Network Model divides the bus network into three route types:
Rapid bus routes – spaced approximately one kilometre apart on major arterials
Suburban bus routes – spaced several hundred meters apart on smaller arterials
Local bus routes – frequently spaced on smaller roads within suburbs
The three route types are aimed at seamlessly connecting intra-suburban services with the broader network. The intention is to make major commutes quicker, with less stops between rapid routes and major centres, whilst providing smaller services in communities and between rapid route stops.
Local Bus Routes
The Sydney’s Bus Future report has identified the need to improve local bus routes to better improve the connectivity of the transport system. Local transit routes within the three-route model are the key to establishing an effective interconnected transport system; without local routes, a deeper problem for communities will exist.
“Without transport, people can’t access jobs, community services, medical facilities, schools, universities, friends and relatives, places of worship, shops, parks, and all manner of other things that are vital for citizenship and quality of life”39
Local routes complete the transport network, and are required to meet customer travel needs during the day. Sydney’s Bus Future identifies additional local routes to meet cross-metropolitan and off-peak travel needs. This model, while addressing accessibility for communities, takes the risk of buses being grossly underutilised. Local routes use standard buses – carrying up to 60 people – even in off-peak times and with a utilisation rate of less than 50 per cent. Therefore, it is unlikely the utilisation rates on local bus routes will justify the procurement of newer vehicles to enable the NSW Government to create additional local routes with more frequent services. Smaller buses could be used to enhance this service, as the larger capacity buses that form the majority of the public bus fleet in Sydney will often be underutilised in servicing these shorter, intra-suburban routes.
Failures of the Current Bus System
According to the authors of Sydney’s Bus Future, 90 per cent of Sydney residents live within 400 meters of a bus stop.40 While this is a notable achievement, nearly half a million Sydneysiders remain more than 400 meters away from a bus stop, with many of those residents living in areas that are also far from main transport hubs and jobs. The NSW Council of Social Service has reported that “new investment quite often happens in areas that are already well served because areas that aren’t well served haven’t been part of the conversation.”41

25
M C K E L L I N S T I T U T E Two Birds, One Stone: Harnessing Community Assets to Improve Transport Connectivity in New South Wales.THEMcKellInstitute
There is a disengagement between the NSW Department of Transport and certain areas of Sydney, especially in the low density suburbs of Western and South-West Sydney; which lead to both black spots in transport accessibility, and infrequent services. Professor Corinne Mulley at Sydney University’s Institute of Transport and Logistic Studies emphasises frequency as key to an efficient transport network.
“If you look at the international research to see what would make a difference to public transport use, the top three issues are frequency, frequency and frequency.”42
The transport black spots in the outer Western Suburbs of Sydney give residents no option but to travel by car, as there is no localized transport that can frequently transport residents around their local area and between their homes and transport hubs.

26
M C K E L L I N S T I T U T E Two Birds, One Stone: Harnessing Community Assets to Improve Transport Connectivity in New South Wales.
Community Transport
“Community transport is not-for-profit transport that is operated by local councils, volunteer groups, community organisations and service providers under the Australian Government’s Home and Community Care scheme. Community transport services include assisted door-to-door services, regular services to fill gaps in public transport and occasional trips for people who are ill or temporarily disabled.”43
Community transport services help to reduce transport disadvantage, particularly amongst older and disabled Australians, and those living in regional and rural areas where access to traditional public transport is limited. As the Australian population ages, there will be a greater pressure placed on transport services, including community transport.
The NSW Government has recently taken steps to better regulate the community transport sector to allow for greater participation for operators and a standard level of accreditation for drivers and operators state-wide.44
Across the state, approximately 1.4 million community transport trips are made each year.45
Community Transport in Rural and Regional NSW
Regional NSW is faced with consistent transport disadvantage, leaving regional NSW with an even greater need for a reliable, affordable, functional and accessible public transport network. Residents of regional NSW often face significantly longer journeys to access essential services such as a health, education and consumer and social services.46 The lack of funding to transport in regional areas has been a consistent trend, severely disadvantaging the individuals and communities in these areas.
In 2014 the NSW Government’s State and Regional Development Committee conducted an inquiry into inter-regional public transport.47 This report noted the enhanced transport disadvantage felt in regional communities, citing ‘long distances, small populations and difficult terrain’ as causal factors. The groups that are particularly disadvantaged in rural areas are the ‘elderly, young people, people with a disability, single parents, people in poor health and low income earners’, but the lack of public transport services affects these communities more broadly.
The NSW Government report highlights that existing community transport services, such as privately-operated shuttle buses between community centres and transport hubs, are already widely used to close the transport gap in certain regional communities. The local government areas surrounding Wagga Wagga in regional New South Wales, for example, have invested heavily in community transport as an alternative to public transport services. However, such services are still underfunded and do not sufficiently solve transport disadvantages in many regional communities.
The State and Regional Development Committee recommended as a priority that the NSW Government consider ‘broadening the scope of community transport to provide services to all groups in regional communities experiencing transport disadvantage’.48 This recommendation follows on from Transport for New South Wales’ Transport Master Plan, which outlines its “renewed focus on improving and strengthening the community transport sector”.49
27
M C K E L L I N S T I T U T E Two Birds, One Stone: Harnessing Community Assets to Improve Transport Connectivity in New South Wales.THEMcKellInstitute
This report notes that existing assets held by community centres such as clubs, schools, nursing homes and other community centres could be used to enhance community transport services within regional New South Wales. This approach will have the benefit of being implementable on a shorter time frame, and would cost the government significantly less than procuring additional vehicles to add to the state’s bus fleet.
Utilisation of Community and Privately-owned Shuttle Buses in the NSW Bus Network
Local bus transport has been found to be the most essential, yet most inadequate form of public transport in the Sydney region. Sydney is consistently growing outwards, yet the entire transport network is inward-looking, with most transport lines leading to the CBD.
Approximately 400,000 people need to travel to work in the Sydney Local Government Area; out of a total of about 2 million working people in the Greater Sydney region.50 Additionally, people do not need to go to the city for their shopping, entertainment, medical or social needs: most suburbs have varying degrees of amenities and services, and there are a growing number of ‘suburban hubs,’ offering cultural, dining and shopping experiences to rival the CBD such as Parramatta, Chatswood, Miranda and Burwood.
However, the vast majority of the transport system is still focussed on transporting people in and around the city. While there are numerous bus services available in Inner Sydney, residents of Sydney’s outer suburbs often find themselves stuck without an accessible bus system.
Herein lies an opportunity: scattered around Sydney and indeed the state of New South Wales are many organisations that are equipped with courtesy buses that for most of the day sit idle.
Organisations including – but not limited to – nursing homes, private schools and sporting and workers’ clubs own courtesy buses that are mostly used for outings and excursions, shuttling patrons to and from home, and on morning and afternoon school
bus routes. Most of these buses, however, are unused for a large majority of the day.
These private courtesy buses represent a potential asset that could be commissioned to fill a void in public transport services and to encourage a greater number of commuters to use public transport.
The NSW Government is advocating for more regular local bus services that will be within 400 meters of all Sydney residences. The plan for Sydney’s bus future aims to connect customers from one bus to another, and provide local services that effectively integrate with fast, reliable cross-metropolitan routes. To achieve this, additional buses are required to fill those services and maintain the necessary frequency between services.
Local bus routes play an important role in meeting community needs, not only in connecting the broader transport system, but also providing safe and reliable transportation to local centres such as libraries, medical centres, shopping centres and hospitals. The operation of courtesy buses to and from local community centres not only meets the needs of the community, but would be of particular benefit for older people and people living with disabilities.
Club Courtesy Buses
The courtesy buses that are owned and operated by individual clubs offer a service of safe transportation throughout suburban areas between residences and sports or RSL clubs. However, these buses are generally only in use during peak patronage times in the evening. For example:
Club Burwood RSL operates from 5pm-3am, Wednesday to Sunday
Petersham RSL operates 7pm - late, seven days a week
Campbelltown Bowls Club operates on Friday nights
There are hundreds of courtesy buses owned by organisations all around NSW that are currently underutilised. Club courtesy buses generally fit 14-20 people and mostly go unused on weekdays before 5pm.
28
M C K E L L I N S T I T U T E Two Birds, One Stone: Harnessing Community Assets to Improve Transport Connectivity in New South Wales.
These buses have the potential to be utilised as a part of the NSW Government’s broader transport revitalisation initiative, which has a specific focus on the enhancement of local bus routes. Courtesy buses are also better designed to traverse suburban streets than the 60person capacity buses regularly used by governments.
“NSW Club Courtesy Buses are an important facet of member services which assist clubs in providing a service and in delivering on their RSA requirements. Many patrons of registers clubs are elderly and/or immobile and the Courtesy Bus provides an opportunity for these members of society to be granted access to the amenity the club provides and the on-flowing benefits such as social interaction”51
Nursing Home Buses
Many nursing homes are in the possession of 14-20 seat minibuses that are utilised occasionally for outings, yet are unused for the majority of time. Our Lady of Compassion in Rooty Hill is in the possession of a fleet of three buses; two of which are wheelchair accessible, and which are on average used for only 15 trips per month for half days.52 There are numerous other nursing homes that own one or more facility buses that are all wheelchair accessible.
The wheelchair accessibility of many of these buses is an added bonus for the state government if the buses were to be used for local shuttle runs of public customers.
The NSW government has announced that 100 per cent of Sydney’s public buses will be wheelchair accessible by 2017, five years ahead of schedule.53 As of the 30th June 2013, 1,743 buses in the state transit authority fleet were accessible; featuring low level floors, large brightly coloured handrails, wide doors and aisles and space for two mobility aids

29
M C K E L L I N S T I T U T E Two Birds, One Stone: Harnessing Community Assets to Improve Transport Connectivity in New South Wales.THEMcKellInstitute
such as wheel chairs, ride-on scooters and prams or strollers.54 However thousands of private buses that operate in Sydney’s suburbs are not up to the standard of publicly-owned buses.
There are 4,909 buses in NSW owned and operated by 10 different companies, and only one of these companies – Sydney Buses – is state-owned.55 While New South Wales’ public buses are on track to be 100 per cent wheelchair accessible, private buses – operating predominantly in suburban routes – are lagging behind. Partnering within nursing homes would enable the government to best utilise existing transport assets already capable of transporting commuters with disabilities.
School Buses
Many private schools in NSW are in the possession of private buses used to transport students. These schools generally have between 1 and 9 buses that are used for the transportation of students to and from school, and occasionally for other school-related events and excursions.
School buses usually sit idle between the hours of 9am and 2.30pm, on weekends and during the evening. These time periods are weak periods for transport accessibility, and the integration of private school buses into the NSW transport system allows additional fleets that can be used for local routes.
Examples of private schools with buses include:
Pymble Ladies College – Offers two bus services for transportation to and from school 56
Domremy College – 1 bus that operates on a morning and afternoon route 57
Santa Sabina College – 2 private buses operating morning and afternoon routes 58
Meriden – 6 school buses that operate morning and afternoon routes 59
The Kings School – 7 weekly bus services to and from school, 2 Sunday services
MLC – 4 weekly services in the morning and afternoon

30
M C K E L L I N S T I T U T E Two Birds, One Stone: Harnessing Community Assets to Improve Transport Connectivity in New South Wales.
There are thousands of private and community organisations in NSW that own small buses that could be contracted for short intra-suburban routes. The ABS estimates that in NSW, there are 25,249 buses60 and only 4,909 of these are currently used for public transport.61 Rather than solely investing more heavily in new buses, there is an opportunity for the NSW government to contract private and community-owned buses on a part-time basis to meet demand during specific time periods.
Greater Sydney has an urgent need for more localised services, especially for short trips on the local transit network to an intermediate or mass transit network.
Community and private buses have the capacity to be utilised as a part of the NSW Government’s broader transport revitalisation initiative, which has a specific focus on the enhancement of local bus routes. By allocating small intra-suburban routes to these minibuses, the government can fill voids in public transport services that exist within certain communities.
Minibuses are better designed to operate on local streets than the regular 60 seat buses, as they are faster, more manoeuvrable and will not hold up local traffic in narrow streets. Although the repeated procurement of new buses for Sydney’s bus network will always be important, so too is harnessing the capabilities of existing assets that sit idle within the community.
Community Transport Accreditation
While this report has noted the significant number of latent assets within the community, it is understood that appropriate accreditation is required before any privately owned vehicles can be used to meet the transport demands of New South Wales residents. The NSW Government implemented a more universal accreditation system in 2014 with the passage of the Public Transport Bill 2014. Prior to the 2014 amendments made in the bill, community transport services were not recognised in the act, prohibiting a uniform regulatory framework that covered the community transport sector.
The Public Transport Bill requires all operators of community transport services to be accredited with Roads and Maritime Services, setting standards relating to safety, vehicle maintenance and driver accreditation. Operators must also keep registers of their drivers including names, addresses, licence details as well as the dates and times the driver drove the community transport vehicle for the operator. Drivers must have completed an accredited Bus Driver Authority course to gain a licence to drive a community transport vehicle, as is currently required of all bus drivers in the state of NSW.62
While these regulations would represent an additional cost in time and resources in order to accredit a community organisation for community travel, the authors believe that the benefits to both the community organisation and the community would be offset in the long term.
RECOMMENDATION Smaller community shuttles can be used to speed up local services and allow larger capacity buses to be used on other routes with high utilisation rates.
RECOMMENDATION The NSW Government should investigate the viability of contracting community and privately-owned buses for use in peak-hour local shuttle services between poorly-serviced suburbs and local transport hubs; as well as the use of community buses during off-peak daytime periods to shuttle residents to and from community service centres.
RECOMMENDATIONS

31
M C K E L L I N S T I T U T E Two Birds, One Stone: Harnessing Community Assets to Improve Transport Connectivity in New South Wales.THEMcKellInstitute
Park & Ride Facilities
Many train stations around greater Sydney operate car parks to allow passengers to drive to a station and catch a train for the remainder of their journey. This option enables commuters to increase the speed of their daily commute and minimise the strain on inner-city traffic.
In recent years the NSW Government has invested heavily in building new commuter carparks and upgrading existing parking; but in areas that are heavily built-up, land becomes the prime barrier to building new carparks.
A 2008 report by NRMA found that the main reason motorists don’t use trains to get to work is due to a lack of sufficient and secure parking facilities at train stations. 43 per cent of those surveyed said they would use ‘Park and Ride’ facilities if they were provided.
However, some of the busiest stations in Sydney are severely lacking in adequate parking facilities:
Strathfield 23 spaces – 10,700 commuters.
Hornsby 350 spaces – 7,290 commuters.
Parramatta 780 spaces – 15,190 commuters.
Bankstown 170 spaces – 4,720 commuters.
Kogarah 330 spaces – 6,770 commuters.63
The 2008 NRMA report advocated for an investigation into the use of existing carparks owned and operated by third parties that are underutilised during weekdays. Further, in 2010, the NRMA recommended once more that Park & Ride facilities must be built or in place at all major transport exchanges, and that such facilities must be able to cater for future demand.64
While investment is needed to create new parking facilities to meet commuter demand, several existing and often under-used parking spaces are located near notable transport hubs. The Rosehill Racecourse and Sydney Olympic Park – both of which are grossly underused during weekdays and boast thousands of carparks – are located within close proximity to transport hubs situated in densely-occupied residential areas.
Section 3 Encouraging Public-Private Partnerships to Improve Transport Network Accessibility and Ridership

32
M C K E L L I N S T I T U T E Two Birds, One Stone: Harnessing Community Assets to Improve Transport Connectivity in New South Wales.
Existing Park & Ride Facilities in NSW
Around a third of all NSW train stations offer no park and ride facilities at all, and a significant number offer parking facilities that do not properly cater to the number of commuters requiring facilities.65
Commuter carparks are essential in ensuring a maximal uptake of public transport for commuters, particularly in suburbs situated a long way from a major business hub.
Source: NRMA Railway Stations Audit (2012)66 and Sydney Trains: Stations67
FIGURE 8: PERCENTAGE OF PARK AND RIDE FACILITIES
PER CENT
RA
ILW
AY
LIN
E
0 20 40 60 80 100
West Line
South Line
Northern Line
Newcastle Line
Inner West Line
Illawarra Line
Hunter Line
Eastern Suburbs Line
East Hills Line
Central Coast Line
Carlingford Line
Blue Mountains Line
Bankstown Line 67
67
51
33
13
40
79
94
91
87
89
100
100

33
M C K E L L I N S T I T U T E Two Birds, One Stone: Harnessing Community Assets to Improve Transport Connectivity in New South Wales.THEMcKellInstitute
Bankstown Sports Early Bird Parking Facility
Bankstown Sports Club is a 400m walk from the Bankstown train station. The club owns a multi-level carpark for the use of its patrons, but also offers a special early-bird parking rate for commuters at $5 per day. Commuters must park in specially marked bays between the hours of 6am-10am to access the offer, otherwise parking is capped at $30 per day. Club patrons have the option to validate their ticket within the club in order to access free parking.
The Bankstown Sports Club has capitalised on the limited parking available for commuters in the area to the mutual benefit of both the club and commuters. Other organisations and clubs owning carparks that are underutilised during weekdays may also find benefits in this model.
Proposed M4 Park & Ride
The Sydney Alliance has called upon the Minister for Transport to commission a feasibility study into the construction of a park-and-ride facility near the eastern end of the M4 (where the Olympic Park train line crosses the M4 and Parramatta Road), to enable express trains from there to Strathfield and Central.68
Parramatta Road is one of the most congested arterial roads in Sydney, and the proposed plan is expected to ease some of this congestion by giving residents living in the Western suburbs access to fast and convenient public transport. Around 8,000 people commute by car from the Penrith, Auburn, Blacktown, Holroyd and Fairfield local government areas to the city or North Sydney via Parramatta Road and the M4 every day.
The proposal includes building a new train station along the existing Western Line at Olympic Park, as well as building new multi-level car parks. The plan is expected to cost a total of $130 million (a relatively inexpensive alternative to many other plans).69
Sydney Olympic Park & Ride
The other alternative to the M4 Park & Ride is to utilise existing infrastructure at Olympic Park.
Sydney’s Olympic Park boasts a glutton of parking spaces that are poorly utilised during business hours. The parking spaces were built to cater for large sporting and entertainment events that take place predominantly on weekends and in the evenings.
The Sydney Alliance has pointed to the under-utilised car parking available next to the Olympic Hockey Centre, with the potential for expansion of this facility.70

34
M C K E L L I N S T I T U T E Two Birds, One Stone: Harnessing Community Assets to Improve Transport Connectivity in New South Wales.
Olympic Park is Sydney’s fastest growing township with many large organisations choosing to base their businesses or part of their businesses in the precinct. Additionally, residential buildings are currently in construction, and the Sydney Olympic Park Authority estimates that by 2030, the park will support a daily population of around 50,000 people, including 20,000 visitors.71
As such, public transport options will need to be built upon, and current infrastructure will need to be utilised more efficiently to cater for the increase in daily population.
Currently, the nearby suburbs of Liberty Grove and Wentworth Point support the highest-density living in Sydney, but public transport options are limited. Greater investment into public transport options arriving at and leaving Olympic Park will allow many residents of the area to drive or ride their bikes to Olympic Park, park their cars or bikes at one of the under-utilised carparks, and catch public transport to their place of work.
Rosehill Racecourse Park & Ride
Rosehill Racecourse sits at the juncture of Parramatta Road, the M4 motorway and James Ruse Drive. It has its own train station, and multiple bus services operate within the area. There is also a ferry at nearby Parramatta which takes passengers into Circular Quay.
Rosehill also has a free car park with 5,000 spaces available as well as a member’s car park that goes largely unused during weekdays. As transport infrastructure already exists for this area, the State Government should negotiate commuter access to both the free and members car park during non-busy race days and non-race days.
RECOMMENDATION Many clubs with multi-story car parks are within close proximity of train stations. Clubs can offer an early bird price to encourage commuters to utilise the carpark during the day, while allowing club patrons free parking.
RECOMMENDATION The NSW Government should investigate partnering with private organisations and community groups that own car parks close to public transport hubs in Sydney to allow a greater number of commuters to access parking during weekdays.
RECOMMENDATION
35
M C K E L L I N S T I T U T E Two Birds, One Stone: Harnessing Community Assets to Improve Transport Connectivity in New South Wales.THEMcKellInstitute
Section 4 Regions that would Benefit from Additional Connectivity
URBAN CASE STUDIESSydney’s Inner-West
The suburbs of Wentworth Point (2,759 pop.); Liberty Grove (2,048 pop.); Breakfast Point (2,744 pop.); Cabarita (1,928 pop.); and Mortlake (754 pop.) are located within Canada Bay Council and lay on the southern side of the Parramatta River in Sydney.
These suburbs are in close proximity to four major social clubs that offer patrons the facility of a courtesy bus:
Waterview / Dooley’s of Silverwater
Concord RSL & Community Club Limited
Canada Bay Club.
The current major public transport facilities in the area are:
Buses: Concord Road, Lyons Road, Parramatta Road, the A3 motorway, Rhodes Shopping Centre, Majors Bay Road (Concord)
Trains: Concord, North Strathfield, Homebush
Ferries: Mortlake
Despite the provisions of transport that are provided in the area, there are defined transport black spots within the suburbs of Wentworth Point, Mortlake, Breakfast Point and Cabarita. In addition, the
greater area incorporates some of Sydney’s most densely populated areas – including Liberty Grove and Wentworth Point – yet does not boast public transport services of at least 15 minute intervals.
The utilisation of courtesy buses owned by Waterview / Dooley’s of Silverwater, Concord RSL & Community Club Limited and the Canada Bay Club would help to eliminate the transport black spots in the area. The minibuses could be used to transport residents to Concord Hospital, Concord Library and Burwood Westfield. Currently it takes 40 minutes, and two buses to travel from Breakfast Point to Concord Hospital, a trip that is a 45-minute walk. The courtesy buses could also be used for short intra-suburban trips to and from transport hubs during peak hours.
Toongabbie
The suburb of Toongabbie in Sydney’s greater western region is located 30km west of the Sydney CBD, with an employed population of 3,484 people, 2,140 of whom commute to work by car daily. Only 746 residents of Toongabbie commute to work by public transport on a regular basis.
The area of Toongabbie has extremely limited transport options; for example, a resident living on Portia Road would be required to walk 1.1km to reach the nearest bus stop or train station. This is a distance that serves as a barrier for workers to choose public transportation over the use of their

36
M C K E L L I N S T I T U T E Two Birds, One Stone: Harnessing Community Assets to Improve Transport Connectivity in New South Wales.
own cars. Toongabbie is therefore identified as a major transport black spot.
The suburb of Toongabbie is in the vicinity of several clubs: Toongabbie Sports and Bowling Club; Wenty Leagues; Seven Hills Toongabbie RSL Club Ltd; Blacktown Workers Club Ltd; and Blacktown RSL Club Ltd; all of which possess courtesy buses.
As a result of the inadequate transportation facilities in and around the suburb of Toongabbie, the courtesy buses have the capability of filling that void and establishing mini-routes that would cover black spots in the area to allow more workers to travel to and from work via public transport. The mini-buses can also be used to enable travel to and from local centres such as Blacktown Hospital, and Blacktown Library.
Sutherland Shire
Similarly, for people living in the Shire, public transport is inadequate. For example, for someone living along Holt Road in Taren Point, which is just over the bridge from Sans Souci and on the way to Cronulla, a walk to the closest local bus stop is 1.2km. The bus then winds through local streets before stopping at the Miranda train station which takes a line into the city. While it would take just 30 minutes in ordinary traffic to drive to the city by car, public transport takes over one hour and 10 minutes (including walking time). During peak hour traffic, the travel time for public transport can exceed one hour and 30 minutes.
According to the 2011 Census data, people living in Taren Point are overwhelmingly likely to drive to work each day. Of the 673 employed people in Taren Point, 438 drove to work, while just 68 caught the train. Only 1 person indicated that they caught a bus to work on the day of the Census.72
Within the vicinity of Taren Point, there are multiple sports and recreation clubs that own courtesy buses that are significantly underutilised and could be incorporated into commuter services, including:
The Point Bowling Club
St George Motor Boat Club
St George Sailing Club
Cronulla Sutherland Leagues Club
Georges River 16Ft Sailing Club
Kareela Golf & Social Club
Approximately 211,000 people live in Sutherland Shire, making it the second largest council in terms of population in NSW.73
Cronulla and the surrounding area represents a significant opportunity for NSW Transport to partner with local community organisations in possession of shuttle and courtesy buses in order to run small routes between transport black spots and local bus and rail hubs.
Rooty Hill
Rooty Hill is a suburb in Western Sydney with a population of 13,377,74 and while the suburb is located on a train line, the inter-suburban transport is less than adequate with infrequent bus services requiring commuters to wait between 40 and 50 minutes for a bus during off peak periods. Additionally, the buses from the station end at 11pm forcing commuters to either drive to the station, or catch a taxi.
For example, for someone living on Derby Street in Rooty Hill, the local train station is a fifteen-minute walk away. A bus may be caught to the station, but that too takes fifteen minutes, and only leaves every half an hour (including during peak travel hours).
Our lady of Consolation Aged Care home is also located in Rooty Hill and is in the possession of three courtesy buses, two of which are wheelchair accessible. These buses are used for half day trips with an average of only 15 trips per month.75 The Aged Care buses are unutilised for more than half the month and almost every evening. In conjunction, the underutilised courtesy buses owned by other aged care homes situated in Rooty Hill, Mount Druit and Doonside could be incorporated into the local bus routes to create more frequent services within the area, as well as providing night shuttle services from Rooty Hill and Mount Druit stations.

37
M C K E L L I N S T I T U T E Two Birds, One Stone: Harnessing Community Assets to Improve Transport Connectivity in New South Wales.THEMcKellInstitute
Hills Shire
The Hills Shire is a Local Government Area encompassing suburbs from the western Sydney suburb of Oatlands to Wiseman’s Ferry in the city’s far north-west. The suburbs of Castle Hill, Baulkham Hills and Quakers Hills constitute the largest proportion of people driving to work of any Sydney suburb.76 This is attributed to the lack of frequency and interconnectivity of the transport system in the Hills district. Buses in this area are privately operated by Hills Buses with primarily city-based routes. The Hills buses regularly reach capacity leaving commuters stranded.77 Additionally, there is a distinct lack of interconnectivity between the Hills suburbs, and surrounding city centres such as Parramatta via the public transport network. For example, it takes the same period of time to travel by public transport from Gilham Street in Castle Hill to the Sydney CBD as it does to Parramatta, despite Parramatta being considerably closer. While Parramatta is a 25-minute car trip from Castle Hill the bus ride takes over an hour, and only arrives every 30 to 40 minutes.
The Hills Shire is one of Sydney’s fastest growing areas, with a population of approximately 190,000 people. The Hills boasts a number of exclusive private schools, and many of those offer their students school runs on private buses on school days. Loreto Normanhurst, The Kings School, and Tara Anglican School for Girls all offer their students private school runs on branded buses. These buses go mostly unused for the remainder of the day, and outside the school term.
Additionally, there are numerous nursing homes in Parramatta and the Hills Districts, such as Constitution Hill Aged Care in Northmead,78 Woodlands Cherrybrook, and Bupa Baulkham Hills retirement villages which all offer courtesy buses.
The authors recommend that the State Government should investigate contracting the buses owned by the private schools and nursing homes in the area on a rotational basis to ‘top-up’ the existing local public transport network.
RECOMMENDATION Local clubs and the NSW Government collaborate to offer a shuttle bus services from clubs to main railway stations in an effort to address the issue of parking shortages.
RECOMMENDATION The NSW Government should investigate contracting private minibuses for intra-suburban routes to fill voids in transport black spots.
RECOMMENDATION
38
M C K E L L I N S T I T U T E Two Birds, One Stone: Harnessing Community Assets to Improve Transport Connectivity in New South Wales.

39
M C K E L L I N S T I T U T E Two Birds, One Stone: Harnessing Community Assets to Improve Transport Connectivity in New South Wales.THEMcKellInstitute
REGIONAL CASE STUDIES
MAJOR CENTRES
Newcastle & Hunter Region
Newcastle, the second oldest city in Australia, is also the second most populated city within New South Wales, with 160,000 people living within the LGA. Of the 88,179 people working in the City of Newcastle, 43,329 people also live in the area (as of the 2011 Census), meaning that just over 50 per cent of the employees working in Newcastle travel from outside the City of Newcastle to work each day.79 Of the 69,915 employed people living in the City of Newcastle, more than 49,000 used a car to get to work, while only about 2,700 used public transport.
Newcastle accounts for around 80 per cent of the office space and 30 per cent of the developed industrial space within the greater Hunter region. The service sector is a large and growing industry in Newcastle. It ensures the city no longer relies only on raw commodities for its sources of employment.
The public transport system in Newcastle is of growing concern to residents. Currently the public transport system in Newcastle is undergoing revitalisation, so trains are terminating at Hamilton station, with buses connecting passengers to the city centre. The new heavy rail system will terminate at Wickham Station, with light rail and buses to connect passengers to major hubs around the city.80
A large proportion of Newcastle residents also commute to Sydney and back each day for work. The train takes approximately two and a half hours each way for Newcastle commuters, but the connecting services to the main stations at Gosford, Wyong and Hamilton are lacking. Additionally, a report released by NRMA found that three out of five stations along the Newcastle line did not have commuter car parking.81
The region’s population is expected to increase by 200,000 in the next two decades,82 meaning that
public transport services will need to be improve in order to keep up with demand.
There is an opportunity for the state and local governments to capitalise on assets owned by community and private organisations to top up local transport services.
For example, the Stockton RSL and Citizens Club, the Teralba Bowling Club Co-op, the Toronto Workers Club, the Royal Motor Yacht Club Toronto, Toronto Diggers, Valentine Bowling Club Co-Op are all examples of clubs along the Newcastle train line that offer courtesy buses and could be contracted to offer intra-suburban transport routes.
Wollongong & Illawarra Region
Eighty kilometres south of Sydney lies Wollongong, New South Wales’ third largest city, and a popular commuter town for Sydney workers. The express train from Wollongong to Sydney takes just over an hour and a half. However, as with Newcastle, Wollongong suffers from a lack of connecting transport services to the major transport hubs.
A survey with members of the Illawarra Business Chamber in 2014 found that over 95 per cent of businesses want to see better transport links to Sydney, and inefficiencies in transport links drive up the costs of doing business in the Illawarra.83
Wollongong has a population of 207,000, but is poorly serviced by public transport. Census data from 2011 shows that overwhelmingly, people in Wollongong use their cars to travel to work: 58,000 drivers compared with about 5500 public transport passengers.84 Certain suburban areas within Wollongong have demonstrated this excessive reliance on cars as their primary means of transport.
Port Kembla
Port Kembla is a region in southern Wollongong, and is among the most socio-economically disadvantage areas within Wollongong. The Socio-Economic Index for Areas (SEIFA), 2011,85 determined that the area was not only among the lowest-income earners in

40
M C K E L L I N S T I T U T E Two Birds, One Stone: Harnessing Community Assets to Improve Transport Connectivity in New South Wales.
New South Wales, but also among those most reliant on their own vehicle to travel.
The SEIFA indicated that, out of almost 1400 people surveyed, only 93 regularly relied on public transport to get to work. At 5.3 per cent of the local population, this is significantly below the state average of 13.8 per cent.
Port Kembla has two train stations that connect the suburb to central Wollongong and the Sydney metropolitan train network. However, this line is grossly underutilized: on the day of surveying, only 41 Port Kembla residents used the train to get to work, compared with 1,171 who used a car as a driver, 120 who rode as a passenger in a car, and 52 residents who walked to work.
Such an inability to utilise the public transport system available in the area suggests a significant transport disadvantage within Port Kembla. In order to enhance the utilisation of the existing transport assets within the suburb, greater access to the stations must be prioritised.
Port Kembla Leagues Club is located on the northern fringe of the suburb, and has the capacity to run localised shuttle bus services throughout the area. Currently, however, this service has been suspended, with the Port Kembla Leagues club citing insufficient patronage.86 Considering only 2.3 per cent of Port Kembla residents access the existing train service in the suburb, there exists an opportunity for the NSW Government to partner with Port Kembla Leagues Club and re-open the operation of its courtesy services to shuttle residents between their homes and the station, which is located in close proximity to the club, improving connectivity within Port Kembla as well as increasing patronage for the club’s shuttle service.
By engaging the local leagues club and enabling it to extend its current courtesy services throughout the week, the NSW Government could further improve transport access to the residents of Port Kembla. Doing so would reduce the transport disadvantage in the area and encourage residents to reduce their reliance on cars as a means to get to work, enabling greater social and economic opportunities for Port Kembla residents.
Thirroul
Thirroul is a seaside suburb in the city of Wollongong, 69 km south of Sydney with a population of 5,620.87 In 2013 the NSW state Government altered timetabling arrangements on the South Coast line that transformed Thirroul station into a commuter hub designed for commuters to drop and ride. Thirroul station has become the only station north of the Wollongong CBD that gives commuters access to express services to Sydney, resulting in an influx of commuters driving and parking at the station instead of utilising the local services. The surrounding streets have been inundated with commuter cars, placing pressure on the local community and local businesses who have been crowded out.
To NSW state Government built a $2 million, 150 space commuter car park88 in an effort to alleviate the pressure commuter cars are putting on the local community. Despite this effort the car park was met with outrage from residents who were poorly consulted throughout the car parks development and construction phase. Resultantly, the car park has suffered from a lack of patronage since its development. The car park is located 400 meters away from Thirroul station and is on the alternate side of the motorway. The new car park is disconnected from the station, with no pedestrian link requiring commuters to walk up to 5 minutes to the nearest traffic light crossing, additionally the path has poor lighting and is not monitored by CCTV which raises concerns of safety at night.89 Consequently the car park is severely underused with the Illawarra Mercury reporting that only 14 of the 150 spaces were occupied.90
There is potential for a partnership between the local Thirroul Bowling, Leagues and Recreation Club and the state government to allow commuters to utilise the car park at the Leagues and recreation club.
The Thirroul Leagues and Recreation club is within 50 meters of the station and has a car park for approximately 60 cars. The utilisation of the clubs car park would primarily ease congestion pressure as a result of commuters parking on local streets and ensuring that commuters feel safe parking neat the station. Mutual investment in infrastructure that

41
M C K E L L I N S T I T U T E Two Birds, One Stone: Harnessing Community Assets to Improve Transport Connectivity in New South Wales.THEMcKellInstitute
better connects the commuter car park, Thirroul Leagues and Recreation Club’s carpark and Thirroul Station by the Government of New South Wales and the club could benefit commuters in the area. While the NSW government significantly invested in its own commuter car park to service the station, an opportunity exists to harness the existing community infrastructure near the station which is owned by the Thirroul Leagues and Recreation Club.
There is also an opportunity for partnerships to be developed with local clubs to utilise club courtesy buses and underused car parks as commuter pick up and drop off points. This would spread commuter parking across a number of suburbs and greatly ease the commuter burden on Thirroul residents and businesses.
REGIONAL TOWNS
Uralla
The regional town of Uralla has a population of 2,833 people and is located within the Northern Tablelands of NSW, 465 kilometres north-west of Sydney. Uralla currently lacks a public transport system that operates within and around the town.
The only transport in Uralla is offered by Edwards Coaches, operating Monday to Friday, with three trips per day during school periods, and two trips per day during school holidays,91 with no bus services operating on weekends.
Uralla has access to community transport services Tablelands Community Transport, a not-for-profit, volunteer-based organisation that is administered by NSW Transport and Uralla Shire Council. To access Tablelands Community Transport ‘residents must be a person living independently in the community who is either: frail aged, has permanent or moderate disability, carers of frail aged or disabled people, transport disadvantaged, or geographically isolated’.92
For Uralla residents who do not have access to the Tablelands Community Transport there is no alternative that can affectively meet the needs of the
community. Additionally, the lack of transport poses severe dangers of drink driving for people traveling both within Uralla and to and from Armidale which is the closest major town.
The town of Uralla does have access to an underutilised courtesy bus from the Uralla Bowling and Recreation Club, which only operates its courtesy bus on Friday nights from 6pm to 10pm. Armidale also has access to courtesy buses from the Armidale Services Club.93
The courtesy bus owned by Uralla Bowling and Recreation Club could be more greatly utilised by the community in order to shuttle residents around the town and to major services such as the medical centre, town centre, library and train station. The local government should assess the funding and ticketing options for this proposal: Consideration would need to be given to whether the service is offered at a fixed rate and at certain times and on certain days, or whether the service is offered on an ad-hoc basis subject to need should be examined in order to determine the best option for this small town.

42
M C K E L L I N S T I T U T E Two Birds, One Stone: Harnessing Community Assets to Improve Transport Connectivity in New South Wales.
THEMcKellInstitute
Sydney’s growing and expanding population requires continual investment in new transport infrastructure. However, this investment must be delivered in a targeted and strategic fashion that capitalises on existing assets to best serve transport black spots throughout metropolitan Sydney.
Through partnerships with community organisations such as clubs, schools and nursing homes, the NSW Government could invest in collaborative ways to harness latent assets such as shuttle buses and car parks that often sit idle within their communities.
Such measures could further enhance the provision of community transport, which provides an essential service to the New South Wales public and minimises the pressures on the broader public transport system.
Solving inter-connectivity issues within suburban transport networks is central to encouraging more individuals to transition from commuting by car to commuting by train, bus and ferry. The procurement of additional vehicles and development of more Park and Ride facilities remains important to meeting demand.
The suite of recommendations included in this report aim to best address the transport needs of a growing and ageing New South Wales population through cost-effective solutions that capitalise on the community’s existing assets.
Concluding Remarks
M C K E L L I N S T I T U T E Pipe Dreams Reducing the Cost of Public Infrastructure in Australia
This report has identified the ongoing challenges to Sydney’s transport network, and tabled recommendations aimed at harnessing existing community assets to enhance transport services within the city.

43
M C K E L L I N S T I T U T E Two Birds, One Stone: Harnessing Community Assets to Improve Transport Connectivity in New South Wales.THEMcKellInstitute

44
M C K E L L I N S T I T U T E Two Birds, One Stone: Harnessing Community Assets to Improve Transport Connectivity in New South Wales.
References1. NSW Government, ‘Statewide
Access,’ NSW Long Term Transport Master Plan, December 2012, Accessed online 6 January 2016: http://www.transport.nsw.gov.au/sites/default/files/b2b/publications/nsw-transport-masterplan-final.pdf
2. Infrastructure Australia, Australian Infrastructure Audit: Our Infrastructure Challenges, April 2015.
3. Paul Donegan and Jane-Frances Kelly, ‘Sydney’s stuck in traffic, putting the brakes on women and the west,’ The Conversation, 2 March 2015.
4. Megan Levy, ‘Sydney among the Western world’s worst cities for traffic congestion, report reveals,’ Drive, 10 April 2013.
5. NSW Government Bureau of Transport Statistics, TransFigures: Travel Forecasts 2011-2046.
6. Australian Government, Department of Infrastructure and Transport, Walking, Riding and Access to Public Transport: Supporting Active Travel in Australian Communities, Ministerial Statement, July 2013.
7. Australian Bureau of Statistics, 9300DO001 Motor Vehicle Census, Australia, 31 January 2015.
8. Australian Bus Fleets, NSW Bus Fleet list http://fleetlists.busaustralia.com/index-nsw.php accessed 26/11/2015
9. NRMA,Seeing Red on Roads 2015 results released, 6 October 2015.
10. Paul Donegan and Jane-Frances Kelly, ‘Sydney’s stuck in traffic, putting the brakes on women and the west,’ The Conversation, 2 March 2015.
11. Paul Donegan and Jane-Frances Kelly, ‘Sydney’s stuck in traffic, putting the brakes on women and the west,’ The Conversation, 2 March 2015.
12. TomTom, ‘Measuring congestion worldwide,’ TomTom Traffic Index, 2015. Accessed 24 November 2015: https://www.tomtom.com/en_au/trafficindex/#/list
13. TomTom, ‘Measuring congestion worldwide,’ TomTom Traffic Index, 2015. Accessed 24 November 2015: https://www.tomtom.com/en_au/trafficindex/#/list
14. Douglas Economics, ‘Modelling the ability of fare incentives to spread AM peak passenger loads,’ Infrastructure Australia, May 2012.
15. Douglas Economics, ‘Modelling the ability of fare incentives to spread AM peak passenger loads,’ Infrastructure Australia, May 2012.
16. ABC News, ‘Two in three Australians drive to work, study of commuting habits finds,’ ABC News, 3 February 2014.
17. McCrindle Research, ‘Getting to work,’ The McCrindle Blog, 3 February 2014.
18. McCrindle Research, ‘Getting to work,’ The McCrindle Blog, 3 February 2014.
19. NSW Government Bureau
of Transport Statistics, ‘TransFigures: Travel Forecasts 2011-2046, March 2014. Accessed 24 November 2015: www.bts.nsw.gov.au/.../80/trans2014-03-stm-travel-forecasts.pdf.aspx
20. Kate Rosier and Myfanwy McDonald, ‘The relationship between transport and disadvantage in Australia,’ Child, Family, Community Australia, Australian Government, Australian Institute of Family Studies, August 2011.
21. ABS Data 2006
22. https://aifs.gov.au/cfca/publications/relationship-between-transport-and-disadvantage-austr
23. Paul Donegan and Jane-Frances Kelly, ‘Sydney’s stuck in traffic, putting the brakes on women and the west,’ The Conversation, 2 March 2015.
24. NSW Government, ‘Why Transport Matters,’ NSW Long Term Transport Master Plan, December 2012. Accessed online 6 January 2016: http://www.transport.nsw.gov.au/sites/default/files/b2b/publications/nsw-transport-masterplan-final.pdf
25. NSW Government, ‘Providing Essential Access for Regional NSW,’ NSW Long Term Transport Master Plan, December 2012. Accessed online 6 January 2016: http://www.transport.nsw.gov.au/sites/default/files/b2b/publications/nsw-transport-masterplan-final.pdf
26. David Meddows, Seeing Red on

45
M C K E L L I N S T I T U T E Two Birds, One Stone: Harnessing Community Assets to Improve Transport Connectivity in New South Wales.THEMcKellInstitute
Rail results are in – here’s what you think, NRMA, 2 June 2014.
27. New South Wales Department of Planning & Environment, 2014. ‘Population Projections’, Accessed online November 30 2015: http://www.planning.nsw.gov.au/projections
28. Charting Transport, Public transport patronage trends in Australasian cities. Access online January 30 2016: http://chartingtransport.com/2010/11/13/public-transport-patronage-trends
29. Local Government Authority, 2011. ‘Comparisons of Public Transport Operations’, Accessed online November 30 2015: http://www.lta.gov.sg/ltaacademy/doc/J11Nov-p71ComparisonofPublicTransportRevised.pdf
30. ibid
31. Australian Bus Fleets, NSW Bus Fleet list http://fleetlists.busaustralia.com/index-nsw.php accessed 26/11/2015
32. Australian bus fleets, NSW bus fleets list http://fleetlists.busaustralia.com/index-nsw.php accessed 26/11/2015
33. Infrastructure NSW, 2012. ‘Bus and Light Rail in Sydney’, Accessed online November 30 2015: http://www.infrastructure.nsw.gov.au/media/16982/sis_report_section7.0_print.pdf
34. NSW Government, Sydney’s Bus Future: Simpler, Faster, Better bus services, December 2013. Accessed 3 February 2016: http://mysydney.nsw.gov.au/sites/default/files/user-files/uploads/bus-future-final-web.pdf
35. http://www.transport.nsw.gov.au/customers/bus-coach/sydney-bus-contract-regions
36. http://www.transport.nsw.gov.au/sites/default/files/b2b/
abouttrans/Region-1.pdf
37. NSW Government (2013) ‘Sydney’s Bus Future: Simpler, faster, better bus services’, accessed 30/9/15, http://mysydney.nsw.gov.au/sites/default/files/user-files/uploads/bus-future-final-web.pdf
38. Ibid
39. Iverson. K (March 7, 2013) Western Sydney needs fast transport solutions, The Drum http://www.abc.net.au/news/2013-03-07/iveson-western-sydney-transport/4557568
40. NSW Government (2013) ‘Sydney’s Bus Future: Simpler, faster, better bus services’, accessed 30/9/15, http://mysydney.nsw.gov.au/sites/default/files/user-files/uploads/bus-future-final-web.pdf
41. Saulwick. J (12 Nov 2012) ‘Linking services vital to get the city moving’, Sydney Morning Herald http://www.smh.com.au/nsw/linking-services-vital-to-get-the-city-moving-20121111-296h0.html
42. Saulwick. J (12 Nov 2012) ‘Linking services vital to get the city moving’, Sydney Morning Herald http://www.smh.com.au/nsw/linking-services-vital-to-get-the-city-moving-20121111-296h0.html
43. NSW Government, ‘Statewide Access,’ NSW Long Term Transport Master Plan, December 2012, p306. Accessed online 6 January 2016: http://www.transport.nsw.gov.au/sites/default/files/b2b/publications/nsw-transport-masterplan-final.pdf
44. NSW Government, ‘Statewide Access,’ NSW Long Term Transport Master Plan, December 2012, p306. Accessed online 6 January
2016: http://www.transport.nsw.gov.au/sites/default/files/b2b/publications/nsw-transport-masterplan-final.pdf
45. NSW Government, ‘Statewide Access,’ NSW Long Term Transport Master Plan, December 2012, p306. Accessed online 6 January 2016: http://www.transport.nsw.gov.au/sites/default/files/b2b/publications/nsw-transport-masterplan-final.pdf
46. State and Regional Development Committee, NSW Parliament (2014) Inter-Regional Public Transport, Legislative Assembly of New South Wales pg. 32 https://www.parliament.nsw.gov.au/prod/parlment/committee.nsf/0/5d81a2253954ef35ca257ca000181020/$FILE/Report%201-55%20-%20Inter-regional%20Public%20Transport.pdf
47. State and Regional Development Committee, NSW Parliament (2014) Inter-Regional Public Transport, Legislative Assembly of New South Wales pg. 32 https://www.parliament.nsw.gov.au/prod/parlment/committee.nsf/0/5d81a2253954ef35ca257ca000181020/$FILE/Report%201-55%20-%20Inter-regional%20Public%20Transport.pdf
48. State and Regional Development Committee, NSW Parliament (2014) Inter-Regional Public Transport, Legislative Assembly of New South Wales https://www.parliament.nsw.gov.au/prod/parlment/committee.nsf/0/5d81a2253954ef35ca257ca000181020/$FILE/Report%201-55%20-%20Inter-regional%20Public%20Transport.pdf
49. Transport for New South Wales, 2014. ‘Master Transport Plan’, p 236, accessed online January 4 2016: http://www.transport.nsw.gov.au/sites/default/files/b2b/publications/nsw-transport-masterplan-final.pdf

46
M C K E L L I N S T I T U T E Two Birds, One Stone: Harnessing Community Assets to Improve Transport Connectivity in New South Wales.
50. Australian Bureau of Statistics, 2011 Census Community Profiles: Greater Sydney. Updated 28 March 2013. Accessed 8 January 2016: http://www.censusdata.abs.gov.au/census_services/getproduct/census/2011/communityprofile/1GSYD?opendocument&navpos=220
51. NSW Government (2015) Point to Point Transport Taskforce: Report to the Minister for Transport and Infrastructure, pg. 21 http://www.transport.nsw.gov.au/sites/default/files/b2b/publications/point-to-point-transport-taskforce-report-to-minister.pdf
52. Our Lady of Consolation Aged Care Services, ‘High Care’. Accessed online November 25 2015: http://www.oloc.com.au/residential-care/dsp-default.cfm?loadref=30
53. Killeen, G. 2014. ‘Transport accessibility in Australia today’, ABC. Accessed online 25 November 2015: http://www.abc.net.au/rampup/articles/2014/01/06/3921049.htm
54. Department of Infrastructure and Regional Development, 2012. ‘Transport for New South Wales’. Accessed online 25 November 2015: https://infrastructure.gov.au/transport/disabilities/review/files/2012_Submissions/No_95_Transport_for_New_South_Wales.pdf pg. 9
55. Australian Bus Fleets, NSW Bus Fleet list http://fleetlists.busaustralia.com/index-nsw.php accessed 26/11/2015
56. Pymble Ladies College, ‘College Bus Service’. Accessed online 25 November 2015. http://www.pymblelc.nsw.edu.au/enrolments/college-bus-service
57. Domremy College, ‘Travel – Bus routes servicing domremy’, Accessed online 25 November 2015. http://www.domremy.catholic.edu.au/uploads/ufiles/PDFs/bus_routes.pdf
58. Santa Sabina College, 2014. ‘New Santa Private Bus Arrives’. Accessed online 25 November 2015: http://www.ssc.nsw.edu.au/2014/01/new-santa-private-bus-route
59. Meriden. ‘Location and Transport’. Accessed online 25 November 2015: http://www.meriden.nsw.edu.au/about-us/location-and-transport
60. Australian Bureau of Statistics, 2015. ‘Motor Vehicle Census, 31 January 2015’. Accessed online 25 November 2015: http://www.abs.gov.au/AUSSTATS/[email protected]/DetailsPage/9309.031%20Jan%202015?OpenDocument
61. Australian Bus Fleets, NSW Bus Fleet list http://fleetlists.busaustralia.com/index-nsw.php accessed 26/11/2015
62. NSW Government, ‘Factsheet: Community Transport Accreditation,’ Transport for NSW. Accessed online 5 January 2016: http://www.cto.org.au/Sites/cto/CMS/Docs/CT_Sector_Resources/TfNSW%20Driver%20Safety/TfNSW-Factsheet-Community_Transport_Accreditation.pdf
63. The National Roads and Motorists’ Association, 2008. ‘Would you catch the train if you could Park and Ride?’ Accessed online 25 November 2015: http://www.mynrma.com.au/blog/2008/03/04/would-you-catch-the-train-if-you-could-park-and-ride
64. The National Roads and Motorist’s Association, 2010. ‘Railway Stations Audit – A Park and Ride and Kiss and Ride commuter facilities audit’. Accessed onlne 30 November 2015: http://www.mynrma.com.au/media/Railway_Stations_Audit.pdf
65. NRMA, ‘Railway Stations Audit: A ‘Park & Ride’ and ‘Kiss & Ride’ Commuter Facilities Audit,’ May 2012. Accessed 8 January 2016: https://www.mynrma.com.au/media/Railway_Stations_Audit.pdf
66. National Roads and Motorists’ Association, 2012. ‘A Park & Ride and Kiss & Ride Commuter Facilities Audit’. Accessed online 25 November 2015: http://www.mynrma.com.au/media/Railway_Stations_Audit.pdf
67. Sydney Olympic Park Authority 2014. About Us, Accessed online 12 November 2015: http://www.sopa.nsw.gov.au/about_us
68. Sydney Alliance, M4 Park and Ride. Accessed online 25 November 2015: http://www.sydneyalliance.org.au/m4_park_and_ride_faqs
69. Sydney Alliance, M4 Park and Ride. Accessed 2 February 2016: http://www.sydneyalliance.org.au/m4_park_and_ride_faqs
70. Shand, M. 2014, ‘Could Olympic Park be the answer to western Sydney’s traffic congestion?’ Daily Telegraph.
71. Sydney Olympic Park Authority 2014. About Us, Accessed online 12 November 2015: http://www.sopa.nsw.gov.au/about_us
72. Profile Id. 2011. ‘Taren Point Method of Travel to Work’. Accessed online 10 December 2015: http://profile.id.com.au/sutherland/travel-to-work?WebID=390
73. Australian Bureau of Statistics, 2011. Census Data: Sutherland Shire. Accessed online 8 December 2015: http://www.censusdata.abs.gov.au/census_services/getproduct/census/2011/quickstat/LGA17150?opendocument&navpos=220
74. Australian Bureau of Statistics, 2011. 2011 Census Quick States: Rooty Hill, accessed online 10 December 2015: http://www.censusdata.abs.gov.au/census_services/getproduct/census/2011/quickstat/SSC11989?opendocument&navpos=220
75. Our Lady of Consolation Aged

47
M C K E L L I N S T I T U T E Two Birds, One Stone: Harnessing Community Assets to Improve Transport Connectivity in New South Wales.THEMcKellInstitute
Care Services, 2013. Residential Care. Accessed online 10 December 2015: http://www.oloc.com.au/residential-care/dsp-default.cfm?loadref=30
76. Saulwick. J (30 Oct 2012) More people using public transport in Sydney – but car still wins the day, Sydney Morning Herald http://www.smh.com.au/nsw/more-people-using-public-transport-in-sydney--but-car-still-wins-the-day-20121030-28h3b.html
77. Ranke. M (17 March 2015) Passengers left stranded as Hills buses fill up, The Hills http://www.dailytelegraph.com.au/newslocal/the-hills/passengers-left-stranded-as-hills-buses-fill-up/story-fngr8i1f-1227265086296
78. Aged Care Guide, Constitution Hill Aged care Northmead https://www.agedcareguide.com.au/facility_details.asp?facilityid=14246
79. Id, ‘City of Newcastle: Workers’ place of residence,’ Accessed online 7 January 2016: http://profile.id.com.au/newcastle/workers
80. NSW Government, ‘Wickham Transport Interchange,’ Transport for NSW. Accessed 7 January 2016: http://www.transport.nsw.gov.au/projects-wickham-transport-interchange
81. NRMA, ‘Railway Stations Audit: A ‘Park & Ride’ and ‘Kiss & Ride’ Commuter Facilities Audit,’ May 2012. Accessed 8 January 2016: https://www.mynrma.com.au/media/Railway_Stations_Audit.pdf
82. Alison Branley, ‘More parking needed at train stations,’ Newcastle Herald, 20 May 2012. Accessed 8 January 2016: http://www.theherald.com.au/story/116312/more-parking-needed-at-train-stations
83. Price Waterhouse Coopers and Illawarra Business Chamber, Linking the Illawarra: Improving the region’s transport connectivity, August 2014. Accessed online 8 January
2016: http://businesschamber.com.au/NSWBC/media/Ilawarra/Advocacy/20140805-Illawarra-connectivity-study-revised-Final-Report-(with-inside-cover).pdf
84. Profile.id, Wollongong City: Method of travel to work.’ Accessed 8 January 2016: http://profile.id.com.au/wollongong/travel-to-work
85. http://www.censusdata.abs.gov.au/census_services/getproduct/census/2011/quickstat/SSC11897?opendocument&navpos=220
86. https://janellapurcell.com/wp-content/uploads/2012/12/Illawara-Mercury-Interview-2013.pdf
87. Australian Bureau of Statistics, 2011 Census. Accessed online 25 November 2015: http://www.abs.gov.au/websitedbs/censushome.nsf/home/census?opendocument&navpos=10
88. Humphries. G (4 March 2015) Thirroul’s 150-space commuter car park dig begins, Illawarra Mercury http://www.illawarramercury.com.au/story/3056144/parking-spaces-to-double-for-thirroul-commuters
89. Humphries. G (4 March 2015) Thirroul’s 150-space commuter car park dig begins, Illawarra Mercury http://www.illawarramercury.com.au/story/3056144/parking-spaces-to-double-for-thirroul-commuters
90. Humphries. G (4 March 2015) Thirroul’s 150-space commuter car park dig begins, Illawarra Mercury http://www.illawarramercury.com.au/story/3056144/parking-spaces-to-double-for-thirroul-commuters
91. Edward Coaches, accessed 4 Jan 2016 http://www.edwardscoaches.com.au/route480-summer.html
92. Tablelands Community Transport, accessed 4 Jan 2016, http://www.tablelandscommunitytransport.com.au/our-services.php
93. Uralla Bowlo, accessed 4 Jan 2016, http://www.urallabowlo.com.au/facilities/courtesy-bus.php

THEMcKellInstitute
THEMcKellInstitute
www.mckellinstitute.org.au