harvard endowment fund
TRANSCRIPT

HARVARDENDOWNMENT FUND
Tian LunDonavan Lim
Foo Wei ShingNg Wenying
The Endowment Model

Content
1 Background on Harvard & Yale Endowment
2 Harvard vs Yale
3 What went wrong in 2009?
4 Current Risk Environment and Harvard’s Changing Obligation
5 How Harvard Modified Swensen Model Post Crisis
6 Portfolio Optimisation Analysis and Recommendations

Background: Yale & Harvard Rivalry
• Yale and Harvard, rivals in the academic sphere, extended their rivalry to the sports and financial world.
• Yale pioneered a new endowment model that returned superior returns which resulted in many endowment fund seeking to emulate the Yale model.
• This became known as the Yale or Swensen model.• Not to be outdone, Harvard “pioneered” its Hybrid model.
1
Yale Harvard
Swensen Model Hybrid Model

• Named after David Swensen, chief investment officer of Yale University
• Swensen had steered Yale’s endowment 1985: US$1bn 2008: US$22.9bn
• Under Swensen, Yale pioneered an unconventional approach to managing its endowment Swensen Model
• In the model, significant investments were made in less efficient equity markets o private equity (venture capital and
buyouts),o real assets (real estate, timber, oil,
and gas), ando absolute-return investments (hedge
funds).
Background: Swensen Model1
History Principles
• Equities, whether publicly traded or private. He pointed out that equities are a claim on a real stream of income, as opposed to a contractual sequence of nominal cash flows (such as bonds)
• Diversification. In general, Yale believed that risk could be more effectively reduced by limiting aggregate exposure to any single asset class, rather than by attempting to time markets.
• Seek opportunities in less efficient markets
• Fourth, Swensen believed strongly in using outside managers for all but the most routine or indexed investments
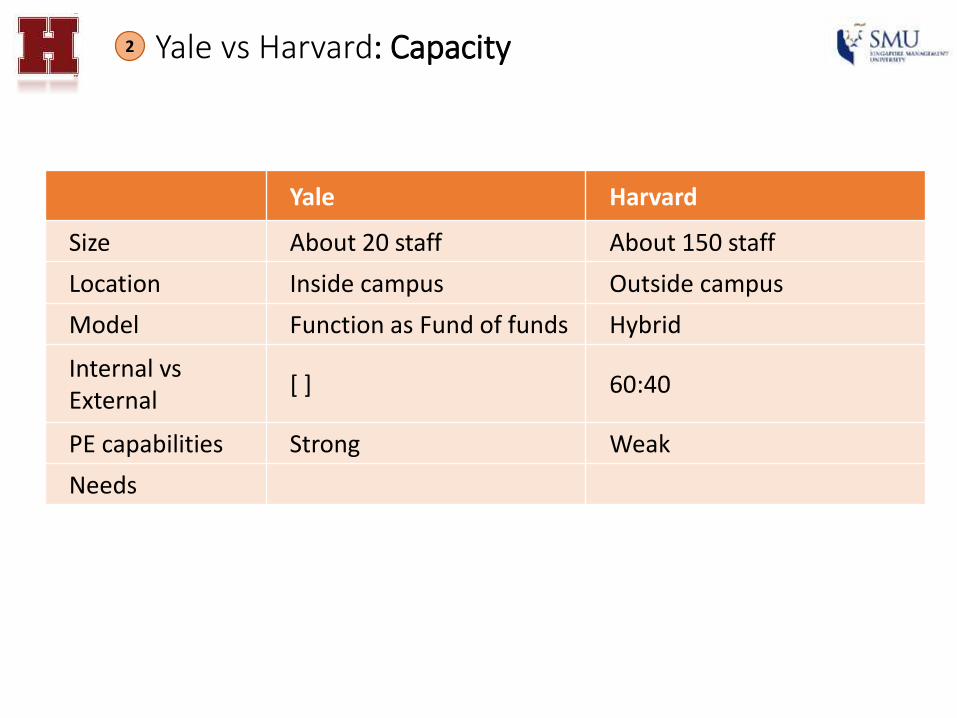
Yale Harvard
Size About 20 staff About 150 staff
Location Inside campus Outside campus
Model Function as Fund of funds Hybrid
Internal vs External
[ ] 60:40
PE capabilities Strong Weak
Needs
Yale vs Harvard: Capacity2

Return % 2000 2001 2002 2003 2004 2005 2006 2007 2008 2009 2010 2011
Yale 41 9.2 0.7 8.8 19.4 22.3 22.9 28 4.5 -24.6 8.9 14.6
Harvard 32.2 -2.7 -0.5 12.5 21.1 19.2 16.7 23 8.6 -27.3 11.0 21.4
S&P 500 7.2 -14.8 -18 0.3 19.1 6.3 8.6 20.6 -15 -32 15 10.5
Wilshire 5000
9.5 -15.3 -16.6 1.3 21.2 8.4 10.2 21 -14 -32 18 10.5
Government bond index
7 9.6 8.8 20.2 -4.3 18.8 -7.3 5.9 12.4 7.7 11.9 9.5
Consumer price index
3.7 3.2 1.1 2.1 3.3 2.5 4.3 2.9 5.2 -0.4 1.9 3.7
Source: Bloomberg and Cases
Yale vs Harvard: Performance2

Source: Bloomberg and company documents
Asset Class (%)
Yale Harvard Yale Harvard
2008 2008 2010 2010Domestic equity
10.1 12.0 7.011.0
Foreign equity
15.2 22.0 9.922.0
Bonds 4.0 15.0 4.0 11.0Cash -3.9 -5.0 0.4 2.0Real assets 29.3 9.0 27.5 9.0Private equity 20.2 11.0 30.3 13.0Absolute return
25.1 18.0 21.016.0
Commodities 0.0 17.0 0.0 14.0High Yield 0.0 1.0 0.0 2.0
Yale vs Harvard: Asset Allocation2

What Went Wrong in 2009?3
2008 Sept: Lehman Brothers Holdings collapsed, precipitating an economic decline that had begun with the subprime mortgage crisis and setting off a global rout across financial markets.
The Dow Jones fell over 500 points (−4.4%) on a single day. Continue to decline through early 2009, whereupon it fell below 7,000 points – less than half of its 2007 high.
2009 June: Harvard University’s endowment fund manager booked losses of 27% and a staggering US$10.1 billion of its assets were wiped out.Yale: Lost 24.6% of assets (FY09)
Harvard underperformed Policy Portfolio (a smaller 25.2% loss)Harvard underperformed more than any other Ivy League school Cutbacks in capital spending & student services
Both Yale and Harvard were plagued by liquidity issue due to investment in alternative assets as market tanked Such assets take considerable time to unwind. Hedge fund even halted redemptions in 2008
Interest-rate swaps:Former President entered into series of Interest-rate swap to cap I/r on future debt issuance but required posting collateral when I/r declined
HMC lost more than US$550mn because of I/r decline

Capital Market conditions• Given high unemployment in the US and uncertain economic conditions , the equity markets pursued a strong
upward climb through the first months of 2010• Bond markets were functioning fairly normally for the most part, with reasonable liquidity and persistently low
rates. • High yield spreads declined, indicating that the risk of default was lessening• Long rates on US Treasuries were pushed lower as investors sought safe haven investments.
Current Environment: Capital Market4

Harvard Business School Considerations• Harvard’s need to Maintain the “vigour” and “Longevity” of the
endowment • Ongoing stagnation in median household income growth and
Federal Budget Cuts in education across the has put increasing pressure on grant aid expenditures ( The endowment now funds 35% of the total University budget. )
• As Private Equity landscape evolves and becomes more global, Challenge for Harvard to look for the best opportunities
• Close attention to liquidity, capital commitments and risk management ( avoid the mistake of 2009 )
Source: Harvard 2009 Annual Report
4 Current Environment: Harvard’s Obligations

4 Current Environment: Asset Correlations
Correlation of assets changes during times of crisis

4 Current Environment: Analysis of Asset Classes
Asset Class Suitability Optimality Diversification Illiquidity of Assets Potential Conflicts of Interest
Domestic EquitiesForeign EquitiesEmerging Markets
Suitable
Potentially High Returns
Emerging markets has tremendous opportunities due to both their greater inefficiencies and their
dynamic, growing economies
Overall portfolio risk can be diversified if managed
properly
Liquid(Marketable securities can be illiquid during
crisis?)
Collateral for short-term loans (security lending
agreement)
Money managers may tend to emphasize asset growth at the
expense of performance
Private Equity
Suitable**Investors cannot withdraw their invested capital whenever they
wish
Potentially High ReturnsWith high returns
attracting new investors who flooded money into the sector until returns
deteriorated
Diversification across General partners and
industriesIlliquid
Key principle was to select organizations in which the
incentives were properly aligned
Absolute Returns Suitable ** Potentially High Returns
Historically provided retunes largely
independent of overall market moves
IlliquidMoney managers may tend to emphasize asset growth at the
expense of performance
CommoditiesReal Estate
Suitable **
Potentially High ReturnsHigh and visible current
cash flow and opportunity to exploit inefficiencies
Sensitivity to inflationary force
Illiquid
Misalignment or conflicts of interest in external firm’s compensation motivation
Domestic BondsForeign BondsInflation-indexed Bonds
Suitable Low Returns
Relative low covariancewith other asset classes and
serves as a hedge against financial accidents or
periods of unanticipated deflation
LiquidIn situations of severe
liquidity shortages, Bonds can be used as
collateral for short-term loans

Post Crisis – How Harvard Modified Swensen?
1
Objective: Increase flexibility, reduce leverage and explore attractive investment themes foreseen emerging after the crisis.
Decrease uncalled capital commitments by roughly $3 Billion
2 Increased the depth and breadth of talents in the investment team - in fixed income/Asian markets, in equity arbitrage, in real estate and in externally managed funds
3 Continuation of the Hybrid Model• No change to the mix of internal and
external managers (as it would allow access to best strategy for each asset class)
• To give the portfolio the breath and depth.
• Look to increase the share of internally managed assets instead
‒ Added a COO from Pimco, a new CFO and CTO, other restructuring within investment team
5

4 Continue to emphasize on having risk tolerance as critical factor in asset allocation decisions.
5 Re-engineered the Policy Portfolio
Greater concentration in areas where HMC has unique competitive strengths such as fixed income and real assets
Fewer distinctions among the finely tuned asset classes to encourage greater collaboration among our teams in exploring investment themes
Rigorous reassessment of the fit between the endowment’s risk profile and the University’s needs.
Spectrum of Horizon introduced; short term, medium term, long term.
Post Crisis – How Harvard Modified Swensen?5

6 Integrate Risk management, liquidity and leverage management with portfolio management:o Risk: Wider range of stress tests, Buying of Insurance as protection instead of cutting exposure which may
reduce flexibility• However stress test results were subjected to accuracy of information on external manager’s
position which are often lagged, infrequent and impreciseo Asset allocation: Usage of optimal portfolio analysis, reexamining assumptions such as the range of
historical data used to reflect more current market conditions, reexamining inter-asset assumptions used to produce the efficient frontier• However the limitations of the efficient frontier is that it is very sensitive to the relative structure of
input assumptions particularly with 12 asset classes involved
7 Actions by External Managerso A subset of our external hedge fund managers, changed their investors’ ability to redeem capital,
ostensibly to protect their funds’ remaining assets.
Post Crisis – How Harvard Modified Swensen?5

Harvard’s Modification – Is it Enough?
Remaining Issues:• Liquidity position:
o Will Harvard meet liquidity needs? o Should there be a liquidity benchmark in addition to policy portfolio benchmark?o With endowment spending accounting for more than one third of total university
budget, what should change?• Asset allocation:
o Will alternative investments continue to provide high return in future?
5

Portfolio Optimization Analysis: Inputs6
• Optimize the Policy Portfolio with benchmark indexes being proxies.
• Mean-variance approach. Follow the original asset allocation of the policy portfolio. Allow permissible range of 5%.
• Take into consideration that the increasing correlation pattern during crisis time.
• Adjust asset allocation in line with Harvard’s liquidity needs, risk tolerance, etc.

Portfolio Optimization Analysis: Benchmarks6
• 10-year-long time horizon. Fully captured a complete economic cycle.
• Monthly return, 120 neutralized data points.

Portfolio Optimization Analysis: Return & StdDv6

Portfolio Optimization Analysis: Increases Correlations
6
1999-2009 “Pre-Crisis” Correlation “In-Crisis” Increased Correlation

Exp. Return: 7.10%Sharpe Ratio: 0.59
Portfolio Optimization Analysis: Results6

• Monthly review of liquidity position vs Annual review• Forecast spending (Yale uses a forecast model)• Given the difference in absolute return between top tier and other fund managers,
applying Yale’s strategy of employing more Private Equity in their portfolio may not work for all Harvard should focus on assets where they have a niche; Equity
• Use of high illiquidity hurdle rates to enter illiquid investments
Other Recommendations6
Liquidity Premium Benchmarking
Source: Columbia Business School
Other Recommendations

HARVARDENDOWNMENT FUND
Tian LunDonavan Lim
Foo Wei ShingNg Wenying
APPENDIX

Source: Columbia Business School
Appendix: Private Equity7

• Another is the focus on hunting for the best hedge funds, private-equity managers and stock pickers it's impossible for every institution to have the best managers.
• By definition, many institutions end up hiring managers who are below average. Consequently, many of them would be better off investing in index funds rather than finding themselves on the wrong side of the wide gulf that separates the performance of the best and worst managers.
Appendix7

• The Policy Portfolio is a theoretical portfolio allocated among asset classes in a mix that is judged to bemost appropriate for Harvard University from both the perspective of potential return and risk over thelong term.
• The Policy Portfolio differs from a traditional stock/bond portfolio, including allocations to less-traditional and less-liquid asset categories, such as private equity, real estate, and absolute returnstrategies.
• The Policy Portfolio provides us with a guide as to the actual allocation in the investment portfolio andalso serves as a measuring stick against which we judge the success of our active investmentmanagement activities.
Appendix: Policy Portfolio7

Appendix: Policy Portfolio7