harvey nash group plc annual report 2016
TRANSCRIPT
Harvey Nash Group plcAnnual Report 2016
2 / HARVEY NASH GROUP PLC ABOUT HARVEY NASH
Overview
2 About Harvey Nash
3 Highlights
4 Mission
6 Meet the Group Board and Executive Council
7 Directors, Secretary and Advisers
9 Chairman’s Statement
Strategic Report
12 Strategy
13 Model
15 Principal Risks
18 CEO Review
21 Key Performance Indicators
22 FD Review
24 Corporate Responsibility
About Harvey NashHarvey Nash is a global recruitment business. Our unique portfolio of services, from executive search, professional recruitment to offshore solutions, enables us to engage with clients at every stage of the business cycle. Our relationship-based model underpins the delivery of resilient financial results and supports returns to shareholders.
The Group partners with many of the world’s leading organisations to source, recruit and manage the highly skilled talent they need to succeed in an increasingly competitive and technology-driven world.
With 8,000 professionals in 47 offices across the USA, Europe, Asia and Australasia, the Group has the reach and resources of a global organisation, while fostering a culture of innovation and autonomy that empowers its employees and associates to deliver client-centric solutions.
Governance & Accounts
27 Corporate Governance
32 Directors’ Report
34 Directors’ Remuneration Report
53 Audit Committee Report
56 Statement of Directors’ Responsibilities
57 Independent Auditor’s Report
63 Consolidated Income Statement
64 Consolidated Balance Sheet
65 Consolidated Statement of Changes in Equity
66 Consolidated Cash Flow Statement
67 Notes to the Consolidated Financial Statements
96 Financial Statements for the Parent Company under FRS 101
101 Full List of Subsidiaries

HARVEY NASH GROUP PLC HIGHLIGHTS / 3
EPS*
8.8%Operating Profit*
9.0%
73.3%
Dividends
Operating Cash
HighlightsGross profit*
Basic earnings per share*
Dividend per share
Net cash generated from operating activities
2.7p
2.9p
3.2p
3.5p
3.9p
2012
2013
2014
2015
2016
£70.6m
£76.3m
£83.3m
£84.9m
£90.3m
2012
2013
2014
2015
2016
6.2p
7.1p
9.0p
8.5p
9.4p
2012
2013
2014
2015
2016
£1.8m
£6.7m
£5.4m
£7.5m
£13.0m
2012
2013
2014
2015
2016
6.4%
10.7%
31 January 2016: £90.3m31 January 2015: £84.9m
31 January 2016: 9.42p31 January 2015: 8.51p
31 January 2016: £9.9m31 January 2015: £9.1m
31 January 2016: 3.850p31 January 2015: 3.531p
31 January 2016: £13.0m31 January 2015: £7.5m
Gross Profit*
*From continuing operations.
4 / HARVEY NASH GROUP PLC MISSION
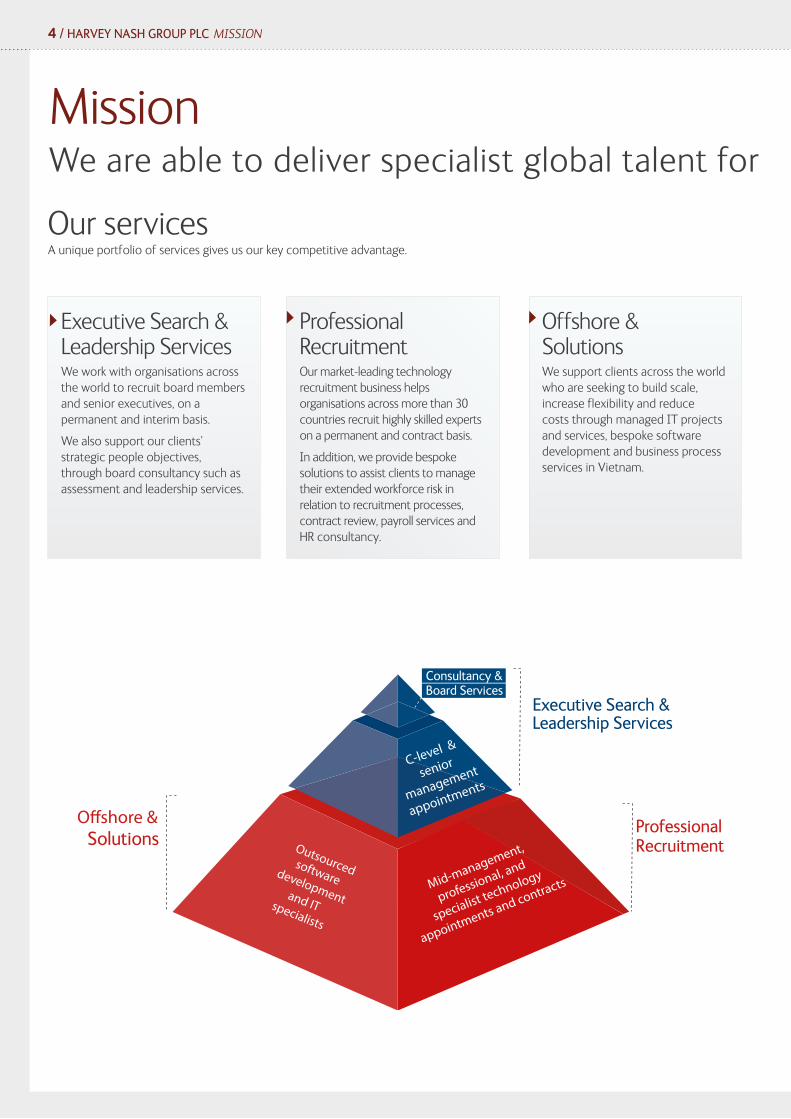
Our servicesA unique portfolio of services gives us our key competitive advantage.
Executive Search & Leadership ServicesWe work with organisations across the world to recruit board members and senior executives, on a permanent and interim basis.
We also support our clients’ strategic people objectives, through board consultancy such as assessment and leadership services.
Professional RecruitmentOur market-leading technology recruitment business helps organisations across more than 30 countries recruit highly skilled experts on a permanent and contract basis.
In addition, we provide bespoke solutions to assist clients to manage their extended workforce risk in relation to recruitment processes, contract review, payroll services and HR consultancy.
Offshore & SolutionsWe support clients across the world who are seeking to build scale, increase flexibility and reduce costs through managed IT projects and services, bespoke software development and business process services in Vietnam.
Executive Search & Leadership Services
Professional RecruitmentSolutions
Consultancy &Board Services
MissionWe are able to deliver specialist global talent for the benefit of our clients
HARVEY NASH GROUP PLC MISSION / 5
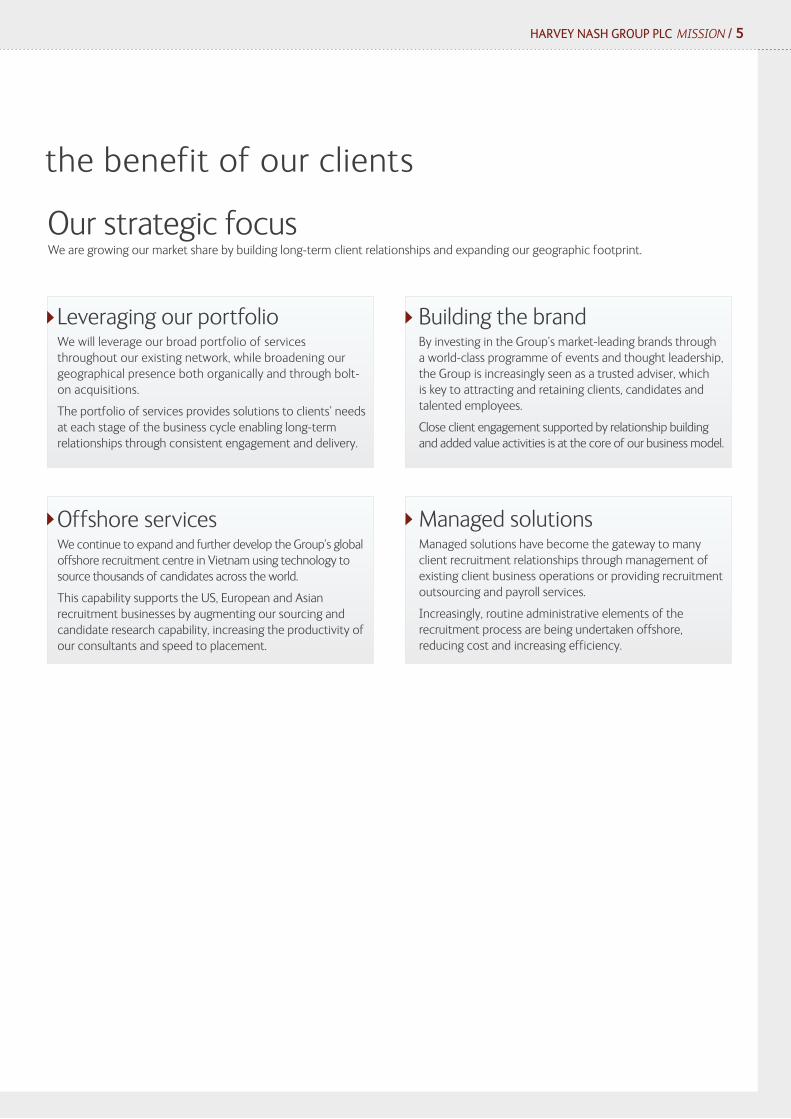
Our strategic focus We are growing our market share by building long-term client relationships and expanding our geographic footprint.
Leveraging our portfolioWe will leverage our broad portfolio of services throughout our existing network, while broadening our geographical presence both organically and through bolt-on acquisitions.
The portfolio of services provides solutions to clients’ needs at each stage of the business cycle enabling long-term relationships through consistent engagement and delivery.
Offshore servicesWe continue to expand and further develop the Group’s global offshore recruitment centre in Vietnam using technology to source thousands of candidates across the world.
This capability supports the US, European and Asian recruitment businesses by augmenting our sourcing and candidate research capability, increasing the productivity of our consultants and speed to placement.
Building the brandBy investing in the Group’s market-leading brands through a world-class programme of events and thought leadership, the Group is increasingly seen as a trusted adviser, which is key to attracting and retaining clients, candidates and talented employees.
Close client engagement supported by relationship building and added value activities is at the core of our business model.
Managed solutionsManaged solutions have become the gateway to many client recruitment relationships through management of existing client business operations or providing recruitment outsourcing and payroll services.
Increasingly, routine administrative elements of the recruitment process are being undertaken offshore, reducing cost and increasing efficiency.
MissionWe are able to deliver specialist global talent for the benefit of our clients

6 / HARVEY NASH GROUP PLC MEET THE GROUP BOARD AND EXECUTIVE COUNCIL
Meet the Group Board
Kevin Thomas
Non-Executive Director
Julie Baddeley
Non-Executive Chairman
Simon Wassall
European Managing Director
Albert Ellis
Chief Executive Officer
David Bezem
Non-Executive Director
Richard Ashcroft
Group Finance Director
Ian Davies
Non-Executive Director
Robert J. Miano PresidentResponsible for Harvey Nash operations in the USA.
Nick Marsh MD
Responsible for the Executive Search business in Asia.
Ronny Lommelen MD
Responsible for Harvey Nash operations in Belgium.
Jan Leen 'tJong MD
Responsible for Harvey Nash operations in the Netherlands.
Magnus Tegborg MDResponsible for the European Executive Search business and Chair of the Executive Consulting Board.
Meet the Executive CouncilThe Executive Council is the senior operational management team for the business. Its members are full-time senior managers and it is made up of Albert Ellis, Richard Ashcroft, Simon Wassall plus:
Directors’ profiles
Julie BaddeleyNon-Executive ChairmanJulie Baddeley, aged 65, is Non-Executive Chairman and was appointed to the Board in September 2011. She was appointed as Non-Executive Chairman and Chairman of the Nomination Committee at the Annual General Meeting in June 2013. Julie has held directorships at the BOC Group, Camelot Group plc, Spice plc, the Yorkshire Building Society and the Woolwich. Previously, Julie headed a global team as partner in charge of a substantial part of Accenture’s change management practice. Julie is also a Non-Executive Director of Ebiquity plc, Chrysalis VCT plc and Chairman of Sustain Limited, a leading environmental consultancy.
Ian DaviesSenior Independent Non-Executive Director Ian Davies, aged 61, was first appointed as a Non-Executive Director in September 2010 and then appointed Senior Independent Director at the Annual General Meeting in June 2013. Ian is Chairman of the Audit Committee and also chaired the Remuneration Committee until September 2014. Ian is a former Coopers & Lybrand audit partner and has significant listed board experience. He is currently Deputy Chairman of BMT Group Limited, and Chairman of their Audit Committee and Employee Benefits Trust. Ian is also a Fellow of the Institute of Chartered Accountants in England and Wales, Chairman of the ICAEW Remuneration Committee and an elected member of the Board, Council and Nomination Committee.
David BezemNon-Executive DirectorDavid Bezem, aged 55, joined the Board in June 2013 and is Chairman of the Remuneration Committee. He is also a Non-Executive Director and Chairman of the Remuneration Committee of Focusrite plc. David was previously an investment banker for more than 25 years advising UK public companies across a wide range of sectors. David qualified as a Chartered Accountant with Arthur Andersen & Co in 1984.
Kevin ThomasNon-Executive DirectorKevin Thomas, aged 62, is a Non-Executive Director and was appointed in May 2014. He also served on the Board of Babcock International Group plc and as Chief Executive of their Support Services Division for five years before stepping down from these roles in December 2015. He continues his relationship with Babcock as non-executive Chairman of two joint venture companies carrying out the decommissioning of civil nuclear power stations. He has recently been appointed to the Council of Brunel University London. Before joining Babcock, he spent 12 years in facilities management, including seven years with Serco Group plc and 15 years in local government with Merton, Surrey and Southwark Councils. He is a Doctor of Business (hc) of Brunel University, a Fellow of the Royal Institution of Chartered Surveyors and a Freeman of the City of London.
Albert Ellis Chief Executive OfficerAlbert Ellis, aged 52, is Chief Executive Officer and was appointed to the Board in February 2000 as Group Finance Director. He was appointed as Chief Executive Officer in June 2005. He was previously a Finance Director with Hays plc.
Richard AshcroftGroup Finance DirectorRichard Ashcroft, aged 58, is Group Finance Director and Company Secretary. He was appointed in October 2005, having previously spent 20 years in senior financial positions in a number of UK public companies, including Michael Page International plc.
Simon WassallEuropean Managing DirectorSimon Wassall, aged 53, was appointed to the Board in October 2005. He has been with the Group since 1994 and is responsible for the UK and European IT recruitment operations.
HARVEY NASH GROUP PLC DIRECTORS, SECRETARY AND ADVISERS / 7
ABN AMRO Bank
8 / HARVEY NASH GROUP PLC DIRECTORS, SECRETARY AND ADVISERS
Directors, Secretary and Advisers
DirectorsJulie BaddeleyIan DaviesDavid BezemKevin ThomasAlbert EllisRichard Ashcroft Simon Wassall
SecretaryRichard Ashcroft
Registered OfficeHarvey Nash Group plc110 BishopsgateLondon EC2N 4AY
Registered Number03320790
SolicitorsTravers Smith LLP10 Snow HillLondon EC1A 2AL
RegistrarsEquinitiPO Box 4630Aspect HouseSpencer RoadLancingWest Sussex BN99 6QQ
Independent AuditorsDeloitte LLPChartered Accountants and Statutory Auditors2 New Street SquareLondon EC4A 3BZ
Principal BankersRoyal Bank of Scotland plc PO Box 4RY 250 Regent Street London W1A 4RY
HARVEY NASH GROUP PLC CHAIRMAN’S STATEMENT / 9
Financial Performance The Group has delivered another year of growth from continuing operations in all service lines on a constant currency basis. The results were in line with expectations despite being affected for a second year by the strength of sterling. In addition, cash balances at 31 January 2016 were slightly higher than expectations.
Revenue from continuing operations was in line with the prior year at £676.5m (2015: £677.9m), gross profit increased by 6.4% to £90.3m (2015: £84.9m) and operating profit from continuing operations before non-recurring items for the year increased by 4.1% to £10.2m (2015: £9.8m). Adjusted(1) profit before tax from continuing operations was in line with expectations at £9.3m (2015: £9.2m).
Basic earnings per share from continuing operations increased by 10.7% to 9.42p (2015: 8.51p). Basic earnings per share from continuing operations before non-recurring costs increased by 3.3% to 9.73p (2015: 9.42p).
In constant currency, revenue and gross profit increased by 4.9% and 9.1% respectively, with adjusted operating profit up 9.2%, reflecting an overall improvement to the net profit margin.
Key to the success during the year has been the record growth reported from our US business combined with strong trading results from Asia Pacific following the Group’s investment in both of those regions in 2015. Trading conditions in the USA have been favourable with strong demand for technology skills, in executive, technical and offshore services. In Asia, revenues and gross profits grew strongly as productivity continued to improve and a new office was opened in Singapore.
Currency headwinds in mainland Europe masked good underlying growth despite a strong performance in contract recruitment. Both Germany and Sweden grew significantly in a recruitment market recovering from the uncertainty of the euro crisis. In the UK, notwithstanding a generally weaker permanent recruitment market, particularly in the final two months of the year, contract recruitment was robust and offshore services reported record growth.
Following a full review of all the strategic options, in December 2015, Nash Technologies GmbH (“NT Group”), the German outsourcing business, was disposed of by way of a management buy-out. This transaction provided an exit from non-core, loss-making activities and lowered the Group’s financial risk profile, while retaining the upside potential of possible further consideration depending on the future performance of the NT Group. This resulted in a £13.6m (2015: £0.6m) loss on disposal. The NT Group’s loss before tax on discontinued operations for the year was £0.4m (2015: £0.9m).
The Group also decided to close its Oil and Gas operations in Warrington due to a downturn in the energy market. The business incurred a loss before tax of £0.2m (2015: £0.1m profit) and the non-recurring costs resulting from closure were also £0.2m (2015: £nil).
In Belgium, the Group’s acquisition of Talent-IT in Antwerp delivered a record performance. The final payment of £2.1m under the earn-out was settled in August resulting in excess consideration payable of £0.2m.
Taking into account these events, the Group’s statutory loss for the year was £7.6m (2015: £5.3m profit).
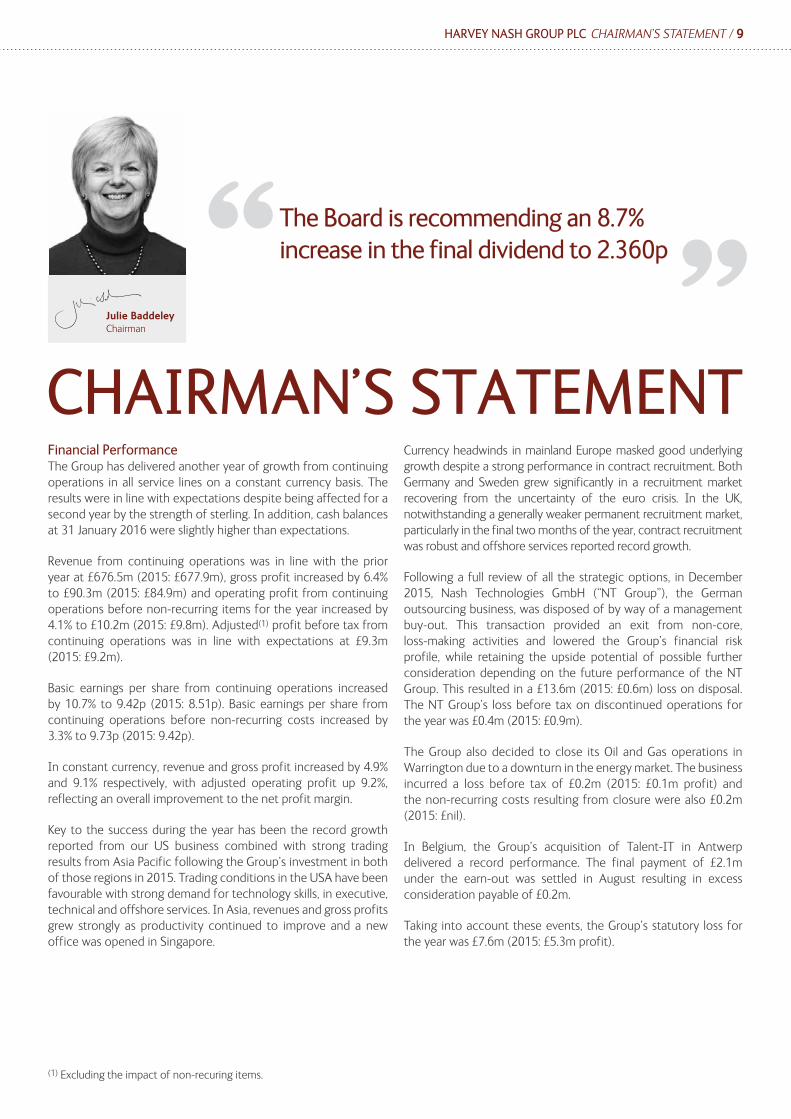
The Board is recommending an 8.7% increase in the final dividend to 2.360p“
“
Julie Baddeley Chairman
(1) Excluding the impact of non-recuring items.
10 / HARVEY NASH GROUP PLC CHAIRMAN’S STATEMENT
Strategy The Group’s strategy is to continue to grow the business organically as well as through earnings-enhancing, bolt-on acquisitions.
The Group’s strong relationship-based trading model supports the delivery of a broad portfolio of services to our clients enabling cross-selling opportunities across service lines and geographic regions.
A major competitive advantage is the Group’s market-leading business in Vietnam where services such as candidate sourcing and business process outsourcing are being cost-effectively delivered directly to the Group’s clients in the USA and UK and increasingly in Europe and Asia.
The business model comprises a majority of annuity revenues (2016: 62.4%), namely contracting, managed and offshore services, supplemented by higher-margin, cash-generative permanent recruitment (2016: 37.6%), both executive and technical. Cash generated by the business model is applied to organic investments, bolt-on acquisitions and for the payment of progressive and sustainable dividends.
This balance of permanent recruitment, contracting and offshore services, combined with our market-leading position in the senior technology hiring market, provides the Group with a competitive advantage, enabling the Group to maintain client engagement at each stage of the business cycle, and thereby deliver resilient financial results.
Governance and BoardHarvey Nash’s robust corporate governance framework underpins its performance. I have previously set out three clear priorities for the Board, on which we remain firmly focused.
Our first priority is to debate the strategy for increasing shareholder value and to hold the executive team accountable for its delivery. Our second priority is to ensure we have a highly talented team capable of executing our strategy and that we plan effectively for succession across the Group. Our third priority is to ensure that the right corporate values are in place, supported by the appropriate governance structures and their effective implementation.
In the year under review, our key strategic focus has been on securing the disposal of the NT Group, which was completed
in December 2015. This has improved the Group’s financial risk profile, as well as allowing us to concentrate on the core strategic aims of the Group. We are also embracing the new risk guidelines and ensuring the robustness of our risk assessment processes to ensure we have the right mechanisms in place in order to make the right strategic decisions and enable us to confirm the longer-term viability of the Group to our stakeholders.
Further details on the role and effectiveness of the Board are provided in my statement in the Corporate Governance section of this Annual Report.
DividendThe Board is recommending an 8.7% increase in the final dividend to 2.360 pence per share (2015: 2.171p). This gives a total dividend for the year of 3.850 pence per share (2015: 3.531p), up 9.0%, and reflects the Group’s progressive and sustainable dividend policy. Subject to approval at the Annual General Meeting on 30 June 2016, the final dividend will be paid on 8 July 2016 to shareholders on the register as at 17 June 2016.
OutlookIn the year ended 31 January 2016, the Group’s businesses in the USA, Germany, Sweden and Asia all reported strong growth and in some cases record revenues and profits. Whilst the weakness in executive recruitment and the energy sector held back the overall UK results, strong growth came from Scotland and offices outside of London. Despite this and the strong contracting results, the UK experienced a slowdown in permanent recruitment in the final two months as uncertainty affected clients’ decision-making processes. This caution in the UK is likely to continue until the referendum on Europe concludes.
In the current year, uncertainty in Asia as a result of economic challenges in China continues however, trading in Europe has been broadly on track.
Visibility is undoubtedly limited whilst global economic and UK political volatility persist. Nevertheless the Group’s performance at this early stage of the financial year is in line with expectations.
Julie Baddeley Chairman
HARVEY NASH GROUP PLCSTRATEGIC REPORT
12 / HARVEY NASH GROUP PLC STRATEGIC REPORT
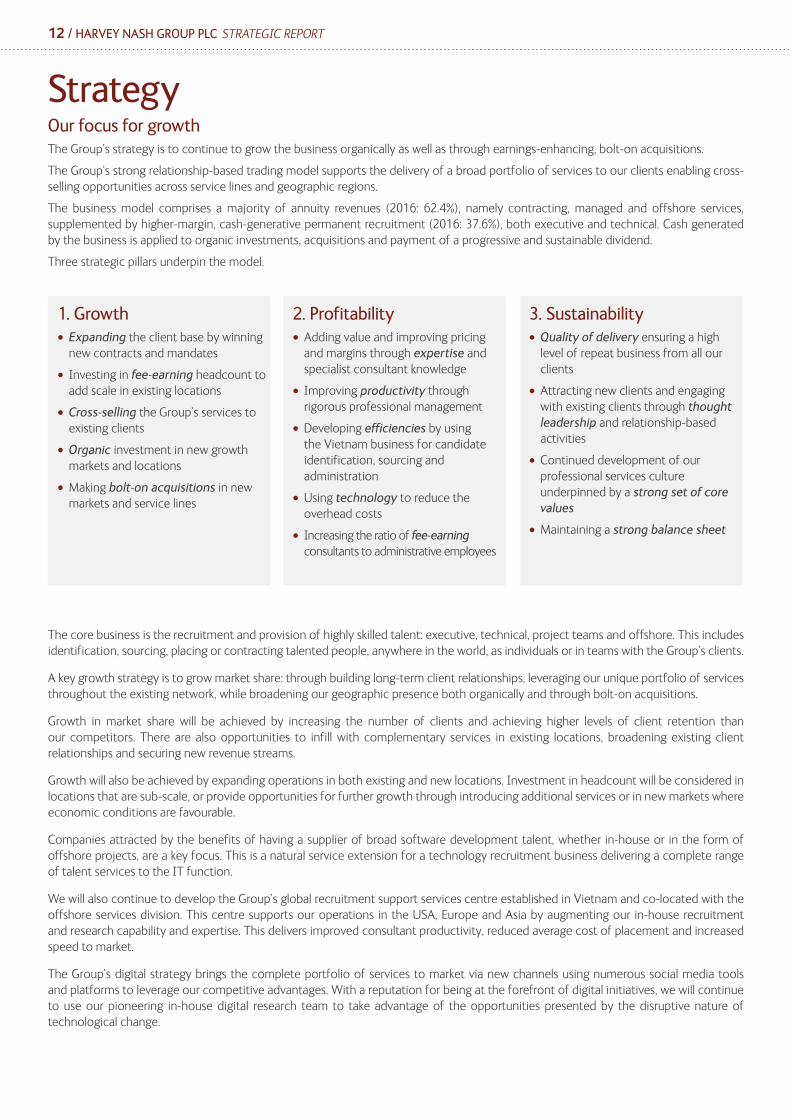
StrategyOur focus for growthThe Group’s strategy is to continue to grow the business organically as well as through earnings-enhancing, bolt-on acquisitions.
The Group’s strong relationship-based trading model supports the delivery of a broad portfolio of services to our clients enabling cross-selling opportunities across service lines and geographic regions.
The business model comprises a majority of annuity revenues (2016: 62.4%), namely contracting, managed and offshore services, supplemented by higher-margin, cash-generative permanent recruitment (2016: 37.6%), both executive and technical. Cash generated by the business is applied to organic investments, acquisitions and payment of a progressive and sustainable dividend.
Three strategic pillars underpin the model.
The core business is the recruitment and provision of highly skilled talent: executive, technical, project teams and offshore. This includes identification, sourcing, placing or contracting talented people, anywhere in the world, as individuals or in teams with the Group’s clients.
A key growth strategy is to grow market share: through building long-term client relationships, leveraging our unique portfolio of services throughout the existing network, while broadening our geographic presence both organically and through bolt-on acquisitions.
Growth in market share will be achieved by increasing the number of clients and achieving higher levels of client retention than our competitors. There are also opportunities to infill with complementary services in existing locations, broadening existing client relationships and securing new revenue streams.
Growth will also be achieved by expanding operations in both existing and new locations. Investment in headcount will be considered in locations that are sub-scale, or provide opportunities for further growth through introducing additional services or in new markets where economic conditions are favourable.
Companies attracted by the benefits of having a supplier of broad software development talent, whether in-house or in the form of offshore projects, are a key focus. This is a natural service extension for a technology recruitment business delivering a complete range of talent services to the IT function.
We will also continue to develop the Group’s global recruitment support services centre established in Vietnam and co-located with the offshore services division. This centre supports our operations in the USA, Europe and Asia by augmenting our in-house recruitment and research capability and expertise. This delivers improved consultant productivity, reduced average cost of placement and increased speed to market.
The Group’s digital strategy brings the complete portfolio of services to market via new channels using numerous social media tools and platforms to leverage our competitive advantages. With a reputation for being at the forefront of digital initiatives, we will continue to use our pioneering in-house digital research team to take advantage of the opportunities presented by the disruptive nature of technological change.
1. Growth• Expanding the client base by winning
new contracts and mandates
• Investing in fee-earning headcount to add scale in existing locations
• Cross-selling the Group’s services to existing clients
• Organic investment in new growth markets and locations
• Making bolt-on acquisitions in new markets and service lines
2. Profitability• Adding value and improving pricing
and margins through expertise and specialist consultant knowledge
• Improving productivity through rigorous professional management
• Developing efficiencies by using the Vietnam business for candidate identification, sourcing and administration
• Using technology to reduce the overhead costs
• Increasing the ratio of fee-earning consultants to administrative employees
3. Sustainability• Quality of delivery ensuring a high
level of repeat business from all our clients
• Attracting new clients and engaging with existing clients through thought leadership and relationship-based activities
• Continued development of our professional services culture underpinned by a strong set of core values
• Maintaining a strong balance sheet
HARVEY NASH GROUP PLC STRATEGIC REPORT / 13
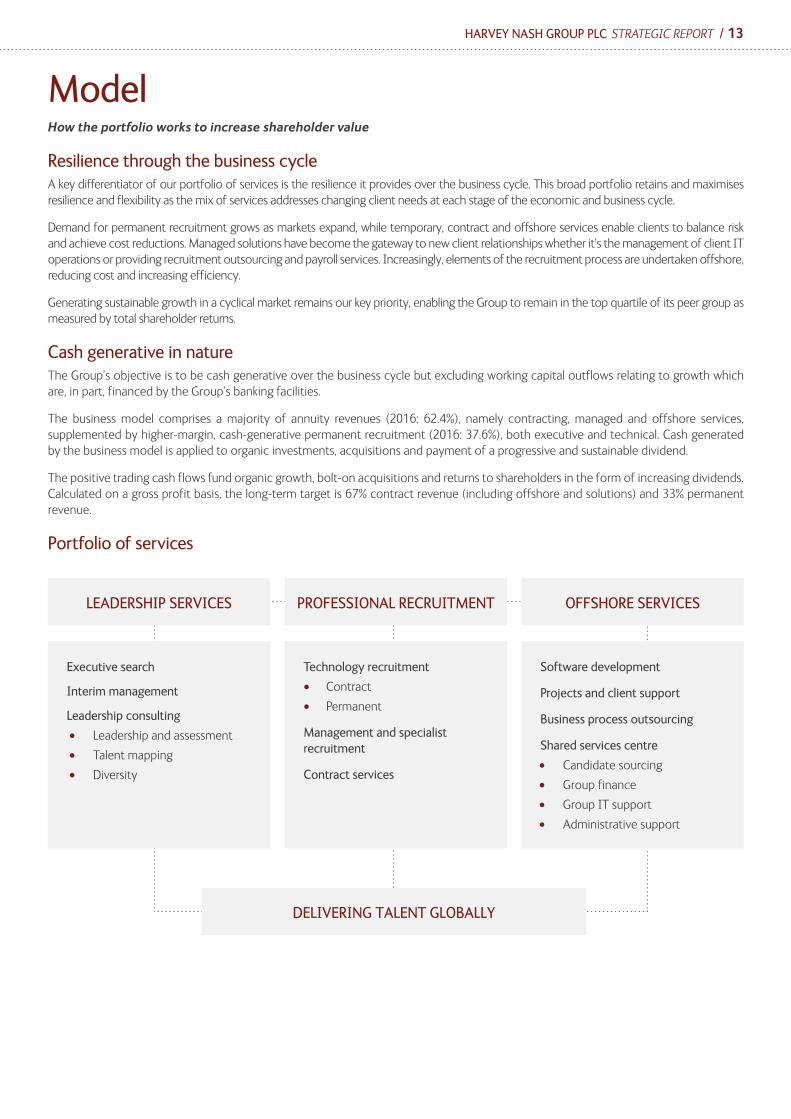
ModelHow the portfolio works to increase shareholder value
Resilience through the business cycleA key differentiator of our portfolio of services is the resilience it provides over the business cycle. This broad portfolio retains and maximises resilience and flexibility as the mix of services addresses changing client needs at each stage of the economic and business cycle.
Demand for permanent recruitment grows as markets expand, while temporary, contract and offshore services enable clients to balance risk and achieve cost reductions. Managed solutions have become the gateway to new client relationships whether it’s the management of client IT operations or providing recruitment outsourcing and payroll services. Increasingly, elements of the recruitment process are undertaken offshore, reducing cost and increasing efficiency.
Generating sustainable growth in a cyclical market remains our key priority, enabling the Group to remain in the top quartile of its peer group as measured by total shareholder returns.
Cash generative in natureThe Group’s objective is to be cash generative over the business cycle but excluding working capital outflows relating to growth which are, in part, financed by the Group’s banking facilities.
The business model comprises a majority of annuity revenues (2016: 62.4%), namely contracting, managed and offshore services, supplemented by higher-margin, cash-generative permanent recruitment (2016: 37.6%), both executive and technical. Cash generated by the business model is applied to organic investments, acquisitions and payment of a progressive and sustainable dividend.
The positive trading cash flows fund organic growth, bolt-on acquisitions and returns to shareholders in the form of increasing dividends. Calculated on a gross profit basis, the long-term target is 67% contract revenue (including offshore and solutions) and 33% permanent revenue.
Portfolio of services
LEADERSHIP SERVICES
Executive search
Interim management
Leadership consulting
• Leadership and assessment
• Talent mapping
• Diversity
Technology recruitment
• Contract
• Permanent
Management and specialist recruitment
Contract services
Software development
Projects and client support
Business process outsourcing
Shared services centre
• Candidate sourcing
• Group finance
• Group IT support
• Administrative support
PROFESSIONAL RECRUITMENT
DELIVERING TALENT GLOBALLY
OFFSHORE SERVICES

14 / HARVEY NASH GROUP PLC STRATEGIC REPORT
Leadership ServicesExecutive Search We help multinational organisations, and niche companies, to attract, recruit and retain outstanding board members, top executives, senior management and future leaders through high-level executive search. In our core markets, the business has a broad-based capability in key sectors.
Interim Management Through interim management consultancy, we provide clients with highly experienced executives and leadership for short-term assignments across a broad range of geographies, sectors and functions.
Leadership Consulting Our leadership consulting businesses support owners, boards and executive management with a full range of strategic leadership services, including board evaluations, management development, audits, assessments and strategic HR consulting.
Professional Recruitment Technology Recruitment Our market-leading technology recruitment business provides organisations across more than 30 countries with highly skilled technology specialists as well as Finance, HR and Engineering professionals, on a flexible or permanent basis.
Recruitment SolutionsOur recruitment solutions business provides tailored services that help companies recruit and manage their workforce more effectively, from payroll services to recruitment process outsourcing.
Offshore ServicesProjects and Software ServicesWe provide application development, third party software maintenance and outsourced software services to clients across the world. Through our software development centre in Vietnam, we deliver a unique blend of high-value offshore and onshore services.
Managed Services/Business Process OutsourcingWe take responsibility for the full management of critical technology infrastructure functions, such as data centre operations, help desk services network administration, and BPO operations such as payroll and other back-office transactions.
HARVEY NASH GROUP PLC STRATEGIC REPORT / 15
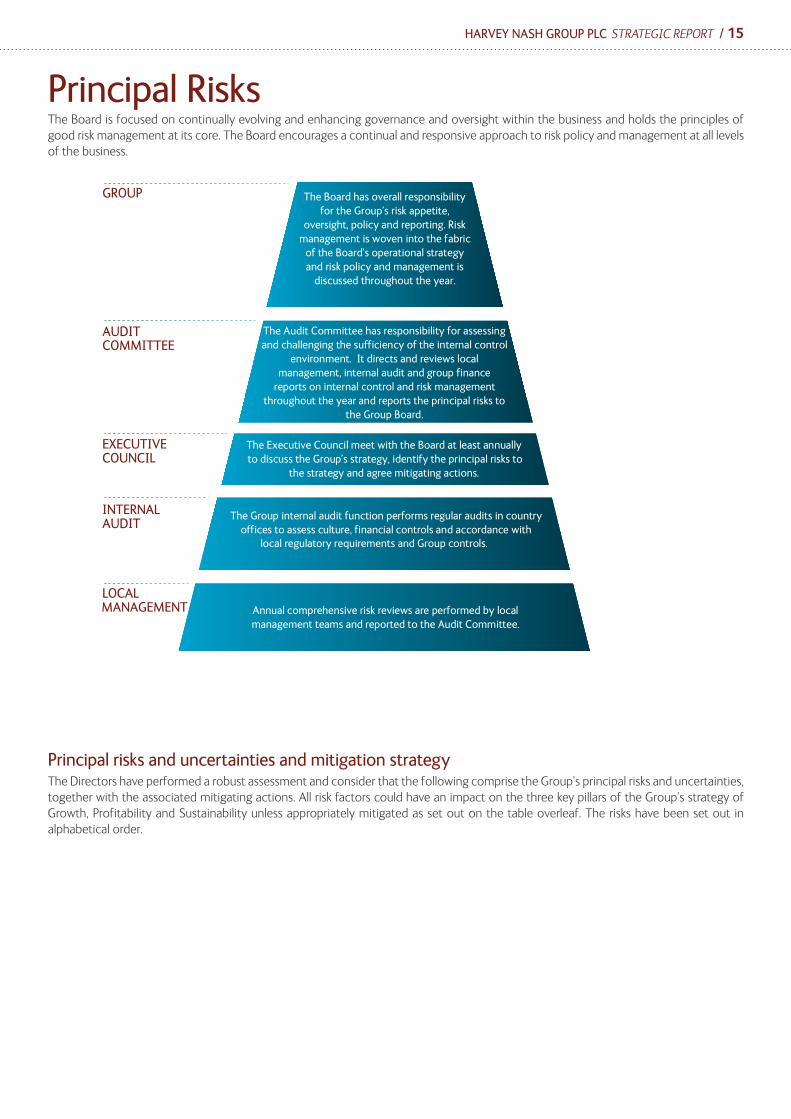
Principal Risks The Board is focused on continually evolving and enhancing governance and oversight within the business and holds the principles of good risk management at its core. The Board encourages a continual and responsive approach to risk policy and management at all levels of the business.
Principal risks and uncertainties and mitigation strategyThe Directors have performed a robust assessment and consider that the following comprise the Group’s principal risks and uncertainties, together with the associated mitigating actions. All risk factors could have an impact on the three key pillars of the Group’s strategy of Growth, Profitability and Sustainability unless appropriately mitigated as set out on the table overleaf. The risks have been set out in alphabetical order.
Principal Risks The Board are focused on continually evolving and enhancing governance and oversight within the business and holds the principles of good risk management at its core. The Board encourages a continual and responsive approach to risk policy and management at all levels of the business.
Principal risks and uncertainties and mitigation strategy The Board considers that the following comprise the Group’s principal risks and uncertainties, together with the associated mitigating actions. All risk factors could impact the three key pillars of the Group’s strategy of Growth, Profitability and Sustainability unless appropriately mitigated as set out on the table overleaf. The risks have been set out in alphabetical order.
Annual comprehensive risk reviews are performed by local management teams and reported to the Audit Committee.
The Group internal audit function performs regular audits in country offices to assess culture, financial controls and accordance with
local regulatory requirements and Group controls.
The Executive Council meet with the Board at least annually to discuss the Group’s strategy, identify the principal risks to
the strategy and agree mitigating actions.
The Board has overall responsibility for the Group’s risk appetite,
oversight, policy and reporting. Risk management is woven into the fabric
of the Board’s operational strategy and risk policy and management is
discussed throughout the year.
The Audit Committee has responsibility for assessing and challenging the sufficiency of the internal control
environment. It directs and reviews local management, internal audit and group finance
reports on internal control and risk management throughout the year and reports the principal risks to
the Group Board.
LOCAL
MANAGEMENT
INTERNAL
AUDIT
EXECUTIVE
COUNCIL
AUDIT
COMMITTEE
GROUP
Principal Risks The Board is focused on continually evolving and enhancing governance and oversight within the business and holds the principles of good risk management at its core. The Board encourages a continual and responsive approach to risk policy and management at all levels of the business.
Principal risks and uncertainties and mitigation strategyThe Directors have performed a robust assessment and consider that the following comprise the Group’s principal risks and
16 / HARVEY NASH GROUP PLC STRATEGIC REPORT
Risk Description Mitigation Change in risk level in FY16
Risk level after mitigation
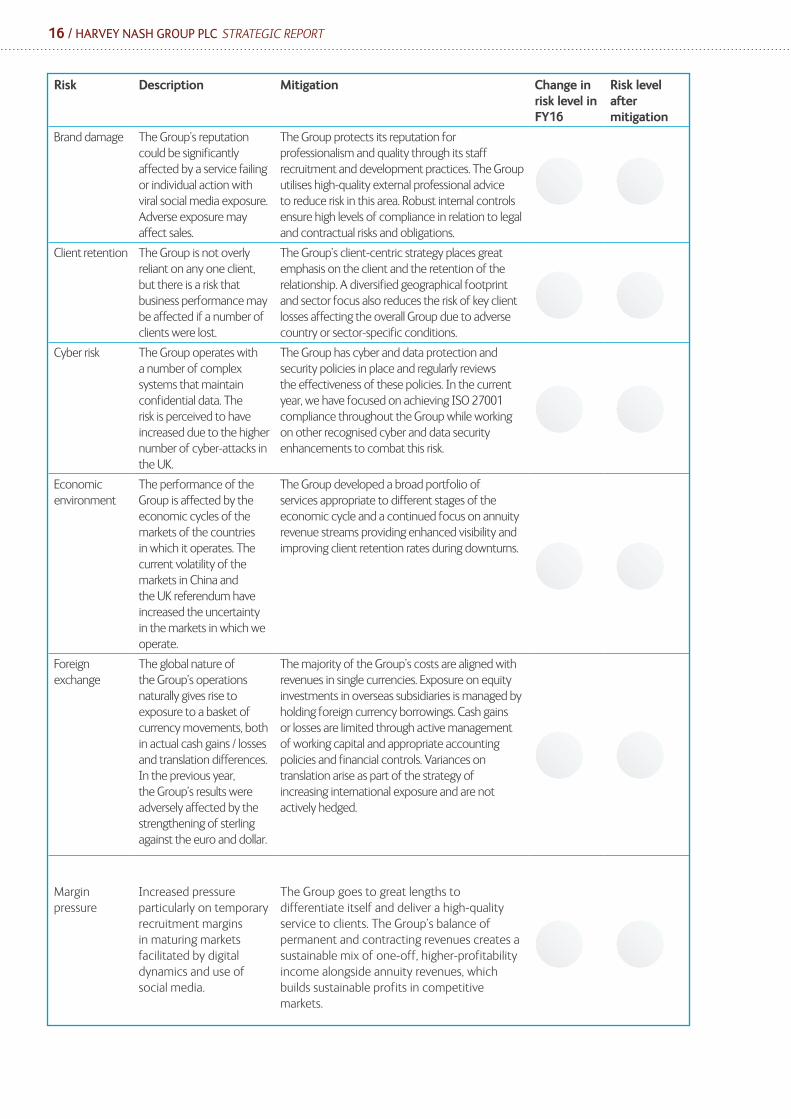
Brand damage The Group’s reputation could be significantly affected by a service failing or individual action with viral social media exposure. Adverse exposure may affect sales.
The Group protects its reputation for professionalism and quality through its staff recruitment and development practices. The Group utilises high-quality external professional advice to reduce risk in this area. Robust internal controls ensure high levels of compliance in relation to legal and contractual risks and obligations.
Client retention The Group is not overly reliant on any one client, but there is a risk that business performance may be affected if a number of clients were lost.
The Group’s client-centric strategy places great emphasis on the client and the retention of the relationship. A diversified geographical footprint and sector focus also reduces the risk of key client losses affecting the overall Group due to adverse country or sector-specific conditions.
Cyber risk The Group operates with a number of complex systems that maintain confidential data. The risk is perceived to have increased due to the higher number of cyber-attacks in the UK.
The Group has cyber and data protection and security policies in place and regularly reviews the effectiveness of these policies. In the current year, we have focused on achieving ISO 27001 compliance throughout the Group while working on other recognised cyber and data security enhancements to combat this risk.
Economic environment
The performance of the Group is affected by the economic cycles of the markets of the countries in which it operates. The current volatility of the markets in China and the UK referendum have increased the uncertainty in the markets in which we operate.
The Group developed a broad portfolio of services appropriate to different stages of the economic cycle and a continued focus on annuity revenue streams providing enhanced visibility and improving client retention rates during downturns.
Foreign exchange
The global nature of the Group’s operations naturally gives rise to exposure to a basket of currency movements, both in actual cash gains / losses and translation differences. In the previous year, the Group’s results were adversely affected by the strengthening of sterling against the euro and dollar.
The majority of the Group’s costs are aligned with revenues in single currencies. Exposure on equity investments in overseas subsidiaries is managed by holding foreign currency borrowings. Cash gains or losses are limited through active management of working capital and appropriate accounting policies and financial controls. Variances on translation arise as part of the strategy of increasing international exposure and are not actively hedged.
Margin pressure
Increased pressure particularly on temporary recruitment margins in maturing markets facilitated by digital dynamics and use of social media.
The Group goes to great lengths to differentiate itself and deliver a high-quality service to clients. The Group’s balance of permanent and contracting revenues creates a sustainable mix of one-off, higher-profitability income alongside annuity revenues, which builds sustainable profits in competitive markets.
HARVEY NASH GROUP PLC STRATEGIC REPORT / 17
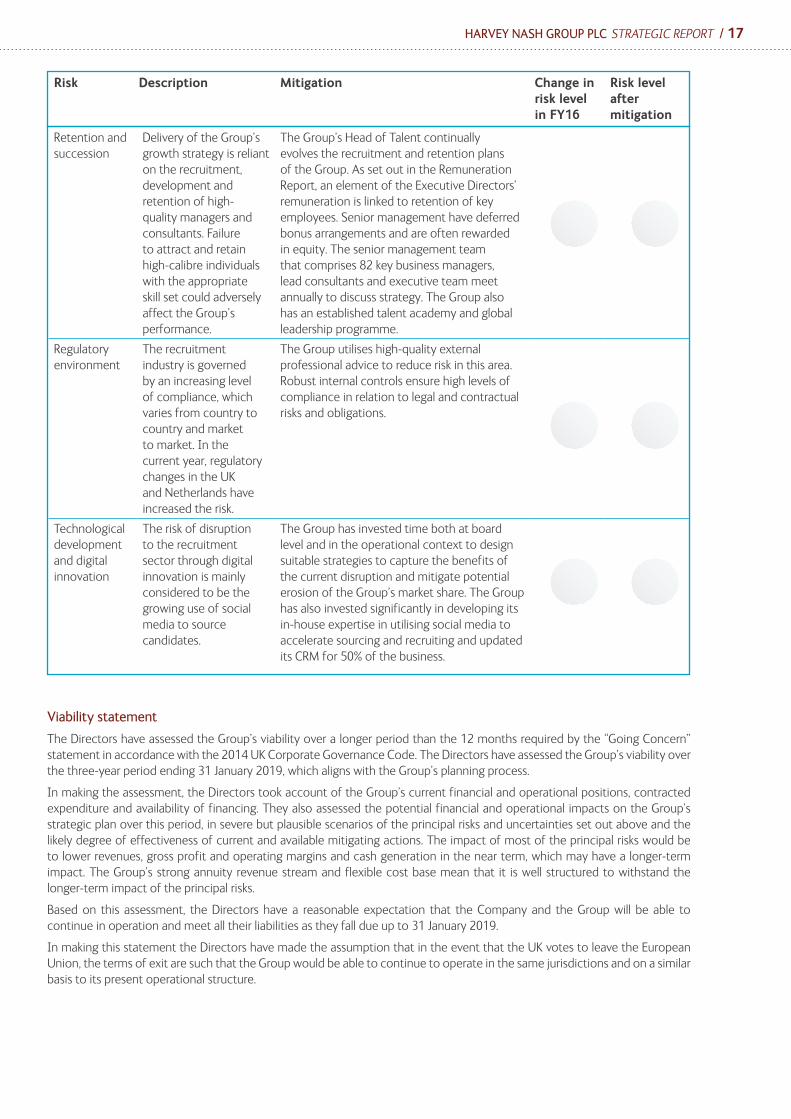
Retention and succession
Delivery of the Group’s growth strategy is reliant on the recruitment, development and retention of high-quality managers and consultants. Failure to attract and retain high-calibre individuals with the appropriate skill set could adversely affect the Group’s performance.
The Group’s Head of Talent continually evolves the recruitment and retention plans of the Group. As set out in the Remuneration Report, an element of the Executive Directors’ remuneration is linked to retention of key employees. Senior management have deferred bonus arrangements and are often rewarded in equity. The senior management team that comprises 82 key business managers, lead consultants and executive team meet annually to discuss strategy. The Group also has an established talent academy and global leadership programme.
Regulatory environment
The recruitment industry is governed by an increasing level of compliance, which varies from country to country and market to market. In the current year, regulatory changes in the UK and Netherlands have increased the risk.
The Group utilises high-quality external professional advice to reduce risk in this area. Robust internal controls ensure high levels of compliance in relation to legal and contractual risks and obligations.
Technological development and digital innovation
The risk of disruption to the recruitment sector through digital innovation is mainly considered to be the growing use of social media to source candidates.
The Group has invested time both at board level and in the operational context to design suitable strategies to capture the benefits of the current disruption and mitigate potential erosion of the Group’s market share. The Group has also invested significantly in developing its in-house expertise in utilising social media to accelerate sourcing and recruiting and updated its CRM for 50% of the business.
Risk Description Mitigation Change in risk level in FY16
Risk level after mitigation
Viability statement
The Directors have assessed the Group’s viability over a longer period than the 12 months required by the “Going Concern” statement in accordance with the 2014 UK Corporate Governance Code. The Directors have assessed the Group’s viability over the three-year period ending 31 January 2019, which aligns with the Group’s planning process.
In making the assessment, the Directors took account of the Group’s current financial and operational positions, contracted expenditure and availability of financing. They also assessed the potential financial and operational impacts on the Group’s strategic plan over this period, in severe but plausible scenarios of the principal risks and uncertainties set out above and the likely degree of effectiveness of current and available mitigating actions. The impact of most of the principal risks would be to lower revenues, gross profit and operating margins and cash generation in the near term, which may have a longer-term impact. The Group’s strong annuity revenue stream and flexible cost base mean that it is well structured to withstand the longer-term impact of the principal risks.
Based on this assessment, the Directors have a reasonable expectation that the Company and the Group will be able to continue in operation and meet all their liabilities as they fall due up to 31 January 2019.
In making this statement the Directors have made the assumption that in the event that the UK votes to leave the European Union, the terms of exit are such that the Group would be able to continue to operate in the same jurisdictions and on a similar basis to its present operational structure.
18 / HARVEY NASH GROUP PLC STRATEGIC REPORT
The Group has delivered another year of underlying growth in gross profit across all regions on a constant currency basis, returning to its pre-financial crisis level of operating profit.
The UK & Ireland delivered further progress during the year, with particular success in growing market share. Overall organic revenues and gross profit, including the UK offshore business, hit record highs despite the market for permanent recruitment being weaker at the end of the year, which held back operating profit.
The underlying results in our European operations were strong, despite foreign exchange headwinds, with the exception of the loss-making Nash Technologies GmbH (“NT Group”), which was sold in December 2015. Sweden recorded a year of strong growth but, as with the euro, the weak Swedish krona held back results.
Record results were delivered by the USA, reflecting progress in all three service lines: executive search, IT recruitment and offshore services. The business has focused its activities on the fast-growing technology and digital sectors and has benefited from unprecedented levels of demand for IT skills, ranging from highly skilled software developers to senior leadership roles within global Fortune 500 companies.
Strong growth was achieved in Asia, an encouraging result in a relatively new region of growth for the Group. The best performers were the businesses in Vietnam and Japan, but Hong Kong also significantly improved its results in the second half. Australia was steady and a new office was opened in Singapore.
More details about the performance of the business are set out below by region. All results are from continuing operations; details of the performance of discontinued operations in respect of the German outsourcing business are set out in the FD Report.
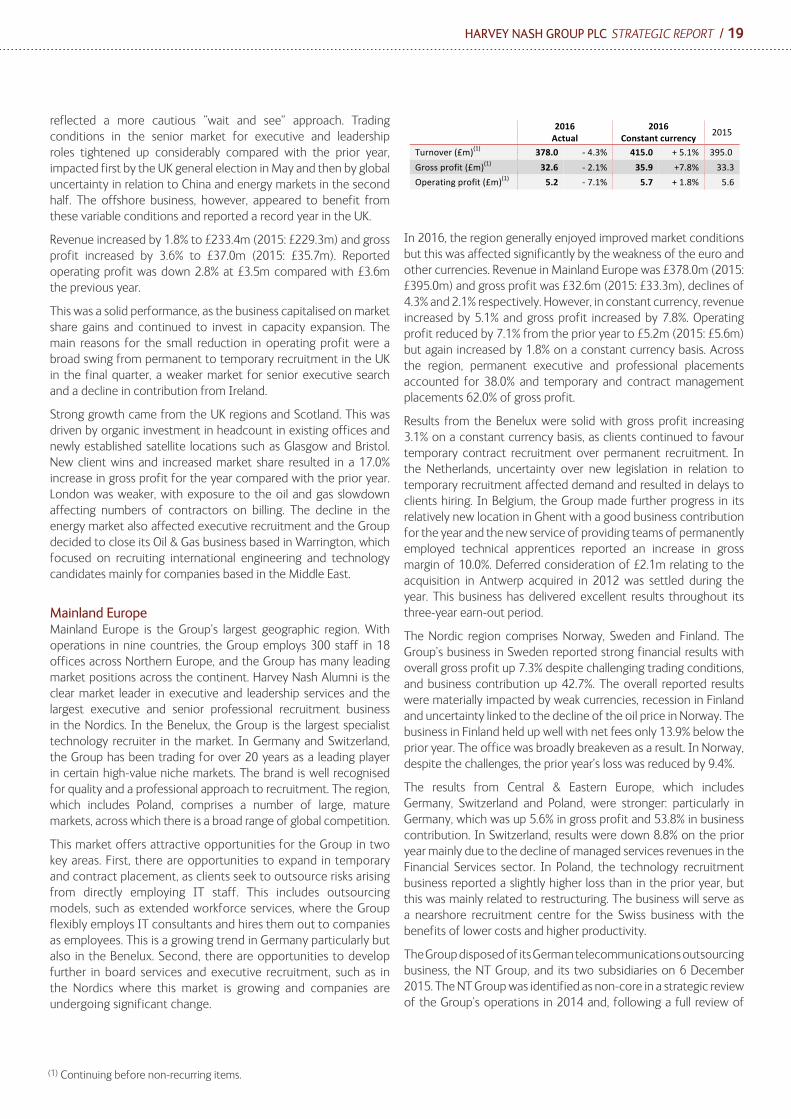
United Kingdom & Ireland The UK & Ireland represented 41.0% of the Group’s gross profit in 2016 and operated from 10 offices, employing 247 fee earners across the region. The Group has leveraged its unique portfolio of services to gain considerable market share over the last decade despite the market being mature and highly competitive. Harvey Nash and its subsidiary brands Impact Executives (interim), Mortimer Spinks (specialist digital technology talent) and Nash Tech (offshore software development) have strong market positions in executive and professional recruitment across the UK and Ireland and a growing presence in offshore services. Permanent placements accounted for 36.4%, contract placements 49.1% and offshore services 14.5% of gross profit.
The business is one of the market leaders in technology recruitment and a significant opportunity to integrate the broad service portfolio further exists across the business. In particular, its growing capability to augment client recruitment of specialist technology skills with offshore teams, where appropriate, can offer a more valuable and competitive cost proposition than contract recruitment.
During the first half of the year particularly, the UK contingent recruitment business enjoyed strong growth and experienced robust demand especially for permanent hires. However, during the final two months of the year, client decision-making processes slowed and a swing from permanent recruitment to contract
Albert EllisChief Executive
Record results were delivered by the USA, reflecting progress in all three service lines“ “
CEO REVIEW
.
2016Actual
2016Constantcurrency 2015
Turnover(£m)(1) 233.4 +1.8% 234.9 +2.4% 229.3Grossprofit(£m)(1) 37.0 +3.6% 37.1 +3.9% 35.7Operatingprofit(£m)(1) 3.5 -2.8% 3.6 -0.0% 3.6
2016Actual
2016Constantcurrency 2015
Turnover(£m)(1) 378.0 -4.3% 415.0 +5.1% 395.0Grossprofit(£m)(1) 32.6 -2.1% 35.9 +7.8% 33.3Operatingprofit(£m)(1) 5.2 -7.1% 5.7 +1.8% 5.6
2016Actual
2016Constantcurrency
2015
Turnover(£m)(1) 54.6 +14.5% 50.8 +6.5% 47.7Grossprofit(£m)(1) 14.8 +25.4% 13.8 +16.9% 11.8Operatingprofit(£m)(1) 1.4 +55.6% 1.3 +44.4% 0.9
2016Actual
2016Constantcurrency
2015
Turnover(£m)(1) 10.6 +76.7% 10.4 +73.3% 6.0Grossprofit(£m)(1) 5.9 +47.5% 5.7 +42.5% 4.0Operatingprofit(£m)(1) 0.1 +133.3% 0.1 +133.3% (0.3)
(1) Continuing before non-recurring items.
HARVEY NASH GROUP PLC STRATEGIC REPORT / 19
(1) Continuing before non-recurring items.
reflected a more cautious “wait and see” approach. Trading conditions in the senior market for executive and leadership roles tightened up considerably compared with the prior year, impacted first by the UK general election in May and then by global uncertainty in relation to China and energy markets in the second half. The offshore business, however, appeared to benefit from these variable conditions and reported a record year in the UK.
Revenue increased by 1.8% to £233.4m (2015: £229.3m) and gross profit increased by 3.6% to £37.0m (2015: £35.7m). Reported operating profit was down 2.8% at £3.5m compared with £3.6m the previous year.
This was a solid performance, as the business capitalised on market share gains and continued to invest in capacity expansion. The main reasons for the small reduction in operating profit were a broad swing from permanent to temporary recruitment in the UK in the final quarter, a weaker market for senior executive search and a decline in contribution from Ireland.
Strong growth came from the UK regions and Scotland. This was driven by organic investment in headcount in existing offices and newly established satellite locations such as Glasgow and Bristol. New client wins and increased market share resulted in a 17.0% increase in gross profit for the year compared with the prior year. London was weaker, with exposure to the oil and gas slowdown affecting numbers of contractors on billing. The decline in the energy market also affected executive recruitment and the Group decided to close its Oil & Gas business based in Warrington, which focused on recruiting international engineering and technology candidates mainly for companies based in the Middle East.
Mainland EuropeMainland Europe is the Group’s largest geographic region. With operations in nine countries, the Group employs 300 staff in 18 offices across Northern Europe, and the Group has many leading market positions across the continent. Harvey Nash Alumni is the clear market leader in executive and leadership services and the largest executive and senior professional recruitment business in the Nordics. In the Benelux, the Group is the largest specialist technology recruiter in the market. In Germany and Switzerland, the Group has been trading for over 20 years as a leading player in certain high-value niche markets. The brand is well recognised for quality and a professional approach to recruitment. The region, which includes Poland, comprises a number of large, mature markets, across which there is a broad range of global competition.
This market offers attractive opportunities for the Group in two key areas. First, there are opportunities to expand in temporary and contract placement, as clients seek to outsource risks arising from directly employing IT staff. This includes outsourcing models, such as extended workforce services, where the Group flexibly employs IT consultants and hires them out to companies as employees. This is a growing trend in Germany particularly but also in the Benelux. Second, there are opportunities to develop further in board services and executive recruitment, such as in the Nordics where this market is growing and companies are undergoing significant change.
In 2016, the region generally enjoyed improved market conditions but this was affected significantly by the weakness of the euro and other currencies. Revenue in Mainland Europe was £378.0m (2015: £395.0m) and gross profit was £32.6m (2015: £33.3m), declines of 4.3% and 2.1% respectively. However, in constant currency, revenue increased by 5.1% and gross profit increased by 7.8%. Operating profit reduced by 7.1% from the prior year to £5.2m (2015: £5.6m) but again increased by 1.8% on a constant currency basis. Across the region, permanent executive and professional placements accounted for 38.0% and temporary and contract management placements 62.0% of gross profit.
Results from the Benelux were solid with gross profit increasing 3.1% on a constant currency basis, as clients continued to favour temporary contract recruitment over permanent recruitment. In the Netherlands, uncertainty over new legislation in relation to temporary recruitment affected demand and resulted in delays to clients hiring. In Belgium, the Group made further progress in its relatively new location in Ghent with a good business contribution for the year and the new service of providing teams of permanently employed technical apprentices reported an increase in gross margin of 10.0%. Deferred consideration of £2.1m relating to the acquisition in Antwerp acquired in 2012 was settled during the year. This business has delivered excellent results throughout its three-year earn-out period.
The Nordic region comprises Norway, Sweden and Finland. The Group’s business in Sweden reported strong financial results with overall gross profit up 7.3% despite challenging trading conditions, and business contribution up 42.7%. The overall reported results were materially impacted by weak currencies, recession in Finland and uncertainty linked to the decline of the oil price in Norway. The business in Finland held up well with net fees only 13.9% below the prior year. The office was broadly breakeven as a result. In Norway, despite the challenges, the prior year’s loss was reduced by 9.4%.
The results from Central & Eastern Europe, which includes Germany, Switzerland and Poland, were stronger: particularly in Germany, which was up 5.6% in gross profit and 53.8% in business contribution. In Switzerland, results were down 8.8% on the prior year mainly due to the decline of managed services revenues in the Financial Services sector. In Poland, the technology recruitment business reported a slightly higher loss than in the prior year, but this was mainly related to restructuring. The business will serve as a nearshore recruitment centre for the Swiss business with the benefits of lower costs and higher productivity.
The Group disposed of its German telecommunications outsourcing business, the NT Group, and its two subsidiaries on 6 December 2015. The NT Group was identified as non-core in a strategic review of the Group’s operations in 2014 and, following a full review of
.
2016Actual
2016Constantcurrency 2015
Turnover(£m)(1) 233.4 +1.8% 234.9 +2.4% 229.3Grossprofit(£m)(1) 37.0 +3.6% 37.1 +3.9% 35.7Operatingprofit(£m)(1) 3.5 -2.8% 3.6 -0.0% 3.6
2016Actual
2016Constantcurrency 2015
Turnover(£m)(1) 378.0 -4.3% 415.0 +5.1% 395.0Grossprofit(£m)(1) 32.6 -2.1% 35.9 +7.8% 33.3Operatingprofit(£m)(1) 5.2 -7.1% 5.7 +1.8% 5.6
2016Actual
2016Constantcurrency
2015
Turnover(£m)(1) 54.6 +14.5% 50.8 +6.5% 47.7Grossprofit(£m)(1) 14.8 +25.4% 13.8 +16.9% 11.8Operatingprofit(£m)(1) 1.4 +55.6% 1.3 +44.4% 0.9
2016Actual
2016Constantcurrency
2015
Turnover(£m)(1) 10.6 +76.7% 10.4 +73.3% 6.0Grossprofit(£m)(1) 5.9 +47.5% 5.7 +42.5% 4.0Operatingprofit(£m)(1) 0.1 +133.3% 0.1 +133.3% (0.3)

20 / HARVEY NASH GROUP PLC STRATEGIC REPORT
Asia PacificThe Group has six offices across the Asia Pacific region, employing 48 fee earners and representing 6.5% of the Group’s gross profit during the year. Growth in gross profit was the fastest regional growth achieved across the Group, albeit from a lower base.
Tokyo, Singapore and Hong Kong are well developed and offer good opportunities for professional recruitment, executive search and leadership consulting. Multinational companies base many of their senior staff in these locations and compensation levels are comparable with Europe. China also represents a growing opportunity, as large domestic Chinese companies seek to grow their international presence and are increasingly employing recruiters to search for business leaders.
Our Vietnam business is located in the faster-growing South East Asian economic region, which is generally underdeveloped and offers strong growth opportunities for recruitment and offshoring. Australia is a mature, well-developed and highly competitive market but, with its technology sector rapidly adopting digital strategies and a fast-growing and healthy start-up sector, the Group’s leading IT recruitment brand and offshore capability has made a significant impact in the market.
Revenue in Asia Pacific increased by 76.7% to £10.6m (2015: £6.0m) and gross profit increased by 47.5% to £5.9m (2015: £4.0m). The profit of £0.1m compares with an operating loss of £0.3m in the prior year. Permanent or executive placements accounted for 65.6%, contract placements 2.3%, and offshore services 32.1% of gross profit.
Asia Pacific enjoyed strong growth particularly in the second half of the year, and benefited from demand in offshore services in the USA and UK. Executive search fees grew 72.0% in Hong Kong, Japan and the new office in Singapore resulting in an operating profit before the investment in Singapore. Professional recruitment fees in Vietnam were up 41.1% and delivered good business contribution growth. Gross profit from offshore services (software development, BPO and shared services) grew 48.2% and contribution 51.9% as results from the Japanese market improved. While Australia remained challenging throughout the year, revenues were up 56.3% and the loss reduced compared with the prior year.
the disposal options, the Board agreed the sale of the NT Group by way of a management buy-out. This transaction provided an exit from a non-core loss-making activity and lowered the Group’s financial risk profile, while retaining the upside potential of possible further consideration depending on the future performance of the NT Group. This resulted in a charge of £13.6m (2015: £0.6m) relating to the loss on disposal. The NT Group’s loss before tax on discontinued operations for the year was £0.4m (2015: £0.9m).
United StatesThe USA represented 16.4% of the Group’s gross profit in 2016. The USA is the largest market for technology recruitment in the world but is fragmented and offers strong growth, particularly on the West Coast. The Group’s unique portfolio of technology recruitment is compelling in a market with severe skills shortages and limited competition of any scale. The Group has six offices, with 80 fee earners based in the USA and 45 offshore recruiters based in Vietnam supporting clients such as Apple and Microsoft.
Permanent placements accounted for 35.6%, contract placements 33.8%, and offshore and solutions 30.6% of gross profit. Revenue in the USA increased by 14.5% to £54.6m (2015: £47.7m) and gross profit increased by 25.4% to £14.8m (2015: £11.8m), while operating profit increased by 55.6% following the investment in fee-earning capacity in the prior year.
The US economy was once again the strongest market across the Group during 2015. All services grew strongly, with demand for enterprise recruitment the strongest with gross profit up 79.0% in constant currency. Executive search also reported a record year with net fees up 19.0% to $3.0m mainly driven by US Fortune 500 companies investing in digital transformation. Permanent IT recruitment was also strong with gross profit up 17.0% in a buoyant market for technology specialists. The swing from temp to perm affected contractor numbers but higher margins resulted in an overall increase in gross profit (+39.7%). Offshore and solutions also posted good growth of +11.3% in gross profit.
.
2016Actual
2016Constantcurrency 2015
Turnover(£m)(1) 233.4 +1.8% 234.9 +2.4% 229.3Grossprofit(£m)(1) 37.0 +3.6% 37.1 +3.9% 35.7Operatingprofit(£m)(1) 3.5 -2.8% 3.6 -0.0% 3.6
2016Actual
2016Constantcurrency 2015
Turnover(£m)(1) 378.0 -4.3% 415.0 +5.1% 395.0Grossprofit(£m)(1) 32.6 -2.1% 35.9 +7.8% 33.3Operatingprofit(£m)(1) 5.2 -7.1% 5.7 +1.8% 5.6
2016Actual
2016Constantcurrency
2015
Turnover(£m)(1) 54.6 +14.5% 50.8 +6.5% 47.7Grossprofit(£m)(1) 14.8 +25.4% 13.8 +16.9% 11.8Operatingprofit(£m)(1) 1.4 +55.6% 1.3 +44.4% 0.9
2016Actual
2016Constantcurrency
2015
Turnover(£m)(1) 10.6 +76.7% 10.4 +73.3% 6.0Grossprofit(£m)(1) 5.9 +47.5% 5.7 +42.5% 4.0Operatingprofit(£m)(1) 0.1 +133.3% 0.1 +133.3% (0.3)
(1) Continuing before non-recurring items.
HARVEY NASH GROUP PLC STRATEGIC REPORT / 21
15%
8%
6%
9%
2%
2012
2013
2014
2015
2016
45%
40%
40%
39%
47%
49%
49%
49%
8%
11%
11%
12%
2012
2013
2014
2015
Permanent Contracting Outsourcing
£2.4m
£2.7m
£3.2m
£3.6m
£4.0m
£4.8m
£5.8m
£5.6m
£1.0m
£0.9m
£0.9m
£0.6m
2012
2013
2014
2015
UK & Ireland Mainland Europe Rest of World
£1.8m
£6.7m
£5.4m
£7.5m
2012
2013
2014
2015
39% 48% 13% 2016
£3.5m £5.2m £1.5m 2015 £13.0m 2016
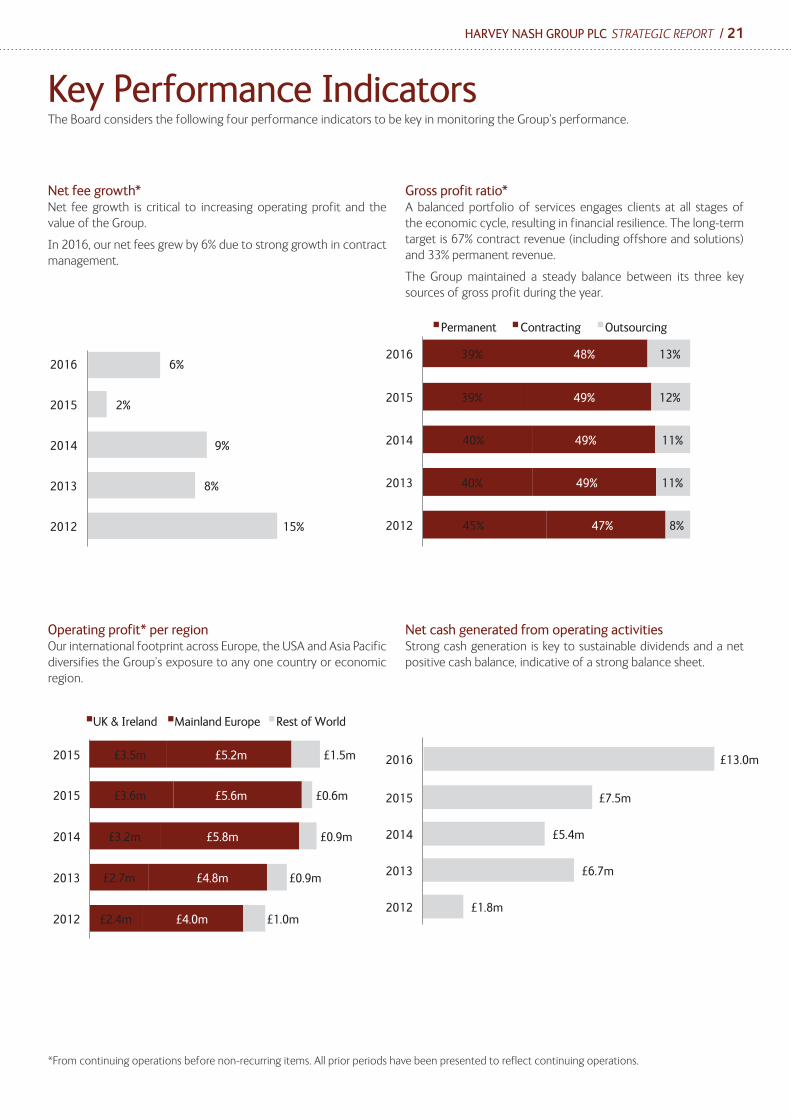
Key Performance IndicatorsThe Board considers the following four performance indicators to be key in monitoring the Group’s performance.
Net fee growth*Net fee growth is critical to increasing operating profit and the value of the Group.
In 2016, our net fees grew by 6% due to strong growth in contract management.
Operating profit* per regionOur international footprint across Europe, the USA and Asia Pacific diversifies the Group’s exposure to any one country or economic region.
Gross profit ratio*A balanced portfolio of services engages clients at all stages of the economic cycle, resulting in financial resilience. The long-term target is 67% contract revenue (including offshore and solutions) and 33% permanent revenue.
The Group maintained a steady balance between its three key sources of gross profit during the year.
Net cash generated from operating activitiesStrong cash generation is key to sustainable dividends and a net positive cash balance, indicative of a strong balance sheet.
*From continuing operations before non-recurring items. All prior periods have been presented to reflect continuing operations.
22 / HARVEY NASH GROUP PLC STRATEGIC REPORT
OverviewRevenue from continuing operations was in line with the previous year at £676.5m (2015: £677.9m) but 4.9% higher on a constant currency basis. Statutory revenue, including discontinued operations, declined by 1.0% to £689.6m (2015: £696.6m) but increased by 4.2% on a constant currency basis.
Gross profit from continuing operations increased by 6.4% to £90.3m (2015: £84.9m) and was 9.1% higher on a constant currency basis. Total gross profit increased by 4.4% to £93.4m (2015: £89.5m) and was 7.3% higher on a constant currency basis.
Gross profit from permanent recruitment was 5.1% higher, while contracting increased by 4.2%. Gross profit from offshore solutions was 3.1% higher, with the decline in NT Group gross profit partially offsetting an underlying increase of 15.7% in respect of continuing operations from offshore solutions. Fee-earner headcount for continuing operations was in line with the prior year at 597 (2015: 595), following investment in 2015.
The net finance charge of £0.8m (2015: £0.6m) was slightly higher than the prior year due to increased use of the discounting facility to fund the NT Group disposal.
Profit before tax and non-recurring items from continuing operations increased by 1.1% to £9.3m (2015: £9.2m). Profit before tax from continuing operations increased by 7.1% to £9.1m (2015: £8.5m) due to a higher non-recurring charge relating to continuing operations in the prior year. Including discontinued operations, the loss for the year was £7.6m (2015: £5.3m profit) due to the costs of the disposal of the NT Group (£13.6m) and the closure of the Oil & Gas division (£0.2m).
TaxationThe overall effective rate of tax is a function of the mix of profits between the various countries in which the Group operates, with higher rates in the USA, Germany and Belgium in particular being offset by lower rates elsewhere.
The tax charge for continuing operations for the year was £2.2m (2015: £2.3m) giving an effective rate of tax on continuing operations of 24.0% or 28.2% (2015: 27.1%) excluding the impact of discontinued losses relieved against profits from continuing operations.
The deferred income tax asset decreased by £0.4m due to the disposal of the NT Group and the removal of assets relating to associated pension obligations. The deferred tax asset of £2.3m
(2015: £2.8m) relates primarily to accrued Group interest charges payable by the US business (£1.0m), tax losses (£0.8m) and was partially offset by a deferred tax liability of £0.2m relating to unremitted earnings. The deferred tax liability decreased by £0.1m due to the removal of a deferred liability relating to accrued income in the NT Group.
Disposals and acquisitionsFollowing a full review of all the strategic options, on 6 December 2015, the Group entered into a sale agreement to dispose of the German telecommunications outsourcing business Nash Technologies GmbH and its two fully owned subsidiaries, Nash Technologies Stuttgart GmbH and Nash Innovations GmbH (“NT Group”) by way of a management buy-out.
The initial consideration for the sale for the NT Group was €27,600, with further cash consideration receivable up to an aggregate cap of €9.0m, by way of an earn-out, based on the performance of the NT Group for the financial years 2016 to 2020. No asset has been recorded for the deferred consideration in the accounts.
The loss on disposal of the NT Group amounted to £13.6m (2015: £0.6m) and related predominantly to the write-off of loans from Harvey Nash GmbH to the NT Group on disposal (£6.8m) and payments accrued in respect of the agreement to indemnify the buyer in relation to certain liabilities of the NT Group up to a maximum of £4.2m (€5.75m) which were expected to be incurred over the nine-month period to 31 August 2016. A loan to the NT Group of £1.7m (€2.3m) for product investment and property costs was also agreed. No provision has been recognised against this long-term receivable at 31 January 2016 as management believe it to be recoverable. Cash outflows in respect of the disposal totalled £2.7m in the period to 31 January 2016. The NT Group’s loss before tax on discontinued operations for the year was £0.4m (2015: £0.9m).
The Group also decided to close its Oil & Gas operations in Warrington due to a downturn in the energy market. The business incurred a loss before tax of £0.2m (2015: £0.1m profit) and the non-recurring costs resulting from closure were also £0.2m (2015: £nil).
In Belgium, the Group’s acquisition of Talent-IT in Antwerp achieved its targets and the final payment of £2.1m under the earn-out was settled in August, with a small excess consideration payable of £0.2m, charged to non-recurring items.
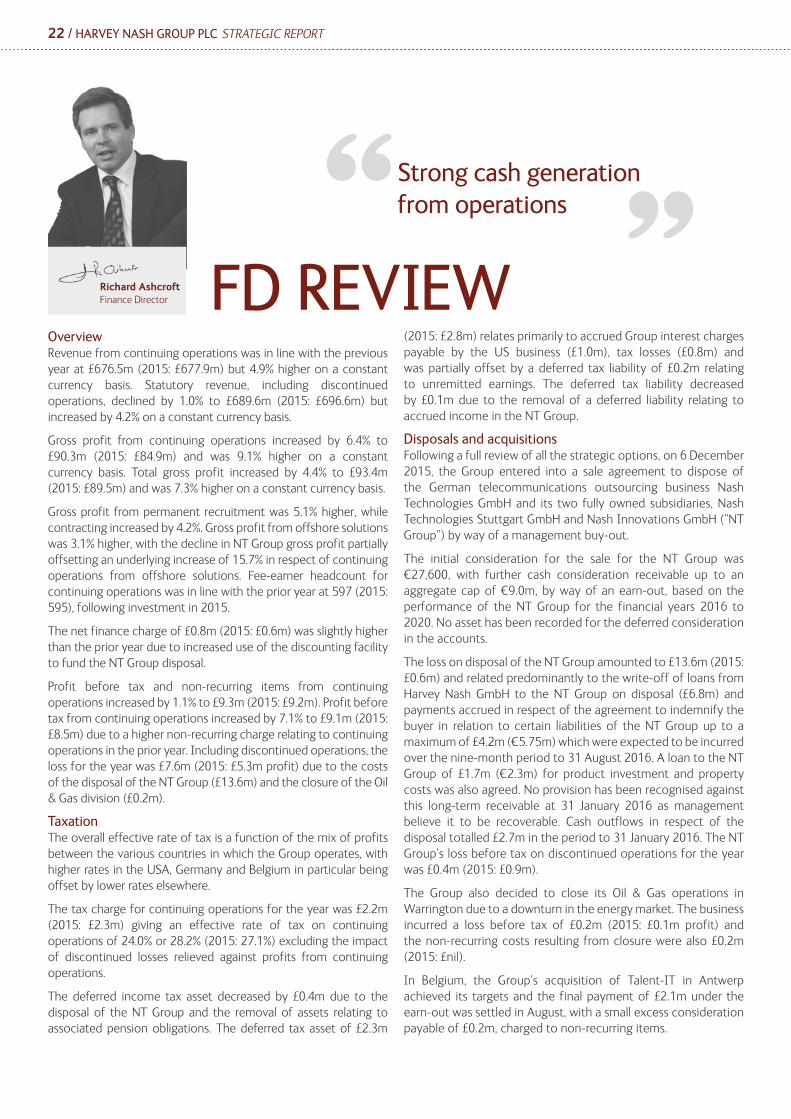
Richard AshcroftFinance Director
Strong cash generation from operations“
“
FD REVIEW

HARVEY NASH GROUP PLC STRATEGIC REPORT / 23
Earnings per shareBasic earnings per share from continuing operations increased by 10.7% to 9.42p (2015: 8.51p). Basic earnings per share from continuing operations before non-recurring costs increased by 3.3% to 9.73p (2015: 9.42p). Due to the loss on disposal of the NT Group, statutory loss per share was 10.48p (2015: 7.24p earnings).
Balance sheetTotal net assets at the year-end were £54.1m (2015: £64.6m), a decrease of 16.3% due to the retained loss in the year arising from the disposal of the NT Group of £7.6m, dividend payments of £2.7m and adverse currency movements of £0.2m.
Property, plant and equipment decreased by £0.3m to £3.6m (2015: £3.9m) due to the disposal of £0.6m of assets related to the NT Group, offset by a £0.3m increase in other assets as capital additions exceeded depreciation. Other fixed asset disposals of £0.3m were made, of which £0.3m were fully depreciated.
Intangible assets decreased by £0.7m to £50.7m due to the disposal of capitalised software of £3.8m as part of the NT Group disposal, of which £2.1m had been capitalised in the year (2015: £1.7m), offset by exchange adjustments (£1.0m) and brand amortisation (£0.1m).
Net trade receivables increased to £106.3m (2015: £80.0m), due mainly to the timing of invoicing in the Netherlands (+£23.0m). Debtor days(1) decreased for another year to 41.8 days (2015: 42.5 days). Prepayments and accrued income decreased by £18.0m, due mainly to decreases in accrued revenue in the Netherlands as a result of the timing of invoicing (-£13.2m). Trade payables increased by £2.7m to £61.8m, again due mainly to the timing of payments. Accruals for taxes and social security payable increased by £4.0m to £11.0m, due mainly to the later payment of VAT in the Netherlands compared with the prior year (+£3.7m). Accruals and deferred income increased by £7.0m to £48.8m, due mainly to higher accruals for contractor costs in the Netherlands (+£5.5m). Other payables increased by £7.3m to £8.2m and relate mainly to payment obligations related to the NT Group disposal.
Deferred consideration also decreased by £1.9m to £0.5m (2015: £2.4m), due to the final payment of £2.1m in respect of the Talent-IT acquisition, of which £1.9m was included within deferred consideration and the excess taken to non-recurring items. The excess consideration was due to the assumed discounting of the payable not being realised. The closing balance includes £0.5m
estimated as payable in August 2017 in respect of the Beaumont KK acquisition completed in August 2014. The overall decrease of £0.3m in provisions for liabilities and charges relates predominantly to the utilisation of the provision in respect of the closure of the French office which was completed in the current year. The remaining provision of £0.1m relates to an onerous lease obligation in the Norwegian business following restructuring in 2015.
The Group had a positive net cash position at 31 January 2016 of £0.2m (2015: £2.1m) and has no long-term debt.
Cash flowFree cash flow from operating activities before movements in working capital was once again strong at £10.8m (2015: £10.2m). Overall net cash at 31 January 2016 of £0.2m was £1.9m lower than the previous year, due mainly to cash outflows of £2.1m relating to the settlement of deferred consideration for the acquisition of Talent-IT. Other significant cash outflows in the period that were paid from retained profits included dividend payments of £2.7m (2015: £2.4m) and tax payments of £3.3m (2015: £2.6m). The disposal of the NT Group resulted in cash outflows of £2.7m in the period, being the costs of disposal paid of £4.4m, offset by the £1.7m loan facility disposed of to the NT Group. Cash outflows of £2.1m (2015: £1.7m) relating to capitalised software for the NT Group before disposal also lowered cash. Cash outflows on capital expenditure in the year were £0.1m higher than the previous year.
Banking facilitiesThe Group maintains substantial headroom in its banking facilities to fund working capital. The Group maintained an invoice discounting facility of £50m in the year, of which: £22m is in the UK; the equivalent in euros of £2m is in Ireland, £5m in Belgium, £15m in the Netherlands; and the equivalent in US dollars of £6m is in the USA; plus a £2m overdraft facility in the UK. In March 2016, the Group increased its invoice discounting facilities to £60m.
Richard Ashcroft Finance Director
(1) Debtor days are calculated by reference to outstanding debtors relative to amounts invoiced in the preceding months up to the year-end.

24 / HARVEY NASH GROUP PLC STRATEGIC REPORT
Corporate ResponsibilityPeoplePeople are at the heart of our business and the Board takes a keen interest in how we engage with and develop our employees. We foster employee engagement through building:
• respect for the organisation and its leaders
• understanding of, and opportunities to influence, the Group’s strategy and performance
• the chance to grow and develop within the organisation.
Progress is measured in an annual Employee Engagement Survey. In the 2015 survey, when asked whether staff were satisfied with Harvey Nash as an employer, over 80% (2015: 80%) of respondents said they felt positively about the Group and 82% (2015: 84%) said that they would recommend the Group as a great place to work.
The Group’s internal communications are designed to achieve awareness of the financial and economic factors that affect the performance of the Group. Employees are consulted regularly to make sure their views can be taken into account when decisions are made that affect their interests. Over 80% (2015: 80%) of respondents in the 2015 survey indicated that management had a clear view of where the organisation is going and how to get there.
Harvey Nash is a meritocracy, where talent and contribution come first. An attractive culture and strong, commercial corporate values are at the heart of what we do. Integrity, transparency, fairness, passion and excellence in delivery to our clients are just some examples of the professional attributes to which we all aspire. We always aim to work in the longer-term interests of our clients and candidates and we know that this, in turn, will be in the interests of our shareholders. We offer our employees the opportunity to participate in share incentive plans to help align their interests with those of shareholders and reward contribution to the Group’s performance. Our commitment is reflected in our membership of the Recruitment and Employment Confederation, which requires us to observe the highest principles, of ethics, integrity, professional conduct and fair practice.
Harvey Nash not only ensures that employment decisions are consistent with equal opportunities legislation in each country, but also actively encourages diversity consciousness among its management, staff and clients. One of our key principles is that the Group’s senior management includes nationals in the country in which they operate, so that they understand the market and are naturally integrated in the local business culture.
In 2015 Harvey Nash signed up to Ernst and Young’s National Equality Standard, one of the UK’s most respected and rigorous standards in diversity and inclusion. This ongoing programme will help Harvey Nash assess and improve its inclusivity, from education, to culture to processes.
Our hugely successful Inspire and Aspire programmes set out to encourage promotion of women to the highest levels in our UK and international markets. In 2015 the founder of Inspire, Carol Rosati, was appointed an OBE for services to Women in Business.
The table below summarises the gender diversity of the Group at the end of the financial year. This has been prepared in accordance with the Companies Act 2006 (Strategic Report and Directors’ Reports) Regulations 2013.
Male Female
No. % No. %
Group Board of Directors 6 86% 1 14%
Group senior managers 57 70% 21 30%
Group employees 408 44% 520 56%
Directors of undertakings included in the consolidation 19 79% 5 21%
Full consideration is also given to the recruitment, promotion, training and working environment of all staff including those with disabilities. The Group respects human rights and regards those rights relating to non-discrimination, fair treatment and respect for privacy as having the greatest potential impact on its key stakeholder groups of customers, employees and suppliers. The Board ensures that its policies encourage respect for the individual. These policies are communicated to all employees through the Human Resources Policies Manual.

HARVEY NASH GROUP PLC STRATEGIC REPORT / 25
EnvironmentThe Board recognises that the business must minimise its impact on the environment and follows recommendations from the Carbon Trust to reduce its carbon footprint. As a service business, our operations are inherently less damaging to the environment than some other business sectors. However, to reduce our emissions as much as possible the Group’s environmental policy statement commits us to:
• reducing the overall amount of waste being sent to landfill by separating out materials for recycling
• making use of mains water supply for personal consumption through onsite water filtration and purification
• optimising the operation of building cooling and heating systems
• introducing low-energy lighting wherever appropriate and feasible
• using software that automatically switches off computers to reduce consumption of power
• where possible using low-emission travel alternatives such as public transport and video conferencing
• taking account of our carbon footprint in procurement of goods, services and material capital items.
The Group surveyed its environmental impact in the form of greenhouse gases in the year. The estimated greenhouse gas emissions for the Group for the 2016 financial year were 1,255 tonnes of CO2e (2015 restated*: 1,219 tonnes of CO2e), or 0.5 tonnes of CO2e per employee** (2015 restated*: 0.6 tonnes of CO2e per employee**). The main emissions source is purchased transport (Scope 3), representing 50% of the total carbon footprint. Purchased electricity (Scope 2) represented 35.8% while fuel combustion (Scope 1) represented 10.1% of the total carbon footprint.
We calculated the above greenhouse gas emissions estimate to cover all material sources of emissions for which the Group is responsible. The methodology used was that of the Greenhouse Gas Protocol: A Corporate Accounting and Reporting Standard (revised edition, 2004). Responsibility for emissions sources was determined using the operational control approach. All emissions sources required under the Companies Act 2006 (Strategic Report and Directors’ Reports) Regulations 2013 are included.
The estimate covers all operations that are consolidated within the financial statements and the offices leased to conduct these operations. Survey data (e.g. electricity usage) was collected from the Group’s largest offices, which together employ approximately 74% of the Group’s employees, and extrapolated to cover the whole Group. Data was also collected for the Group’s transport activity and research & development sites. Activity data was then converted to greenhouse gas estimates using the UK Government’s GHG Conversion Factors for Company Reporting 2014.
Charitable contributions Many of our staff engage in activities that support charities and their local communities, which is encouraged by senior management and the Board.
Here are a few examples:
Harvey Nash staff in London and Birmingham have been involved in raising money for Byte Night, in aid of Action for Children, including achieving the world record for the furthest distance travelled on a static bike in 12 hours, as well as various “sleep outs”. Our London Executive Search supported Hestia: Housing & Support Charity, which supports victims of domestic abuse and their children.
In Ireland, our team participated in a sponsored charity walk for Focus Ireland, a charity that works to prevent people becoming, remaining or returning to homelessness.
Our international offices and staff are active in supporting a wide number of causes. In Germany, we supported the Good Night bus which provides homeless people with meals, medical and other services. In Sweden, we co-hosted an event at Skansen, an open-air museum, for refugee families to enjoy local Christmas traditions. The event was a success with over 90 attendees. In Sweden, we continue to carry out a variety of pro bono board appointment and assessment work for the Swedish Childhood Cancer Foundation, the Stockholm City Mission and the Ester Foundation.
In the USA, we sponsor a junior cycling development team and hosted a reception dinner for business, society and public policy initiative at Georgetown University. Additionally, we support the ADA Developers Academy, helping women take their first step into software development, as well as a San Francisco-based foodbank.
In the Netherlands, staff participated for the fifth year in the Unicef run in Breukelen.
The Strategic Report on pages 12 to 25 was approved by the Board of Directors on 27 April 2016 and signed on its behalf by:
Albert EllisChief Executive
* The 2015 total tonnes of CO2e and tCO2e per employee has been restated to represent continuing operations.
** tCO2e per employee includes contractor headcount. This is in line with Defra guidelines to report on employees, both permanent and temporary.

HARVEY NASH GROUP PLCGOVERNANCE & ACCOUNTS
2016
HARVEY NASH GROUP PLC CORPORATE GOVERNANCE / 27
Corporate GovernanceFor the year ended 31 January 2016
Dear Shareholders
As a Board, we recognise that we have been entrusted with the stewardship of the Company and its undertakings by our shareholders and at all times carry out our responsibilities in a transparent manner with honesty, integrity and commitment.
In the interests of full disclosure we have set out in these financial statements the sources of capital made available to the Group other than that provided by shareholders. As in previous years, we continue to use an invoice discounting facility provided by RBS, which increased in March 2016 from £50 million to £60 million for the Group as a whole. We also have an overdraft facility of £2 million in the UK.
As a Board, we have reviewed the statements in this report to ensure that they comply with the spirit of the UK Corporate Governance Code and in particular with the provision of C1.1 that they are fair, balanced and understandable. We have reviewed the Strategic Report as set out on pages 12 to 25 of the Annual Report to ensure that it provides the information necessary for shareholders to assess the Group’s performance, business model and strategy. We are satisfied that it is consistent with our understanding of business performance, financial position and the story told by the numbers. We have highlighted the risks that we perceive the business faces and how they have been and will continue to be mitigated. The Audit Committee also reviewed the annual financial statements as a whole to ascertain whether the statements were fair, balanced and understandable with particular consideration of the reasonableness of accounting judgements and estimates and the selection and application of suitable accounting policies.
We are confident that we have achieved our aim of transparency and hope that you agree we have provided you with the information you need to assess the Group’s position and performance, business model and strategy. We have conducted a robust assessment of the risk management processes in place and the underlying internal control environment to ensure they are effective. We have paid particular attention in the current year to enhancing the clarity with which we communicate to you as shareholders the risk management policies of the Group and why we are confident in confirming the Longer-Term Viability of the Group to you over the three-year period ending January 2019. We have included this information within the Strategic Report as we view good risk management as a key aspect of our sustainability strategy.
The Board completed its annual evaluation process in November 2015. During the current year, an independent external adviser, Socia, was engaged to review the performance of the Board. The Board evaluation report included an assessment of performance against each of the provisions in the UK Corporate Governance Code issued in September 2014 (the “Code”) and actions required to improve the Board’s performance. While no significant performance matters were noted in respect of compliance with the Code, the Board received constructive feedback on improving its approach to strategy development along with a number of other useful recommendations to enhance its effectiveness. These have been adopted by the Board and will be monitored during the current year.
Throughout the year ended 31 January 2016 and to the date of this document, the Group has been compliant with the provisions set out in the Code, which can be found on the FRC website (www.frc.org.uk) and further details of how we have complied with the Code can be found in the Statement of Internal Control.
Julie BaddeleyChairman
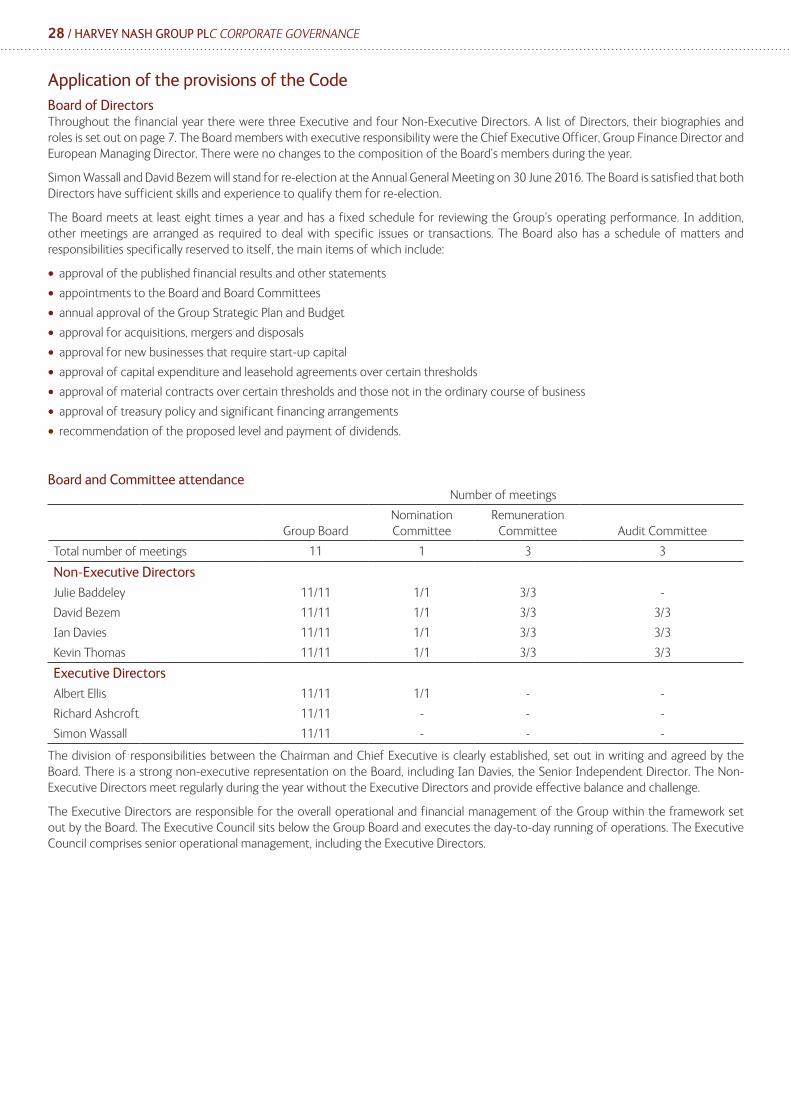
28 / HARVEY NASH GROUP PLC CORPORATE GOVERNANCE
Application of the provisions of the CodeBoard of DirectorsThroughout the financial year there were three Executive and four Non-Executive Directors. A list of Directors, their biographies and roles is set out on page 7. The Board members with executive responsibility were the Chief Executive Officer, Group Finance Director and European Managing Director. There were no changes to the composition of the Board’s members during the year.
Simon Wassall and David Bezem will stand for re-election at the Annual General Meeting on 30 June 2016. The Board is satisfied that both Directors have sufficient skills and experience to qualify them for re-election.
The Board meets at least eight times a year and has a fixed schedule for reviewing the Group’s operating performance. In addition, other meetings are arranged as required to deal with specific issues or transactions. The Board also has a schedule of matters and responsibilities specifically reserved to itself, the main items of which include:
• approval of the published financial results and other statements
• appointments to the Board and Board Committees
• annual approval of the Group Strategic Plan and Budget
• approval for acquisitions, mergers and disposals
• approval for new businesses that require start-up capital
• approval of capital expenditure and leasehold agreements over certain thresholds
• approval of material contracts over certain thresholds and those not in the ordinary course of business
• approval of treasury policy and significant financing arrangements
• recommendation of the proposed level and payment of dividends.
Board and Committee attendance Number of meetings
Group BoardNomination Committee
Remuneration Committee Audit Committee
Total number of meetings 11 1 3 3
Non-Executive Directors
Julie Baddeley 11/11 1/1 3/3 -
David Bezem 11/11 1/1 3/3 3/3
Ian Davies 11/11 1/1 3/3 3/3
Kevin Thomas 11/11 1/1 3/3 3/3
Executive Directors
Albert Ellis 11/11 1/1 - -
Richard Ashcroft 11/11 - - -
Simon Wassall 11/11 - - -
The division of responsibilities between the Chairman and Chief Executive is clearly established, set out in writing and agreed by the Board. There is a strong non-executive representation on the Board, including Ian Davies, the Senior Independent Director. The Non-Executive Directors meet regularly during the year without the Executive Directors and provide effective balance and challenge.
The Executive Directors are responsible for the overall operational and financial management of the Group within the framework set out by the Board. The Executive Council sits below the Group Board and executes the day-to-day running of operations. The Executive Council comprises senior operational management, including the Executive Directors.
HARVEY NASH GROUP PLC CORPORATE GOVERNANCE / 29
Outside the formal schedule of matters reserved for the Board, the Chairman and Non-Executive Directors make themselves available for consultation with the executive team as often as necessary.
The Senior Independent Director and the Company Secretary monitor procedural compliance. The appointment and removal of Directors is a matter for the Board as a whole. Independent professional advice and training are available to all the Directors. The Senior Independent Director is available for consultation with shareholders through the Company Secretary. The Executive Directors meet with the Company’s major shareholders and other potential investors on a regular basis and report to the Board on those meetings.
On joining the Board, a new Director receives appropriate induction including meetings with other Directors and senior management, the opportunity to visit the Group’s key operations and meeting the Group’s principal advisers.
The Board has a policy of providing reasonable funding for independent professional advice for all Directors in furtherance of their duties as Directors of the parent Company, and continued professional development.
The Board discusses and reviews its performance and membership regularly and sets its objectives annually. As part of this process, the Board, including the Chairman, considers whether it has sufficient time to discharge its responsibilities effectively. The Directors’ profiles and other commitments are set out on page 7.
As mentioned above, the Board engaged an independent external adviser, Socia, to review the Board’s performance in the current year. Socia has no other relationship to the Group beyond evaluating the Board. The evaluation process provided the opportunity for the Board to reflect on how after a period of significant development in the business, the changes have affected the dynamics, constitution and operation of the Board.
The evaluation included:
• meeting with the Chairman and the Company Secretary to agree objectives of the evaluation
• interviews with each member of the Board
• observation of a Board meeting
• reviewing the Board composition, expertise and dynamics
• assessment of succession planning and appraisal processes.
Socia provided the Board with an evaluation report, which included feedback on performance against each of the Code provisions and suggested actions to improve the Board’s performance. The findings of this evaluation process were that the Board operates in a professional manner and was compliant with the principles and the spirit of the UK Corporate Governance Code as appropriate to the business. A number of recommendations were made, including how the Board could improve its approach to strategy development. These recommendations have been adopted and will be monitored during the current year. The summary results from the evaluations were presented at the Board meeting in November 2015.
In relation to non-reserved matters, the Board is assisted by a number of committees with delegated authority. The defined terms of reference for each committee are available within the Investors section of the Group’s website.
Audit CommitteeThe Audit Committee meets at least twice a year with the Group’s senior financial management and the External Auditor to review the interim and annual financial statements, the accounting policies of the Group, its internal financial control procedures and compliance with accounting standards.
The members of the Committee during the year were Ian Davies (Chairman), David Bezem and Kevin Thomas. The Board considers that the members of the Committee both individually and as a whole have sufficient recent and relevant financial experience to discharge its function.
The Audit Committee Report on pages 53 to 55 includes details of the Audit Committee policy, practices and engagement with the External Auditor.
Remuneration CommitteeThe Remuneration Committee meets at least twice a year. The members of the Committee during the year were David Bezem (Chairman), Julie Baddeley, Ian Davies and Kevin Thomas.
The Remuneration Committee determines and approves the policy, remuneration and long-term incentive arrangements of the Company’s Executive Directors and the Chairman. The Chief Executive Officer may be invited to attend meetings of the Committee but does not participate in discussions of his own remuneration arrangements.
The remuneration of the Non-Executive Directors, excluding the Chairman of the Board, is set by the Executive Directors. The remuneration of the Chairman of the Board is set by the Remuneration Committee excluding the Chairman.
The Remuneration Report on pages 34 to 52 includes details of remuneration policy, practices and the remuneration of the Directors.
30 / HARVEY NASH GROUP PLC CORPORATE GOVERNANCE
Nomination CommitteeThe Group has a Nomination Committee, which provides a transparent process and procedure for the appointment of new Directors to the Board. The members of the Committee during the year were Julie Baddeley (Chairman), Ian Davies, David Bezem and Albert Ellis.
The Committee’s terms of reference include:
• responsibility for identifying and nominating candidates for appointment to the Board
• evaluating the balance of skills, knowledge and experience required on the Board
• succession planning.
In making appointments, the Nomination Committee takes account of the diversity of experience, gender, background and the composition of the Board.
The Committee considers succession plans for the members of the Group Board over the short and longer term, keeping in mind the balance of skills, experience and background required to ensure the Group’s commitment to deliver sustainable shareholder value is met. The Committee considers the requirements of the Board and seeks to maintain a balance between innovation and experience when considering the required composition of the Board.
The Group remains committed to maximising career opportunities through significant investment in training and professional development at all levels of the Group. The Committee supports internal development programmes to build the skills required of future Board Directors and leaders among relevant employees.
The terms and conditions for the appointment of Non-Executive Directors are available for review at 110 Bishopsgate, EC2N 4AY during normal business hours and 15 minutes before the AGM begins at 9.30am on 30 June 2016.
Relations with shareholdersThe Board maintains regular dialogue with its major shareholders and City analysts by conducting formal presentations, being readily available for discussion and providing information as required. During the year, the Chief Executive Officer and Group Finance Director met significant shareholders to update them in person regarding results and key developments concerning the Group and to understand any issues and concerns they may have. The views of shareholders and market perceptions are regularly communicated to the Board via verbal briefings. The Company produces Annual and Interim Reports for shareholders and the Company’s website contains up-to-date information on the Group’s activities.
Constructive use of the Annual General MeetingShareholder attendance and participation at the AGM is welcomed. Amendments to the Company’s Articles of Association require shareholder approval at the AGM. The Company proposes separate resolutions on each substantially separate issue and the proxy appointment forms for each resolution provides shareholders with the option to direct their proxy to vote either for or against a resolution or to withhold their vote. The Company’s registrars ensure that all valid proxy appointments received for the AGM are properly recorded and counted and a schedule of proxy votes cast is made available to all shareholders attending the meeting. There is also full disclosure of the voting outcome on the Company’s website as soon as practicable after the AGM. Shareholders are given the opportunity to raise issues formally at the AGM or informally with Directors after the meeting. All Directors normally attend the AGM and the Chairs of the Committees are available to answer questions at the meeting. The notice of the AGM and related papers are sent to shareholders at least 20 working days before the meeting.
Internal controlThe Directors have overall responsibility for ensuring that the Group maintains a system of internal controls, for monitoring their effectiveness to provide them with reasonable assurance regarding the reliability of financial information used within the business and for publication, and that assets are safeguarded. There are inherent limitations in any system of internal control and accordingly even the most effective system can only provide reasonable, and not absolute, assurance against misstatement or loss.
The Board identifies and appraises risks, and maintains control and direction over appropriate strategic, financial, and organisational structure matters with formally defined lines of responsibility and delegation of authority. There are established procedures for planning and capital expenditure, for information and reporting systems, and for monitoring the Group’s business and its performance. The Board has delegated to executive management the implementation of the systems of internal financial control within an established framework that applies throughout the Group, and is responsible for reviewing the Group’s whistleblowing procedures.
The Directors believe the following to be the key procedures established to provide internal financial control:
• the operation of authorisation procedures
• appropriate segregation of duties
• clearly delegated responsibilities
• close involvement of senior management in day-to-day activities
• setting of detailed annual budgets with reporting of variance analysis on a monthly basis
• the operation of an Audit Committee, supported by an internal audit function
• an established whistleblowing policy, the governance of which is overseen by the Audit Committee.
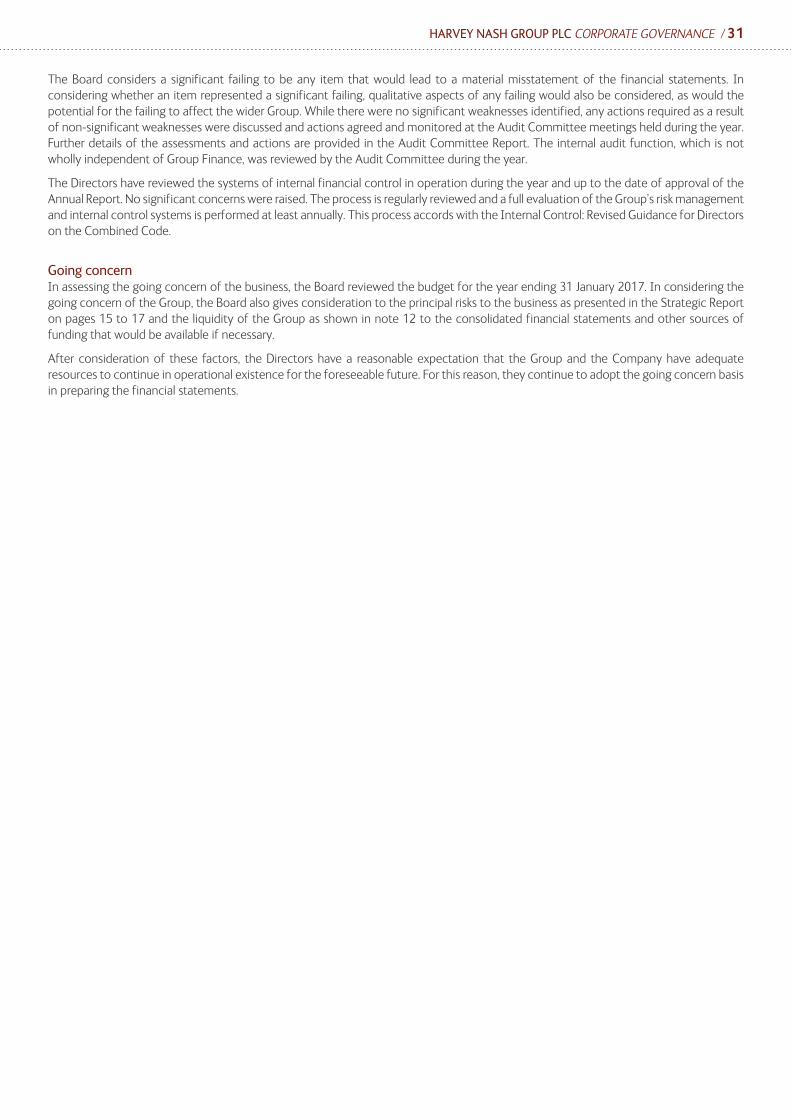
HARVEY NASH GROUP PLC CORPORATE GOVERNANCE / 31
The Board considers a significant failing to be any item that would lead to a material misstatement of the financial statements. In considering whether an item represented a significant failing, qualitative aspects of any failing would also be considered, as would the potential for the failing to affect the wider Group. While there were no significant weaknesses identified, any actions required as a result of non-significant weaknesses were discussed and actions agreed and monitored at the Audit Committee meetings held during the year. Further details of the assessments and actions are provided in the Audit Committee Report. The internal audit function, which is not wholly independent of Group Finance, was reviewed by the Audit Committee during the year.
The Directors have reviewed the systems of internal financial control in operation during the year and up to the date of approval of the Annual Report. No significant concerns were raised. The process is regularly reviewed and a full evaluation of the Group’s risk management and internal control systems is performed at least annually. This process accords with the Internal Control: Revised Guidance for Directors on the Combined Code.
Going concernIn assessing the going concern of the business, the Board reviewed the budget for the year ending 31 January 2017. In considering the going concern of the Group, the Board also gives consideration to the principal risks to the business as presented in the Strategic Report on pages 15 to 17 and the liquidity of the Group as shown in note 12 to the consolidated financial statements and other sources of funding that would be available if necessary.
After consideration of these factors, the Directors have a reasonable expectation that the Group and the Company have adequate resources to continue in operational existence for the foreseeable future. For this reason, they continue to adopt the going concern basis in preparing the financial statements.

32 / HARVEY NASH GROUP PLC DIRECTORS’ REPORT
Directors’ ReportFor the year ended 31 January 2016
The Directors present their Annual Report and the audited consolidated financial statements of the Group and the financial statements of the Company for the year ended 31 January 2016.
Principal activitiesThe Group’s principal activity during the year was the provision of professional recruitment and offshore solutions. The Group has a number of overseas subsidiaries and branches in Europe, the USA, Vietnam, Australia, Hong Kong and Japan. The parent Company is incorporated and domiciled in the United Kingdom. The registered office is 110 Bishopsgate, London EC2N 4AY.
Details of the Group’s strategy and a discussion of trends affecting the Group’s businesses are set out in the Strategic Report on pages 12 to 25.
Results and dividends The Group’s profit before tax and non-recurring items from continuing operations for the year was £9.3m (2015: £9.2m). The Group’s loss before tax was £5.4m (2015: profit £7.6m). The Directors recommend a final dividend of 2.360 pence per share amounting to £1.7m (2015: 2.171 pence per share amounting to £1.6m), to be paid on 8 July 2016 to shareholders on the register as at 17 June 2016. If approved at the AGM on 30 June 2016, this would take total dividend pay-outs for the financial year to 3.850 pence per share (2015: 3.531 pence per share). This marks the ninth successive annual increase. As in previous years, the Harvey Nash Group Employee Benefit Trust (“EBT”) once again waived its right to receive dividends. As at 31 January 2016, the EBT held 897,584 shares (2015: 897,584).
Share capitalThere was no movement in shares in issue during the financial year. The number of ordinary shares in issue at 31 January 2016 was 73,450,393 (2015: 73,450,393) with a nominal value of £3,672,520 (2015: £3,672,520).
Research and development In December 2015, the Group disposed of its interest in its German telecommunication outsourcing business, Nash Technologies GmbH. The Group capitalised direct costs incurred of £2.1m (2015: £1.7m) as an intangible asset, but these were disposed of as part of the agreement. Further details are available in note 32 to the consolidated financial statements.
Political and charitable donationsThe Group made no political or charitable donations during the year (2015: £nil). As outlined in the Corporate Responsibility section, support for worthy charities and community projects by employees is actively promoted.
Directors and their interestsThe Directors who held office throughout the financial year and to the date of this report were:
• Julie Baddeley (Chairman)
• Ian Davies (Senior Independent Director)
• David Bezem
• Kevin Thomas
• Albert Ellis
• Richard Ashcroft
• Simon Wassall
The Company’s Articles of Association require Directors to retire from office every three years, while Non-Executive Directors who have served for over nine years must stand for re-election every year. Simon Wasall and David Bezem intend to offer themselves for re-election at the Annual General Meeting on 30 June 2016. All Non-Executive Directors are considered to be independent.
All Executive Directors have service contracts with the Company terminable by either party giving to the other not less than 12 months’ notice. Letters of appointment are available for review from the Company Secretary. The beneficial interests, in both shares and share options, of the Directors and their families are disclosed in detail in the Remuneration Report. There have been no changes in Directors’ interests between the end of the financial year and the date of this report.
Directors’ and Officers’ liability insuranceThe Company maintains liability insurance for the Directors and Officers of the Company and its subsidiaries.
HARVEY NASH GROUP PLC DIRECTORS’ REPORT / 33
Purchase of own sharesThe Directors, on behalf of the Company, are empowered to authorise the purchase of up to 10% of the Company’s issued share capital. No shares were purchased in the market during the year, although the Directors will seek to renew the authority to purchase up to 10% of the Company’s issued share capital at the AGM.
Substantial shareholdings On 27 April 2016, the Company had been notified that there were holdings of 3% or more in the ordinary share capital of the Company as follows:
Number of % of
shares total
Hargreave Hale 9,660,000 13.15
Miton Asset Management 7,896,438 10.75
Unicorn Asset Management 6,816,633 9.28
Standard Life Investments 6,399,506 8.71
Mr D Treacher 4,732,500 6.44
Chelverton Asset Management 3,950,000 5.38
Mr T Crawford 3,797,923 5.17
Barclays Stockbrokers 2,916,112 3.97
External AuditorEach of the persons who is a Director at the date of approval of this Annual Report confirms that:
• so far as the Director is aware, there is no relevant audit information of which the Company’s External Auditor is unaware
• each Director has taken all the steps that they ought to have taken as a Director in order to make themself aware of any relevant audit information and to establish that the Company’s External Auditor is aware of that information.
This confirmation is given and should be interpreted in accordance with the provisions of s418 of the Companies Act 2006.
Deloitte LLP have indicated their willingness to continue in office as auditors and a resolution to reappoint them will be proposed at the Annual General Meeting on 30 June 2016.
ApprovalThe Directors’ Report was approved by the Board of Directors on 27 April 2016 and signed on its behalf by:
Albert Ellis Chief Executive

34 / HARVEY NASH GROUP PLC REMUNERATION REPORT
Directors’ Remuneration ReportPart 1: Annual statement
Dear Shareholders
IntroductionI am pleased to introduce the Directors’ Remuneration Report for the year ending 31 January 2016, Part 3 of which will be put forward for your consideration and approval at the Annual General Meeting on 30 June 2016. Part 2, the Directors’ remuneration policy, was approved at the Annual General Meeting on 3 July 2014 and is binding for three years. The policy is set out again following this letter for your convenience so you do not have to refer back to a prior year’s Annual Report. We remain aligned to the policy that was agreed and do not propose any changes this year to our current remuneration policy.
The Group has again delivered a robust performance, with growth in gross profit across all service lines on a constant currency basis. This has been achieved notwithstanding continuing challenging conditions, particularly in Europe and in permanent recruitment in some markets, which did not improve over the course of the year. Reported profit before tax from continuing operations before non-recurring items was £9.3 million (2015: £9.2 million), an increase of 1.1% year on year. Net cash at the year-end was £0.2 million, ahead of expectations due to tight working capital controls, and debtor days at the year-end were also excellent at 41.8 days, the lowest for some years.
In addition, the Group streamlined its operations with the disposal of its German telecoms outsourcing business Nash Technologies GmbH (“Nash Technologies”), which included the innovations business developing a mobile small cell technology solution. The Board viewed these operations as non-core and both were facing significant challenges.
The Remuneration Committee has taken these and other factors into account when making decisions about remuneration as explained below.
Remuneration strategy and policyOur remuneration policy was approved at the Annual General Meeting on 3 July 2014 and introduced by the Committee following a review of the appropriateness and efficacy of our previous remuneration policies. It was developed mindful of the wider debate on executive remuneration and the published views of the various shareholder representative bodies. The policy was also informed by the consultations carried out before it was put to shareholders and a small number of adjustments were made as a consequence of that exercise.
The Board remains committed to aligning overall compensation with the long-term interests of shareholders, balanced by a variable bonus component focused on achieving stretching performance targets set annually. In the following sections of this letter, I explain the outcome of the annual bonus award for Executive Directors for the 2016 financial year and the approach adopted for the next financial year. I also report on the salary reviews for the next financial year and awards made under the Performance Share Plan.
Annual bonuses for the 2016 financial yearIn accordance with the approved remuneration policy, the maximum possible total bonus payable to each of the Executive Directors in respect of the 2016 financial year was 100% of their respective base salaries. Up to 70% of this was based on profit before tax and non-recurring items (“the financial performance bonus”) and up to 30% on personal and strategic targets (“the personal targets bonus”).
For the financial performance bonus, the Remuneration Committee set on-target and maximum performance targets of £9.7 million and £10.0 million at which levels 60% and 100% respectively of the financial performance bonus would be awarded. On-target performance of £9.7 million reflected the Group’s budget and the City’s initial expectations for the 2016 financial year. The target for threshold performance was set at £9.0 million, being the actual profit before tax and non-recurring items in the preceding financial year. Between £9.0 million and £9.7 million the financial performance bonus increased from 0% to 60% calculated on a straight-line basis. In the event, profit from continuing operations, before tax and non-recurring items, for the year of £9.3 million resulted in 26.0% of the financial performance bonus being payable.
The personal targets bonus for the 2016 financial year was based on three objectives, which the Remuneration Committee determined to be in line with the Group’s short- and longer-term objectives. Each of these accounted equally for a third of the maximum personal targets bonus. The three objectives related to:
i. achievement of a satisfactory disposal of or exit from the Nash Technologies businesses;
ii. achievement of specified targets for cash and debtor days at the year-end; and
iii. retention of key employees.
HARVEY NASH GROUP PLC REMUNERATION REPORT / 35
In December, Nash Technologies was successfully sold, notwithstanding the challenging and competitive environment both the Nash Technologies businesses were facing, resulting in a satisfactory outcome for shareholders in the Board’s view. This was supported by feedback from a number of institutional investors.
As mentioned at the beginning of this letter, the net cash balance and debtor days at the end of the financial year exceeded expectations. The on-target performance for this component of the personal targets bonus was aligned to the budget with the maximum being set at a level requiring a significantly better result. This element of the bonus was also subject to net cash at the end of the year exceeding a pre-set minimum.
Both these tests applied to all three Executive Directors.
The Group’s most important asset is its people and for this reason the third personal targets bonus related to the retention of key employees. In respect of Albert Ellis and Simon Wassall, in order to achieve on-target performance approximately 90% of these individuals needed to be retained throughout the financial year. To achieve the maximum bonus a significantly higher percentage was required. For Richard Ashcroft, in view of his position as Group Finance Director, he was responsible for a specific sub-set of this list comprising the most senior finance individuals in the Group.
In summary, Albert Ellis and Simon Wassall achieved all their personal objectives resulting in 100% of the personal targets bonus being payable to each of them. Richard Ashcroft achieved the first two of his three personal objectives, resulting in him receiving 66.7% of the maximum personal targets bonus.
In aggregate, therefore, Albert Ellis and Simon Wassall received a bonus for the 2016 financial year of 48.2% of their base salary. This comprised 18.2% in respect of the financial performance bonus and 30% in respect of the personal targets bonus. Richard Ashcroft received a bonus of 38.2% of his base salary. This comprised 18.2% in respect of the financial performance bonus and 20% in respect of the personal targets bonus.
Annual bonuses and salary reviews for the 2017 financial yearThe Remuneration Committee has set new bonus targets for the 2017 financial year. As for 2016, the maximum possible annual bonus will be 100% of base salary in accordance with the approved remuneration policy. With respect to the financial performance bonus, representing 70% of the maximum possible bonus, on-target performance, which would result in the payment of 60% of this element of the bonus, will require the Group to achieve higher profits as compared with the actual outcome for the 2016 financial year. This new target has been set taking account of the Board’s view of the Group’s prospects for 2017, City expectations and the general economic environment as it may affect our business. It is intended to be an achievable but stretching target. The details will be set out in next year’s Annual Report.
The tests for the 2017 personal targets bonus, representing 30% of the maximum possible total bonus, have been set for the three Executive Directors on a similar basis to the 2016 financial year, although they have been refined and adjusted to improve further the alignment of the Executives’ incentives with the Group’s short- and long-term objectives. Each of the three Executive Directors has three tests, some shared, each accounting for a third of the personal targets bonus and, as for 2016, these relate to the achievement of certain specified cash and debtor day targets, the retention or recruitment of key staff and to a number of strategic objectives.
The Committee reviewed salaries for the Executive Directors for the 2017 financial year in the light of the wider exercise for the Group’s senior staff and the approved remuneration policy. The policy limits annual increases in base salary for the Executive Directors to the higher of the increase in the RPI and 5%. The Committee decided that the base salaries for the Executive Directors should be increased by the change in RPI over the preceding 12 months prior to the beginning of the 2016 financial year. This was an increase of 1.2%. There were no other changes to their remuneration terms.
The Committee also reviewed the remuneration of the Chairman and decided that this should be increased in line with the increase in the RPI as well. The fees for the Non-Executive Directors, which are determined by the Executive Directors and not the Remuneration Committee, were also increased by 1.2%.
Long-term share schemesThe Group introduced a long-term share scheme in the form of a Performance Share Plan (the “PSP”) following its approval at the Annual General Meeting on 3 July 2014. The Committee granted awards under the PSP in both the 2015 and 2016 financial years with the intention that awards under the PSP would be made annually. The third award is being made to each of the Executive Directors immediately after the announcement of results for this financial year. In accordance with the remuneration policy, each of these awards was worth 100% of the respective recipient’s base salary based on the prevailing share price at the time the award was made.
Under the PSP, threshold performance is achieved if earnings per share increase by an average of 7.5% over a three-year period. This minimum performance criterion has so far not been achieved in respect of either of the first two awards and, as such, no charge to the income statement has been accrued for the PSP awards made to date.

36 / HARVEY NASH GROUP PLC REMUNERATION REPORT
We also continue to operate the Harvey Nash 2005 Share Option Plan (the “CSOP”) for key members of staff below Board level although no new awards were made in the 2016 financial year. As stated in the remuneration policy, the Committee has no intention of issuing new share options under the CSOP to Directors.
Share options issued to the Executive Directors in June 2012 and due to vest in June 2015 did not meet the minimum performance criterion when tested in respect of the three financial years ending on 31 January 2015. In accordance with the terms of the CSOP, the Company last year extended the performance period by one year. Accordingly, the performance test was applied again in respect of the four years ending on 31 January 2016 and, as the minimum performance criterion was not achieved in respect of this period either, these options will not vest and accordingly have lapsed.
The Executive Directors had one other tranche of share options. These were granted under the CSOP in June 2013 and were due to vest in June 2016, subject to achieving the performance criteria when tested over the three financial years ending on 31 January 2016 as well. As the minimum performance criterion was not met in respect of this period, and the Remuneration Committee has decided not to extend the performance period by an additional year, these options have also lapsed.
Committee members and meetingsIn accordance with best practice, set out below are the members of the Remuneration Committee during the 2016 financial year and, in summary, a note of the main issues the Committee has considered on the Board’s behalf.
The Remuneration Committee members comprised:
• David Bezem (Chairman)
• Ian Davies
• Julie Baddeley
• Kevin Thomas.
The Committee met three times in the year, the attendance of which is detailed on page 28 in the Corporate Governance section. The following is a summary of the main topics discussed:
26 February 2015• Subject to the finalisation of the accounts, approval of the annual bonus awards to be paid in respect of the year ending 31 January
2015.
• Agreement in principle of the annual bonus tests for the 2016 financial year, subject to confirmation of certain figures in the 2015 audit, in respect of both the financial performance bonus test and the three personal targets bonus tests for each of the Executive Directors.
• Agreement of intention to make a second grant of awards under the PSP to the Executive Directors following the announcement of the results for the 2015 financial year.
23 April 2015• Agreement that the performance test in relation to the CSOP share options granted in 2012 to the Executive Directors would be ex-
tended by one year as permitted by the scheme rules.
• Confirmation of the annual bonus awards to be paid in respect of the year ending 31 January 2015 and confirmation of the bonus targets for 2016.
• Approval of awards under the PSP to the Executive Directors equivalent in value to 100% of their base salary.
28 January 2016• Initial discussion regarding the likely bonus outcomes for the Executive Directors in respect of the 2016 financial year.
• Initial discussion regarding the setting of annual bonus targets for the 2017 financial year.
• Agreement to increase the Executive Directors’ and Chairman’s base salaries by 1.2%, in accordance with the approved remuneration policy, to come into effect on 1 February 2016 for the 2017 financial year.
• Agreement that in the event the 2013 CSOP awards did not vest, once audited results for the 2016 financial year were available and they could be tested, the performance period would not be extended by an additional year.
HARVEY NASH GROUP PLC REMUNERATION REPORT / 37
Directors’ Remuneration Report Regulations 2013 (“the Regulations”)
The Companies Act 2006 requires the External Auditor to report to the shareholders on certain parts of the Directors’ Remuneration Report and state whether, in their opinion, those parts of the Report have been properly prepared in accordance with the Regulations. The parts of the Annual Report on Remuneration that are subject to audit are indicated within the Report.
I hope you have found this letter to be a helpful summary of the Remuneration Committee’s approach to remuneration in the 2016 financial year and for the next financial year. As I have mentioned above, the approved remuneration policy is reprinted in Part 2, which includes notes on the implementation of each of the facets of the policy, and the annual report on remuneration in respect of the 2016 financial year is set out in Part 3. These have been prepared in accordance with the Regulations and our understanding of current best practice for remuneration reporting.
The 2017 financial year will be the third year of operation of the current remuneration policy which was approved by shareholders on 3 July 2014. Accordingly, in accordance with the Regulations, we will put forward a new policy for your approval at the Annual General Meeting following the end of the next financial year. We value shareholder dialogue and feedback at Harvey Nash and therefore, to the extent that we are considering making significant changes to the current remuneration policy, we will seek to discuss these with our major shareholders in advance so that we can take your views into account. This consultation is likely to take place towards the end of the 2017 financial year.
David Bezem Remuneration Committee Chairman
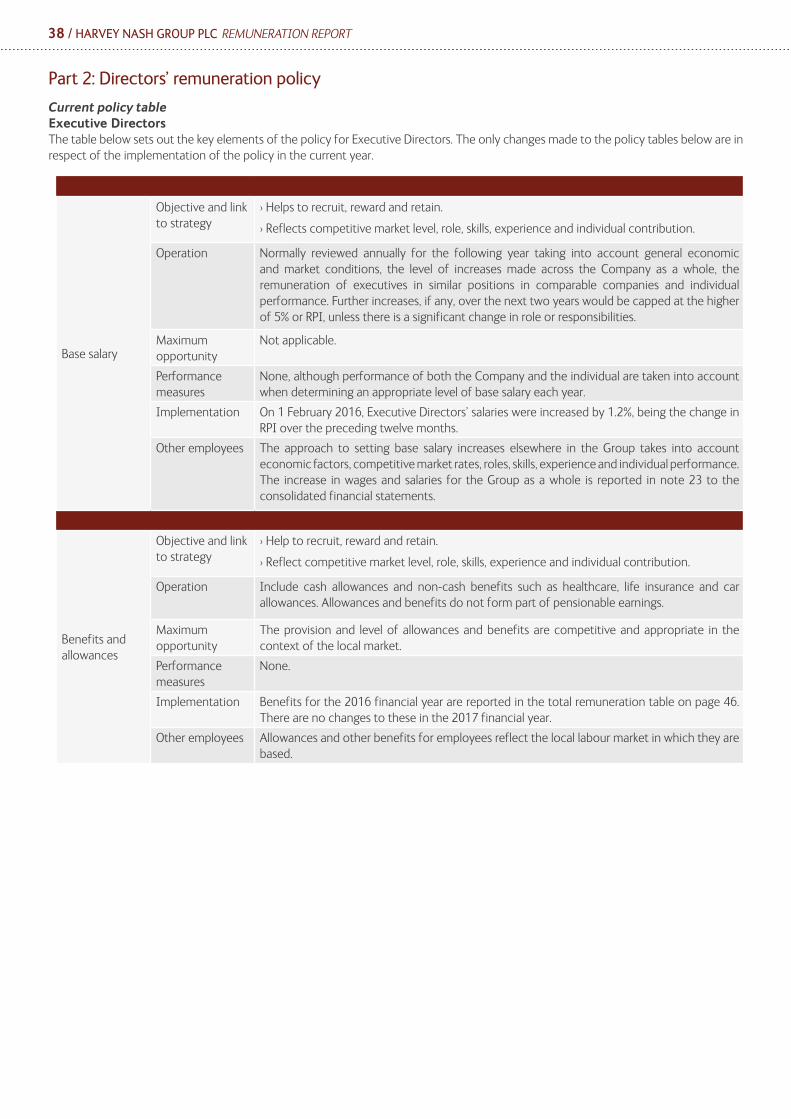
38 / HARVEY NASH GROUP PLC REMUNERATION REPORT
Part 2: Directors’ remuneration policy
Current policy tableExecutive DirectorsThe table below sets out the key elements of the policy for Executive Directors. The only changes made to the policy tables below are in respect of the implementation of the policy in the current year.
Base salary
Objective and link to strategy
› Helps to recruit, reward and retain.
› Reflects competitive market level, role, skills, experience and individual contribution.
Operation Normally reviewed annually for the following year taking into account general economic and market conditions, the level of increases made across the Company as a whole, the remuneration of executives in similar positions in comparable companies and individual performance. Further increases, if any, over the next two years would be capped at the higher of 5% or RPI, unless there is a significant change in role or responsibilities.
Maximum opportunity
Not applicable.
Performance measures
None, although performance of both the Company and the individual are taken into account when determining an appropriate level of base salary each year.
Implementation On 1 February 2016, Executive Directors’ salaries were increased by 1.2%, being the change in RPI over the preceding twelve months.
Other employees The approach to setting base salary increases elsewhere in the Group takes into account economic factors, competitive market rates, roles, skills, experience and individual performance. The increase in wages and salaries for the Group as a whole is reported in note 23 to the consolidated financial statements.
Benefits and allowances
Objective and link to strategy
› Help to recruit, reward and retain.
› Reflect competitive market level, role, skills, experience and individual contribution.
Operation Include cash allowances and non-cash benefits such as healthcare, life insurance and car allowances. Allowances and benefits do not form part of pensionable earnings.
Maximum opportunity
The provision and level of allowances and benefits are competitive and appropriate in the context of the local market.
Performance measures
None.
Implementation Benefits for the 2016 financial year are reported in the total remuneration table on page 46. There are no changes to these in the 2017 financial year.
Other employees Allowances and other benefits for employees reflect the local labour market in which they are based.
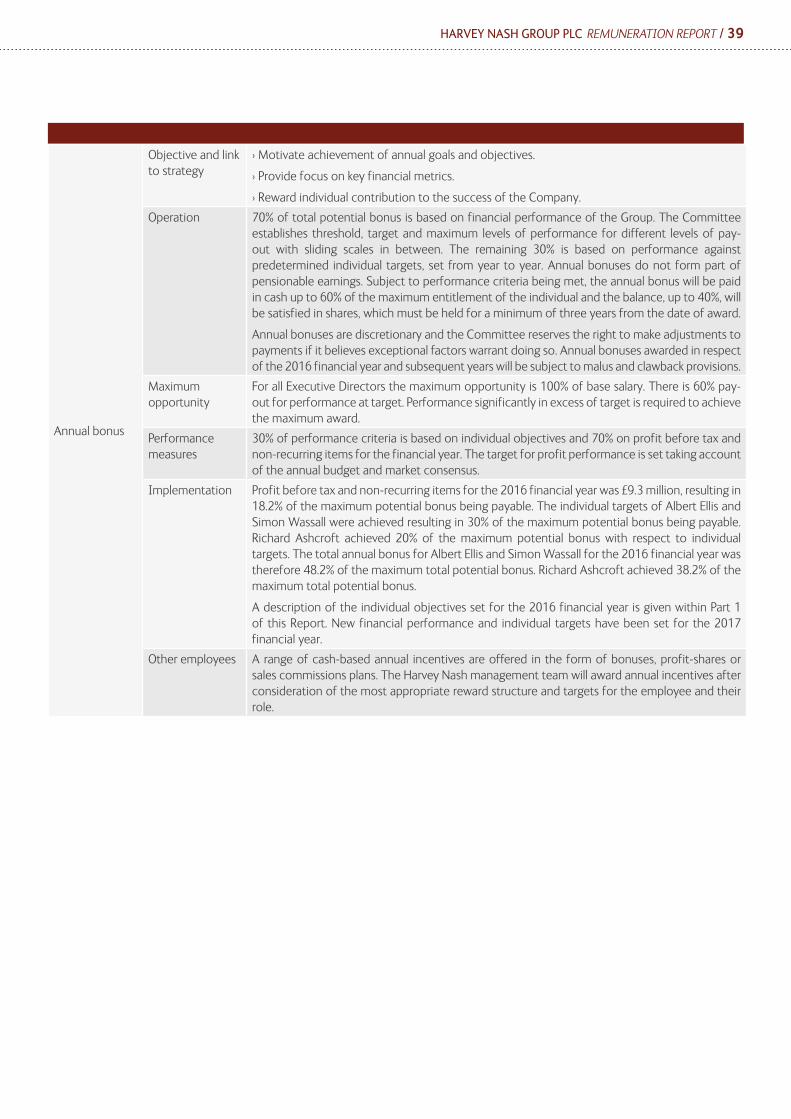
HARVEY NASH GROUP PLC REMUNERATION REPORT / 39
Annual bonus
Objective and link to strategy
› Motivate achievement of annual goals and objectives.
› Provide focus on key financial metrics.
› Reward individual contribution to the success of the Company.
Operation 70% of total potential bonus is based on financial performance of the Group. The Committee establishes threshold, target and maximum levels of performance for different levels of pay-out with sliding scales in between. The remaining 30% is based on performance against predetermined individual targets, set from year to year. Annual bonuses do not form part of pensionable earnings. Subject to performance criteria being met, the annual bonus will be paid in cash up to 60% of the maximum entitlement of the individual and the balance, up to 40%, will be satisfied in shares, which must be held for a minimum of three years from the date of award.
Annual bonuses are discretionary and the Committee reserves the right to make adjustments to payments if it believes exceptional factors warrant doing so. Annual bonuses awarded in respect of the 2016 financial year and subsequent years will be subject to malus and clawback provisions.
Maximum opportunity
For all Executive Directors the maximum opportunity is 100% of base salary. There is 60% pay-out for performance at target. Performance significantly in excess of target is required to achieve the maximum award.
Performance measures
30% of performance criteria is based on individual objectives and 70% on profit before tax and non-recurring items for the financial year. The target for profit performance is set taking account of the annual budget and market consensus.
Implementation Profit before tax and non-recurring items for the 2016 financial year was £9.3 million, resulting in 18.2% of the maximum potential bonus being payable. The individual targets of Albert Ellis and Simon Wassall were achieved resulting in 30% of the maximum potential bonus being payable. Richard Ashcroft achieved 20% of the maximum potential bonus with respect to individual targets. The total annual bonus for Albert Ellis and Simon Wassall for the 2016 financial year was therefore 48.2% of the maximum total potential bonus. Richard Ashcroft achieved 38.2% of the maximum total potential bonus.
A description of the individual objectives set for the 2016 financial year is given within Part 1 of this Report. New financial performance and individual targets have been set for the 2017 financial year.
Other employees A range of cash-based annual incentives are offered in the form of bonuses, profit-shares or sales commissions plans. The Harvey Nash management team will award annual incentives after consideration of the most appropriate reward structure and targets for the employee and their role.
40 / HARVEY NASH GROUP PLC REMUNERATION REPORT
Long-term incentive
Objective and link to strategy
› Designed to help recruit, reward and retain.
› Drive long-term earnings and share price growth and value creation.
› Align interests of executives and shareholders.
› Encourage long-term shareholding and commitment to the Company.
› Link corporate performance to management’s long-term reward in a flexible way.
Operation Harvey Nash Performance Share Plan (“PSP”)
The 2016 financial year was the second year of operation of the PSP. Share awards will vest following a 3-year performance period subject to the achievement of compound average earnings per share (“eps”) growth targets. Sustaining eps growth is a key performance metric that will drive long-term shareholder value creation. Targets have been set by reference to the Company’s six-year strategic plan and analysts’ forecasts and reflect strong and sustained performance for maximum awards.
Eps is based on adjusted earnings attributable to equity shareholders of the Company by the weighted average number of ordinary shares in issue during the year, excluding any ordinary shares purchased by the Company and held in trust. Earnings will normally be stated before non-recurring items, subject to the discretion of the Committee.
Eps growth is calculated using the point-to-point method. This method compares the adjusted eps in the Company’s accounts for the financial year ended prior to the grant date with the adjusted eps for the financial year ending three years later and calculates the implicit compound annual growth rate (“cagr”) over the period.
The Remuneration Committee retains the right, in exceptional circumstances, to reclaim any awards based on financial misstatement and/or the misconduct of an individual through means deemed appropriate to those specific circumstances.
Harvey Nash Share Incentive Plan
All employees of the Group (with at least three months’ service) have the opportunity to acquire shares in the Group via the Harvey Nash Share Incentive Plan (SIP). The shares are then held in trust on behalf of the employee. Partnership Shares may be withdrawn from trust at any time by the individual and retained or sold.
› If shares are withdrawn within three years, tax will normally be due on their value at that time.
› If withdrawn after three but before five years, there will be no tax on any gain in value since acquisition.
› After five or more years, no tax at all will be payable on the shares.
Maximum opportunity
Harvey Nash Performance Share Plan (“PSP”)
Awards will be made up to 100% of salary in the normal course of business. In exceptional circumstances, the scheme rules permit awards of up to 200%.
Harvey Nash Share Incentive Plan
Employees may purchase via deduction from salary up to a maximum value of £1,500 of shares in each tax year (or 10% of salary if less). This can be done via a single deduction or deductions each month during the tax year.
Performance measures
Harvey Nash Performance Share Plan (“PSP”)
Shares vest based on earnings per share (eps performance with 100% vesting at a cagr of 15% in eps and 20% of the maximum award vesting at a cagr CAGR of 7.5%. Vesting in between these levels will be on a straight-line basis and below 7.5% cagr no shares will vest. Shares vested under the Scheme must be retained for two years post vesting, and full dividends accrue during this period.
Implementation The Committee has granted two awards under the PSP, worth 100% of base salary, to each of the Executive Directors. The first award was granted on 3 July 2014 with a vesting date of 3 July 2017. The second award was granted on 1 May 2015 with a vesting date of 1 May 2018. Following the announcement of annual results for the 2016 financial year, the Committee intends to make a third award worth 100% of base salary.
HARVEY NASH GROUP PLC REMUNERATION REPORT / 41
Long-term incentive (continued)
Other employees Harvey Nash 2005 Company Share Option Scheme (“CSOP”)
Other employees receive awards in share options under the CSOP. Awards vest based on 3-year cumulative eps growth over the vesting period in excess of RPI +3%. The basis of eps measurement is the same as the PSP plan for Directors. Individual awards are set by taking into account:
› the face value of individual awards at the time of grant, assuming that performance targets are met in full
› market practice for comparable companies and market assessments of total remuneration from our independent advisers.
Options are awarded based on merit and are only awarded for outstanding contributions to the Group.
Harvey Nash Share Incentive Plan
Employees may join the Share Incentive Plan after 3 months of service with the Group.
Harvey Nash Performance Share Plan (“PSP”)
The Performance Share Plan is designed for Executive Directors but may be used for other top-tier management if appropriate.
Pension
Objective and link to strategy
› Help to recruit and retain.
› Recognise long-term commitment to the Company.
Operation Pension contributions are made directly into the Directors’ personal pension plans.
Maximum opportunity
15% of basic salary.
Performance measures
There are no performance measures.
Implementation In the 2016 financial year, pension contributions of 15% of basic salary were made into Directors’ pension schemes. In accordance with the policy, pension contributions will remain at 15% of base salary in the 2017 financial year. Where an executive exceeds the prevailing tax-deductible pension allowance, the Company will pay cash in lieu net of employers’ National Insurance contributions. Albert Ellis took advantage of this provision in the financial year.
Other employees Harvey Nash Scottish Widows Pension Scheme
The Harvey Nash Scottish Widows Pension Scheme is a defined contribution pension plan open to all employees. From 1 January 2014, all employees who have been employed by the Company for at least three months will be auto-enrolled into the scheme. The employees may choose to opt out but will be automatically re-enrolled at three-year intervals. Harvey Nash will make contributions to the pension scheme based on the length of enrolment of the employee varying from 50% of the employer National Insurance savings to 5% of basic salary.

42 / HARVEY NASH GROUP PLC REMUNERATION REPORT
Shareholding policy
Objective and link to strategy
› Drive long-term earnings and share price growth and value creation.
› Align interests of executives and shareholders.
› Encourage long-term shareholding and commitment to the Company.
Operation Full-time Executive Directors should aim to hold at least one year’s annual base salary in shares within a five-year period of joining the Group.
Maximum opportunity
Not applicable.
Performance measures
Not applicable.
Implementation The Directors’ shareholdings are set out on page 49 within Part 3 of this Report. Albert Ellis and Richard Ashcroft met this test for the financial year 2016. The number of shares held by Simon Wassall fell short of the required total for the financial year 2016 by 1,738 shares, worth £1,600 at the average share price of 92.05 pence. Simon Wassall has indicated his intention to purchase the number of shares needed to meet the shareholding requirement, following the announcement of the annual results for the 2016 financial year.
Other employees Not applicable.
Provisions of previous policy that will continue to apply
Objective and link to strategy
› Help to recruit, reward and retain.
› Drive long-term earnings and share price growth and value creation.
› Align interests of executives and shareholders.
› Encourage long-term shareholding and commitment to the Company.
› Link corporate performance to management’s long-term reward in a flexible way.
Operation Harvey Nash 2005 Company Share Option Scheme (“CSOP”)Previously, Directors were awarded options under the CSOP. This has been replaced by the PSP for Executive Directors and it is not planned to use the CSOP scheme in the foreseeable future for Directors.
Maximum opportunity
Not applicable.
Performance measures
Harvey Nash’s compounded annual growth in earnings per share over the performance period must exceed the compounded annual growth in the Retail Prices Index by a minimum of 3.0%. This performance criterion was chosen to incentivise the maximisation of shareholders’ return. If unforeseen circumstances cause the Remuneration Committee to consider that the performance criterion has become unfair or impractical in the circumstances, they may, at their discretion, amend the performance criterion.
Implementation Share options granted to Executive Directors under the June 2012 CSOP did not meet the performance criterion when tested in respect of the three financial years ended 31 January 2015. As permitted by the scheme rules, the Remuneration Committee exercised its discretion to extend the performance period of the options by one year. The June 2012 CSOP share options were re-tested in respect of the four financial years ending 31 January 2016 and again did not meet the performance criterion and therefore lapsed.
Share options granted to Executive Directors under the June 2013 CSOP also failed to vest as they did not meet the performance criterion over the three financial years to 31 January 2016. The Committee chose not to extend the performance period of the June 2013 CSOP grant. Share options awarded under the CSOP to the Executive Directors are detailed on page 48 within Part 3 of this Report.
Other employees Other employees will continue to be awarded share options from the CSOP for exceptional performance.

HARVEY NASH GROUP PLC REMUNERATION REPORT / 43
Non-Executive DirectorsThe table below sets out the key elements of the policy for Non-Executive Directors.
Fees
Objective and link to strategy
› Helps to recruit, reward and retain.› Reflects competitive market level, role, skills, experience and individual contribution.
Operation Reviewed annually for the following year taking into account general economic and market conditions, the level of increases made across the Company as a whole, and the remuneration of Non-Executive Directors in similar positions in comparable companies. Any increases are capped at the higher of 5% or RPI.
Maximum opportunity
Not applicable.
Performance measures
None.
Implementation The Chairman was paid £101,600 during the 2016 financial year. All other Non-Executive Directors received a fee of £42,672. If a Non-Executive Director chaired a sub-committee or performed the role of Senior Independent Director, an additional payment of £5,000 per role was paid. In line with the policy, from 1 February 2016, the Chairman’s remuneration and the Non-Executive Directors’ fees, including those paid for chairing a sub-committee or performing the role of Senior Independent Director, were increased by 1.2%, being the change in the RPI over the preceding twelve months.
Shareholding
Objective and link to strategy
› To ensure independence of the Non-Executive Directors is maintained.› To safeguard the governance of the Group.
Operation Non-Executive Directors are permitted but not obliged to hold shares.
Maximum opportunity
Not applicable.
Performance measures
None.
Implementation Julie Baddeley and Kevin Thomas hold 10,000 shares each.
Approach to recruitment remunerationThe table below summarises our key policies with respect to recruitment remuneration.
Element Policy
Base salary and benefits Harvey Nash operates in a highly competitive sector. The Committee’s approach to recruitment remuneration is to pay no more than is necessary to attract appropriate candidates to the role. Any new Executive Director’s package would include the same elements, and be subject to the same constraints, as those of the existing Executive Directors.
Pension 15% of base salary. The Committee reserves the right to adjust contributions by a maximum of 10% if it feels it is warranted based on economic and competitive factors.
Annual bonus Up to 100% of base salary based on performance. Annual incentive plans are discretionary and the Committee reserves the right to make adjustments to payments if it believes exceptional factors warrant doing so.
Long-term incentives Any new Executive Director’s package would be expected to include the same long-term incentive structure as those of existing Executive Directors.
Sign-on payments/ recruitment awards
Harvey Nash’s policy is not to pay sign-on payments above and beyond the normal buy-out policy to replace rewards forfeited or payments forgone.
Share buy-outs/ replacement awards
Where it is necessary to “buy out” an individual’s awards from a previous employer, the Committee will seek to match the expected value of the awards by granting awards that vest over a similar period, reducing the quantum if the new awards are subject to performance conditions that are less stretching than those on the awards given up.
Relocation policies Harvey Nash will cover reasonable costs of relocation for Directors.
Implementation Share options granted to Executive Directors under the June 2012 CSOP did not meet the performance criterion when tested in respect of the three financial years ended 31 January 2015. As permitted by the scheme rules, the Remuneration Committee exercised its discretion to extend the performance period of the options by one year. The June 2012 CSOP share options were re-tested in respect of the four financial years ending 31 January 2016 and again did not meet the performance criterion and therefore lapsed.
Share options granted to Executive Directors under the June 2013 CSOP also failed to vest as they did not meet the performance criterion over the three financial years to 31 January 2016. The Committee chose not to extend the performance period of the June 2013 CSOP grant. Share options awarded under the CSOP to the Executive Directors are detailed on page 48 within Part 3 of this Report.
Other employees Other employees will continue to be awarded share options from the CSOP for exceptional performance.
44 / HARVEY NASH GROUP PLC REMUNERATION REPORT
Service contracts and payment for loss of office
DirectorDate of contract / letter
of appointmentUnexpired term
Notice period by Company or Director
Executive
Albert Ellis 01.02.2001 Continuous 12 months
Simon Wassall 17.10.2005 Continuous 12 months
Richard Ashcroft 14.11.2005 Continuous 12 months
Non-Executive
Julie Baddeley 20.06.2013 Continuous 6 months
David Bezem 01.06.2013 Continuous 6 months
Ian Davies 26.09.2013 Continuous 6 months
Kevin Thomas 01.05.2014 Continuous 6 months
The table below sets out, for each element of total remuneration, the Group’s policy on payment for loss of office in respect of Directors who leave in accordance with the terms of their contract (“good leavers”) and any discretion available to the Committee.
Element Approach Committee discretion
Base salary benefits and pension
Executive Directors are remunerated for the twelve months of their notice period in accordance with their normal contractual terms.
Non-Executive Directors are remunerated for the six months of their notice period in accordance with their normal contractual terms.
The Committee may agree a payment in lieu of notice if they consider it to be in the interests of shareholders for the Director not to serve the full notice period.
Annual bonus Annual bonus – for the purposes of any annual bonus entitlement, if the Executive Director is still employed on the bonus payment date (including if under notice, if such notice was given after the end of the performance year), a bonus will be paid as normal. No payment will be made if the employment is terminated before the end of the performance period or if the executive is not employed on the bonus payment date.
Deferred share bonus – any awarded but unvested deferred share awards will be reduced on a time pro rata basis and paid on the vesting date.
The Committee has discretion to negotiate the annual bonus payable based on the individual performance of the Director and expected full-year result.
The Committee also has the discretion to substitute unvested deferred share awards for a commensurate cash alternative if felt appropriate.
Long-term incentive – PSP Upon cessation of employment, the Director’s awards shall cease to be capable of call and the awards will lapse 30 days later.
The Committee has discretion to allow the call of unvested awards on an accelerated basis subject to a reduction in the number of shares that may be acquired. Alternatively, the Committee may allow the Director to maintain the awards until vesting and permit their call within six months of the vesting date, subject to a reduction in the number of shares that may be acquired.
Long-term incentive – CSOP Any long-term incentive awards which are in at least the second year of the performance period will vest after the end of the performance period on a pro-rated basis. If the Executive Director leaves during the first year of the performance period, the award will lapse.
The award of long-term incentives in respect of options under the CSOP is entirely at the discretion of the Committee up to the levels defined in the LTIP policy for normal service.
Non-executive and executive appointments will be terminated immediately with no compensation for loss of office if they are terminated for cause (“bad leavers”). Bad leavers will be remunerated in the form of their base salary and benefits for services performed to the date of termination. All outstanding unvested shares will lapse; no cash or deferred share bonuses will be paid.
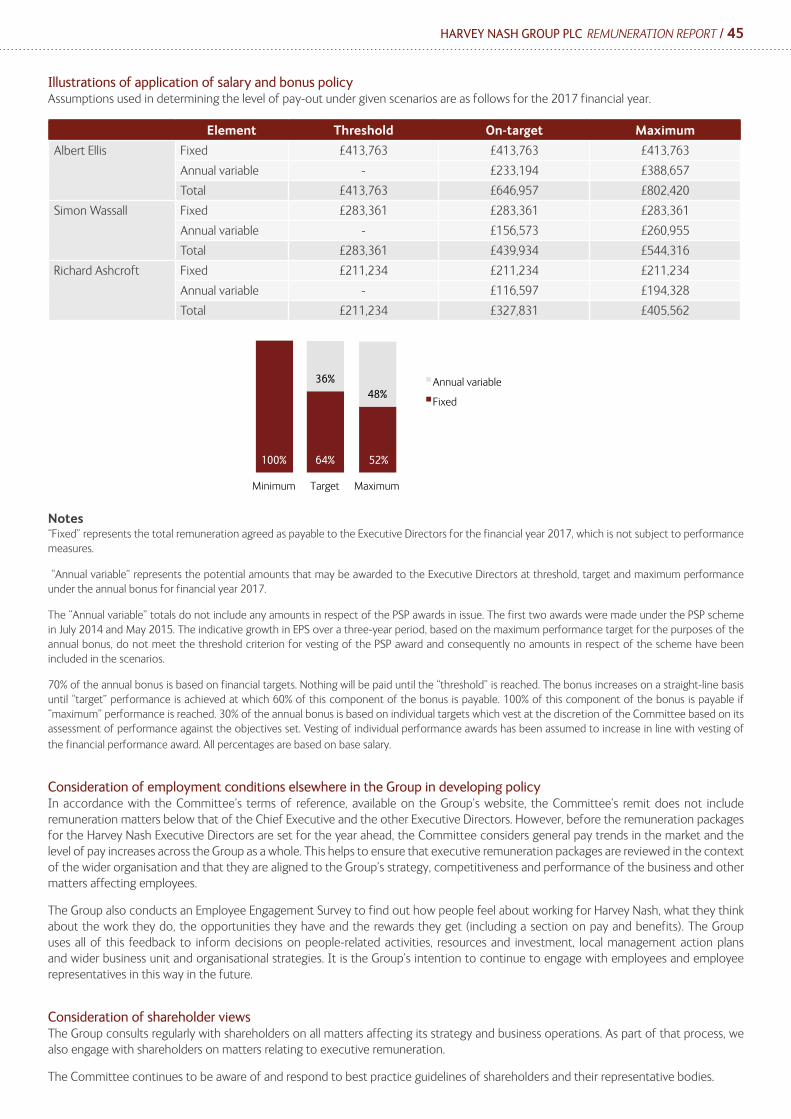
HARVEY NASH GROUP PLC REMUNERATION REPORT / 45
Illustrations of application of salary and bonus policyAssumptions used in determining the level of pay-out under given scenarios are as follows for the 2017 financial year.
Element Threshold On-target Maximum
Albert Ellis Fixed £413,763 £413,763 £413,763
Annual variable - £233,194 £388,657
Total £413,763 £646,957 £802,420
Simon Wassall Fixed £283,361 £283,361 £283,361
Annual variable - £156,573 £260,955
Total £283,361 £439,934 £544,316
Richard Ashcroft Fixed £211,234 £211,234 £211,234
Annual variable - £116,597 £194,328
Total £211,234 £327,831 £405,562
Notes “Fixed” represents the total remuneration agreed as payable to the Executive Directors for the financial year 2017, which is not subject to performance measures.
“Annual variable” represents the potential amounts that may be awarded to the Executive Directors at threshold, target and maximum performance under the annual bonus for financial year 2017.
The “Annual variable” totals do not include any amounts in respect of the PSP awards in issue. The first two awards were made under the PSP scheme in July 2014 and May 2015. The indicative growth in EPS over a three-year period, based on the maximum performance target for the purposes of the annual bonus, do not meet the threshold criterion for vesting of the PSP award and consequently no amounts in respect of the scheme have been included in the scenarios.
70% of the annual bonus is based on financial targets. Nothing will be paid until the “threshold” is reached. The bonus increases on a straight-line basis until “target” performance is achieved at which 60% of this component of the bonus is payable. 100% of this component of the bonus is payable if “maximum” performance is reached. 30% of the annual bonus is based on individual targets which vest at the discretion of the Committee based on its assessment of performance against the objectives set. Vesting of individual performance awards has been assumed to increase in line with vesting of
the financial performance award. All percentages are based on base salary.
Consideration of employment conditions elsewhere in the Group in developing policyIn accordance with the Committee’s terms of reference, available on the Group’s website, the Committee’s remit does not include remuneration matters below that of the Chief Executive and the other Executive Directors. However, before the remuneration packages for the Harvey Nash Executive Directors are set for the year ahead, the Committee considers general pay trends in the market and the level of pay increases across the Group as a whole. This helps to ensure that executive remuneration packages are reviewed in the context of the wider organisation and that they are aligned to the Group’s strategy, competitiveness and performance of the business and other matters affecting employees.
The Group also conducts an Employee Engagement Survey to find out how people feel about working for Harvey Nash, what they think about the work they do, the opportunities they have and the rewards they get (including a section on pay and benefits). The Group uses all of this feedback to inform decisions on people-related activities, resources and investment, local management action plans and wider business unit and organisational strategies. It is the Group’s intention to continue to engage with employees and employee representatives in this way in the future.
Consideration of shareholder viewsThe Group consults regularly with shareholders on all matters affecting its strategy and business operations. As part of that process, we also engage with shareholders on matters relating to executive remuneration.
The Committee continues to be aware of and respond to best practice guidelines of shareholders and their representative bodies.
100% 64% 52%
36% 48%
Minimum Target Maximum
Annual variable
Fixed
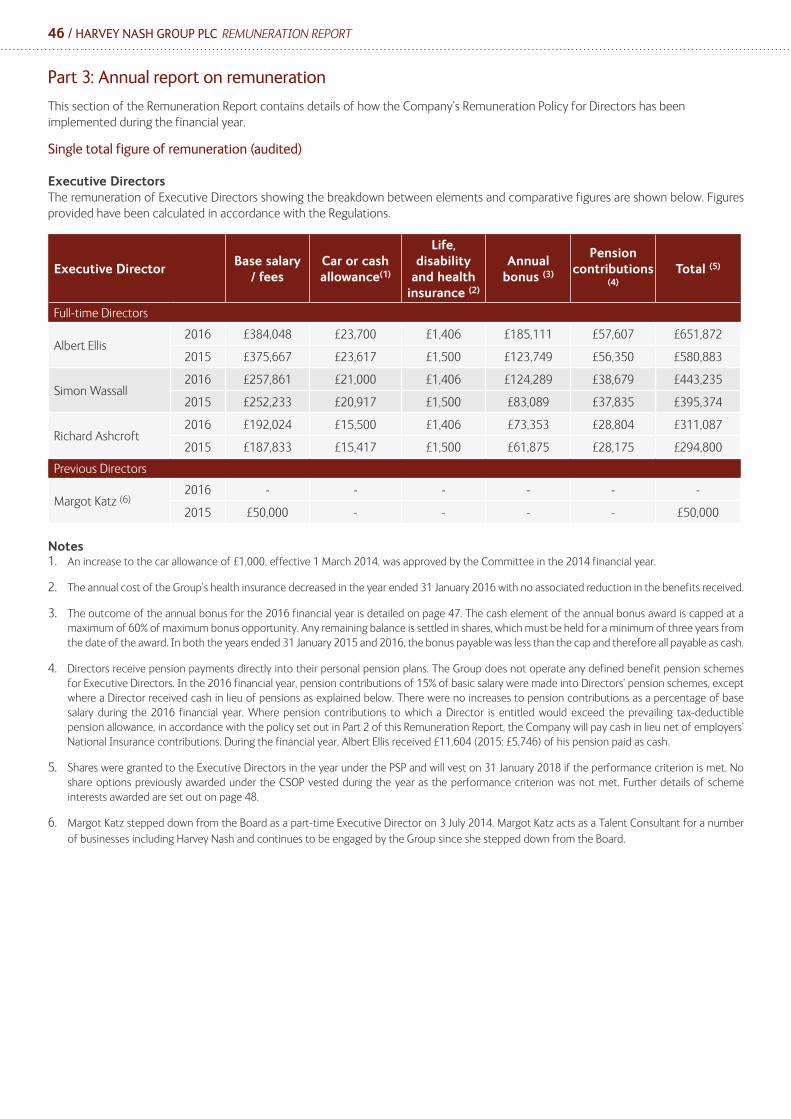
46 / HARVEY NASH GROUP PLC REMUNERATION REPORT
Part 3: Annual report on remuneration
This section of the Remuneration Report contains details of how the Company’s Remuneration Policy for Directors has been implemented during the financial year.
Single total figure of remuneration (audited)
Executive DirectorsThe remuneration of Executive Directors showing the breakdown between elements and comparative figures are shown below. Figures provided have been calculated in accordance with the Regulations.
Executive DirectorBase salary
/ feesCar or cash allowance(1)
Life, disability
and health insurance (2)
Annual bonus (3)
Pension contributions
(4)Total (5)
Full-time Directors
Albert Ellis2016 £384,048 £23,700 £1,406 £185,111 £57,607 £651,872
2015 £375,667 £23,617 £1,500 £123,749 £56,350 £580,883
Simon Wassall2016 £257,861 £21,000 £1,406 £124,289 £38,679 £443,235
2015 £252,233 £20,917 £1,500 £83,089 £37,835 £395,374
Richard Ashcroft2016 £192,024 £15,500 £1,406 £73,353 £28,804 £311,087
2015 £187,833 £15,417 £1,500 £61,875 £28,175 £294,800
Previous Directors
Margot Katz (6)2016 - - - - - -
2015 £50,000 - - - - £50,000
Notes 1. An increase to the car allowance of £1,000, effective 1 March 2014, was approved by the Committee in the 2014 financial year.
2. The annual cost of the Group’s health insurance decreased in the year ended 31 January 2016 with no associated reduction in the benefits received.
3. The outcome of the annual bonus for the 2016 financial year is detailed on page 47. The cash element of the annual bonus award is capped at a maximum of 60% of maximum bonus opportunity. Any remaining balance is settled in shares, which must be held for a minimum of three years from the date of the award. In both the years ended 31 January 2015 and 2016, the bonus payable was less than the cap and therefore all payable as cash.
4. Directors receive pension payments directly into their personal pension plans. The Group does not operate any defined benefit pension schemes for Executive Directors. In the 2016 financial year, pension contributions of 15% of basic salary were made into Directors’ pension schemes, except where a Director received cash in lieu of pensions as explained below. There were no increases to pension contributions as a percentage of base salary during the 2016 financial year. Where pension contributions to which a Director is entitled would exceed the prevailing tax-deductible pension allowance, in accordance with the policy set out in Part 2 of this Remuneration Report, the Company will pay cash in lieu net of employers’ National Insurance contributions. During the financial year, Albert Ellis received £11,604 (2015: £5,746) of his pension paid as cash.
5. Shares were granted to the Executive Directors in the year under the PSP and will vest on 31 January 2018 if the performance criterion is met. No share options previously awarded under the CSOP vested during the year as the performance criterion was not met. Further details of scheme interests awarded are set out on page 48.
6. Margot Katz stepped down from the Board as a part-time Executive Director on 3 July 2014. Margot Katz acts as a Talent Consultant for a number
of businesses including Harvey Nash and continues to be engaged by the Group since she stepped down from the Board.

HARVEY NASH GROUP PLC REMUNERATION REPORT / 47
Non-Executive DirectorsThe remuneration of Non-Executive Directors showing the breakdown between elements and comparative figures are shown below. Figures provided have been calculated in accordance with the Regulations.
Non-Executive Director Basic fees Additional fees Total fees
Julie Baddeley (1)2016 £101,600 - £101,600
2015 £100,000 - £100,000
David Bezem (2)2016 £42,672 £5,000 £47,672
2015 £42,000 £2,083 £44,083
Tom Crawford (3)2016 - - -
2015 £17,957 - £17,957
Ian Davies (4)2016 £42,672 £10,000 £52,672
2015 £42,000 £12,917 £54,917
Kevin Thomas (5)2016 £42,672 - £42,672
2015 £31,500 - £31,500
Notes 1. Julie Baddeley was appointed as Chairman on 20 June 2013.
2. David Bezem was appointed as Chairman of the Remuneration Committee on 1 September 2014.
3. Tom Crawford retired as a Non-Executive Director on 3 July 2014. As a consequence of statutory auto-enrolment, contributions of £nil (2015: £359) were made by the Company to the Harvey Nash Group Pension Plan on Tom Crawford’s behalf.
4. Ian Davies was appointed as Senior Independent Director on 20 June 2013 and Chairman of the Audit Committee on 30 September 2010. Ian Davies acted as Chairman of the Remuneration Committee from 26 September 2013 until 1 September 2014. As a consequence of statutory auto-enrolment, contributions of £1,053 (2015: £1,098) were made by the Company to the Harvey Nash Group Pension Plan on Ian Davies’ behalf. These contributions ceased in March 2016.
5. Kevin Thomas joined as a Non-Executive Director on 1 May 2014.
Outcome of the annual bonus for the 2016 financial year (audited)The performance targets, actual performance achievement and resulting bonus payments are summarised below.
Performance measures
Weighting Targets Actual% of
target satisfied
Albert Ellis Simon Wassall Richard Ashcroft
Maximum opportunity
Bonus receivable
Maximum opportunity
Bonus receivable
Maximum opportunity
Bonus receivable
Profit before tax (1) 70%
0% – £9.0m60% – £9.7m
£9,303,353 26.0% 268,834 69,897 180,503 46,931 134,417 34,948
100% – £10.0m
Personal targets (2) 30%
One-third per objective achieved
Variable66.7%-100.0%
115,214 115,214 77,358 77,358 57,607 38,405
Notes 1. For the purposes of Directors’ bonuses, profit before tax is measured from continuing operations before non-recurring items. Non-recurring items
from continuing operations in the year ended 31 January 2016 were £0.2m and predominantly related to the settlement of deferred consideration on the acquisition of Talent-IT. Discontinued operations relating mainly to the sale of the NT Group and the associated non-recurring costs were £13.6m and are disclosed separately in note 32 to the financial statements.
2. Personal bonus targets are set year to year by the Remuneration Committee, as set out in Part 2 of this Remuneration Report. The targets set in respect of the 2016 financial year are described within Part 1 of this Remuneration Report. The Committee views the disclosure of certain details of the actual personal performance targets as commercially sensitive. In the year, Albert Ellis and Simon Wassall achieved all three of their personal targets set by the Remuneration Committee and therefore each received 100% of the bonus in respect of personal targets. Richard Ashcroft
achieved two of the three personal targets set by the Remuneration Committee resulting in a bonus of 66.7% in respect of personal targets.
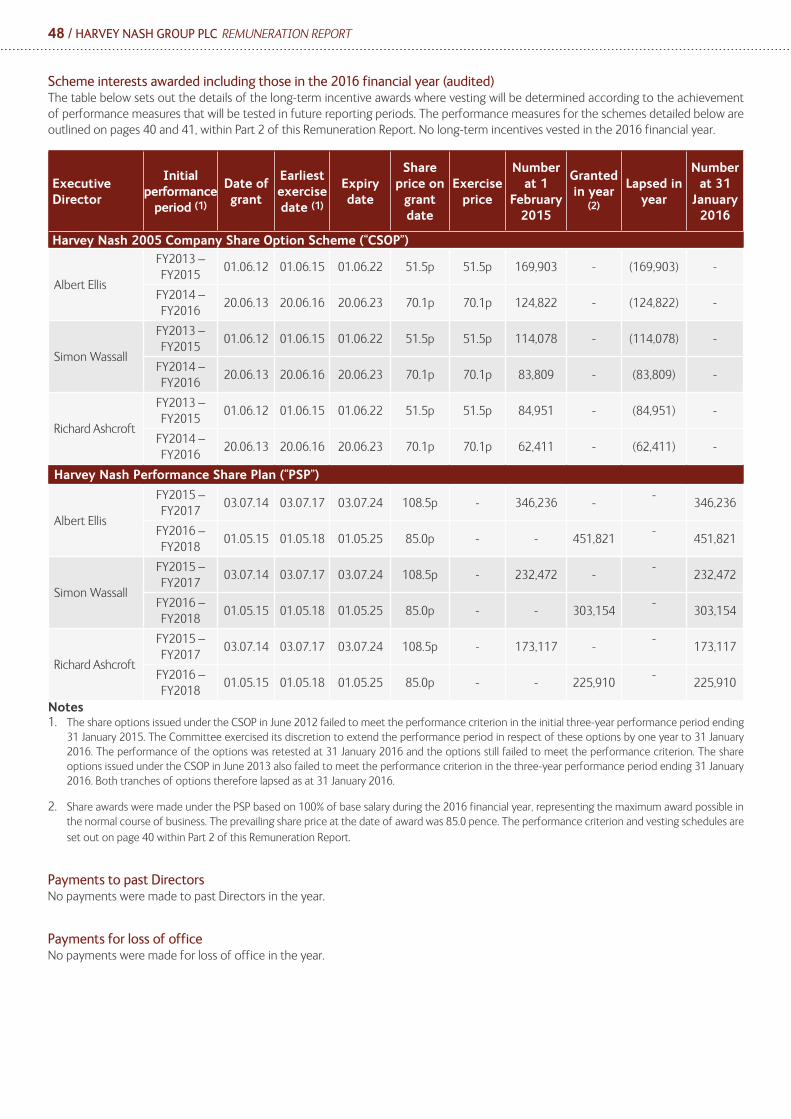
48 / HARVEY NASH GROUP PLC REMUNERATION REPORT
Scheme interests awarded including those in the 2016 financial year (audited)The table below sets out the details of the long-term incentive awards where vesting will be determined according to the achievement of performance measures that will be tested in future reporting periods. The performance measures for the schemes detailed below are outlined on pages 40 and 41, within Part 2 of this Remuneration Report. No long-term incentives vested in the 2016 financial year.
Executive Director
Initial performance
period (1)
Date of grant
Earliest exercise date (1)
Expiry date
Share price on
grant date
Exercise price
Number at 1
February 2015
Granted in year
(2)
Lapsed in year
Number at 31
January 2016
Harvey Nash 2005 Company Share Option Scheme (“CSOP”)
Albert Ellis
FY2013 – FY2015
01.06.12 01.06.15 01.06.22 51.5p 51.5p 169,903 - (169,903) -
FY2014 – FY2016
20.06.13 20.06.16 20.06.23 70.1p 70.1p 124,822 - (124,822) -
Simon Wassall
FY2013 – FY2015
01.06.12 01.06.15 01.06.22 51.5p 51.5p 114,078 - (114,078) -
FY2014 – FY2016
20.06.13 20.06.16 20.06.23 70.1p 70.1p 83,809 - (83,809) -
Richard Ashcroft
FY2013 – FY2015
01.06.12 01.06.15 01.06.22 51.5p 51.5p 84,951 - (84,951) -
FY2014 – FY2016
20.06.13 20.06.16 20.06.23 70.1p 70.1p 62,411 - (62,411) -
Harvey Nash Performance Share Plan (“PSP”)
Albert Ellis
FY2015 – FY2017
03.07.14 03.07.17 03.07.24 108.5p - 346,236 --
346,236
FY2016 – FY2018
01.05.15 01.05.18 01.05.25 85.0p - - 451,821-
451,821
Simon Wassall
FY2015 – FY2017
03.07.14 03.07.17 03.07.24 108.5p - 232,472 --
232,472
FY2016 – FY2018
01.05.15 01.05.18 01.05.25 85.0p - - 303,154-
303,154
Richard Ashcroft
FY2015 – FY2017
03.07.14 03.07.17 03.07.24 108.5p - 173,117 --
173,117
FY2016 – FY2018
01.05.15 01.05.18 01.05.25 85.0p - - 225,910-
225,910
Notes 1. The share options issued under the CSOP in June 2012 failed to meet the performance criterion in the initial three-year performance period ending
31 January 2015. The Committee exercised its discretion to extend the performance period in respect of these options by one year to 31 January 2016. The performance of the options was retested at 31 January 2016 and the options still failed to meet the performance criterion. The share options issued under the CSOP in June 2013 also failed to meet the performance criterion in the three-year performance period ending 31 January 2016. Both tranches of options therefore lapsed as at 31 January 2016.
2. Share awards were made under the PSP based on 100% of base salary during the 2016 financial year, representing the maximum award possible in the normal course of business. The prevailing share price at the date of award was 85.0 pence. The performance criterion and vesting schedules are
set out on page 40 within Part 2 of this Remuneration Report.
Payments to past DirectorsNo payments were made to past Directors in the year.
Payments for loss of officeNo payments were made for loss of office in the year.
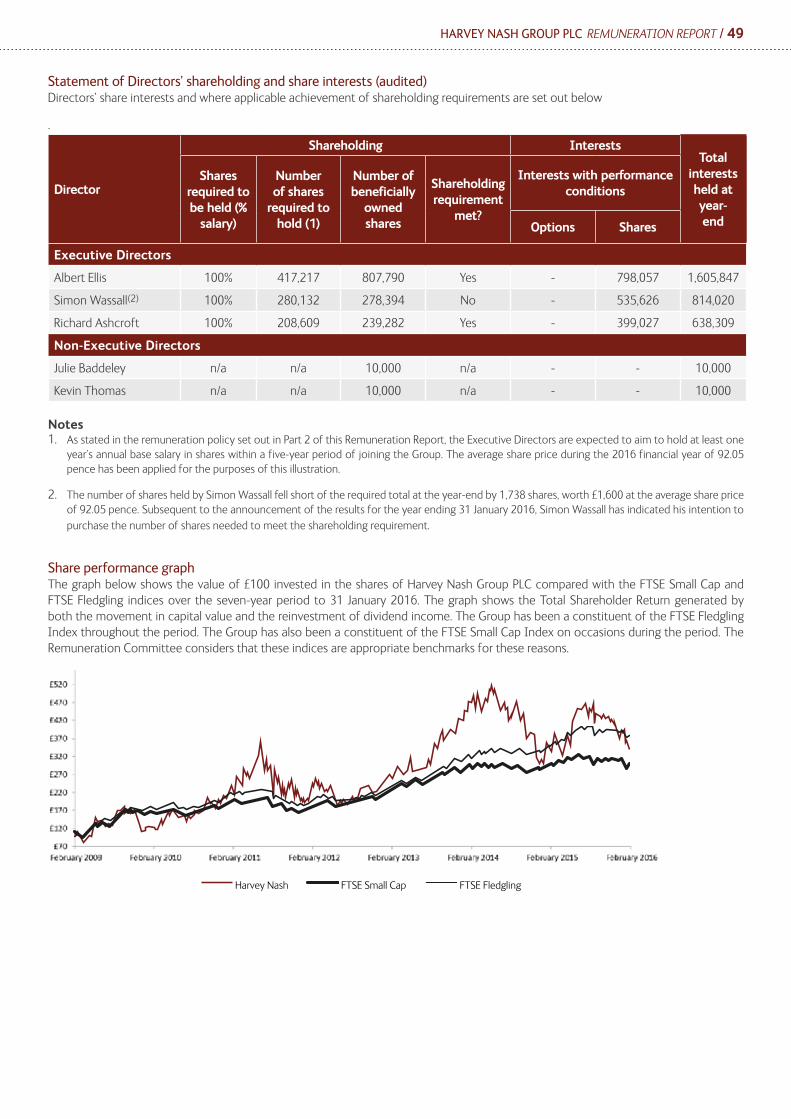
HARVEY NASH GROUP PLC REMUNERATION REPORT / 49
Statement of Directors’ shareholding and share interests (audited)Directors’ share interests and where applicable achievement of shareholding requirements are set out below
.
Director
Shareholding InterestsTotal
interests held at year- end
Shares required to be held (%
salary)
Number of shares
required to hold (1)
Number of beneficially
owned shares
Shareholding requirement
met?
Interests with performance conditions
Options Shares
Executive Directors
Albert Ellis 100% 417,217 807,790 Yes - 798,057 1,605,847
Simon Wassall(2) 100% 280,132 278,394 No - 535,626 814,020
Richard Ashcroft 100% 208,609 239,282 Yes - 399,027 638,309
Non-Executive Directors
Julie Baddeley n/a n/a 10,000 n/a - - 10,000
Kevin Thomas n/a n/a 10,000 n/a - - 10,000
Notes 1. As stated in the remuneration policy set out in Part 2 of this Remuneration Report, the Executive Directors are expected to aim to hold at least one
year’s annual base salary in shares within a five-year period of joining the Group. The average share price during the 2016 financial year of 92.05 pence has been applied for the purposes of this illustration.
2. The number of shares held by Simon Wassall fell short of the required total at the year-end by 1,738 shares, worth £1,600 at the average share price of 92.05 pence. Subsequent to the announcement of the results for the year ending 31 January 2016, Simon Wassall has indicated his intention to
purchase the number of shares needed to meet the shareholding requirement.
Share performance graph The graph below shows the value of £100 invested in the shares of Harvey Nash Group PLC compared with the FTSE Small Cap and FTSE Fledgling indices over the seven-year period to 31 January 2016. The graph shows the Total Shareholder Return generated by both the movement in capital value and the reinvestment of dividend income. The Group has been a constituent of the FTSE Fledgling Index throughout the period. The Group has also been a constituent of the FTSE Small Cap Index on occasions during the period. The Remuneration Committee considers that these indices are appropriate benchmarks for these reasons.
Harvey Nash FTSE Small Cap FTSE Fledgling
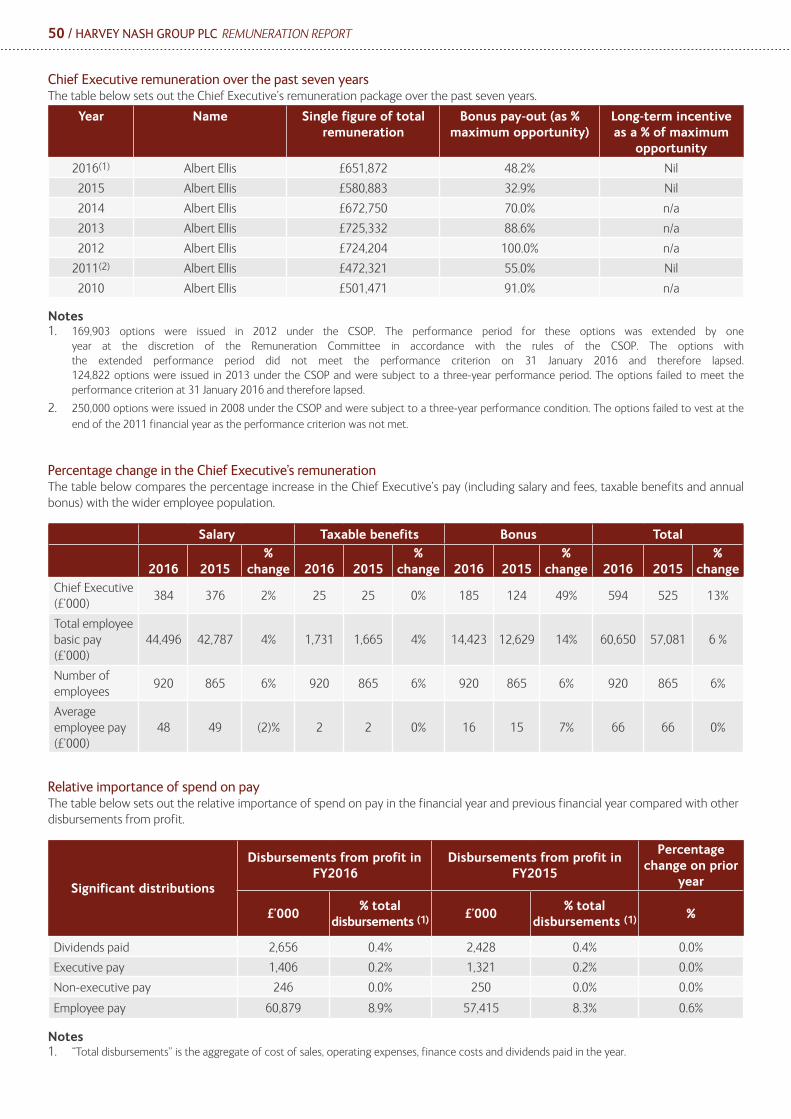
50 / HARVEY NASH GROUP PLC REMUNERATION REPORT
Chief Executive remuneration over the past seven yearsThe table below sets out the Chief Executive’s remuneration package over the past seven years.
Year Name Single figure of total remuneration
Bonus pay-out (as % maximum opportunity)
Long-term incentive as a % of maximum
opportunity
2016(1) Albert Ellis £651,872 48.2% Nil
2015 Albert Ellis £580,883 32.9% Nil
2014 Albert Ellis £672,750 70.0% n/a
2013 Albert Ellis £725,332 88.6% n/a
2012 Albert Ellis £724,204 100.0% n/a
2011(2) Albert Ellis £472,321 55.0% Nil
2010 Albert Ellis £501,471 91.0% n/a
Notes 1. 169,903 options were issued in 2012 under the CSOP. The performance period for these options was extended by one
year at the discretion of the Remuneration Committee in accordance with the rules of the CSOP. The options with the extended performance period did not meet the performance criterion on 31 January 2016 and therefore lapsed. 124,822 options were issued in 2013 under the CSOP and were subject to a three-year performance period. The options failed to meet the performance criterion at 31 January 2016 and therefore lapsed.
2. 250,000 options were issued in 2008 under the CSOP and were subject to a three-year performance condition. The options failed to vest at the
end of the 2011 financial year as the performance criterion was not met.
Percentage change in the Chief Executive’s remunerationThe table below compares the percentage increase in the Chief Executive’s pay (including salary and fees, taxable benefits and annual bonus) with the wider employee population.
Salary Taxable benefits Bonus Total
2016 2015%
change 2016 2015%
change 2016 2015%
change 2016 2015%
changeChief Executive (£’000)
384 376 2% 25 25 0% 185 124 49% 594 525 13%
Total employee basic pay (£’000)
44,496 42,787 4% 1,731 1,665 4% 14,423 12,629 14% 60,650 57,081 6 %
Number of employees
920 865 6% 920 865 6% 920 865 6% 920 865 6%
Average employee pay (£’000)
48 49 (2)% 2 2 0% 16 15 7% 66 66 0%
Relative importance of spend on payThe table below sets out the relative importance of spend on pay in the financial year and previous financial year compared with other disbursements from profit.
Significant distributions
Disbursements from profit in FY2016
Disbursements from profit in FY2015
Percentage change on prior
year
£’000% total
disbursements (1) £’000% total
disbursements (1) %
Dividends paid 2,656 0.4% 2,428 0.4% 0.0%
Executive pay 1,406 0.2% 1,321 0.2% 0.0%
Non-executive pay 246 0.0% 250 0.0% 0.0%
Employee pay 60,879 8.9% 57,415 8.3% 0.6%
Notes 1. “Total disbursements” is the aggregate of cost of sales, operating expenses, finance costs and dividends paid in the year.

HARVEY NASH GROUP PLC REMUNERATION REPORT / 51
Statement of implementation of remuneration policy in the following financial year Executive Directors
SalaryThe base salaries for the 2017 financial year are set out below.
Executive Director 2016 2017 % change
Albert Ellis £384,048 £388,657 1.2%
Simon Wassall £257,861 £260,955 1.2%
Richard Ashcroft £192,024 £194,328 1.2%
The increase to base salaries of 1.2%, effective 1 February 2016, was agreed by the Committee and is in accordance with the cap outlined on page 38, within Part 2 of this Remuneration Report.
Annual bonus A summary of the bonus opportunity for the 2017 financial year and the division of the opportunity between performance measures is set out below.
Bonus opportunity Performance measure weighting (% award) (2)
Threshold(% of salary)
Target (1)
(% of salary) Maximum
(% of salary)Underlying profit
before taxIndividual objectives
nil 60% 100% 70% 30%
Notes 1. The percentage of maximum opportunity awarded for on-target performance is 60% for all Executive Directors.
2. A description of the performance measures is provided on page 39 within Part 2 of this Remuneration Report and discussed further on page 35 within Part 1 of this Remuneration Report.
Performance Share Plan (“PSP”)Details of the maximum long-term incentive awards for Executive Directors along with the performance measures and targets for the awards to be made in the 2017 financial year are set out below.
Type of award
Maximum opportunity(% of salary)
Performance measures Performance target Vesting level
PSP 100%Compound annual growth rate of EPS over a three-year performance period
CAGR of EPS – threshold is 7.5% and maximum 15%
Straight-line vesting between 20% at a CAGR EPS of 7.5% and
100% at 15%
PensionDetails of pension contributions at 15% of base salary for the 2017 financial year are set out below.
Executive Director Pension contribution
Albert Ellis (1) £58,298
Simon Wassall (1) £39,143
Richard Ashcroft (1) £29,149
Notes 1. Where an Executive Director exceeds the prevailing tax-deductible pension allowance, the Company will pay cash in lieu net of
employers’ National Insurance contributions. All Executive Directors are expected to take advantage of this provision for the 2017 financial year.
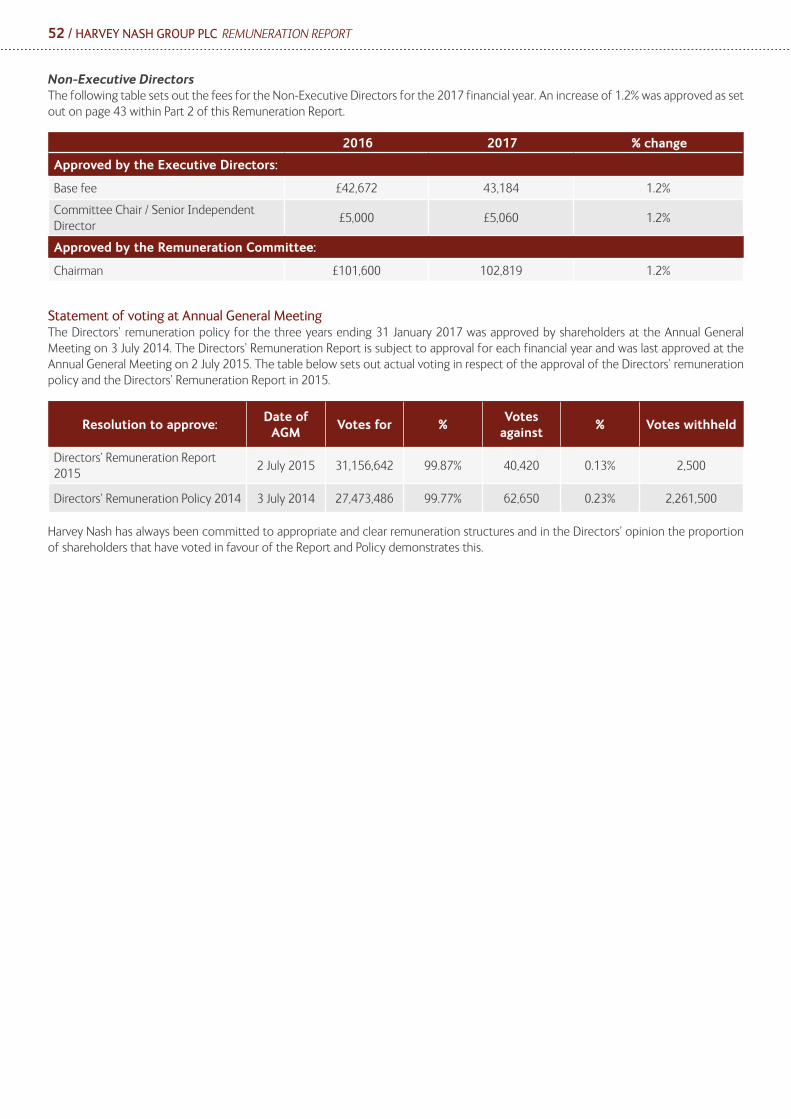
52 / HARVEY NASH GROUP PLC REMUNERATION REPORT
Non-Executive DirectorsThe following table sets out the fees for the Non-Executive Directors for the 2017 financial year. An increase of 1.2% was approved as set out on page 43 within Part 2 of this Remuneration Report.
2016 2017 % change
Approved by the Executive Directors:
Base fee £42,672 43,184 1.2%
Committee Chair / Senior Independent Director
£5,000 £5,060 1.2%
Approved by the Remuneration Committee:
Chairman £101,600 102,819 1.2%
Statement of voting at Annual General MeetingThe Directors’ remuneration policy for the three years ending 31 January 2017 was approved by shareholders at the Annual General Meeting on 3 July 2014. The Directors’ Remuneration Report is subject to approval for each financial year and was last approved at the Annual General Meeting on 2 July 2015. The table below sets out actual voting in respect of the approval of the Directors’ remuneration policy and the Directors’ Remuneration Report in 2015.
Resolution to approve:Date of
AGMVotes for %
Votes against
% Votes withheld
Directors’ Remuneration Report 2015
2 July 2015 31,156,642 99.87% 40,420 0.13% 2,500
Directors’ Remuneration Policy 2014 3 July 2014 27,473,486 99.77% 62,650 0.23% 2,261,500
Harvey Nash has always been committed to appropriate and clear remuneration structures and in the Directors’ opinion the proportion of shareholders that have voted in favour of the Report and Policy demonstrates this.
HARVEY NASH GROUP PLC AUDIT COMMITTEE REPORT / 53
Audit Committee ReportFor the year ended 31 January 2016
I am pleased to present the Audit Committee Report for 2016, the purpose of which is to give shareholders an overview of the operation and scope of the Committee’s function and to report on its activities undertaken over the past year.
Members and meetings The members of the Committee during the year were myself as Chairman, David Bezem and Kevin Thomas. I reported after each Committee meeting to the Board on the principal matters discussed, to ensure that all Directors were kept informed of our work. I also made myself available to any Director who wished to discuss particular items in greater detail.
Our terms of reference require that we meet at least twice a year with the Group’s senior financial management and the External Auditor to review the interim and annual financial statements, the accounting policies of the Group, its internal control procedures and compliance with accounting standards. In addition, we review forthcoming regulatory changes and proposed standards to assess their impact on the Group. Our terms of reference can be found within the Investors section of the Group’s website.
The Audit Committee met three times during the year to 31 January 2016, with full attendance at each meeting. The Chairman of the Board, the Group Finance Director and senior financial management were also often invited and regularly attended.
During the year, we have:
• reviewed the financial statements and financial reporting judgements contained within those statements for the Group and any formal announcements relating to the Group’s financial performance
• reviewed the Group’s internal control system, risk controls and the viability statement
• reviewed the reports and recommendations from the Group’s internal audit function
• made ourselves available to hear any concerns from staff, in line with the Group’s whistleblowing policy
• monitored the independence and objectivity of the External Auditor
• reported to the Board any matters requiring its attention
• reviewed the external audit plan, discussed the findings of the FY16 audit and reviewed the effectiveness of the external audit process
• reviewed the key accounting judgements and estimates related to the financial statements
Annual Report reviewWe have considered whether the Annual Report for the year ended 31 January 2016 is fair, balanced and understandable and whether it provides the necessary information for shareholders to assess the Group’s position and performance, business model and strategy. We focused on the significant issues related to the financial statements, including the presentation of the key accounting judgements and estimates, which are considered below. We also challenged the consistency of accounting policies with those presented in the financial statements and considered whether the words in the Strategic Report reflected the performance of the Group fairly. In forming its conclusion, the Committee also considered the overall governance process in place for the preparation and review of the Annual Report and financial statements. These include:
• management of the overall governance process, which is performed by the Group’s senior financial management, who have appropri-ate skill, experience and qualifications in preparing and delivering such reporting
• the completion of a detailed disclosure template by each component of the Group, the design of which is governed by the Group’s senior financial management
• comprehensive reviews performed at different levels of management to ensure consistency and balance
• the setting of a review timetable well in advance and that permits sufficient time for such review, including any resulting challenge and resolution of matters
• preliminary reviews of the draft Annual Report by the Group Board.
Overall, we considered that as a whole the Annual Report is fair, balanced and understandable.
Significant issues related to the financial statementsThe Audit Committee pays particular attention to significant issues in relation to the financial statements and how they are addressed. The significant issues are important by virtue of their impact on the Group’s results and the remuneration of senior management.
The following significant issues, including critical accounting judgements and estimates, were considered by the Committee. These issues are further described within note 4 to the consolidated financial statements.
Impairment of goodwillThe Committee considered the carrying value of goodwill by reviewing an impairment test report prepared by management. The report outlined the value in use calculated for each of the Group’s cash-generating units. It was noted that the assumptions applied were
54 / HARVEY NASH GROUP PLC AUDIT COMMITTEE REPORT
consistent with the long-term strategic plan approved by the Board. The Committee also challenged the audit work undertaken to assess those assumptions.
The Committee was satisfied that the assumptions applied were appropriate, sufficiently disclosed within the notes to the financial statements, and the carrying value of goodwill supportable.
Revenue recognitionJudgement applied in respect of recognition of revenue is significant in two key areas: cut-off and presentation of temporary recruitment fees and cumulative revenue generated by fixed price contract work. The revenue generated by the latter is recognised on a percentage completion basis.
The Committee discussed and reviewed these areas with management before concluding that the Group’s revenue for the year has been appropriately recognised.
Bad and doubtful debtsRecoverability of trade receivables and accrued income is a key area of focus given the material nature of these balances and the working capital needs of the Group. The debt profile of the Group covers a high volume of balances from a considerable number of customers. Management must therefore apply judgement in determining the amount of provision required for possible non-collection of bad or doubtful debts. This is performed on a case-by-case basis across the Group taking into account differences between countries and service lines.
The Committee assessed the appropriateness of the provisioning by considering the level and ageing of debtors and accrued income, the consistency of provisioning assumptions year-on-year and past experience of bad debt exposure. The Committee concluded that the level of provisioning and carrying value of trade receivables and accrued income is appropriate.
Disposal of subsidiariesDuring the financial year, the Group disposed of its German telecommunications outsourcing business Nash Technologies GmbH and its two fully owned subsidiaries, Nash Technologies Stuttgart GmbH and Nash Innovations GmbH (“NT Group”). The NT Group was involved in software development of a wireless solution for the automotive and rail sectors with the disposal allowing for refocus on the Group’s core recruitment services. Management prepared an accounting position paper on the disposal that was presented to the Committee for their review. The Committee discussed and reviewed the disposal accounting with management before concluding this had been appropriately recognised and disclosed.
External auditThe Committee undertook a full tender of the external audit contract following the announcement of the 2014 year-end results. Deloitte LLP was appointed as the Group’s External Auditor at the Annual General Meeting on 2 July 2015 effective for the year ended 31 January 2016. The Committee has considered and recommends to the Board and shareholders, the reappointment, remuneration and terms of engagement of the External Auditor, Deloitte LLP, for the year ended 31 January 2017. The lead audit partner is subject to mandatory rotation every five years.
Monitoring the effectiveness of the external auditFollowing their first year of tenure, we assessed the effectiveness and quality of the external audit provided by Deloitte. The Committee sought feedback from management across the Group and challenged Deloitte on its risk assessment during the audit planning process and subsequent reporting thereof. The Committee members also made themselves available to hold private discussions with Deloitte regarding the quality of the external audit process. Based on this evidence, we are satisfied with the efficiency and effectiveness of the external audit process.
The Committee is required to monitor the independence and objectivity of Deloitte as External Auditor. Representation was reconfirmed by Deloitte and the external audit partner at the commencement of the planning process. We shall continue to monitor the independence and objectivity of Deloitte, which extends to the provision of non-audit services.
Provision of non-audit servicesThe Audit Committee has a policy that governs the extent of non-audit services provided by the External Auditor. This requires a competitive tendering process for significant non-audit services other than routine tax and compliance services, and precludes the External Auditor from providing certain services such as valuation work or the provision of accounting services.
In addition, we have set a limit on the value of non-audit services that may be provided by the External Auditor, being 30% of the audit fee, without prior consideration and written authorisation by the Audit Committee. An analysis of the fees paid to Deloitte LLP can be found in note 7 to the consolidated financial statements.
HARVEY NASH GROUP PLC AUDIT COMMITTEE REPORT / 55
Internal auditThe Committee is responsible for the oversight and monitoring of the Group’s internal audit function. This includes setting the scope of the annual internal audit plan, review of internal audit reports, consideration of findings and identification of issues for further investigation and reassessment of risk. We also review the resources and effectiveness of the function. We are satisfied with the effectiveness of the internal audit function.
We approved the internal audit plan for the year. The scope of the plan was focused on key risk areas identified by the Committee, both financial and commercial.
The findings of two internal audit reviews were reported to us this year, covering our operations in the Netherlands and the Nordic region. Additionally, follow-up reviews were performed at two previously audited operations, Belgium and Talent-IT. While areas for improvement were identified, no significant weaknesses were highlighted.
Internal controls and risk managementThe Board is responsible for the Group’s systems of internal control including financial controls. The Audit Committee has robustly assessed the effectiveness of the internal controls in mitigating the principal risks faced by the Group. These have been designed to manage rather than eliminate the risk of failure to meet business objectives. The systems of internal control can only provide reasonable, not absolute, assurance against material misstatement or loss.
The Board has an ongoing process to identify, evaluate and manage the principal risks faced by the Group, details of which can be found on pages 15 to 17. This was in place throughout the financial year and up to the date of approval of the Annual Report and financial statements. This process is regularly reviewed by the Board in accordance with the FRC Internal Control Revised Guidance for Directors. The Board reviews annually the effectiveness of the risk management and internal control systems. No significant failings or weaknesses were identified.
WhistleblowingThe Audit Committee provides a facility for employees to raise issues, which may be disclosed confidentially if requested. An independent person is assigned to promptly investigate any matters raised, with findings reported to the appropriate management team and escalated to the Audit Committee and the Group’s internal audit function as appropriate. Any necessary corrective action or follow-up review is undertaken on a timely basis.
The Audit Committee reviews the whistleblowing policy and arrangements in place annually.
Audit Committee effectivenessThe Committee considered our effectiveness in discharging our duties throughout the financial year. We assessed the work we undertook during the financial year, within the context of our terms of reference and latest best practice. In conjunction with the Board effectiveness review referred to on page 29, we concluded that our performance against these criteria remained effective.
Ian DaviesAudit Committee Chairman
56 / HARVEY NASH GROUP PLC STATEMENT OF DIRECTORS’ RESPONSIBILITIES
Statement of Directors’ Responsibilities in Respect of the Annual ReportFor the year ended 31 January 2016
The Directors are responsible for preparing the Annual Report and the financial statements in accordance with applicable law and regulations.
Company law requires the Directors to prepare financial statements for each financial year. Under that law the Directors are required to prepare the Group financial statements in accordance with International Financial Reporting Standards (IFRSs) as adopted by the European Union and Article 4 of the IAS Regulation and have elected to prepare the parent Company financial statements in accordance with United Kingdom Generally Accepted Accounting Practice (United Kingdom Accounting Standards and applicable law) including FRS 101 Reduced Disclosure Framework. Under company law the Directors must not approve the accounts unless they are satisfied that they give a true and fair view of the state of affairs of the Company and of the profit or loss of the Company for that period.
In preparing the parent Company financial statements, the Directors are required to:
• select suitable accounting policies and then apply them consistently
• make judgements and accounting estimates that are reasonable and prudent
• state whether applicable UK Accounting Standards have been followed, subject to any material departures disclosed and explained in the financial statements
• prepare the financial statements on the going concern basis unless it is inappropriate to presume that the Company will continue in business
In preparing the Group financial statements, International Accounting Standard 1 requires that Directors:
• properly select and apply accounting policies
• present information, including accounting policies, in a manner that provides relevant, reliable, comparable and understandable infor-mation
• provide additional disclosures when compliance with the specific requirements in IFRSs are insufficient to enable users to understand the impact of particular transactions, other events and conditions on the entity’s financial position and financial performance
• make an assessment of the Company’s ability to continue as a going concern
The Directors are responsible for keeping adequate accounting records that are sufficient to show and explain the Company’s transactions and disclose with reasonable accuracy at any time the financial position of the Company and enable them to ensure that the financial statements comply with the Companies Act 2006. They are also responsible for safeguarding the assets of the Company and hence for taking reasonable steps for the prevention and detection of fraud and other irregularities.
The Directors are responsible for the maintenance and integrity of the corporate and financial information included on the Company’s website. Legislation in the UK governing the preparation and dissemination of financial statements may differ from legislation in other jurisdictions.
Responsibility statementWe confirm that to the best of our knowledge:
• the financial statements, prepared in accordance with the relevant financial reporting framework, give a true and fair view of the assets, liabilities, financial position and profit of the Company and the undertakings included in the consolidation taken as a whole
• the Strategic Report includes a fair review of the development and performance of the business and the position of the Company and the undertakings included in the consolidation taken as a whole, together with a description of the principal risks and uncertainties that they face
• the Annual Report and financial statements, taken as a whole, are fair, balanced and understandable and provide the information nec-essary for shareholders to assess the Company’s performance, business model and strategy
This responsibility statement was approved by the Board of Directors on 27 April 2016 and is signed on its behalf by:
Richard AshcroftGroup Finance Director
HARVEY NASH GROUP PLC INDEPENDENT AUDITOR’S REPORT / 57
Independent Auditor’s Report to the Members of Harvey Nash Group PLCOpinion on financial statements of Harvey Nash Group plc
In our opinion:
• the financial statements give a true and fair view of the state of the Group’s and of the Parent Company’s affairs as at 31 January 2016 and of the Group’s loss for the year then ended;
• the group financial statements have been properly prepared in accordance with International Financial Reporting Standards (IFRSs) as adopted by the European Union;
• the parent company financial statements have been properly prepared in accordance with United Kingdom Generally Accepted Accounting Practice, including FRS 101 “Reduced Disclosure Framework”; and
• the financial statements have been prepared in accordance with the requirements of the Companies Act 2006 and, as regards the group financial statements, Article 4 of the IAS Regulation.
The financial statements comprise the Consolidated Income Statement, the Consolidated Statement of Comprehensive Income, the Consolidated and Parent Company Balance Sheets, the Consolidated Cash Flow Statement, the Consolidated and Parent Company Statements of Changes in Equity, the related notes 1 to 32 to the Consolidated Financial Statements and the related notes 1 to 14 to the Parent Company Financial Statements. The financial reporting framework that has been applied in the preparation of the group financial statements is applicable law and IFRSs as adopted by the European Union. The financial reporting framework that has been applied in the preparation of the Parent Company financial statements is applicable law and United Kingdom Accounting Standards (United Kingdom Generally Accepted Accounting Practice), including FRS 101 “Reduced Disclosure Framework”.
Going concern and the Directors’ assessment of the principal risks that would threaten the solvency or liquidity of the group
As required by the Listing Rules we have reviewed the Directors’ statement regarding the appropriateness of the going concern basis of accounting contained within note 2(b) to the financial statements and the Directors’ statement on the longer-term viability of the group contained within the Principal risks section of the Strategic Report on page 17.
We have nothing material to add or draw attention to in relation to:
• the Directors’ confirmation on page 10 that they have carried out a robust assessment of the principal risks facing the group, including those that would threaten its business model, future performance, solvency or liquidity;
• the disclosures on pages 15 to 17 that describe those risks and explain how they are being managed or mitigated;
• the Directors’ statement in 2(b) to the financial statements about whether they considered it appropriate to adopt the going concern basis of accounting in preparing them and their identification of any material uncertainties to the group’s ability to continue to do so over a period of at least twelve months from the date of approval of the financial statements;
• the Director’s explanation on page 17 as to how they have assessed the prospects of the group, over what period they have done so and why they consider that period to be appropriate, and their statement as to whether they have a reasonable expectation that the group will be able to continue in operation and meet its liabilities as they fall due over the period of their assessment, including any related disclosures drawing attention to any necessary qualifications or assumptions.
We agreed with the Directors’ adoption of the going concern basis of accounting and we did not identify any such material uncertainties. However, because not all future events or conditions can be predicted, this statement is not a guarantee as to the group’s ability to continue as a going concern.
Independence We are required to comply with the Financial Reporting Council’s Ethical Standards for Auditors and we confirm that we are independent of the group and we have fulfilled our other ethical responsibilities in accordance with those standards. We also confirm we have not provided any of the prohibited non-audit services referred to in those standards.
Our assessment of risks of material misstatement
The assessed risks of material misstatement described below are those that had the greatest effect on our audit strategy, the allocation of resources in the audit and directing the efforts of the engagement team.
As part of our audit of the Group, in addition to substantive tests, we also evaluate the design and implementation of internal controls over financial reporting in each of the risk areas.

58 / HARVEY NASH GROUP PLC INDEPENDENT AUDITOR’S REPORT
Risk How the scope of our audit responded to the riskDebtor and accrued income recoverability
Refer to page 53 (Audit Committee Report), page 74 (critical accounting judgements and key sources of estimation uncertainty) and note 13, page 83 (financial statement disclosures)
As per note 13 to the consolidated financial statements, trade receivables were £107.0m as at 31 January 2016 (2015: £80.4m) and the provision applied to this was £0.7m (2015: £0.4m). The provisioning policy in relation to debtors is detailed in note 2(k) to the financial statements. Accrued income and prepayments at the year-end date was £18.6m (2015: £36.6m).
The recoverability of trade debtors, accrued income and the level of provisions for bad debts are considered to be a significant risk due to the size of these balances and the importance of cash collection as part of the working capital management of the business. Whilst historically the Group has not recorded a material level of bad debt write-offs, judgement is required to estimate the level of bad debt provision based on the individual circumstances of customers.
We have:
• challenged management regarding the level and ageing of debtors and accrued income, by assessing recoverability with reference to cash received in respect of debtors and cash received and billings raised against accrued income;
• in selected locations, issued and received debtors confirmations from the third party debtors selected for testing;
• challenged the application of the provisioning approach with reference to the post year-end developments for aged debt throughout the Group;
• considered the Group’s experience of bad debt exposure with reference to the individual counterparty risk, the level of provision held by other recruitment businesses and the general economic environment in each jurisdiction; and
• critically assessed the recoverability of overdue unprovided debt and aged accrued income with reference to historical levels of bad debt expense and the credit profile of counterparties.
Goodwill impairment
Refer to pages 53 and 54 (Audit Committee Report), page 73 (critical accounting judgements and key sources of estimation uncertainty) and note 11, page 82 (financial statement disclosures)
As per note 11 to the consolidated financial statements, the total value of goodwill held by the Group at 31 January 2016 is £49.7m (2015: £48.7m). This goodwill has arisen based on historical acquisitions and the increase in the goodwill held in the year is solely due to the movement in foreign exchange rates.
The assessment of the carrying value of goodwill, as described in note 11, involves considerable judgement due to the challenges in accurately forecasting future cash flows given the market environment for global recruitment businesses. Key assumptions in management’s analysis include the identification of cash generating units, short- and long-term growth rates and the discount rate applied to the future cash flows.
We tested management’s assumptions used in their impairment assessment of the Group’s goodwill in the Consolidated Balance Sheet. Our procedures included:
• assessing the identification of appropriate cash generating units;
• assessing the short-term cash flow projections against recent performance, historical forecasting accuracy and comparing the forecasts to external recruitment industry sources of data;
• comparing the long-term forecasts against long-term economic growth rates from external data for each relevant jurisdiction;
• comparing the discount rate applied against a recruitment industry comparator group as well as involving our internal valuation specialists to assess the key components of the discount rate calculation;
• evaluating the reasonableness of, and recalculating, the sensitivity assessment applied by management;
• performing further sensitivity analysis of our own on the cash generating units with the lowest headroom in the impairment model; and
• checking the arithmetical accuracy of the impairment model in the calculation of the recoverable amount.
In addition we have critically assessed the disclosures provided in note 11 against the requirements of IAS 36 Impairment of assets.

HARVEY NASH GROUP PLC INDEPENDENT AUDITOR’S REPORT / 59
Capitalisation of intangible fixed assets
Refer to page 54 (Audit Committee Report) and page 73 (critical accounting judgements and key sources of estimation uncertainty)
The Group disposed of the Nash Technologies business in Germany during the year. Prior to the disposal Nash Technologies capitalised costs relating to the development of software projects as intangible assets. There is significant judgement in determining whether this expenditure meets the strict capitalisation criteria set out in IAS 38 Intangible Assets.
This has continued to be recognised as a risk of material misstatement, even though Nash Technologies was disposed of in the year, because if such costs were inappropriately capitalised they should have been recognised as an item of underlying operating expenditure in the Consolidated Income Statement rather than as part of the loss on disposal attributed to discontinued operations.
The carrying value of the intangible assets disposed of at the date of disposal was £3.8m (£1.7m was recognised on the Consolidated Balance Sheet as at 31 January 2015), and details can be found in note 32 of the financial statements.
In respect of capitalised costs relating to the development of software projects prior to the disposal of Nash Technologies, we have:
• gained an understanding of the projects that were in the process of development; and
• selected a sample of development costs that have been capitalised, assessed the nature of these costs, traced the costs to supporting invoice or contract and assessed the appropriateness of capitalisation against the requirements of IAS 38.
Revenue recognition
Refer to page 54 (Audit Committee Report), page 73 (critical accounting judgements and key sources of estimation uncertainty) and note 5, page 74 (financial statement disclosures)
The key risks identified in respect of revenue recognition are:
• the valuation and completeness of accrued revenue in respect of contractor arrangements. Contractor revenue is the main revenue stream of the Group and significant judgement is required in the estimation of accrued revenue recognised in respect of missing and submitted but not approved timesheets at the period end; and
• the revenue derived from software development contracts. The revenue for these bespoke projects is recognised on the percentage completion basis. There is significant judgement in estimating the level of completion in relation to these projects and therefore the revenue that should be recognised. This revenue primarily relates to the Nash Technologies business. This continues to be a risk despite the disposal of the business as the revenue in Nash Technologies continues to be presented as part of the Consolidated Income Statement up to the date of disposal.
In relation to the valuation of contractor revenue accrued at the period end we have assessed the appropriateness of the proportion of revenue recognised from missing and submitted but not approved timesheets by:
• understanding and challenging management’s rationale for the proportion of revenue accrued by tracing sample items to evidence of submission and customer approval post period end;
• considering the appropriateness of the estimates made by management in previous periods with reference to the subsequent receipt or approval of timesheets accrued for at the prior year reporting date; and
• mechanically recalculating the accrued income estimate made by management.
• In relation to the revenue derived from software development we have obtained individual contracts and assessed the stage of completion at the date of disposal. We have assessed this by:
• discussing the progress of individual projects with the Project Managers responsible for their completion;
• obtaining evidence of the forecast costs to complete and reviewing this against historical performance;
• reviewing the sales projections prepared by management in relation to each project; and
• auditing the costs that have been incurred in the development of each project.

60 / HARVEY NASH GROUP PLC INDEPENDENT AUDITOR’S REPORT
Accounting for disposals and discontinued operations
Refer to page 54 (Audit Committee Report), page 73 (critical accounting judgements and key sources of estimation uncertainty) and note 32, page 92 (financial statement disclosures)
The Group disposed of the Nash Technologies business in Germany in December 2015. The impact of this disposal has been presented as a loss from discontinued operations of £14.0 million in the Consolidated Income Statement. The Group has also recognised the closure of the Oil and Gas business in the UK as a discontinued operation with a loss of £0.4 million recorded.
There is judgement involved in the recognition of the loss on disposal, the costs associated with the disposal/closure as well as in the consideration of the appropriateness of presentation as discontinued operations in line with IFRS 5, Non-current assets held for sale and discontinued operations, within note 32 to the financial statements.
The audit procedures we have completed in respect of this risk of material misstatement include:
• agreeing the terms of the transaction to underlying documentation including vouching the consideration to the Sale Purchase Agreement (“SPA”);
• assessing the carrying value of the net assets disposed of to ensure that the recorded loss on disposal for Nash Technologies and UK Oil and Gas business is accurate;
• reviewing management’s assessment of the fair value of the earn-out arrangement included in the SPA and the recoverability of the loan that was provided to the disposed of entity;
• recalculating the loss on disposal; and
• agreeing a sample of disposal related costs to supporting documentation.
We also considered the appropriateness of the recognition as discontinued operations for both Nash Technologies and the UK Oil and Gas business and the associated disclosures in line with IFRS 5.
Accounting for disposals and discontinued operations is a new risk for the period under audit.
In the 2015 Audit Report we defined an additional element within the revenue recognition risk of material misstatement. This related to the presentation of temporary contractual arrangements where Harvey Nash acts as a principal, and the revenue and directly associated costs are recognised and presented on a gross basis as opposed to a net basis. This was an assessment made in our first year of audit and as such it has not been included as a component of the risk of material misstatement for the year ending 31 January 2016. Whilst this is performed for any new contracts this is not considered to be a significant area of risk for the current period.
These matters were addressed in the context of our audit of the financial statements as a whole, and in forming our opinion thereon, and we do not provide a separate opinion on these matters.
Our application of materiality
We define materiality as the magnitude of misstatement in the financial statements that makes it probable that the economic decisions of a reasonably knowledgeable person would be changed or influenced. We use materiality both in planning the scope of our audit work and in evaluating the results of our work.
We determined materiality for the Group to be £505,000 (2015: £490,000), which equates to 5% (2015: 5%) of continuing operations profit before tax and non-recurring items. It is also below 1% (2015: 1%) of both revenue and equity. The increase in materiality is directly attributable to the increased underlying pre-tax profit for the Group. Pre-tax profit, excluding non-recurring items and discontinued operations, has been chosen for the basis for materiality as this is the measure by which stakeholders and the market assess the wider performance of the entity. The non-recurring items are one-off restructuring costs relating to the strategic restructuring of the Group’s European operations and thus are excluded when determining materiality.
We agreed with the Audit Committee that we would report to the Committee all audit differences in excess of £45,000 (2015: £45,000), as well as differences below that threshold that, in our view, warranted reporting on qualitative grounds. We also report to the Audit Committee on disclosure matters that we identified when assessing the overall presentation of the financial statements.
HARVEY NASH GROUP PLC INDEPENDENT AUDITOR’S REPORT / 61
An overview of the scope of our audit
Our Group audit was scoped by obtaining an understanding of the Group and its environment, including Group-wide controls, and assessing the risks of material misstatement at the Group level. Based on that assessment there were various different levels of procedures applied to entities depending if they were subject to a full scope audit, specified audit procedures on specific financial statement line items or statutory audits only. We determined which components are subject to which scope based upon the financial significance and the specific account balances within each component. We performed full scope audit procedures in the UK, Belgium, the Netherlands and in the USA as we determined these components to be financial significant to the Group. In addition we performed audit procedures in Germany focussing on specific financial statement lines items associated with the Nash Technologies business. Our audit work at each location that was either full or limited scope for Group reporting was executed at levels of materiality applicable to each individual entity which were lower than Group materiality and ranged from £101,000 to £353,500 (2015: £98,000 to £345,000).
The components that were subject to full scope or limited scope audit procedures represented 88% (2015: 89%) of the Group’s revenue and 85% (2015: 86%) of the Group’s profit before tax attributed to continuing operations.
The Group audit team established a rotation programme of planned visits designed so that a senior member of the Group audit team visits all components that are full scope or subject to an audit of specific financial statement line procedures at least every two years. In the current year the Group audit team visited the UK, USA and the Netherlands. In 2015, in addition to these components we also visited Belgium, Germany and Vietnam. For those components that are not full scope or subject to specified procedures the audits are conducted in line with the Group timetable and a member of the Group team attends the concluding meetings for these components.
Each component audit team is included in our detailed team briefing and the Group audit team participates in the component auditor risk assessment, reviews the documentation of the findings from their work and attends the component audit close meetings.
At the parent entity level we also tested the consolidation process and carried out analytical procedures to confirm our conclusion that there were no significant risks of material misstatement of the aggregated financial information of the remaining components not subject to audit or audit of specified account balances.
Opinion on other matters prescribed by the Companies Act 2006
In our opinion:
• the part of the Directors’ Remuneration Report to be audited has been properly prepared in accordance with the Companies Act 2006; and
• the information given in the Strategic Report and the Directors’ Report for the financial year for which the financial statements are prepared is consistent with the financial statements.
Matters on which we are required to report by exception
Adequacy of explanations received and accounting records
Under the Companies Act 2006 we are required to report to you if, in our opinion:
• we have not received all the information and explanations we require for our audit; or
• adequate accounting records have not been kept by the parent company, or returns adequate for our audit have not been received from branches not visited by us; or
• the Parent Company financial statements are not in agreement with the accounting records and returns.
We have nothing to report in respect of these matters.
Directors’ remuneration Under the Companies Act 2006 we are also required to report if in our opinion certain disclosures of Directors’ remuneration have not been made or the part of the Directors’ Remuneration Report to be audited is not in agreement with the accounting records and returns. We have nothing to report arising from these matters.
Corporate Governance Statement
Under the Listing Rules we are also required to review part of the Corporate Governance Statement relating to the company’s compliance with certain provisions of the UK Corporate Governance Code. We have nothing to report arising from our review.

62 / HARVEY NASH GROUP PLC INDEPENDENT AUDITOR’S REPORT
Our duty to read other information in the Annual Report
Under International Standards on Auditing (UK and Ireland), we are required to report to you if, in our opinion, information in the annual report is:
• materially inconsistent with the information in the audited financial statements; or
• apparently materially incorrect based on, or materially inconsistent with, our knowledge of the group acquired in the course of performing our audit; or
• otherwise misleading.
In particular, we are required to consider whether we have identified any inconsistencies between our knowledge acquired during the audit and the Directors’ statement that they consider the annual report is fair, balanced and understandable and whether the annual report appropriately discloses those matters that we communicated to the audit committee which we consider should have been disclosed. We confirm that we have not identified any such inconsistencies or misleading statements.
Respective responsibilities of Directors and auditor
As explained more fully in the Directors’ Responsibilities Statement, the Directors are responsible for the preparation of the financial statements and for being satisfied that they give a true and fair view. Our responsibility is to audit and express an opinion on the financial statements in accordance with applicable law and International Standards on Auditing (UK and Ireland). We also comply with International Standard on Quality Control 1 (UK and Ireland). Our audit methodology and tools aim to ensure that our quality control procedures are effective, understood and applied. Our quality controls and systems include our dedicated professional standards review team and independent partner reviews.
This report is made solely to the company’s members, as a body, in accordance with Chapter 3 of Part 16 of the Companies Act 2006. Our audit work has been undertaken so that we might state to the company’s members those matters we are required to state to them in an auditor’s report and for no other purpose. To the fullest extent permitted by law, we do not accept or assume responsibility to anyone other than the company and the company’s members as a body, for our audit work, for this report, or for the opinions we have formed.
Scope of the audit of the financial statements
An audit involves obtaining evidence about the amounts and disclosures in the financial statements sufficient to give reasonable assurance that the financial statements are free from material misstatement, whether caused by fraud or error. This includes an assessment of: whether the accounting policies are appropriate to the group’s and the parent company’s circumstances and have been consistently applied and adequately disclosed; the reasonableness of significant accounting estimates made by the Directors; and the overall presentation of the financial statements. In addition, we read all the financial and non-financial information in the annual report to identify material inconsistencies with the audited financial statements and to identify any information that is apparently materially incorrect based on, or materially inconsistent with, the knowledge acquired by us in the course of performing the audit. If we become aware of any apparent material misstatements or inconsistencies we consider the implications for our report.
Sukhbinder Kooner Senior Statutory Auditorfor and on behalf of Deloitte LLPChartered Accountants and Statutory AuditorLondon, United Kingdom27 April 2016

HARVEY NASH GROUP PLC FINANCIAL STATEMENTS / 63
Consolidated Income Statementfor the year ended 31 January 2016
Notes
2016
£ ’000
2015
£ ’000
Continuing operations
Revenue 5 676,524 677,920
Cost of sales (586,236) (593,055)
Gross profit 5 90,288 84,865
Administrative expenses (80,136) (75,108)
Operating profit before non-recurring items 5,7 10,152 9,757
Non-recurring items 30 (228) (699)
Operating profit 5,7 9,924 9,058
Finance costs 6 (849) (554)
Profit before tax 9,075 8,504
Income tax expense 8 (2,240) (2,311)
Profit for the year from continuing operations 6,835 6,193
Discontinued operations
Loss from discontinued operations 32 (14,439) (929)
(Loss) / Profit for the year attributable to owners of the parent Company (7,604) 5,264
Earnings per share from continuing operations
- Basic 9 9.42p 8.51p
- Diluted 9 9.38p 8.47p
Adjusted(1) earnings per share from continuing operations
- Basic 9 9.73p 9.42p
- Diluted 9 9.70p 9.37p
Earnings per share from continuing and discontinued operations
- Basic 9 (10.48)p 7.24p
- Diluted 9 (10.48)p 7.20p
Consolidated Statement of Comprehensive Incomefor the year ended 31 January 2016
2016
£ ’000
2015
£ ’000
(Loss) / profit for the year (7,604) 5,264
Foreign currency translation differences(2) (220) (2,577)
Other comprehensive (loss) / income for the year (220) (2,577)
Total comprehensive (loss) / income for the year attributable to owners of the parent (7,824) 2,687
(1) Excludes the impact of non-recurring items. (2) These differences may be recycled into the Consolidated Income Statement if specific conditions are met.

64 / HARVEY NASH GROUP PLC FINANCIAL STATEMENTS
Consolidated Balance Sheetas at 31 January 2016
Notes 2016
£ ’000
2015
£ ’000
ASSETS
Non-current assets
Property, plant and equipment 10 3,583 3,894
Intangible assets 11 50,688 51,402
Investments 26 238 235
Deferred tax assets 8 2,343 2,757
Loans receivable 32 1,755 -
58,607 58,288
Current assets
Cash and cash equivalents 12 18,506 18,996
Trade and other receivables 13 127,331 118,689
145,837 137,685
Total assets 204,444 195,973
LIABILITIES
Current liabilities
Trade and other payables 14 (129,728) (108,765)
Current income tax liabilities (1,486) (2,569)
Borrowings 27 (18,336) (16,885)
Deferred consideration 26 - (1,968)
Provision for liabilities and charges 29 (145) (414)
(149,695) (130,601)
Net current (liabilities) / assets (3,858) 7,084
Non-current liabilities
Deferred consideration 26 (472) (460)
Deferred tax liabilities 8 (159) (314)
(631) (774)
Total liabilities (150,326) (131,375)
Net assets 54,118 64,598
EQUITY
Capital and reserves attributable to equity shareholders
Ordinary shares 17 3,673 3,673
Share premium 18 8,425 8,425
Fair value and other reserves 19 15,079 15,079
Own shares held 20 (1,032) (1,032)
Cumulative translation reserve 1,971 2,191
Retained earnings 21 26,002 36,262
Total shareholders’ funds and total equity 54,118 64,598
The consolidated financial statements (Parent Company Number: 03320790) on pages 63 to 94 were approved by the Board and authorised for issue on 27 April 2016 and signed on its behalf by:
Julie Baddeley Richard AshcroftChairman Group Finance Director

HARVEY NASH GROUP PLC FINANCIAL STATEMENTS / 65
Consolidated Statement of Changes in Equityfor the year ended 31 January 2016
Share capital
Share premium
Fair value and
other reserves
Own shares
held
Cumulative translation
reserve
Retained
earnings
Total
£’000 £’000 £’000 £’000 £’000 £’000 £’000
1 February 2014 3,673 8,425 15,079 (172) 4,768 33,695 65,468
Profit for the year - - - - - 5,264 5,264
Currency translation adjustments - - - - (2,577) - (2,577)
Total comprehensive (expense) / income for the year
- - - - (2,577) 5,264 2,687
Employee share option and bonus plan*
- - - 706 - (269) 437
Own shares purchased* (note 20) - - - (1,566) - - (1,566)
Dividends paid (note 28) - - - - - (2,428) (2,428)
31 January 2015 3,673 8,425 15,079 (1,032) 2,191 36,262 64,598
1 February 2015 3,673 8,425 15,079 (1,032) 2,191 36,262 64,598
Loss for the year - - - - - (7,604) (7,604)
Currency translation adjustments - - - - (220) - (220)
Total comprehensive loss and expense for the year
- - - - (220) (7,604) (7,824)
Employee share option and bonus plan
- - - - - - -
Own shares purchased - - - - - - -
Dividends paid (note 28) - - - - - (2,656) (2,656)
31 January 2016 3,673 8,425 15,079 (1,032) 1,971 26,002 54,118
* The movements in the own shares held reserve relate to shares awarded from and purchased by the Employee Benefit Trust.
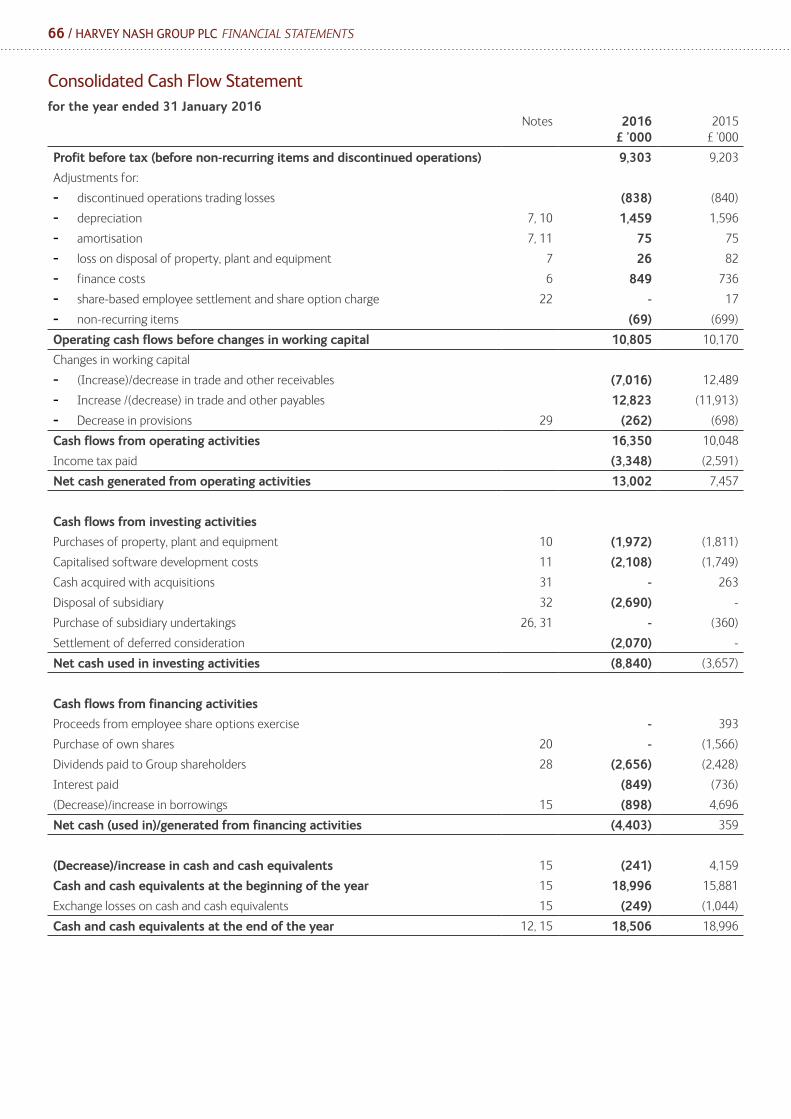
66 / HARVEY NASH GROUP PLC FINANCIAL STATEMENTS
Consolidated Cash Flow Statementfor the year ended 31 January 2016
Notes 2016£ ’000
2015£ ’000
Profit before tax (before non-recurring items and discontinued operations) 9,303 9,203
Adjustments for:
- discontinued operations trading losses (838) (840)
- depreciation 7, 10 1,459 1,596
- amortisation 7, 11 75 75
- loss on disposal of property, plant and equipment 7 26 82
- finance costs 6 849 736
- share-based employee settlement and share option charge 22 - 17
- non-recurring items (69) (699)
Operating cash flows before changes in working capital 10,805 10,170
Changes in working capital
- (Increase)/decrease in trade and other receivables (7,016) 12,489
- Increase /(decrease) in trade and other payables 12,823 (11,913)
- Decrease in provisions 29 (262) (698)
Cash flows from operating activities 16,350 10,048
Income tax paid (3,348) (2,591)
Net cash generated from operating activities 13,002 7,457
Cash flows from investing activities
Purchases of property, plant and equipment 10 (1,972) (1,811)
Capitalised software development costs 11 (2,108) (1,749)
Cash acquired with acquisitions 31 - 263
Disposal of subsidiary 32 (2,690) -
Purchase of subsidiary undertakings 26, 31 - (360)
Settlement of deferred consideration (2,070) -
Net cash used in investing activities (8,840) (3,657)
Cash flows from financing activities
Proceeds from employee share options exercise - 393
Purchase of own shares 20 - (1,566)
Dividends paid to Group shareholders 28 (2,656) (2,428)
Interest paid (849) (736)
(Decrease)/increase in borrowings 15 (898) 4,696
Net cash (used in)/generated from financing activities (4,403) 359
(Decrease)/increase in cash and cash equivalents 15 (241) 4,159
Cash and cash equivalents at the beginning of the year 15 18,996 15,881
Exchange losses on cash and cash equivalents 15 (249) (1,044)
Cash and cash equivalents at the end of the year 12, 15 18,506 18,996
HARVEY NASH GROUP PLC FINANCIAL STATEMENTS / 67
Notes to the Consolidated Financial Statements1. General informationHarvey Nash Group PLC (“the Company”) and its subsidiaries (together “the Group”) is a leading provider of specialist recruitment and outsourcing solutions. The Group has offices in the United Kingdom, Europe, United States, Hong Kong, Japan, Singapore, Australia and Vietnam.
The Company is a public listed company incorporated in the United Kingdom. Its registered address is 110 Bishopsgate, London, EC2N 4AY and its listing is on the London Stock Exchange.
2. Accounting policiesThe principal accounting policies adopted in the preparation of these financial statements are set out below. These policies have been consistently applied across the Group in both years presented.
(a) Basis of preparationThe consolidated financial statements of Harvey Nash Group PLC have been prepared in accordance with International Financial Reporting Standards as adopted by the European Union (IFRSs as adopted by the EU), IFRIC interpretations and the Companies Act 2006 applicable to companies reporting under IFRS. The consolidated financial statements have been prepared under the historical cost convention on a going concern basis, as modified by the revaluation of financial assets and financial liabilities (including derivative instruments) at fair value through profit or loss.
The main section of these financial statements presents the financial statements of the Group prepared under International Financial Reporting Standards (IFRS) adopted by the European Union. In line with the relevant accounting standards, the results for the year ended 31 January 2015 have been re-presented to show separately the comparative impact of discontinued operations included in the year ended 31 January 2016. Pages 96 to 100 show the financial statements of the parent Company prepared under Financial Reporting Standard 101 (FRS 101). The Parent Company adopted FRS 101 in the current reporting period in accordance with the FRC revision to the UK Financial Reporting Standards and restated the comparatives which were previously prepared under UK Generally Accepted Accounting Practice (UK GAAP). There were no significant adjustments to either total comprehensive income or equity as a result of the adoption of FRS 101.
(i) New and amended standards, adopted by the GroupIn the current year, the following new and revised Standards and Interpretations have been adopted:• Amendments to IAS 19 Defined Benefit Plans: Employee Contributions
• Annual Improvements to IFRSs 2010–2012 Cycle
• Annual Improvements to IFRSs 2011–2013 Cycle
These changes have no material impact on the consolidated result, financial position or cash flows of the Group.
(ii) New and revised IFRSs in issue but not yet effectiveAt the date of authorisation of these financial statements, the Group has not applied the following new and revised IFRSs that have been issued but are not yet effective and, in some cases, had not yet been adopted by the EU:• IFRS 9 Financial Instruments
• IFRS 15 Revenue from Contracts with Customers
• IFRS 16 Leases
• Amendment to IFRS 11 on Accounting for Acquisitions of Interests in Joint Operations
• Amendments to IAS 16 and IAS 38 Clarifying Acceptable Methods of Depreciation and Amortisation
• Amendments to IAS 1 for the Disclosure Initiative
• Amendment to IAS 27 Separate Financial Statements on Use of Equity Method
• Amendments to IFRS 10 and IAS 28 for Sale or Contribution of Assets between an Investor and its Associate or Joint Venture
• Amendments to IFRS 10, IFRS 12 and IAS 28 Investment Entities: Applying the Consolidation Exemption
• Annual Improvements to IFRSs: 2012–2014 Cycle Amendments to: IFRS 5 Non-Current Assets Held for Sale and Discontinued Opera-tions, IFRS 7 Financial Instruments: Disclosures, IAS 19 Employee Benefits and IAS 34 Interim Financial Reporting
The Group intends to adopt the above in the relevant future accounting periods in which they become mandatory, subject to endorsement by the EU where relevant.
The Directors do not expect that the adoption of the Standards listed above will have a material impact on the financial statements of the Group in future periods, except that IFRS 9 may have an impact on both the measurement and disclosures of financial instruments, IFRS 15 may have an impact on revenue recognition and related disclosures and IFRS 16 will have an impact on the Consolidated Balance Sheet. Beyond the information above, it is not practicable to provide a reasonable estimate of the effect of IFRS 9, IFRS 15 and IFRS 16 until a detailed review has been completed, this will be completed in the year ending 31 January 2017.
68 / HARVEY NASH GROUP PLC FINANCIAL STATEMENTS
(b) Going concernThe Directors have, at the time of approving the financial statements, a reasonable expectation that the Company and the Group have adequate resources to continue in operational existence for the foreseeable future. Thus they continue to adopt the going concern basis of accounting in preparing the financial statements. Further detail is contained in the Corporate Governance Report on page 31.
(c) Basis of preparationThe Group financial statements consolidate the results of the Company and all of its subsidiary undertakings drawn up to 31 January each year and are based on the consistent accounting policies disclosed herein.
Interests acquired in subsidiary undertakings are consolidated from the date on which control passes to the Group. They are deconsolidated from the date on which control ceases. Transactions and balances, including unrealised profits, between Group companies are eliminated on consolidation.
The acquisition method of accounting is used to account for the acquisition of subsidiaries by the Group. The cost of an acquisition is measured as the fair value of the assets given, equity instruments issued and liabilities incurred or assumed at the date of exchange. Costs directly attributable to the acquisition are expensed as incurred. Identifiable assets acquired and liabilities and contingent liabilities assumed in a business combination are measured initially at their fair values at the acquisition date.
When the Group loses control of a subsidiary, the gain or loss on disposal recognised in profit or loss is calculated as the difference between (i) the aggregate of the fair value of the consideration received and the fair value of any retained interest and (ii) the previous carrying amount of the assets (including goodwill), less liabilities of the subsidiary and any non-controlling interests. The costs associated with disposal have also been included in total costs of disposal. All amounts previously recognised in other comprehensive income in relation to that subsidiary are accounted for as if the Group had directly disposed of the related assets or liabilities of the subsidiary (i.e. reclassified to profit or loss or transferred to another category of equity as specified/permitted by applicable IFRSs).
(d) Revenue recognitionRevenue is measured at the fair value of the consideration received or receivable for the supply of services, net of value added tax, rebates and discounts and after eliminating sales within the Group.
The Group derives its revenue in the contract services and interim businesses on a time and materials basis. It is recognised as services are rendered as validated by receipt of a client-approved timesheet or equivalent. Where the Group is acting as a principal, turnover represents amounts billed for the services, inclusive of the remuneration costs of the workers.
For fixed price development work, revenue is recognised on the percentage completion basis, using pre-specified milestones or a client sign-off to trigger revenue recognition and the estimate of profit.
Revenue arising from permanent placements is recognised on acceptance of the candidate or on start date, subject to the contractual agreement. Provision is made for the expected cost of obligations where employees do not work for the specified contractual period.
Executive recruitment and assignment fees are recognised as services are provided, typically in three stages: retainer, shortlist and placement fee. Provision is made for the expected cost of obligations where employees do not work for the specified contractual period.
Revenue anticipated, but not invoiced at the balance sheet date, is accrued on the balance sheet as accrued income. Revenue invoiced but not earned at the balance sheet date is recorded as a liability as deferred income.
(e) InvestmentsInvestments in associated undertakings (“associated companies”) are stated at the amount of the Group’s share of net assets.
(f) Property, plant and equipment Property, plant and equipment is stated at cost less accumulated depreciation and accumulated impairment losses. The cost of property, plant and equipment is their purchase cost together with any incidental costs of acquisition.
Depreciation is calculated so as to write off the cost of the assets (excluding motor vehicles), less their estimated residual values, on a straight-line basis over the expected useful economic lives of the assets concerned. The principal annual rates used for this purpose are:
Leasehold improvements term of the leaseFurniture, fixtures and equipment 5 years Office equipment 5 yearsComputer equipment 3 yearsMotor vehicles 25% reducing balance
HARVEY NASH GROUP PLC FINANCIAL STATEMENTS / 69
The assets’ residual values and useful lives are reviewed and adjusted if appropriate at each balance sheet date. An asset’s carrying amount is written down immediately to its recoverable amount if the asset’s carrying amount is greater. The gain or loss on disposal or retirement of an item of plant, property or equipment is determined as the difference between the sale proceeds and the carrying amount of the asset and is recognised in the income statement.
Property, plant and equipment purchased to deliver outsourcing projects, which have been recharged to clients at cost, remain the legal property of the Group. The cost of the asset is capitalised within current assets and charged to cost of sales over the contract length.
(g) Foreign exchangeItems included in the financial statements of each of the Group’s entities are measured using the currency of the primary economic environment in which the entity operates (the “functional currency”). The consolidated financial statements are presented in sterling which is the Company’s functional and presentational currency.
Transactions in foreign currencies are translated at the rate prevailing at the date of the transaction. Monetary assets and liabilities denominated in foreign currencies in each company are retranslated into the respective functional currency of the entity at the rates of exchange prevailing on the reporting period date.
On consolidation, revenues, costs and cash flows of overseas undertakings are included in the Group income statement at average rates of exchange for the period. Assets and liabilities denominated in foreign currencies are translated into sterling using rates of exchange ruling at the balance sheet date and any differences arising are recognised in equity. When a foreign operation is sold, the cumulative amount previously recognised in equity in respect of that particular foreign operation is recognised in the income statement.
Exchange differences arising from the translation of the net investment in foreign entities, and of borrowings and other currency instruments designated as hedges of such investments, are taken to shareholders’ equity on consolidation.
(h) LeasesLeases are classified as finance leases whenever the terms of the lease transfer substantially all the risks and rewards of ownership to the lessee. All other leases are classified as operating leases.
Assets held under finance leases are recognised as assets of the Group at their fair value or, if lower, at the present value of the minimum lease payments, each determined at the inception of the lease. The corresponding liability to the lessor is included in the balance sheet as a finance lease obligation.
Lease payments are apportioned between finance expense and reduction of the lease obligation so as to achieve a constant rate of interest on the remaining balance of the liability. Finance expenses are recognised immediately in the income statement.
Rentals payable under operating lease are taken to the income statement on a straight-line basis over the lease term. Lease incentive benefits are recognised as a reduction in rental expense on a straight-line basis over the lease term.
(i) Intangible assetsGoodwill represents the excess of the cost of an acquisition over the fair value of the Group’s share of the net identifiable assets of the acquired subsidiary at the date of the acquisition. Goodwill is tested annually for impairment and carried at cost less accumulated impairment losses. Goodwill is allocated to cash-generating units for the purpose of impairment testing. The allocation is made to those cash-generating units that are expected to benefit from the future cash flows of the business combination in which the goodwill arose.
Development costs are capitalised as an intangible asset in accordance with the requirements of IAS 38 Intangible Assets. An intangible asset is recognised when it is probable that the future economic benefits that are attributable to the asset will flow to the Group. Only costs directly incurred in relation to a development project are capitalised. This includes the cost of internal labour, which is captured via appropriately approved timesheets. Amortisation of the intangible asset commences at the point the underlying product is commissioned for use. An impairment review is performed at each balance sheet date until the product is commissioned. Amortisation is charged on a straight-line basis over the estimated lifespan of the product. The estimated lifespan is reviewed regularly for appropriateness.
Other intangible assets, which are acquired separately or through a business combination, are stated at cost or fair value respectively, less accumulated amortisation and impairment losses. An intangible asset with a finite useful life is amortised from the date the asset is available for use, and is charged to the income statement on a straight-line basis over its useful life, between 1 and 20 years. The Group does not have any assets, other than goodwill, with infinite useful lives. Any impairment is recognised immediately in the income statement.

70 / HARVEY NASH GROUP PLC FINANCIAL STATEMENTS
(j) Impairment of property, plant and equipment and intangible assetsAll assets are tested annually for impairment and whenever events or changes in circumstances indicate that the carrying amount may not be recoverable. An impairment loss is recognised in the income statement for the amount by which the asset’s carrying amount exceeds its recoverable amount.
The recoverable amount is the higher of the asset’s fair value less costs of sale and value in use. In assessing value in use, the estimated future cash flows are discounted to their present value using a post-tax discount rate that reflects current market assessments of the time value of money and the risks specific to the asset for which the estimates of future cash flows have not been adjusted. Assets are grouped at the lowest levels for which there are separately identifiable cash flows (cash-generating units).
Where an impairment subsequently reverses, the carrying amount of the asset is increased to the revised estimate of its recoverable amount, but so that the increased carrying amount does not exceed the original carrying value prior to any impairment charges.
(k) Financial instruments Financial assets and liabilities are recognised on the Group’s balance sheet when the Group becomes a party to the contractual provisions of the instrument. Financial assets are derecognised when the Group’s contractual rights to the cash flows expire or the Group transfers substantially all the risks and reward of the financial asset. Financial liabilities are derecognised from the Group’s balance sheet when the obligation specified in the contract is discharged, cancelled or expires.
Financial assets Trade receivables, loans, and other receivables that have fixed or determinable payments that are not quoted in an active market are classified as “loans and receivables”. Loans and receivables are measured at amortised cost using the effective interest method, less any impairment. Interest income is recognised by applying the effective interest rate, except for short-term receivables where the recognition of interest would be immaterial. For trade receivables, generally this results in recognition at nominal value less any allowance for doubtful debts.
Financial assets which are not classified as loans and receivables are classified as ‘‘fair value through the profit and loss” (“FVTPL”). Financial assets at FVTPL are financial assets held for trading. A financial asset is classified in this category if acquired principally for the purpose of selling in the short term or such designation would eliminate or significantly reduce a measurement or recognition inconsistency that would otherwise arise. Assets in this category are classified as current assets.
Financial liabilities Financial liabilities are classified as either FVTPL or “other financial liabilities”. A financial liability is classified as FVTPL if it is held for trading or specifically designated as such to eliminate or significantly reduce a measurement or recognition inconsistency that would otherwise arise. Financial liabilities at FVTPL are stated at fair value, with any gains or losses arising on remeasurement recognised in the profit and loss.
Other financial liabilities, including borrowings, are initially measured at fair value, net of transaction costs. Other financial liabilities are subsequently measured at amortised cost using the effective interest method, with interest expense recognised on an effective yield basis. The effective interest method is a method of calculating the amortised cost of a financial liability and of allocating interest expense over the relevant period. The effective interest rate is the rate that discounts estimated future cash payments through the expected life of the financial liability, or, where appropriate, a shorter period, to the net carrying amount on initial recognition.
(l) Cash and cash equivalentsCash comprises cash-in-hand and deposits that can be withdrawn as cash without giving any notice and without suffering any penalty. Cash equivalents are short-term, highly liquid investments which are readily convertible to known amounts of cash and which are subject to insignificant risk of changes in value.
(m) Share capitalOrdinary shares are classified as equity. Where any Group company purchases the Company’s equity share capital (treasury shares), the consideration paid is deductible from equity attributable to the Company’s equity holders until the shares are cancelled, reissued or disposed of. Where such shares are subsequently sold or reissued, any consideration received is included in equity attributable to the Company’s equity holders.
(n) Tax
Current taxThe tax currently payable is based on taxable profit for the year. Taxable profit differs from net profit as reported in the income statement because it excludes items of income and expense that are taxable or deductible in other years and it further excludes items that are never taxable or deductible. The Group’s liability for current tax is calculated using tax rates that have been enacted or substantially enacted by the balance sheet date.
HARVEY NASH GROUP PLC FINANCIAL STATEMENTS / 71
Deferred taxDeferred tax is the tax expected to be payable or recoverable on differences between the carrying amounts of assets and liabilities in the financial statements and the corresponding tax bases used in the computation of taxable profit, and is accounted for using the balance sheet liability method. Deferred tax liabilities are generally recognised for all taxable temporary differences and deferred tax assets are recognised to the extent that it is probable that taxable profits will be available against which deductible temporary differences can be utilised. Such assets and liabilities are not recognised if the temporary difference arises from the initial recognition of goodwill or from the initial recognition (other than in a business combination) of other assets and liabilities in a transaction that affects neither the taxable profit nor the accounting profit.
Deferred tax liabilities are recognised for taxable temporary differences arising on investments in subsidiaries and associates, and interests in joint ventures, except where the Group is able to control the reversal of the temporary difference and it is probable that the temporary difference will not reverse in the foreseeable future. Deferred tax assets arising from deductible temporary differences associated with such investments and interests are only recognised to the extent that it is probable that there will be sufficient taxable profits against which to utilise the benefits of the temporary differences and they are expected to reverse in the foreseeable future.
The carrying amount of deferred tax assets is reviewed at each balance sheet date and reduced to the extent that it is no longer probable that sufficient taxable profits will be available to allow all or part of the asset to be recovered.
Deferred tax is calculated at the tax rates that are expected to apply in the period when the liability is settled or the asset is realised based on tax laws and rates that have been enacted or substantively enacted at the balance sheet date. Deferred tax is charged or credited in the income statement, except when it relates to items charged or credited in other comprehensive income, in which case the deferred tax is also dealt with in other comprehensive income.
(o) Dividend distributionDividend distribution to the Company’s shareholders is recognised as a liability in the Group’s financial statements in the period in which the dividends are approved by the Company’s shareholders. Interim dividends are recognised when paid.
(p) Employee benefitsPension obligationsWherever possible the Group operates defined contribution pension schemes, under which the Group pays fixed contributions into separate entities. The Group has no legal or constructive obligation to pay further contributions. Pension costs are charged to the income statement in the year in which they arise. In Belgium and Switzerland, legislation requires the operation of pension schemes that contain an element of defined benefit, the obligations under which are fully insured and there are no unrecorded liabilities. These schemes are accounted for as defined contribution schemes.
Termination benefitsTermination benefits are payable when employment is terminated before the normal retirement date or when an employee accepts voluntary redundancy in exchange for benefits. The Group recognises termination benefits when it is demonstrably committed to terminating the employment of current employees according to a detailed formal plan without possibility of withdrawal.
Bonus planThe Group recognises a liability and an expense for bonuses when contractually obliged.
Share-based plansThe Group’s management awards certain employees share options on a discretionary basis. The options are subject to three-year vesting conditions and their fair value is recognised as an employee benefits expense with a corresponding increase in retained earnings over the vesting period. The proceeds received net of any directly attributable transaction costs are credited to share capital and share premium when the options are exercised. For options exercised against own shares held, the shares are removed from the own shares held reserve. The Group has applied IFRS 2 Share-based Payment to all instruments granted after 7 November 2002 but not fully vested as at 1 January 2005 and has adopted the Black-Scholes model for the purposes of computing “fair value”. Deferred tax is also provided based upon the expected future tax deductions relating to share-based payment transactions and is recognised over the vesting period of the schemes concerned.
(q) ProvisionsProvisions are recognised when a present obligation exists as the result of a past event and it is probable that this will result in an outflow of economic benefit, the size of which can be reliably estimated. Discounting is applied only when the effect is material.
(r) Borrowing costsBorrowing costs are written off as incurred or, in the case of initial arrangement fees, may be spread over the term of the facility where appropriate. Invoice discounting fees are recognised as incurred.
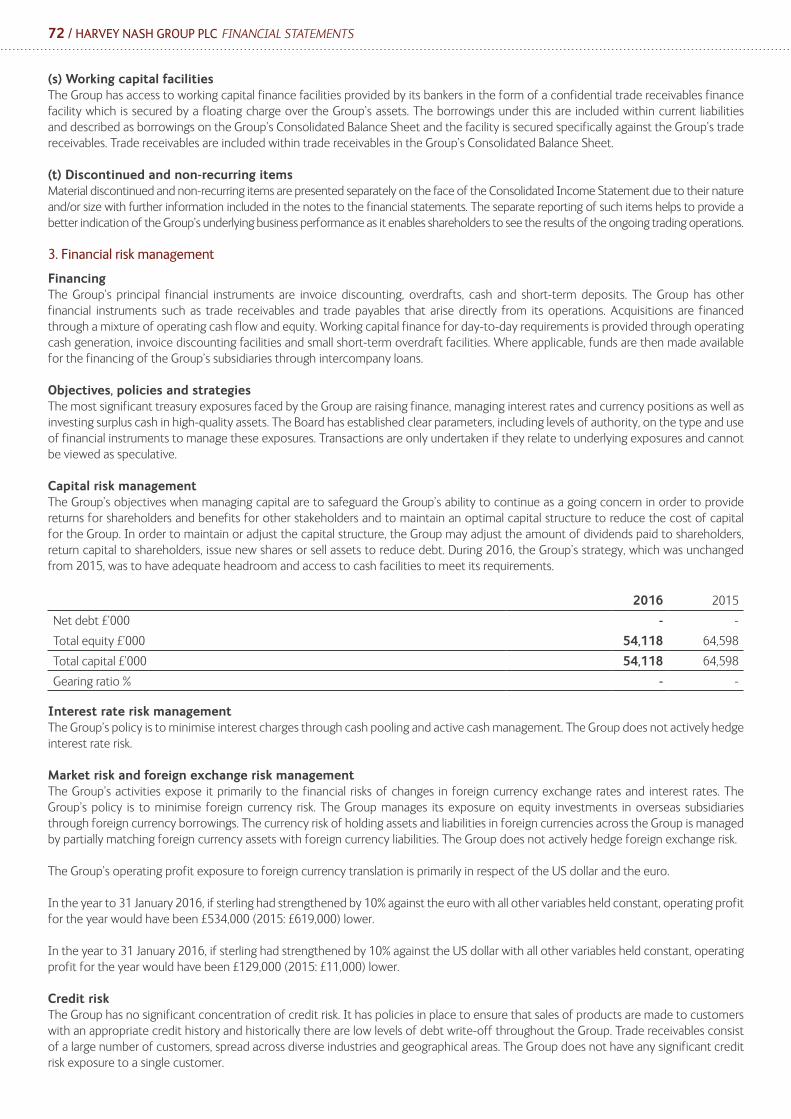
72 / HARVEY NASH GROUP PLC FINANCIAL STATEMENTS
(s) Working capital facilitiesThe Group has access to working capital finance facilities provided by its bankers in the form of a confidential trade receivables finance facility which is secured by a floating charge over the Group’s assets. The borrowings under this are included within current liabilities and described as borrowings on the Group’s Consolidated Balance Sheet and the facility is secured specifically against the Group’s trade receivables. Trade receivables are included within trade receivables in the Group’s Consolidated Balance Sheet.
(t) Discontinued and non-recurring itemsMaterial discontinued and non-recurring items are presented separately on the face of the Consolidated Income Statement due to their nature and/or size with further information included in the notes to the financial statements. The separate reporting of such items helps to provide a better indication of the Group’s underlying business performance as it enables shareholders to see the results of the ongoing trading operations. 3. Financial risk management
FinancingThe Group’s principal financial instruments are invoice discounting, overdrafts, cash and short-term deposits. The Group has other financial instruments such as trade receivables and trade payables that arise directly from its operations. Acquisitions are financed through a mixture of operating cash flow and equity. Working capital finance for day-to-day requirements is provided through operating cash generation, invoice discounting facilities and small short-term overdraft facilities. Where applicable, funds are then made available for the financing of the Group’s subsidiaries through intercompany loans.
Objectives, policies and strategiesThe most significant treasury exposures faced by the Group are raising finance, managing interest rates and currency positions as well as investing surplus cash in high-quality assets. The Board has established clear parameters, including levels of authority, on the type and use of financial instruments to manage these exposures. Transactions are only undertaken if they relate to underlying exposures and cannot be viewed as speculative.
Capital risk managementThe Group’s objectives when managing capital are to safeguard the Group’s ability to continue as a going concern in order to provide returns for shareholders and benefits for other stakeholders and to maintain an optimal capital structure to reduce the cost of capital for the Group. In order to maintain or adjust the capital structure, the Group may adjust the amount of dividends paid to shareholders, return capital to shareholders, issue new shares or sell assets to reduce debt. During 2016, the Group’s strategy, which was unchanged from 2015, was to have adequate headroom and access to cash facilities to meet its requirements.
2016 2015
Net debt £’000 - -
Total equity £’000 54,118 64,598
Total capital £’000 54,118 64,598
Gearing ratio % - -
Interest rate risk managementThe Group’s policy is to minimise interest charges through cash pooling and active cash management. The Group does not actively hedge interest rate risk.
Market risk and foreign exchange risk managementThe Group’s activities expose it primarily to the financial risks of changes in foreign currency exchange rates and interest rates. The Group’s policy is to minimise foreign currency risk. The Group manages its exposure on equity investments in overseas subsidiaries through foreign currency borrowings. The currency risk of holding assets and liabilities in foreign currencies across the Group is managed by partially matching foreign currency assets with foreign currency liabilities. The Group does not actively hedge foreign exchange risk.
The Group’s operating profit exposure to foreign currency translation is primarily in respect of the US dollar and the euro.
In the year to 31 January 2016, if sterling had strengthened by 10% against the euro with all other variables held constant, operating profit for the year would have been £534,000 (2015: £619,000) lower. In the year to 31 January 2016, if sterling had strengthened by 10% against the US dollar with all other variables held constant, operating profit for the year would have been £129,000 (2015: £11,000) lower.
Credit riskThe Group has no significant concentration of credit risk. It has policies in place to ensure that sales of products are made to customers with an appropriate credit history and historically there are low levels of debt write-off throughout the Group. Trade receivables consist of a large number of customers, spread across diverse industries and geographical areas. The Group does not have any significant credit risk exposure to a single customer.

HARVEY NASH GROUP PLC FINANCIAL STATEMENTS / 73
The table below shows the counterparty risk with the Bank at the balance sheet date.
2016 2016 2015 2015
£ ’000 £ ’000 £ ’000 £ ’000
Rating * Credit limit Balance Credit limit Balance
Bank overdraft – secured BBB- 2,000 - 2,000 -
* Standard and Poor’s rating
Liquidity riskPrudent liquidity risk management implies maintaining sufficient cash and committed credit facilities. Management monitors rolling forecasts of the Group’s liquidity reserve (comprising undrawn borrowing facility, cash and invoice discounting) on the basis of expected cash flow. All borrowings are short term. The Group’s main discounting facility is a rolling facility and was most recently renewed in February 2016.
4. Critical accounting judgements and key sources of estimation uncertainty
In the application of the Group’s accounting policies, which are described in note 2, the Directors are required to make judgements, estimates and assumptions about the carrying amounts of assets and liabilities that are not readily apparent from other sources. The estimates and associated assumptions are based on historical experience and other factors that are considered relevant. Actual results may differ from these estimates.
The estimates and underlying assumptions are reviewed on an ongoing basis. Revisions to accounting estimates are recognised in the period in which the estimate is revised if the revision affects only that period, or in the period of the revision and future periods if the revision affects both current and future periods.
The areas involving a higher degree of judgement or complexity, or areas where assumptions and estimates are significant to the financial statements are as follows.
Critical accounting judgements
Capitalisation of internally generated intangible assetsIn the prior year, the Group commenced software development of a wireless solution for the automotive and rail sectors during the year. Cumulative direct costs of £2.1m (2015: £1.7m) incurred by the project were capitalised as an intangible asset. Management must apply judgement in determining the appropriateness of direct costs incurred, particularly own labour costs, when capitalising these as an intangible asset.
Disposal of subsidiaryThe Group disposed of its interest in the German telecommunications outsourcing business during the year. The Group was involved in software development of a wireless solution for the automotive and rail sectors with the disposal allowing for refocus on the Group’s core recruitment services. The disposal has been accounted for as a discontinued operation within these financial statements. The key judgements relate to management’s estimate of the deferred consideration which has been valued at £nil and the recoverability of the commercial loan of €2.3m. Further details are set out in note 32.
Impairment of goodwillDetermining whether the goodwill is impaired requires an estimation of the value in use of the cash-generating units to which goodwill has been allocated. The value in use calculation requires management to estimate the future cash flows expected to arise from the cash-generating unit and a suitable discount rate in order to calculate present value. These include forward-looking forecasts which are inherently judgemental. The carrying amount of goodwill at 31 January 2016 was £49.7m (2015: £48.7m). The key assumptions in the value in use calculations are set out in note 11.
Key sources of estimation uncertainty
Revenue recognitionJudgement applied in respect of recognition of revenue is significant in two key areas: cut-off and presentation of temporary recruitment fees and cumulative revenue generated by fixed price contract work. The revenue generated by the latter is recognised on a percentage completion basis which is based on management’s best estimate of utilisation at the reporting date.
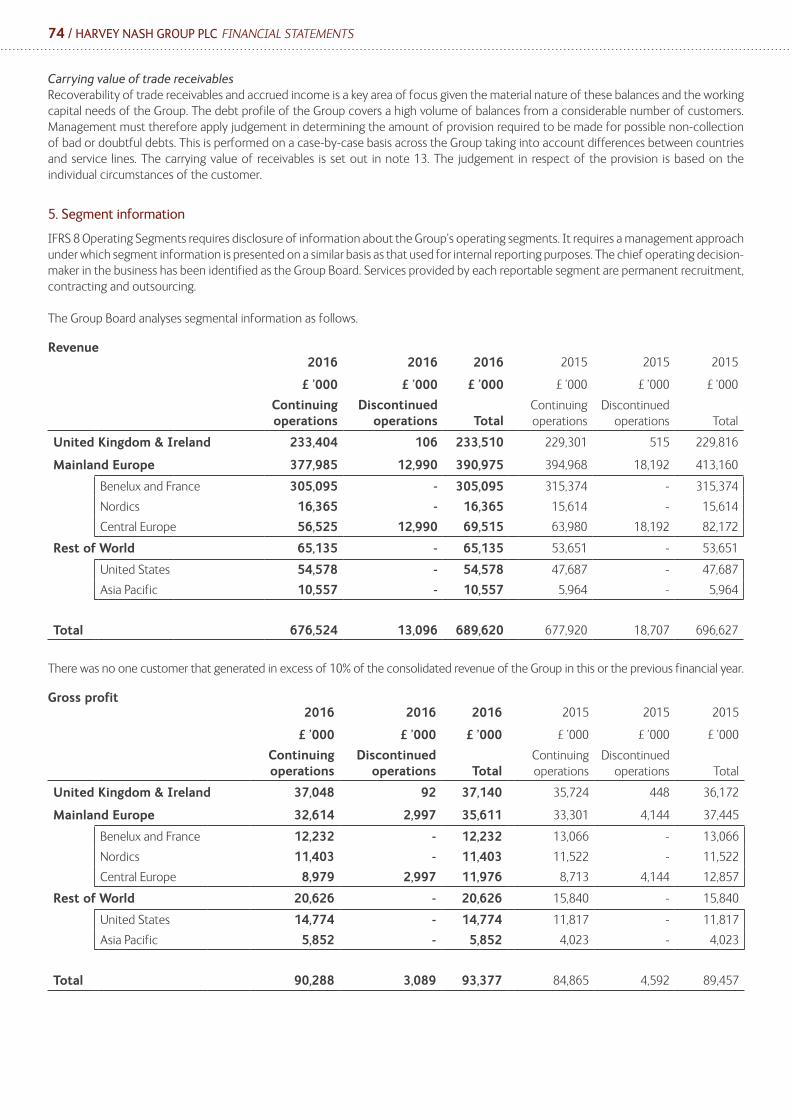
74 / HARVEY NASH GROUP PLC FINANCIAL STATEMENTS
Carrying value of trade receivables Recoverability of trade receivables and accrued income is a key area of focus given the material nature of these balances and the working capital needs of the Group. The debt profile of the Group covers a high volume of balances from a considerable number of customers. Management must therefore apply judgement in determining the amount of provision required to be made for possible non-collection of bad or doubtful debts. This is performed on a case-by-case basis across the Group taking into account differences between countries and service lines. The carrying value of receivables is set out in note 13. The judgement in respect of the provision is based on the individual circumstances of the customer.
5. Segment information
IFRS 8 Operating Segments requires disclosure of information about the Group’s operating segments. It requires a management approach under which segment information is presented on a similar basis as that used for internal reporting purposes. The chief operating decision-maker in the business has been identified as the Group Board. Services provided by each reportable segment are permanent recruitment, contracting and outsourcing.
The Group Board analyses segmental information as follows.
Revenue2016
£ ’000
2016
£ ’000
2016
£ ’000
2015
£ ’000
2015
£ ’000
2015
£ ’000
Continuing operations
Discontinued operations Total
Continuing operations
Discontinued operations Total
United Kingdom & Ireland 233,404 106 233,510 229,301 515 229,816
Mainland Europe 377,985 12,990 390,975 394,968 18,192 413,160
Benelux and France 305,095 - 305,095 315,374 - 315,374
Nordics 16,365 - 16,365 15,614 - 15,614
Central Europe 56,525 12,990 69,515 63,980 18,192 82,172
Rest of World 65,135 - 65,135 53,651 - 53,651
United States 54,578 - 54,578 47,687 - 47,687
Asia Pacific 10,557 - 10,557 5,964 - 5,964
Total 676,524 13,096 689,620 677,920 18,707 696,627
There was no one customer that generated in excess of 10% of the consolidated revenue of the Group in this or the previous financial year.
Gross profit2016
£ ’000
2016
£ ’000
2016
£ ’000
2015
£ ’000
2015
£ ’000
2015
£ ’000
Continuing operations
Discontinued operations Total
Continuing operations
Discontinued operations Total
United Kingdom & Ireland 37,048 92 37,140 35,724 448 36,172
Mainland Europe 32,614 2,997 35,611 33,301 4,144 37,445
Benelux and France 12,232 - 12,232 13,066 - 13,066
Nordics 11,403 - 11,403 11,522 - 11,522
Central Europe 8,979 2,997 11,976 8,713 4,144 12,857
Rest of World 20,626 - 20,626 15,840 - 15,840
United States 14,774 - 14,774 11,817 - 11,817
Asia Pacific 5,852 - 5,852 4,023 - 4,023
Total 90,288 3,089 93,377 84,865 4,592 89,457
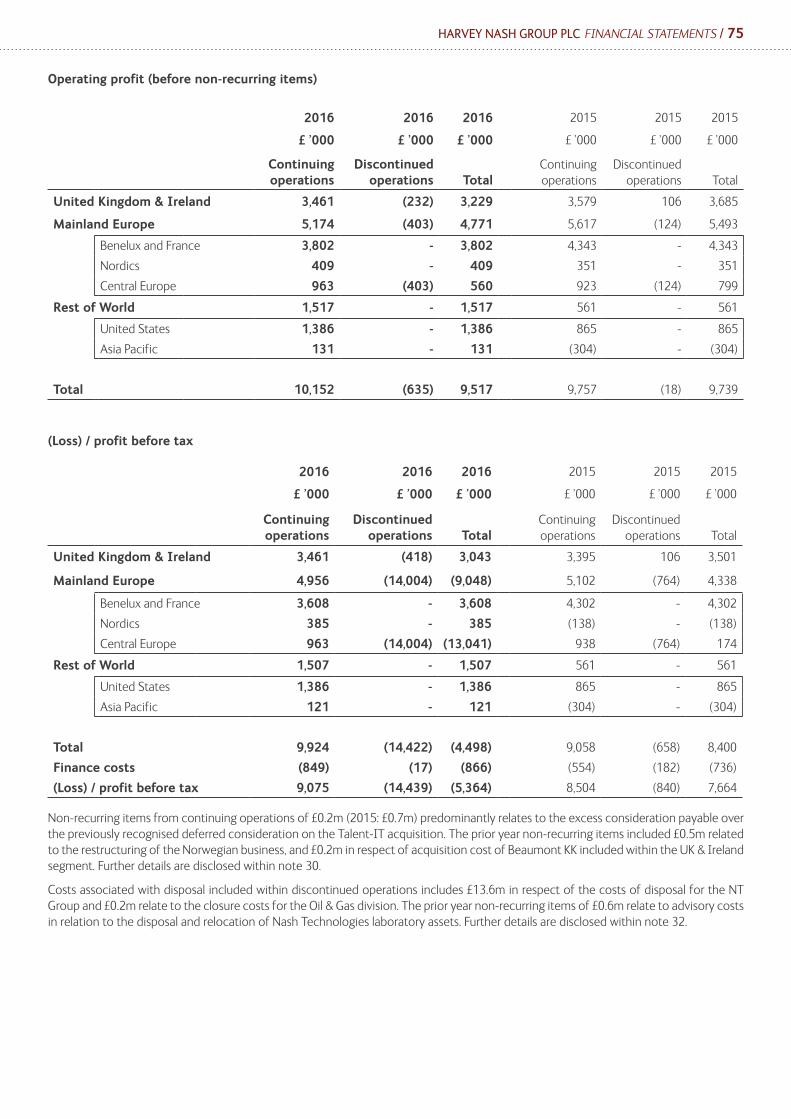
HARVEY NASH GROUP PLC FINANCIAL STATEMENTS / 75
Operating profit (before non-recurring items)
2016
£ ’000
2016
£ ’000
2016
£ ’000
2015
£ ’000
2015
£ ’000
2015
£ ’000
Continuing operations
Discontinued operations Total
Continuing operations
Discontinued operations Total
United Kingdom & Ireland 3,461 (232) 3,229 3,579 106 3,685
Mainland Europe 5,174 (403) 4,771 5,617 (124) 5,493
Benelux and France 3,802 - 3,802 4,343 - 4,343
Nordics 409 - 409 351 - 351
Central Europe 963 (403) 560 923 (124) 799
Rest of World 1,517 - 1,517 561 - 561
United States 1,386 - 1,386 865 - 865
Asia Pacific 131 - 131 (304) - (304)
Total 10,152 (635) 9,517 9,757 (18) 9,739
(Loss) / profit before tax
2016
£ ’000
2016
£ ’000
2016
£ ’000
2015
£ ’000
2015
£ ’000
2015
£ ’000
Continuing operations
Discontinued operations Total
Continuing operations
Discontinued operations Total
United Kingdom & Ireland 3,461 (418) 3,043 3,395 106 3,501
Mainland Europe 4,956 (14,004) (9,048) 5,102 (764) 4,338
Benelux and France 3,608 - 3,608 4,302 - 4,302
Nordics 385 - 385 (138) - (138)
Central Europe 963 (14,004) (13,041) 938 (764) 174
Rest of World 1,507 - 1,507 561 - 561
United States 1,386 - 1,386 865 - 865
Asia Pacific 121 - 121 (304) - (304)
Total 9,924 (14,422) (4,498) 9,058 (658) 8,400
Finance costs (849) (17) (866) (554) (182) (736)
(Loss) / profit before tax 9,075 (14,439) (5,364) 8,504 (840) 7,664
Non-recurring items from continuing operations of £0.2m (2015: £0.7m) predominantly relates to the excess consideration payable over the previously recognised deferred consideration on the Talent-IT acquisition. The prior year non-recurring items included £0.5m related to the restructuring of the Norwegian business, and £0.2m in respect of acquisition cost of Beaumont KK included within the UK & Ireland segment. Further details are disclosed within note 30.
Costs associated with disposal included within discontinued operations includes £13.6m in respect of the costs of disposal for the NT Group and £0.2m relate to the closure costs for the Oil & Gas division. The prior year non-recurring items of £0.6m relate to advisory costs in relation to the disposal and relocation of Nash Technologies laboratory assets. Further details are disclosed within note 32.
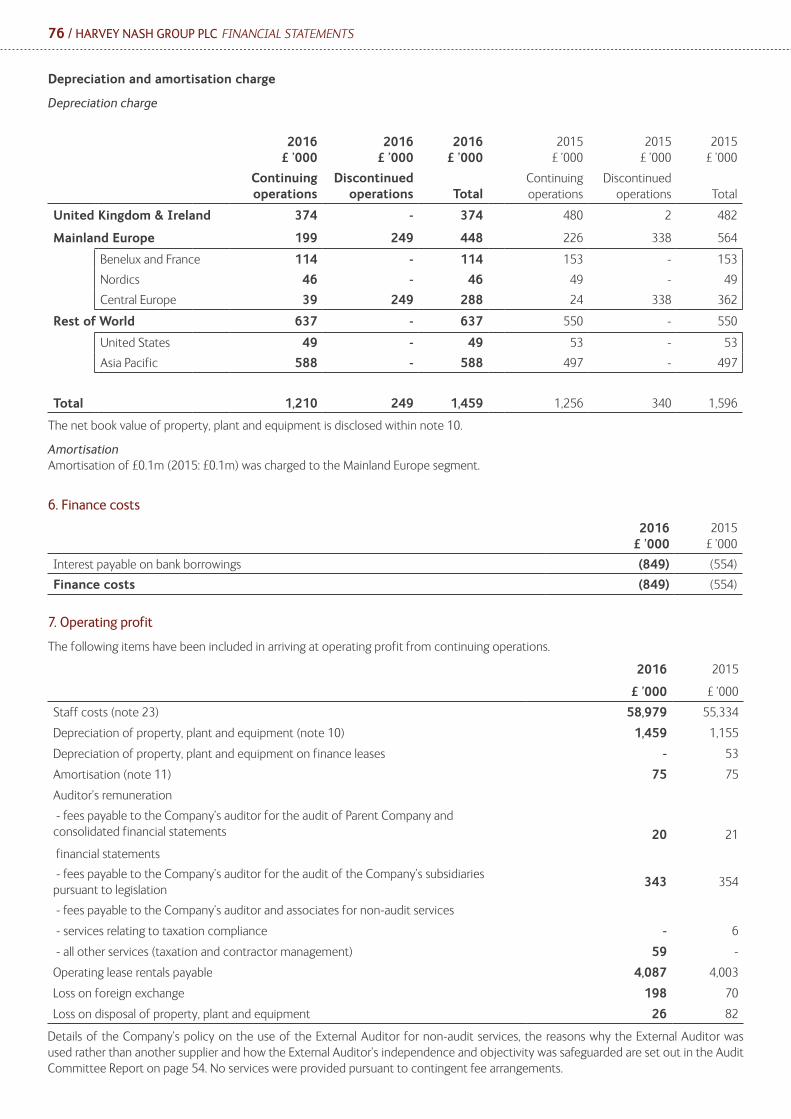
76 / HARVEY NASH GROUP PLC FINANCIAL STATEMENTS
Depreciation and amortisation charge
Depreciation charge
2016 £ ’000
2016 £ ’000
2016 £ ’000
2015 £ ’000
2015 £ ’000
2015 £ ’000
Continuing operations
Discontinued operations Total
Continuing operations
Discontinued operations Total
United Kingdom & Ireland 374 - 374 480 2 482
Mainland Europe 199 249 448 226 338 564
Benelux and France 114 - 114 153 - 153
Nordics 46 - 46 49 - 49
Central Europe 39 249 288 24 338 362
Rest of World 637 - 637 550 - 550
United States 49 - 49 53 - 53
Asia Pacific 588 - 588 497 - 497
Total 1,210 249 1,459 1,256 340 1,596
The net book value of property, plant and equipment is disclosed within note 10.
Amortisation Amortisation of £0.1m (2015: £0.1m) was charged to the Mainland Europe segment.
6. Finance costs
2016 £ ’000
2015 £ ’000
Interest payable on bank borrowings (849) (554)
Finance costs (849) (554)
7. Operating profit
The following items have been included in arriving at operating profit from continuing operations.
2016
£ ’000
2015
£ ’000
Staff costs (note 23) 58,979 55,334
Depreciation of property, plant and equipment (note 10) 1,459 1,155
Depreciation of property, plant and equipment on finance leases - 53
Amortisation (note 11) 75 75
Auditor’s remuneration
- fees payable to the Company’s auditor for the audit of Parent Company and consolidated financial statements
financial statements
20 21
- fees payable to the Company’s auditor for the audit of the Company’s subsidiaries pursuant to legislation
343 354
- fees payable to the Company’s auditor and associates for non-audit services
- services relating to taxation compliance - 6
- all other services (taxation and contractor management) 59 -
Operating lease rentals payable 4,087 4,003
Loss on foreign exchange 198 70
Loss on disposal of property, plant and equipment 26 82
Details of the Company’s policy on the use of the External Auditor for non-audit services, the reasons why the External Auditor was used rather than another supplier and how the External Auditor’s independence and objectivity was safeguarded are set out in the Audit Committee Report on page 54. No services were provided pursuant to contingent fee arrangements.
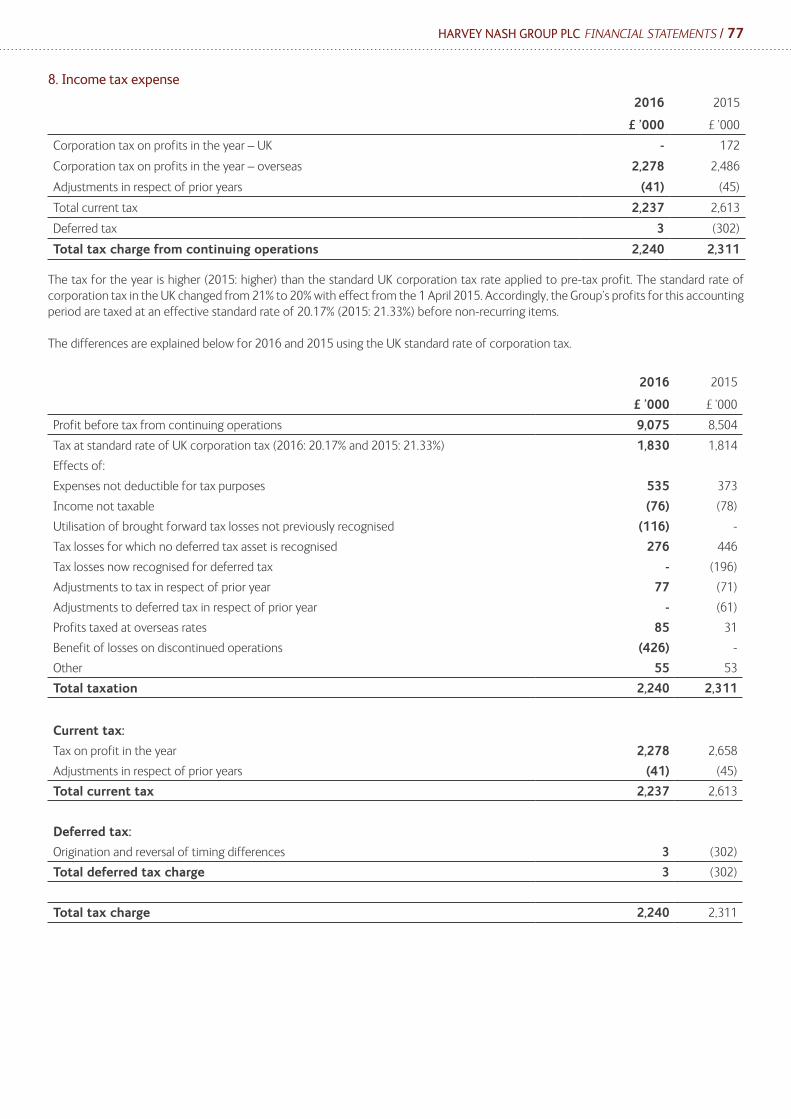
HARVEY NASH GROUP PLC FINANCIAL STATEMENTS / 77
8. Income tax expense
2016
£ ’000
2015
£ ’000
Corporation tax on profits in the year – UK - 172
Corporation tax on profits in the year – overseas 2,278 2,486
Adjustments in respect of prior years (41) (45)
Total current tax 2,237 2,613
Deferred tax 3 (302)
Total tax charge from continuing operations 2,240 2,311
The tax for the year is higher (2015: higher) than the standard UK corporation tax rate applied to pre-tax profit. The standard rate of corporation tax in the UK changed from 21% to 20% with effect from the 1 April 2015. Accordingly, the Group’s profits for this accounting period are taxed at an effective standard rate of 20.17% (2015: 21.33%) before non-recurring items.
The differences are explained below for 2016 and 2015 using the UK standard rate of corporation tax.
2016
£ ’000
2015
£ ’000
Profit before tax from continuing operations 9,075 8,504
Tax at standard rate of UK corporation tax (2016: 20.17% and 2015: 21.33%) 1,830 1,814
Effects of:
Expenses not deductible for tax purposes 535 373
Income not taxable (76) (78)
Utilisation of brought forward tax losses not previously recognised (116) -
Tax losses for which no deferred tax asset is recognised 276 446
Tax losses now recognised for deferred tax - (196)
Adjustments to tax in respect of prior year 77 (71)
Adjustments to deferred tax in respect of prior year - (61)
Profits taxed at overseas rates 85 31
Benefit of losses on discontinued operations (426) -
Other 55 53
Total taxation 2,240 2,311
Current tax:
Tax on profit in the year 2,278 2,658
Adjustments in respect of prior years (41) (45)
Total current tax 2,237 2,613
Deferred tax:
Origination and reversal of timing differences 3 (302)
Total deferred tax charge 3 (302)
Total tax charge 2,240 2,311
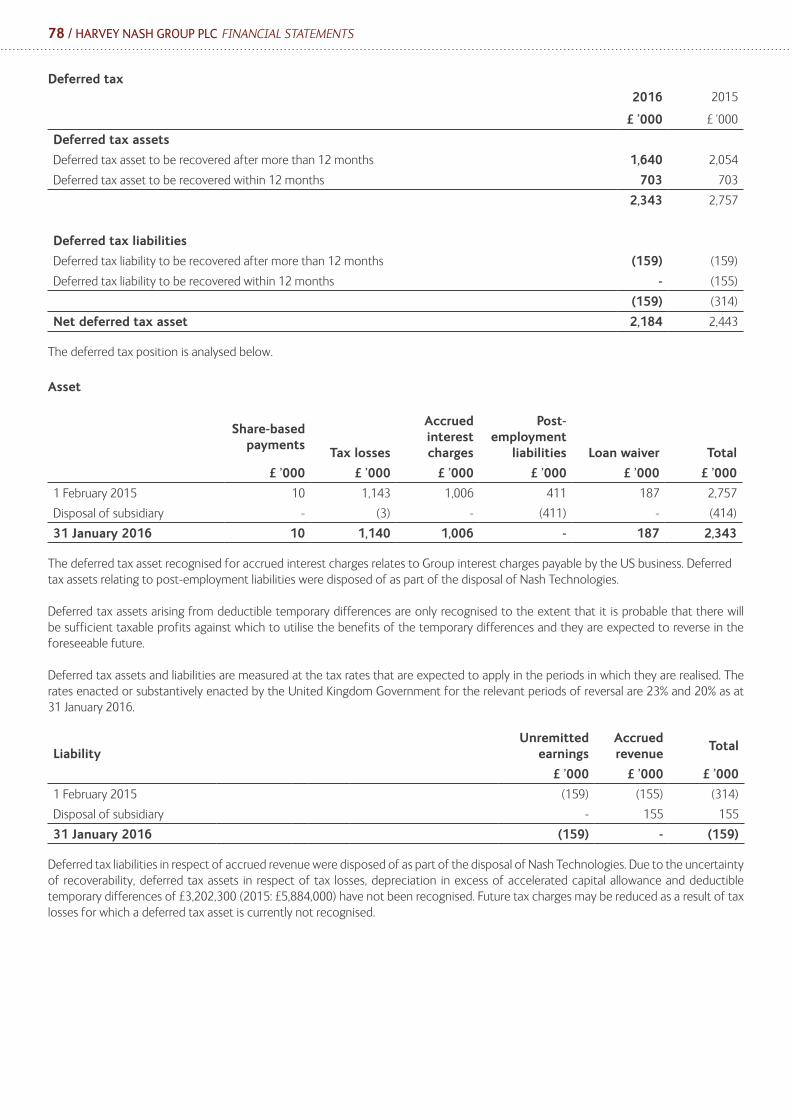
78 / HARVEY NASH GROUP PLC FINANCIAL STATEMENTS
Deferred tax2016
£ ’000
2015
£ ’000
Deferred tax assets
Deferred tax asset to be recovered after more than 12 months 1,640 2,054
Deferred tax asset to be recovered within 12 months 703 703
2,343 2,757
Deferred tax liabilities
Deferred tax liability to be recovered after more than 12 months (159) (159)
Deferred tax liability to be recovered within 12 months - (155)
(159) (314)
Net deferred tax asset 2,184 2,443
The deferred tax position is analysed below.
Asset
Share-based payments
Tax losses
Accrued interest charges
Post-employment
liabilities Loan waiver Total
£ ’000 £ ’000 £ ’000 £ ’000 £ ’000 £ ’000
1 February 2015 10 1,143 1,006 411 187 2,757
Disposal of subsidiary - (3) - (411) - (414)
31 January 2016 10 1,140 1,006 - 187 2,343
The deferred tax asset recognised for accrued interest charges relates to Group interest charges payable by the US business. Deferred tax assets relating to post-employment liabilities were disposed of as part of the disposal of Nash Technologies.
Deferred tax assets arising from deductible temporary differences are only recognised to the extent that it is probable that there will be sufficient taxable profits against which to utilise the benefits of the temporary differences and they are expected to reverse in the foreseeable future.
Deferred tax assets and liabilities are measured at the tax rates that are expected to apply in the periods in which they are realised. The rates enacted or substantively enacted by the United Kingdom Government for the relevant periods of reversal are 23% and 20% as at 31 January 2016.
LiabilityUnremitted
earningsAccrued revenue
Total
£ ’000 £ ’000 £ ’000
1 February 2015 (159) (155) (314)
Disposal of subsidiary - 155 155
31 January 2016 (159) - (159)
Deferred tax liabilities in respect of accrued revenue were disposed of as part of the disposal of Nash Technologies. Due to the uncertainty of recoverability, deferred tax assets in respect of tax losses, depreciation in excess of accelerated capital allowance and deductible temporary differences of £3,202,300 (2015: £5,884,000) have not been recognised. Future tax charges may be reduced as a result of tax losses for which a deferred tax asset is currently not recognised.
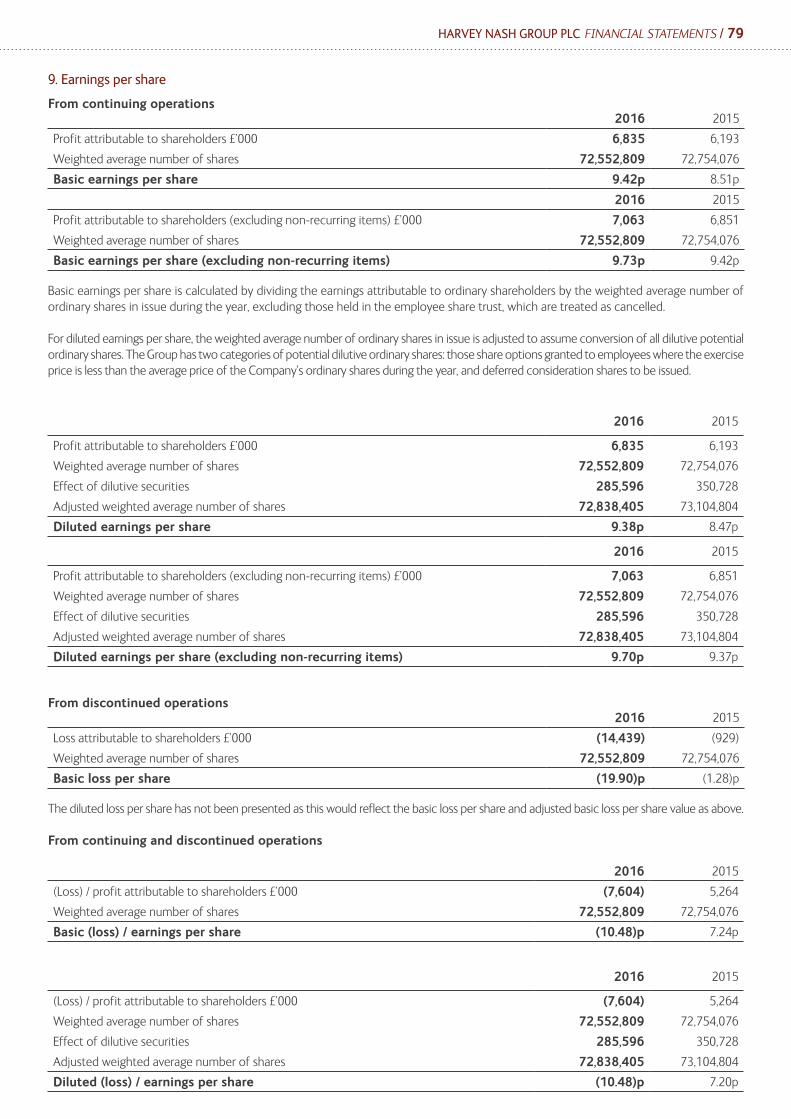
HARVEY NASH GROUP PLC FINANCIAL STATEMENTS / 79
9. Earnings per share
From continuing operations2016 2015
Profit attributable to shareholders £’000 6,835 6,193
Weighted average number of shares 72,552,809 72,754,076
Basic earnings per share 9.42p 8.51p
2016 2015
Profit attributable to shareholders (excluding non-recurring items) £’000 7,063 6,851
Weighted average number of shares 72,552,809 72,754,076
Basic earnings per share (excluding non-recurring items) 9.73p 9.42p
Basic earnings per share is calculated by dividing the earnings attributable to ordinary shareholders by the weighted average number of ordinary shares in issue during the year, excluding those held in the employee share trust, which are treated as cancelled.
For diluted earnings per share, the weighted average number of ordinary shares in issue is adjusted to assume conversion of all dilutive potential ordinary shares. The Group has two categories of potential dilutive ordinary shares: those share options granted to employees where the exercise price is less than the average price of the Company’s ordinary shares during the year, and deferred consideration shares to be issued.
2016 2015
Profit attributable to shareholders £’000 6,835 6,193
Weighted average number of shares 72,552,809 72,754,076
Effect of dilutive securities 285,596 350,728
Adjusted weighted average number of shares 72,838,405 73,104,804
Diluted earnings per share 9.38p 8.47p
2016 2015
Profit attributable to shareholders (excluding non-recurring items) £’000 7,063 6,851
Weighted average number of shares 72,552,809 72,754,076
Effect of dilutive securities 285,596 350,728
Adjusted weighted average number of shares 72,838,405 73,104,804
Diluted earnings per share (excluding non-recurring items) 9.70p 9.37p
From discontinued operations2016 2015
Loss attributable to shareholders £’000 (14,439) (929)
Weighted average number of shares 72,552,809 72,754,076
Basic loss per share (19.90)p (1.28)p
The diluted loss per share has not been presented as this would reflect the basic loss per share and adjusted basic loss per share value as above.
From continuing and discontinued operations
2016 2015
(Loss) / profit attributable to shareholders £’000 (7,604) 5,264
Weighted average number of shares 72,552,809 72,754,076
Basic (loss) / earnings per share (10.48)p 7.24p
2016 2015
(Loss) / profit attributable to shareholders £’000 (7,604) 5,264
Weighted average number of shares 72,552,809 72,754,076
Effect of dilutive securities 285,596 350,728
Adjusted weighted average number of shares 72,838,405 73,104,804
Diluted (loss) / earnings per share (10.48)p 7.20p
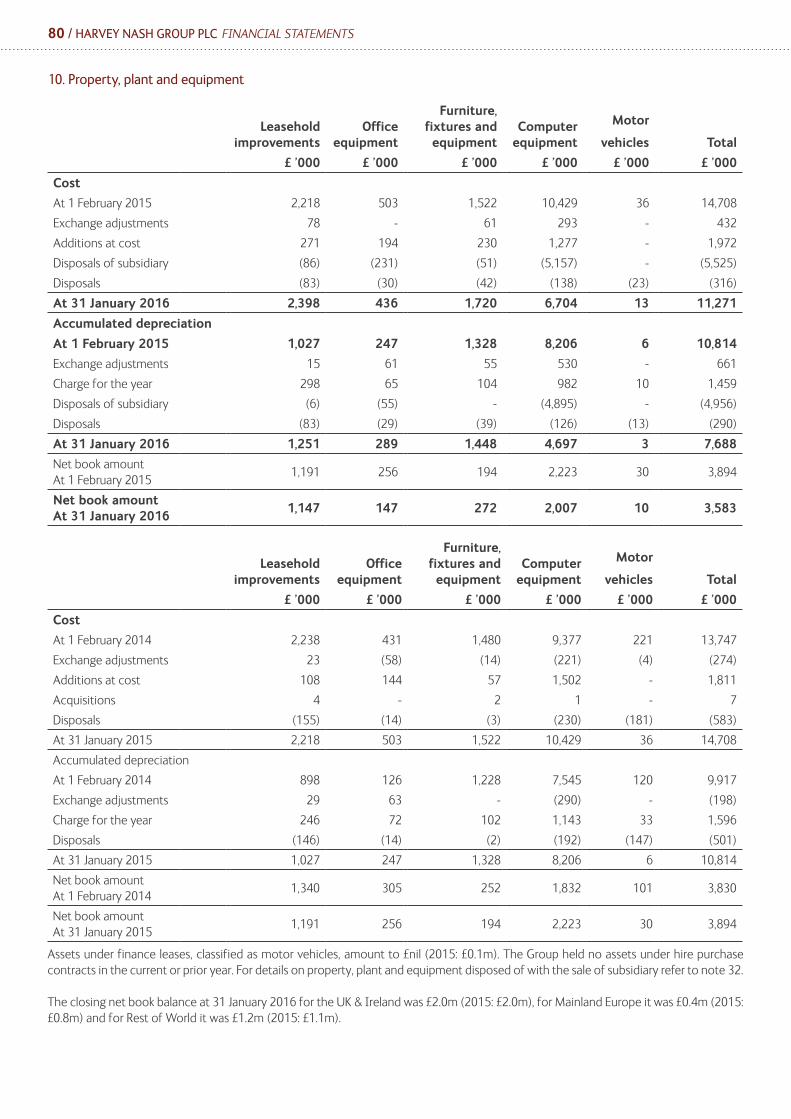
80 / HARVEY NASH GROUP PLC FINANCIAL STATEMENTS
10. Property, plant and equipment
Leasehold improvements
Office equipment
Furniture, fixtures and equipment
Computer equipment
Motor
vehicles Total
£ ’000 £ ’000 £ ’000 £ ’000 £ ’000 £ ’000
Cost
At 1 February 2015 2,218 503 1,522 10,429 36 14,708
Exchange adjustments 78 - 61 293 - 432
Additions at cost 271 194 230 1,277 - 1,972
Disposals of subsidiary (86) (231) (51) (5,157) - (5,525)
Disposals (83) (30) (42) (138) (23) (316)
At 31 January 2016 2,398 436 1,720 6,704 13 11,271
Accumulated depreciation
At 1 February 2015 1,027 247 1,328 8,206 6 10,814
Exchange adjustments 15 61 55 530 - 661
Charge for the year 298 65 104 982 10 1,459
Disposals of subsidiary (6) (55) - (4,895) - (4,956)
Disposals (83) (29) (39) (126) (13) (290)
At 31 January 2016 1,251 289 1,448 4,697 3 7,688
Net book amount At 1 February 2015
1,191 256 194 2,223 30 3,894
Net book amount At 31 January 2016
1,147 147 272 2,007 10 3,583
Leasehold improvements
Office equipment
Furniture, fixtures and equipment
Computer equipment
Motor
vehicles Total
£ ’000 £ ’000 £ ’000 £ ’000 £ ’000 £ ’000
Cost
At 1 February 2014 2,238 431 1,480 9,377 221 13,747
Exchange adjustments 23 (58) (14) (221) (4) (274)
Additions at cost 108 144 57 1,502 - 1,811
Acquisitions 4 - 2 1 - 7
Disposals (155) (14) (3) (230) (181) (583)
At 31 January 2015 2,218 503 1,522 10,429 36 14,708
Accumulated depreciation
At 1 February 2014 898 126 1,228 7,545 120 9,917
Exchange adjustments 29 63 - (290) - (198)
Charge for the year 246 72 102 1,143 33 1,596
Disposals (146) (14) (2) (192) (147) (501)
At 31 January 2015 1,027 247 1,328 8,206 6 10,814
Net book amount At 1 February 2014
1,340 305 252 1,832 101 3,830
Net book amount At 31 January 2015
1,191 256 194 2,223 30 3,894
Assets under finance leases, classified as motor vehicles, amount to £nil (2015: £0.1m). The Group held no assets under hire purchase contracts in the current or prior year. For details on property, plant and equipment disposed of with the sale of subsidiary refer to note 32.
The closing net book balance at 31 January 2016 for the UK & Ireland was £2.0m (2015: £2.0m), for Mainland Europe it was £0.4m (2015: £0.8m) and for Rest of World it was £1.2m (2015: £1.1m).
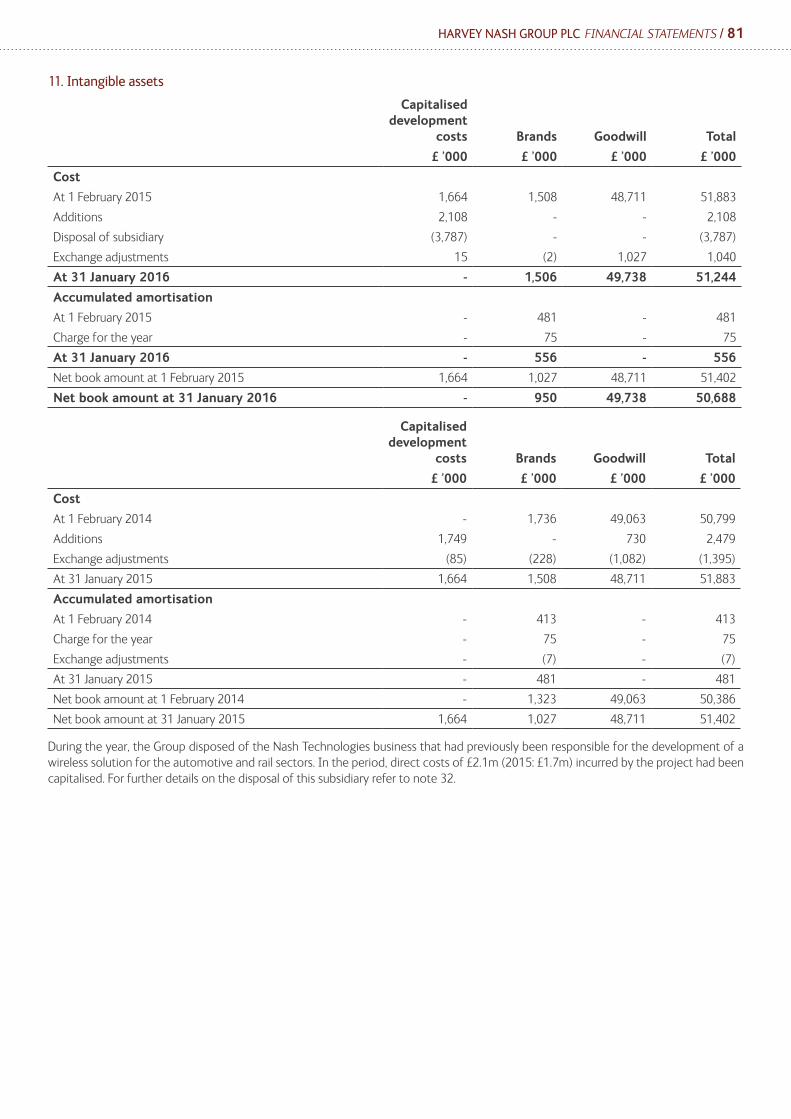
HARVEY NASH GROUP PLC FINANCIAL STATEMENTS / 81
11. Intangible assets
Capitalised development
costs Brands Goodwill Total
£ ’000 £ ’000 £ ’000 £ ’000
Cost
At 1 February 2015 1,664 1,508 48,711 51,883
Additions 2,108 - - 2,108
Disposal of subsidiary (3,787) - - (3,787)
Exchange adjustments 15 (2) 1,027 1,040
At 31 January 2016 - 1,506 49,738 51,244
Accumulated amortisation
At 1 February 2015 - 481 - 481
Charge for the year - 75 - 75
At 31 January 2016 - 556 - 556
Net book amount at 1 February 2015 1,664 1,027 48,711 51,402
Net book amount at 31 January 2016 - 950 49,738 50,688
Capitalised development
costs Brands Goodwill Total
£ ’000 £ ’000 £ ’000 £ ’000
Cost
At 1 February 2014 - 1,736 49,063 50,799
Additions 1,749 - 730 2,479
Exchange adjustments (85) (228) (1,082) (1,395)
At 31 January 2015 1,664 1,508 48,711 51,883
Accumulated amortisation
At 1 February 2014 - 413 - 413
Charge for the year - 75 - 75
Exchange adjustments - (7) - (7)
At 31 January 2015 - 481 - 481
Net book amount at 1 February 2014 - 1,323 49,063 50,386
Net book amount at 31 January 2015 1,664 1,027 48,711 51,402
During the year, the Group disposed of the Nash Technologies business that had previously been responsible for the development of a wireless solution for the automotive and rail sectors. In the period, direct costs of £2.1m (2015: £1.7m) incurred by the project had been capitalised. For further details on the disposal of this subsidiary refer to note 32.
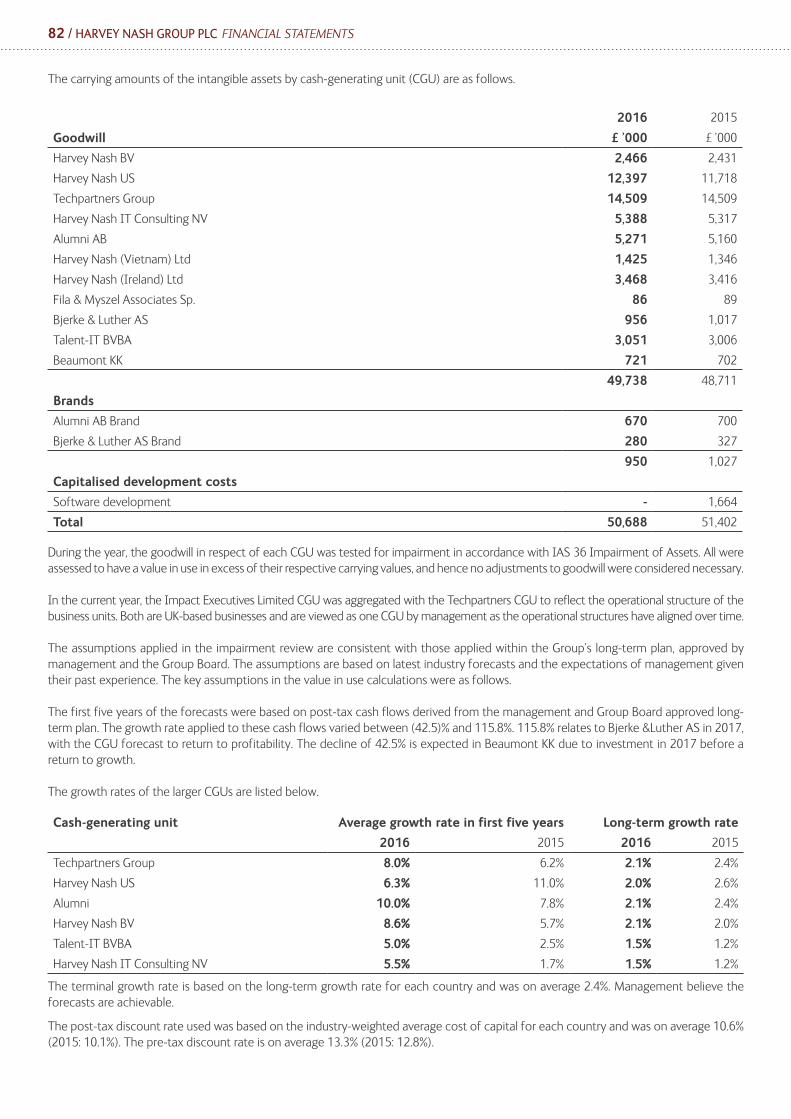
82 / HARVEY NASH GROUP PLC FINANCIAL STATEMENTS
The carrying amounts of the intangible assets by cash-generating unit (CGU) are as follows.
2016 2015
Goodwill £ ’000 £ ’000
Harvey Nash BV 2,466 2,431
Harvey Nash US 12,397 11,718
Techpartners Group 14,509 14,509
Harvey Nash IT Consulting NV 5,388 5,317
Alumni AB 5,271 5,160
Harvey Nash (Vietnam) Ltd 1,425 1,346
Harvey Nash (Ireland) Ltd 3,468 3,416
Fila & Myszel Associates Sp. 86 89
Bjerke & Luther AS 956 1,017
Talent-IT BVBA 3,051 3,006
Beaumont KK 721 702
49,738 48,711
Brands
Alumni AB Brand 670 700
Bjerke & Luther AS Brand 280 327
950 1,027
Capitalised development costs
Software development - 1,664
Total 50,688 51,402
During the year, the goodwill in respect of each CGU was tested for impairment in accordance with IAS 36 Impairment of Assets. All were assessed to have a value in use in excess of their respective carrying values, and hence no adjustments to goodwill were considered necessary.
In the current year, the Impact Executives Limited CGU was aggregated with the Techpartners CGU to reflect the operational structure of the business units. Both are UK-based businesses and are viewed as one CGU by management as the operational structures have aligned over time.
The assumptions applied in the impairment review are consistent with those applied within the Group’s long-term plan, approved by management and the Group Board. The assumptions are based on latest industry forecasts and the expectations of management given their past experience. The key assumptions in the value in use calculations were as follows.
The first five years of the forecasts were based on post-tax cash flows derived from the management and Group Board approved long-term plan. The growth rate applied to these cash flows varied between (42.5)% and 115.8%. 115.8% relates to Bjerke &Luther AS in 2017, with the CGU forecast to return to profitability. The decline of 42.5% is expected in Beaumont KK due to investment in 2017 before a return to growth.
The growth rates of the larger CGUs are listed below.
Cash-generating unit Average growth rate in first five years Long-term growth rate
2016 2015 2016 2015
Techpartners Group 8.0% 6.2% 2.1% 2.4%
Harvey Nash US 6.3% 11.0% 2.0% 2.6%
Alumni 10.0% 7.8% 2.1% 2.4%
Harvey Nash BV 8.6% 5.7% 2.1% 2.0%
Talent-IT BVBA 5.0% 2.5% 1.5% 1.2%
Harvey Nash IT Consulting NV 5.5% 1.7% 1.5% 1.2%
The terminal growth rate is based on the long-term growth rate for each country and was on average 2.4%. Management believe the forecasts are achievable.
The post-tax discount rate used was based on the industry-weighted average cost of capital for each country and was on average 10.6% (2015: 10.1%). The pre-tax discount rate is on average 13.3% (2015: 12.8%).
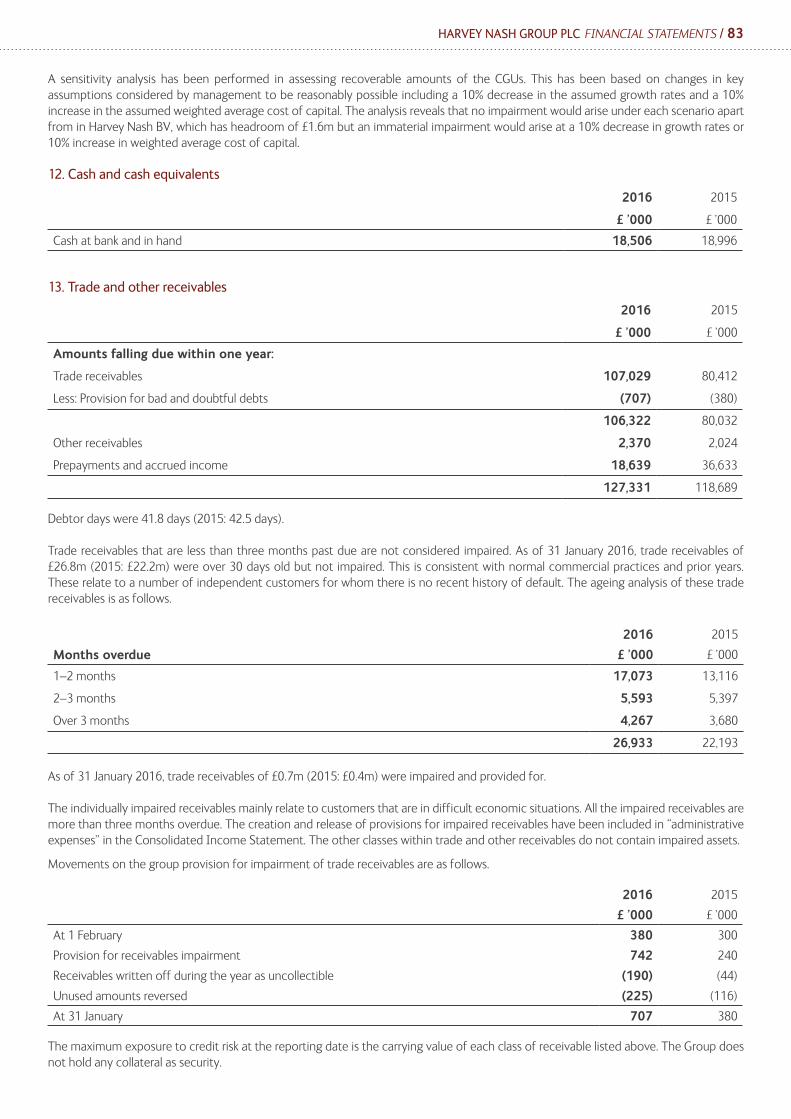
HARVEY NASH GROUP PLC FINANCIAL STATEMENTS / 83
A sensitivity analysis has been performed in assessing recoverable amounts of the CGUs. This has been based on changes in key assumptions considered by management to be reasonably possible including a 10% decrease in the assumed growth rates and a 10% increase in the assumed weighted average cost of capital. The analysis reveals that no impairment would arise under each scenario apart from in Harvey Nash BV, which has headroom of £1.6m but an immaterial impairment would arise at a 10% decrease in growth rates or 10% increase in weighted average cost of capital.
12. Cash and cash equivalents
2016
£ ’000
2015
£ ’000
Cash at bank and in hand 18,506 18,996
13. Trade and other receivables
2016
£ ’000
2015
£ ’000
Amounts falling due within one year:
Trade receivables 107,029 80,412
Less: Provision for bad and doubtful debts (707) (380)
106,322 80,032
Other receivables 2,370 2,024
Prepayments and accrued income 18,639 36,633
127,331 118,689
Debtor days were 41.8 days (2015: 42.5 days).
Trade receivables that are less than three months past due are not considered impaired. As of 31 January 2016, trade receivables of £26.8m (2015: £22.2m) were over 30 days old but not impaired. This is consistent with normal commercial practices and prior years. These relate to a number of independent customers for whom there is no recent history of default. The ageing analysis of these trade receivables is as follows.
2016 2015
Months overdue £ ’000 £ ’000
1–2 months 17,073 13,116
2–3 months 5,593 5,397
Over 3 months 4,267 3,680
26,933 22,193
As of 31 January 2016, trade receivables of £0.7m (2015: £0.4m) were impaired and provided for.
The individually impaired receivables mainly relate to customers that are in difficult economic situations. All the impaired receivables are more than three months overdue. The creation and release of provisions for impaired receivables have been included in “administrative expenses” in the Consolidated Income Statement. The other classes within trade and other receivables do not contain impaired assets.
Movements on the group provision for impairment of trade receivables are as follows.
2016 2015
£ ’000 £ ’000
At 1 February 380 300
Provision for receivables impairment 742 240
Receivables written off during the year as uncollectible (190) (44)
Unused amounts reversed (225) (116)
At 31 January 707 380
The maximum exposure to credit risk at the reporting date is the carrying value of each class of receivable listed above. The Group does not hold any collateral as security.
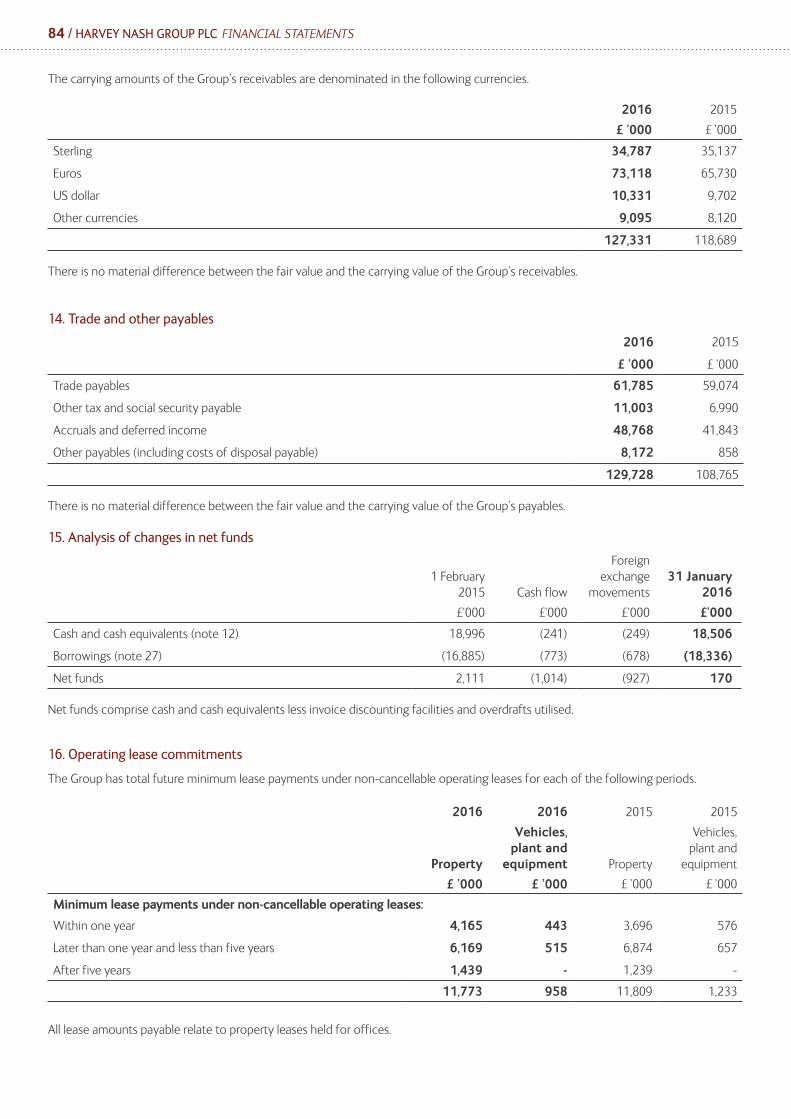
84 / HARVEY NASH GROUP PLC FINANCIAL STATEMENTS
The carrying amounts of the Group’s receivables are denominated in the following currencies.
2016 2015
£ ’000 £ ’000
Sterling 34,787 35,137
Euros 73,118 65,730
US dollar 10,331 9,702
Other currencies 9,095 8,120
127,331 118,689
There is no material difference between the fair value and the carrying value of the Group’s receivables.
14. Trade and other payables
2016
£ ’000
2015
£ ’000
Trade payables 61,785 59,074
Other tax and social security payable 11,003 6,990
Accruals and deferred income 48,768 41,843
Other payables (including costs of disposal payable) 8,172 858
129,728 108,765
There is no material difference between the fair value and the carrying value of the Group’s payables.
15. Analysis of changes in net funds
1 February 2015 Cash flow
Foreign exchange
movements31 January
2016
£’000 £’000 £’000 £’000
Cash and cash equivalents (note 12) 18,996 (241) (249) 18,506
Borrowings (note 27) (16,885) (773) (678) (18,336)
Net funds 2,111 (1,014) (927) 170
Net funds comprise cash and cash equivalents less invoice discounting facilities and overdrafts utilised.
16. Operating lease commitments
The Group has total future minimum lease payments under non-cancellable operating leases for each of the following periods.
2016 2016 2015 2015
Property
Vehicles, plant and
equipment Property
Vehicles, plant and
equipment
£ ’000 £ ’000 £ ’000 £ ’000
Minimum lease payments under non-cancellable operating leases:
Within one year 4,165 443 3,696 576
Later than one year and less than five years 6,169 515 6,874 657
After five years 1,439 - 1,239 -
11,773 958 11,809 1,233
All lease amounts payable relate to property leases held for offices.
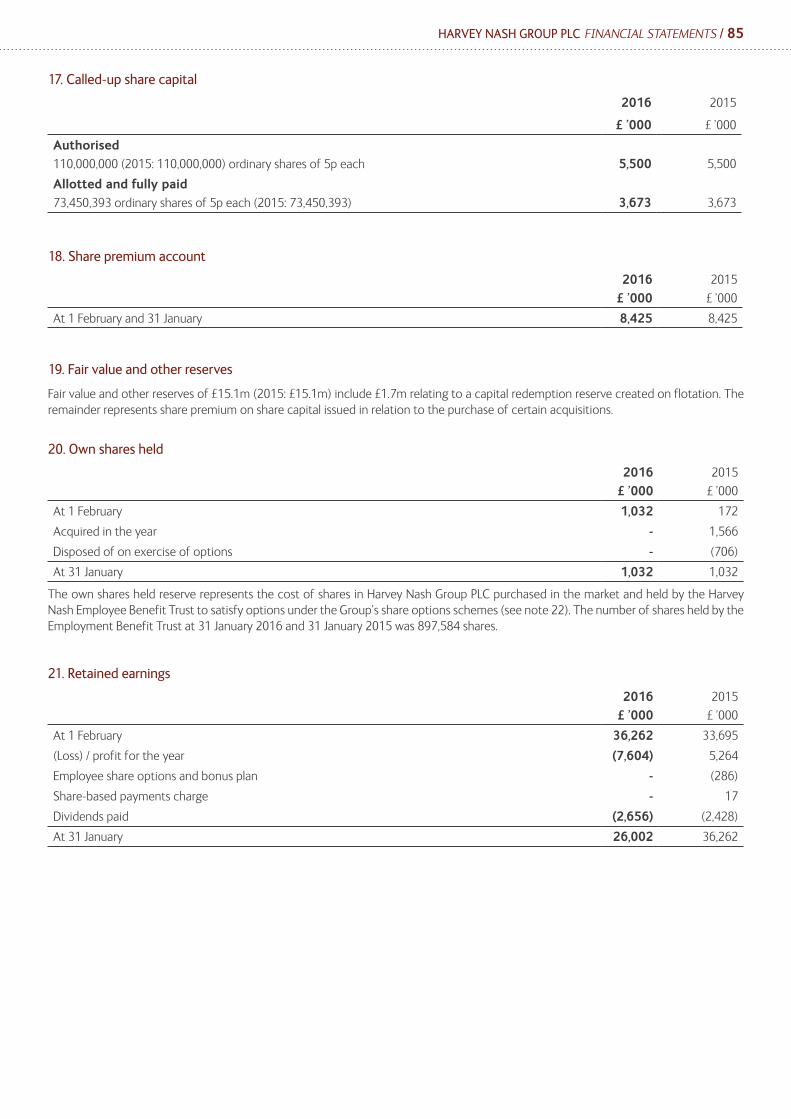
HARVEY NASH GROUP PLC FINANCIAL STATEMENTS / 85
17. Called-up share capital
2016
£ ’000
2015
£ ’000
Authorised110,000,000 (2015: 110,000,000) ordinary shares of 5p each 5,500 5,500
Allotted and fully paid73,450,393 ordinary shares of 5p each (2015: 73,450,393) 3,673 3,673
18. Share premium account
2016£ ’000
2015
£ ’000
At 1 February and 31 January 8,425 8,425
19. Fair value and other reserves
Fair value and other reserves of £15.1m (2015: £15.1m) include £1.7m relating to a capital redemption reserve created on flotation. The remainder represents share premium on share capital issued in relation to the purchase of certain acquisitions.
20. Own shares held
2016£ ’000
2015
£ ’000
At 1 February 1,032 172
Acquired in the year - 1,566
Disposed of on exercise of options - (706)
At 31 January 1,032 1,032
The own shares held reserve represents the cost of shares in Harvey Nash Group PLC purchased in the market and held by the Harvey Nash Employee Benefit Trust to satisfy options under the Group’s share options schemes (see note 22). The number of shares held by the Employment Benefit Trust at 31 January 2016 and 31 January 2015 was 897,584 shares.
21. Retained earnings
2016£ ’000
2015
£ ’000
At 1 February 36,262 33,695
(Loss) / profit for the year (7,604) 5,264
Employee share options and bonus plan - (286)
Share-based payments charge - 17
Dividends paid (2,656) (2,428)
At 31 January 26,002 36,262

86 / HARVEY NASH GROUP PLC FINANCIAL STATEMENTS
22. Share-based payments
Under the Harvey Nash 2005 Company Share Option Plan (CSOP), the Remuneration Committee can grant options over shares in the Company to employees of the Company. Options are granted with a fixed exercise price equal to the market price of the shares under option at the date of grant. The contractual life of an option is 10 years. Awards under the CSOP are open to all full-time employees except those who have had a material interest in the Group in the previous 12 months.
Options granted under the CSOP will become exercisable on the third anniversary of the date of grant, subject to the growth in earnings per share over that period exceeding the compounded annual growth in the Retail Prices Index (“RPI”) by 3% per annum. Options were valued using the Black-Scholes option-pricing model. No performance conditions were included in the fair value calculations.
A reconciliation of option movements over the year to 31 January 2016 is shown below.
2016 2016 2015 2015
Number
(’000)
Weighted average exercise
price
(£)
Number
(’000)
Weighted average exercise
price
(£)
Outstanding at 1 February 810 £0.60 1,425 £0.61
Granted - - - -
Lapsed (680) £0.59 - -
Exercised - - (615) £0.71
Outstanding at 31 January 130 £0.62 810 £0.60
Exercisable at 31 January 130 £0.62 170 £0.60
The CSOP share options in relation to the Directors failed to meet the performance criterion and therefore lapsed at 31 January 2016. This is detailed within the Remuneration Report on page 36. There were no share options exercised during the year. The options outstanding at 31 January 2016 had a weighted average exercise price of £0.62, and a weighted average remaining contractual life of one year.
There was no charge in the year relating to employee share-based payment plans (2015: £17,000). The inputs into the Black-Scholes model are as follows.
2016 2015
Weighted average share price - 6.03p
Weighted average exercise price - 6.06p
Expected volatility - 44.0%
Expected life - 3 years
Risk-free rate - 4.3%
Expected dividend yields - 1.3%
The expected life used in the model has been adjusted, based on management’s best estimate, for the effects of non-transferability, exercise restrictions, and behavioural considerations.
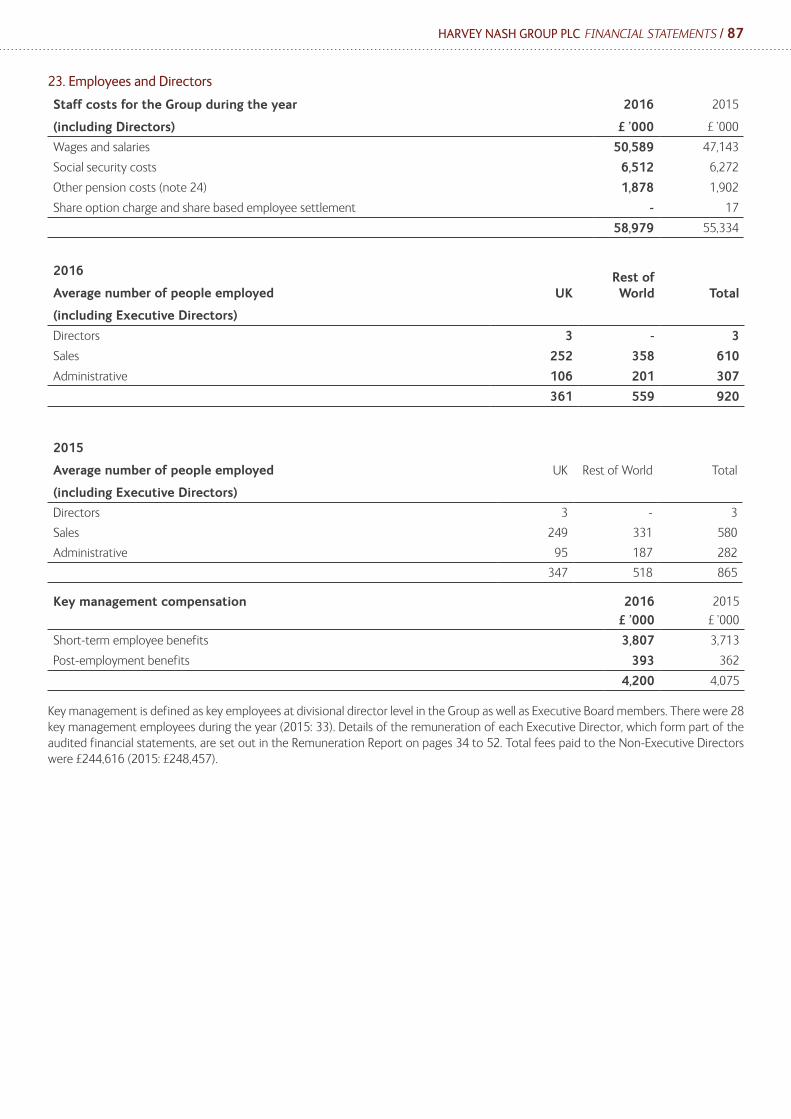
HARVEY NASH GROUP PLC FINANCIAL STATEMENTS / 87
23. Employees and Directors
Staff costs for the Group during the year
(including Directors)
2016
£ ’000
2015
£ ’000
Wages and salaries 50,589 47,143
Social security costs 6,512 6,272
Other pension costs (note 24) 1,878 1,902
Share option charge and share based employee settlement - 17
58,979 55,334
2016
Average number of people employed
(including Executive Directors)
UKRest of World Total
Directors 3 - 3
Sales 252 358 610
Administrative 106 201 307
361 559 920
2015
Average number of people employed
(including Executive Directors)
UK Rest of World Total
Directors 3 - 3
Sales 249 331 580
Administrative 95 187 282
347 518 865
Key management compensation 2016£ ’000
2015
£ ’000
Short-term employee benefits 3,807 3,713
Post-employment benefits 393 362
4,200 4,075
Key management is defined as key employees at divisional director level in the Group as well as Executive Board members. There were 28 key management employees during the year (2015: 33). Details of the remuneration of each Executive Director, which form part of the audited financial statements, are set out in the Remuneration Report on pages 34 to 52. Total fees paid to the Non-Executive Directors were £244,616 (2015: £248,457).
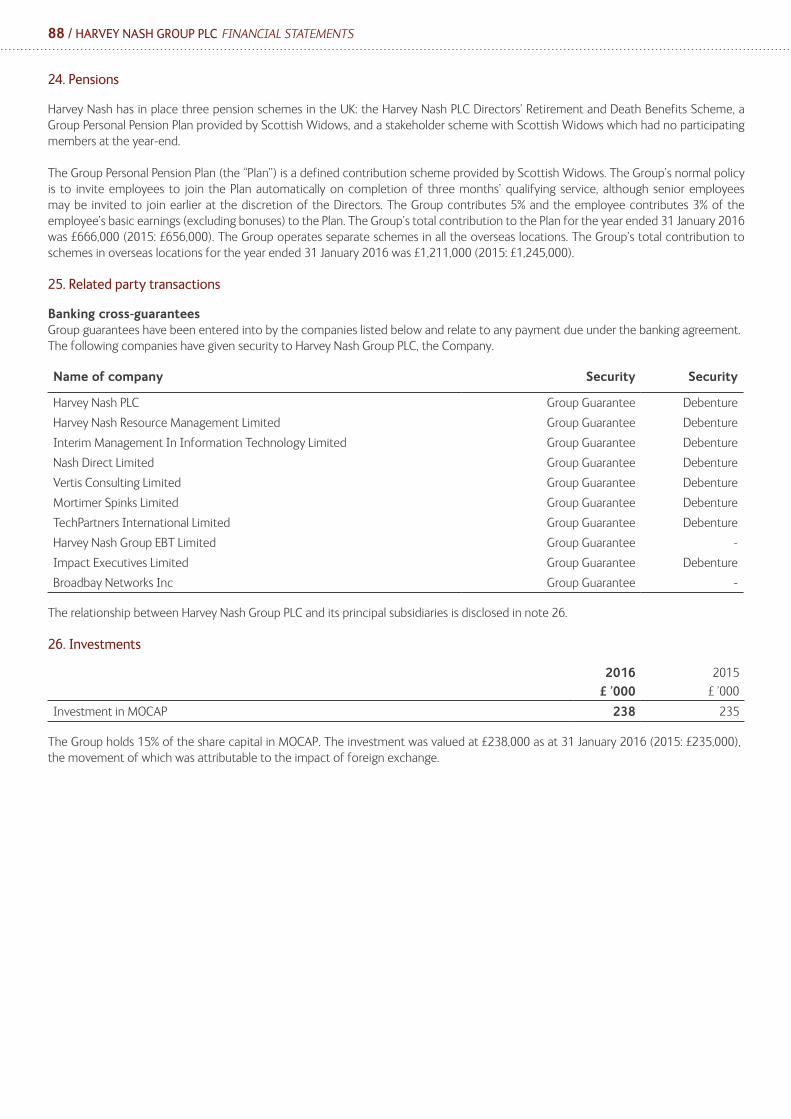
88 / HARVEY NASH GROUP PLC FINANCIAL STATEMENTS
24. Pensions
Harvey Nash has in place three pension schemes in the UK: the Harvey Nash PLC Directors’ Retirement and Death Benefits Scheme, a Group Personal Pension Plan provided by Scottish Widows, and a stakeholder scheme with Scottish Widows which had no participating members at the year-end.
The Group Personal Pension Plan (the “Plan”) is a defined contribution scheme provided by Scottish Widows. The Group’s normal policy is to invite employees to join the Plan automatically on completion of three months’ qualifying service, although senior employees may be invited to join earlier at the discretion of the Directors. The Group contributes 5% and the employee contributes 3% of the employee’s basic earnings (excluding bonuses) to the Plan. The Group’s total contribution to the Plan for the year ended 31 January 2016 was £666,000 (2015: £656,000). The Group operates separate schemes in all the overseas locations. The Group’s total contribution to schemes in overseas locations for the year ended 31 January 2016 was £1,211,000 (2015: £1,245,000).
25. Related party transactions
Banking cross-guaranteesGroup guarantees have been entered into by the companies listed below and relate to any payment due under the banking agreement. The following companies have given security to Harvey Nash Group PLC, the Company.
Name of company Security Security
Harvey Nash PLC Group Guarantee Debenture
Harvey Nash Resource Management Limited Group Guarantee Debenture
Interim Management In Information Technology Limited Group Guarantee Debenture
Nash Direct Limited Group Guarantee Debenture
Vertis Consulting Limited Group Guarantee Debenture
Mortimer Spinks Limited Group Guarantee Debenture
TechPartners International Limited Group Guarantee Debenture
Harvey Nash Group EBT Limited Group Guarantee -
Impact Executives Limited Group Guarantee Debenture
Broadbay Networks Inc Group Guarantee -
The relationship between Harvey Nash Group PLC and its principal subsidiaries is disclosed in note 26.
26. Investments
2016£ ’000
2015
£ ’000
Investment in MOCAP 238 235
The Group holds 15% of the share capital in MOCAP. The investment was valued at £238,000 as at 31 January 2016 (2015: £235,000), the movement of which was attributable to the impact of foreign exchange.

HARVEY NASH GROUP PLC FINANCIAL STATEMENTS / 89
Subsidiaries
The details of the principal subsidiary companies and branches owned directly or indirectly by the Company as at 31 January 2016 were as follows:
Name of company Country of incorporation and operation
Proportion of ordinary share capital and voting rights
Principal activity
Harvey Nash AG Switzerland 100% Recruitment consultancy
Harvey Nash BV The Netherlands 100% Recruitment consultancy
Harvey Nash GmbH Germany 100% Recruitment consultancy
Harvey Nash IT Consulting NV Belgium 100% Recruitment consultancy
Harvey Nash NV Belgium 100% Recruitment consultancy
Harvey Nash PLC United Kingdom 100% Recruitment consultancy
Impact Executives Ltd United Kingdom 100% Recruitment consultancy
Harvey Nash Inc United States 100% Recruitment consultancy
Harvey Nash (Ireland) Ltd Ireland 100% Recruitment consultancy
Alumni AB Sweden 100% Recruitment consultancy
Harvey Nash (Vietnam) Ltd Vietnam 100% Software development
Fila & Myszel Associates Sp. Poland 100% Recruitment consultancy
Bjerke & Luther AS Norway 100% Recruitment consultancy
Talent-IT BVBA Belgium 100% Recruitment consultancy
Beaumont KK Japan 100% Recruitment consultancy
In addition to the companies shown above, the Group also holds investments in a number of other subsidiary undertakings which in the Directors’ opinion do not significantly affect the figures in the consolidated financial statements. A full list of subsidiaries is provided on page 101.
All subsidiary companies are consolidated. The Directors believe that the book value of investments is supported by their underlying net assets.
The Group disposed of its interest in Nash Technologies GmbH on 6 December 2015. Further detail of the disposal is provided within note 32.
In the prior year, the Group acquired 100% of the share capital in Beaumont KK on 21 August 2014. The initial consideration paid was £0.4m, with a further amount payable contingent on the performance of the business over the period from the date of acquisition until 30 June 2017. Deferred consideration of £0.5m has been recognised as at 31 January 2016 (2015: £0.5m) in respect of this. Further detail of the acquisition in the prior year is provided within note 31.
Deferred consideration of £2.0m had been recognised as at 31 January 2015 in respect of the estimated consideration due on completion of the earn-out period that commenced on acquisition of Talent-IT. The deferred consideration was settled during the year; for further details refer to note 30.
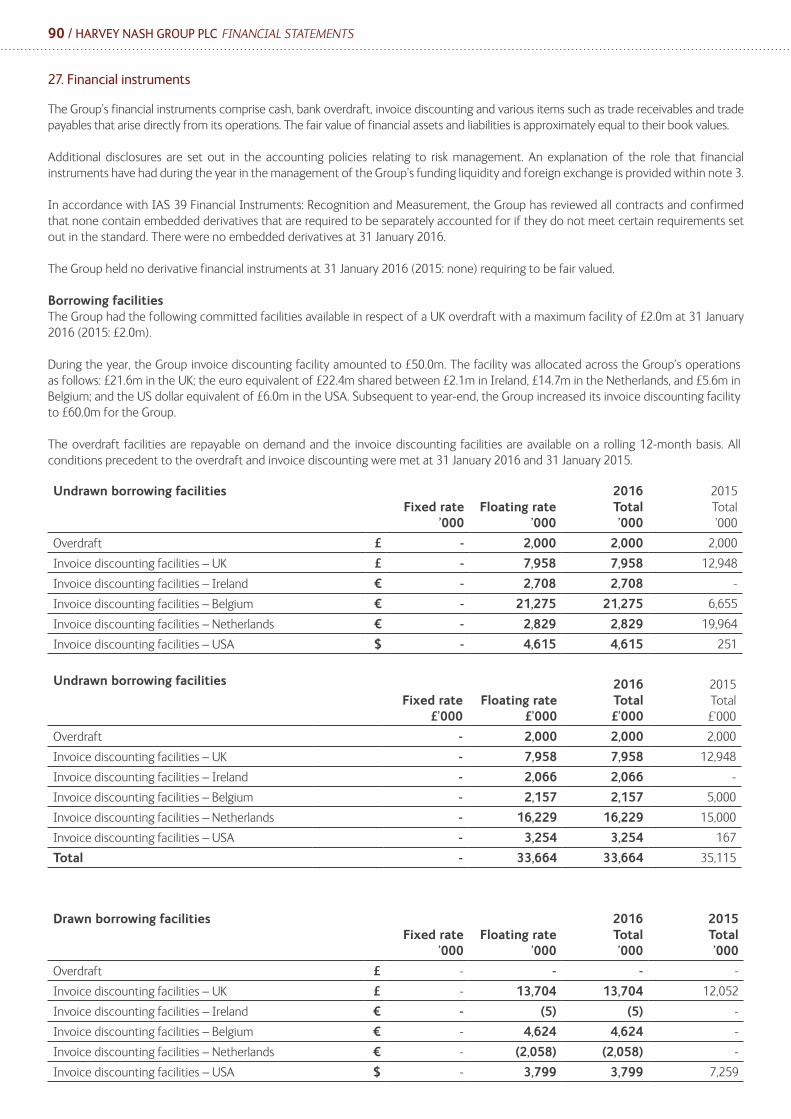
90 / HARVEY NASH GROUP PLC FINANCIAL STATEMENTS
27. Financial instruments
The Group’s financial instruments comprise cash, bank overdraft, invoice discounting and various items such as trade receivables and trade payables that arise directly from its operations. The fair value of financial assets and liabilities is approximately equal to their book values.
Additional disclosures are set out in the accounting policies relating to risk management. An explanation of the role that financial instruments have had during the year in the management of the Group’s funding liquidity and foreign exchange is provided within note 3.
In accordance with IAS 39 Financial Instruments: Recognition and Measurement, the Group has reviewed all contracts and confirmed that none contain embedded derivatives that are required to be separately accounted for if they do not meet certain requirements set out in the standard. There were no embedded derivatives at 31 January 2016.
The Group held no derivative financial instruments at 31 January 2016 (2015: none) requiring to be fair valued.
Borrowing facilitiesThe Group had the following committed facilities available in respect of a UK overdraft with a maximum facility of £2.0m at 31 January 2016 (2015: £2.0m).
During the year, the Group invoice discounting facility amounted to £50.0m. The facility was allocated across the Group’s operations as follows: £21.6m in the UK; the euro equivalent of £22.4m shared between £2.1m in Ireland, £14.7m in the Netherlands, and £5.6m in Belgium; and the US dollar equivalent of £6.0m in the USA. Subsequent to year-end, the Group increased its invoice discounting facility to £60.0m for the Group. The overdraft facilities are repayable on demand and the invoice discounting facilities are available on a rolling 12-month basis. All conditions precedent to the overdraft and invoice discounting were met at 31 January 2016 and 31 January 2015.
Undrawn borrowing facilitiesFixed rate
’000Floating rate
’000
2016 Total’000
2015 Total’000
Overdraft £ - 2,000 2,000 2,000
Invoice discounting facilities – UK £ - 7,958 7,958 12,948
Invoice discounting facilities – Ireland € - 2,708 2,708 -
Invoice discounting facilities – Belgium € - 21,275 21,275 6,655
Invoice discounting facilities – Netherlands € - 2,829 2,829 19,964
Invoice discounting facilities – USA $ - 4,615 4,615 251
Undrawn borrowing facilities
Fixed rate£’000
Floating rate£’000
2016 Total£’000
2015 Total£’000
Overdraft - 2,000 2,000 2,000
Invoice discounting facilities – UK - 7,958 7,958 12,948
Invoice discounting facilities – Ireland - 2,066 2,066 -
Invoice discounting facilities – Belgium - 2,157 2,157 5,000
Invoice discounting facilities – Netherlands - 16,229 16,229 15,000
Invoice discounting facilities – USA - 3,254 3,254 167
Total - 33,664 33,664 35,115
Drawn borrowing facilitiesFixed rate
’000Floating rate
’000
2016 Total’000
2015 Total’000
Overdraft £ - - - -
Invoice discounting facilities – UK £ - 13,704 13,704 12,052
Invoice discounting facilities – Ireland € - (5) (5) -
Invoice discounting facilities – Belgium € - 4,624 4,624 -
Invoice discounting facilities – Netherlands € - (2,058) (2,058) -
Invoice discounting facilities – USA $ - 3,799 3,799 7,259
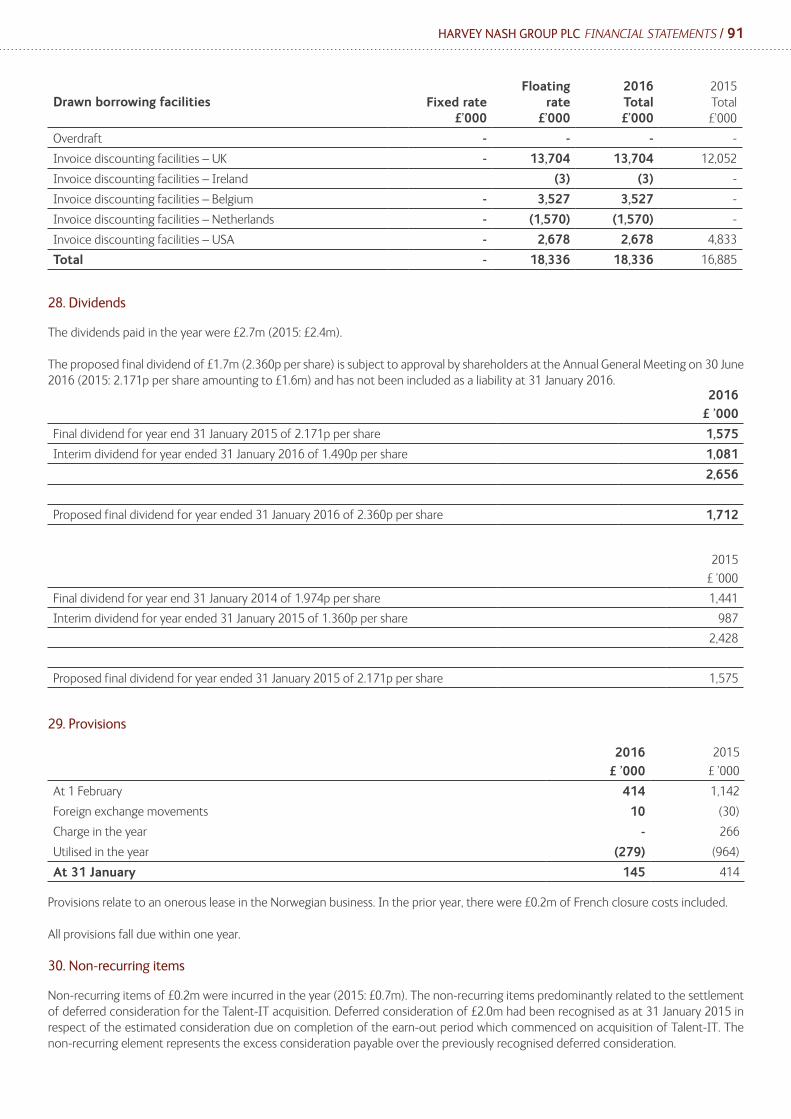
HARVEY NASH GROUP PLC FINANCIAL STATEMENTS / 91
Drawn borrowing facilities Fixed rate£’000
Floating rate
£’000
2016 Total£’000
2015 Total£’000
Overdraft - - - -
Invoice discounting facilities – UK - 13,704 13,704 12,052
Invoice discounting facilities – Ireland (3) (3) -
Invoice discounting facilities – Belgium - 3,527 3,527 -
Invoice discounting facilities – Netherlands - (1,570) (1,570) -
Invoice discounting facilities – USA - 2,678 2,678 4,833
Total - 18,336 18,336 16,885
28. Dividends
The dividends paid in the year were £2.7m (2015: £2.4m).
The proposed final dividend of £1.7m (2.360p per share) is subject to approval by shareholders at the Annual General Meeting on 30 June 2016 (2015: 2.171p per share amounting to £1.6m) and has not been included as a liability at 31 January 2016.
2016£ ’000
Final dividend for year end 31 January 2015 of 2.171p per share 1,575
Interim dividend for year ended 31 January 2016 of 1.490p per share 1,081
2,656
Proposed final dividend for year ended 31 January 2016 of 2.360p per share 1,712
2015
£ ’000
Final dividend for year end 31 January 2014 of 1.974p per share 1,441
Interim dividend for year ended 31 January 2015 of 1.360p per share 987
2,428
Proposed final dividend for year ended 31 January 2015 of 2.171p per share 1,575
29. Provisions
2016£ ’000
2015
£ ’000
At 1 February 414 1,142
Foreign exchange movements 10 (30)
Charge in the year - 266
Utilised in the year (279) (964)
At 31 January 145 414
Provisions relate to an onerous lease in the Norwegian business. In the prior year, there were £0.2m of French closure costs included.
All provisions fall due within one year.
30. Non-recurring items
Non-recurring items of £0.2m were incurred in the year (2015: £0.7m). The non-recurring items predominantly related to the settlement of deferred consideration for the Talent-IT acquisition. Deferred consideration of £2.0m had been recognised as at 31 January 2015 in respect of the estimated consideration due on completion of the earn-out period which commenced on acquisition of Talent-IT. The non-recurring element represents the excess consideration payable over the previously recognised deferred consideration.
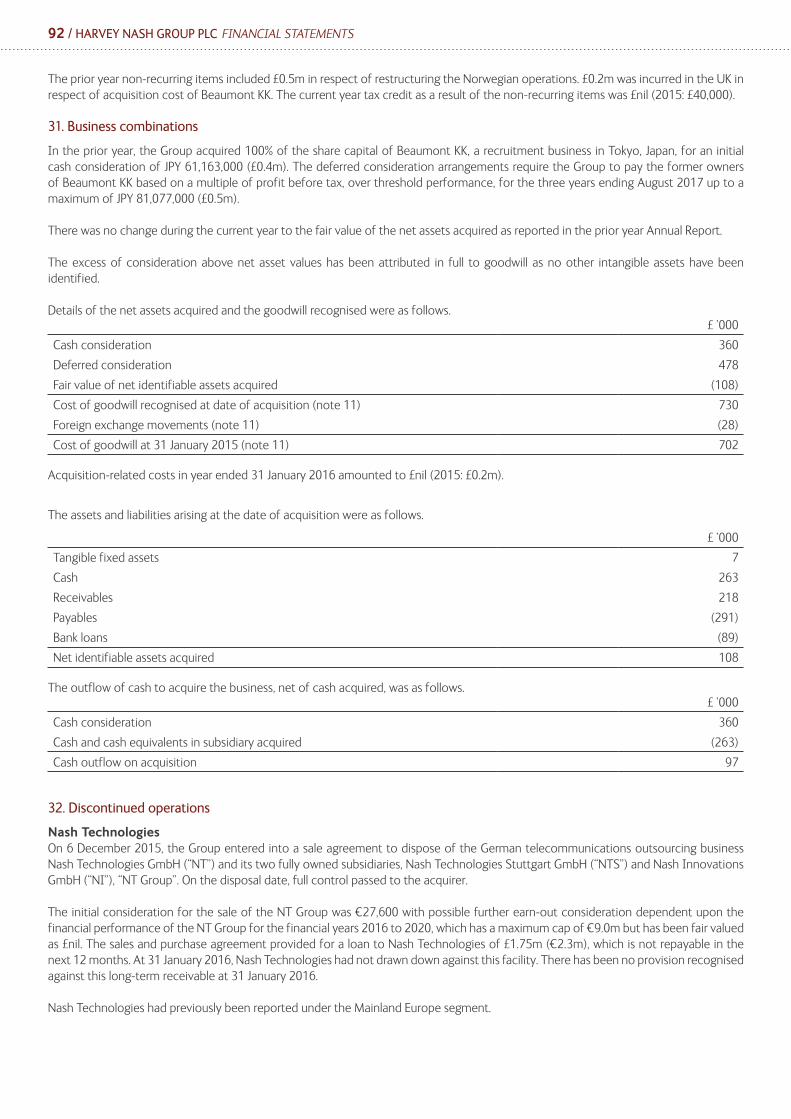
92 / HARVEY NASH GROUP PLC FINANCIAL STATEMENTS
The prior year non-recurring items included £0.5m in respect of restructuring the Norwegian operations. £0.2m was incurred in the UK in respect of acquisition cost of Beaumont KK. The current year tax credit as a result of the non-recurring items was £nil (2015: £40,000).
31. Business combinations
In the prior year, the Group acquired 100% of the share capital of Beaumont KK, a recruitment business in Tokyo, Japan, for an initial cash consideration of JPY 61,163,000 (£0.4m). The deferred consideration arrangements require the Group to pay the former owners of Beaumont KK based on a multiple of profit before tax, over threshold performance, for the three years ending August 2017 up to a maximum of JPY 81,077,000 (£0.5m).
There was no change during the current year to the fair value of the net assets acquired as reported in the prior year Annual Report.
The excess of consideration above net asset values has been attributed in full to goodwill as no other intangible assets have been identified.
Details of the net assets acquired and the goodwill recognised were as follows.£ ’000
Cash consideration 360
Deferred consideration 478
Fair value of net identifiable assets acquired (108)
Cost of goodwill recognised at date of acquisition (note 11) 730
Foreign exchange movements (note 11) (28)
Cost of goodwill at 31 January 2015 (note 11) 702
Acquisition-related costs in year ended 31 January 2016 amounted to £nil (2015: £0.2m).
The assets and liabilities arising at the date of acquisition were as follows.
£ ’000
Tangible fixed assets 7
Cash 263
Receivables 218
Payables (291)
Bank loans (89)
Net identifiable assets acquired 108
The outflow of cash to acquire the business, net of cash acquired, was as follows.£ ’000
Cash consideration 360
Cash and cash equivalents in subsidiary acquired (263)
Cash outflow on acquisition 97
32. Discontinued operations
Nash TechnologiesOn 6 December 2015, the Group entered into a sale agreement to dispose of the German telecommunications outsourcing business Nash Technologies GmbH (“NT”) and its two fully owned subsidiaries, Nash Technologies Stuttgart GmbH (“NTS”) and Nash Innovations GmbH (“NI”), “NT Group”. On the disposal date, full control passed to the acquirer.
The initial consideration for the sale of the NT Group was €27,600 with possible further earn-out consideration dependent upon the financial performance of the NT Group for the financial years 2016 to 2020, which has a maximum cap of €9.0m but has been fair valued as £nil. The sales and purchase agreement provided for a loan to Nash Technologies of £1.75m (€2.3m), which is not repayable in the next 12 months. At 31 January 2016, Nash Technologies had not drawn down against this facility. There has been no provision recognised against this long-term receivable at 31 January 2016.
Nash Technologies had previously been reported under the Mainland Europe segment.
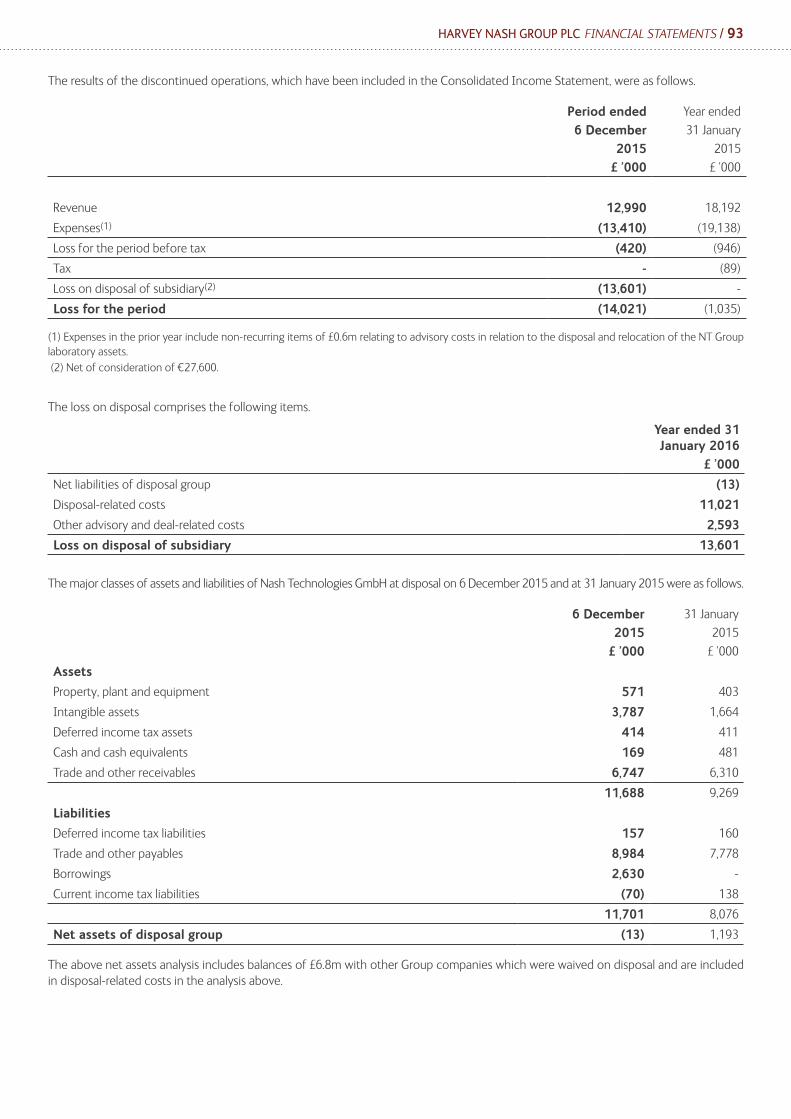
HARVEY NASH GROUP PLC FINANCIAL STATEMENTS / 93
The results of the discontinued operations, which have been included in the Consolidated Income Statement, were as follows.
Period ended 6 December
2015£ ’000
Year ended
31 January
2015
£ ’000
Revenue 12,990 18,192
Expenses(1) (13,410) (19,138)
Loss for the period before tax (420) (946)
Tax - (89)
Loss on disposal of subsidiary(2) (13,601) -
Loss for the period (14,021) (1,035)
(1) Expenses in the prior year include non-recurring items of £0.6m relating to advisory costs in relation to the disposal and relocation of the NT Group laboratory assets.
(2) Net of consideration of €27,600.
The loss on disposal comprises the following items.
Year ended 31 January 2016
£ ’000
Net liabilities of disposal group (13)
Disposal-related costs 11,021
Other advisory and deal-related costs 2,593
Loss on disposal of subsidiary 13,601
The major classes of assets and liabilities of Nash Technologies GmbH at disposal on 6 December 2015 and at 31 January 2015 were as follows.
6 December 2015
£ ’000
31 January
2015
£ ’000
Assets
Property, plant and equipment 571 403
Intangible assets 3,787 1,664
Deferred income tax assets 414 411
Cash and cash equivalents 169 481
Trade and other receivables 6,747 6,310
11,688 9,269
Liabilities
Deferred income tax liabilities 157 160
Trade and other payables 8,984 7,778
Borrowings 2,630 -
Current income tax liabilities (70) 138
11,701 8,076
Net assets of disposal group (13) 1,193
The above net assets analysis includes balances of £6.8m with other Group companies which were waived on disposal and are included in disposal-related costs in the analysis above.

94 / HARVEY NASH GROUP PLC FINANCIAL STATEMENTS
The net cash flow used in Nash Technologies
Period ended 6 December
2015£ ’000
Year ended
31 January
2015
£ ’000
Operating cash flows (354) (1,230)
Investing cash flows (2,372) (1,971)
Financing cash flows (17) -
Net cash outflow (2,743) (3,201)
Oil and Gas During the year, a decision was made to close the Oil & Gas business, which separately focused on recruiting international engineering and technology candidates for mainly Middle East-based companies in the energy sector.
The results of the discontinued Oil & Gas business, which have been included in the Consolidated Income Statement, were as follows.
2016£ ’000
2015
£ ’000
Revenue 106 515
Expenses (338) (409)
Non-recurring costs (186) -
Loss for the period before tax (418) 106
Tax - -
Loss for the period (418) 106
There were no assets or liabilities directly attributable to the Oil and Gas business at 31 January 2016 and 31 January 2015. Cash outflows used in the operating activities of the Oil and Gas business were £0.4m (2015: cash generated from operating activities £0.1m). The Oil and Gas division had previously been reported under the United Kingdom & Ireland segment.

Financial statements for the Parent Company Harvey Nash Group plc, the Company
under FRS 101
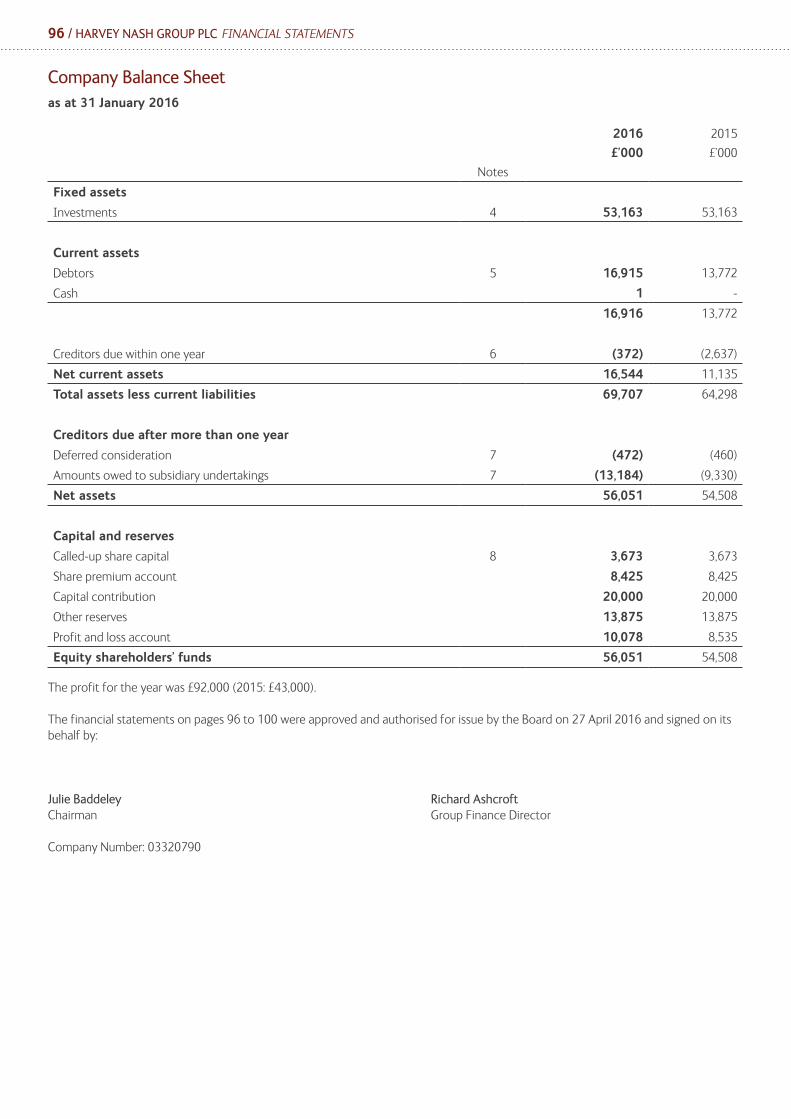
96 / HARVEY NASH GROUP PLC FINANCIAL STATEMENTS
Company Balance Sheet as at 31 January 2016
Notes
2016
£’000
2015
£’000
Fixed assets
Investments 4 53,163 53,163
Current assets
Debtors 5 16,915 13,772
Cash 1 -
16,916 13,772
Creditors due within one year 6 (372) (2,637)
Net current assets 16,544 11,135
Total assets less current liabilities 69,707 64,298
Creditors due after more than one year
Deferred consideration 7 (472) (460)
Amounts owed to subsidiary undertakings 7 (13,184) (9,330)
Net assets 56,051 54,508
Capital and reserves
Called-up share capital 8 3,673 3,673
Share premium account 8,425 8,425
Capital contribution 20,000 20,000
Other reserves 13,875 13,875
Profit and loss account 10,078 8,535
Equity shareholders’ funds 56,051 54,508
The profit for the year was £92,000 (2015: £43,000).
The financial statements on pages 96 to 100 were approved and authorised for issue by the Board on 27 April 2016 and signed on its behalf by:
Julie Baddeley Richard Ashcroft Chairman Group Finance Director
Company Number: 03320790
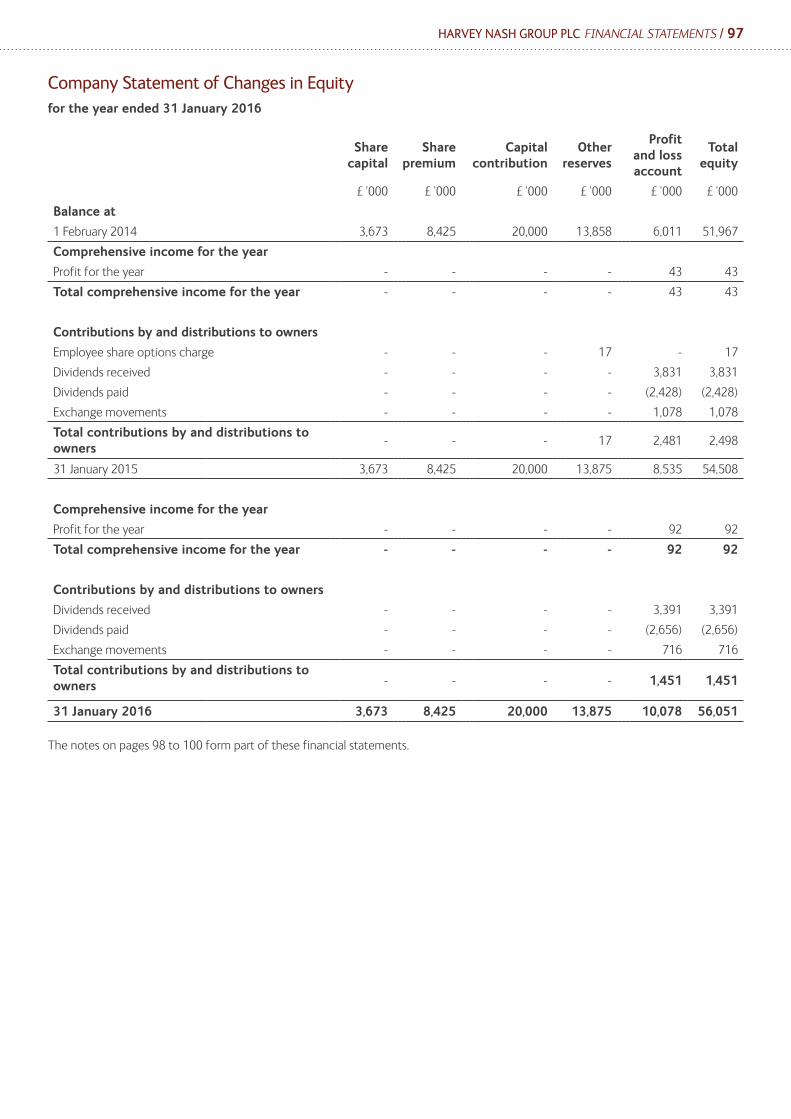
HARVEY NASH GROUP PLC FINANCIAL STATEMENTS / 97
Company Statement of Changes in Equity for the year ended 31 January 2016
Share capital
Share premium
Capital contribution
Other reserves
Profit and loss account
Total equity
£ ’000 £ ’000 £ ’000 £ ’000 £ ’000 £ ’000
Balance at
1 February 2014 3,673 8,425 20,000 13,858 6,011 51,967
Comprehensive income for the year
Profit for the year - - - - 43 43
Total comprehensive income for the year - - - - 43 43
Contributions by and distributions to owners
Employee share options charge - - - 17 - 17
Dividends received - - - - 3,831 3,831
Dividends paid - - - - (2,428) (2,428)
Exchange movements - - - - 1,078 1,078
Total contributions by and distributions to owners
- - - 17 2,481 2,498
31 January 2015 3,673 8,425 20,000 13,875 8,535 54,508
Comprehensive income for the year
Profit for the year - - - - 92 92
Total comprehensive income for the year - - - - 92 92
Contributions by and distributions to owners
Dividends received - - - - 3,391 3,391
Dividends paid - - - - (2,656) (2,656)
Exchange movements - - - - 716 716
Total contributions by and distributions to owners - - - - 1,451 1,451
31 January 2016 3,673 8,425 20,000 13,875 10,078 56,051
The notes on pages 98 to 100 form part of these financial statements.

98 / HARVEY NASH GROUP PLC FINANCIAL STATEMENTS
Notes to the Financial Statements
1. Basis of preparationThe Company is incorporated in the United Kingdom under the Companies Act 2006. The address of the registered office is given on page 8. The nature of the Company’s operations and its principal activities are set out in the Strategic Report on pages 12 to 25 of the consolidated financial statements.
The Company meets the definition of a qualifying entity under Financial Reporting Standard 100 (“FRS 100”) issued by the Financial Reporting Council. Accordingly, in the year ended 31 January 2016, the Company has changed its accounting framework from UK GAAP to Financial Reporting Standard 101 (“FRS 101”) as issued by the Financial Reporting Council and has, in doing so, applied the requirements of IFRS 1.6–33 and related appendices. These financial statements were prepared in accordance with FRS 101 Reduced Disclosure Framework as issued by the Financial Reporting Council. There were no material adjustments to total comprehensive income or equity upon restatement.
The financial statements have been prepared on the historical cost basis, which is generally based on the fair value of the consideration given in exchange for the goods and services. The principal accounting policies adopted are set out below.
As permitted by FRS 101, the Company has taken advantage of the disclosure exemptions available under that standard in relation to business combinations, share-based payment, non-current assets held for sale, financial instruments, capital management, presentation of comparative information in respect of certain assets, presentation of a cash flow statement, standards not yet effective, impairment of assets and related party transactions. Where required, equivalent disclosures are given in the Group accounts.
Going concernThe Directors have a reasonable expectation that the Company has adequate resources to continue in operational existence for the foreseeable future. Thus they continue to adopt the going concern basis of accounting in preparing the annual financial statements. For further information please refer to the note on going concern in the Notes to the consolidated financial statements on page 68.
2. Critical judgement areas and key sources of estimation uncertaintyThe key assumptions concerning the future, and other key sources of estimation uncertainty at the balance sheet date, that have a significant risk of causing a material adjustment to the carrying amounts of assets and liabilities within the next financial year are discussed below.
Impairment of investments in subsidiariesDetermining whether the Company’s investments in subsidiaries have been impaired requires estimations of the investments’ values in use. The value in use calculations require the entity to estimate the future cash flows expected to arise from the investments and suitable discount rates in order to calculate present values which are inherently judgemental and complex in calculation. The carrying amount of investments in subsidiaries at the balance sheet date was £53.1m with no impairment loss recognised in 2015 or 2016.
3. Accounting policiesThe accounting policies applied in the consolidated financial statements of Harvey Nash Group PLC are consistent with those presented herein.
(a) Foreign exchangeTransactions in currencies other than the functional currency are recorded at the rate of exchange at the date of the transaction. Monetary assets and liabilities denominated in foreign currencies at the balance sheet date are reported at the rates of exchange prevailing at that date. Non-monetary items that are measured in terms of historical cost in a foreign currency are not retranslated.
(b) TaxationDeferred tax is the tax expected to be payable or recoverable on differences between the carrying amounts of assets and liabilities in the financial statements and the corresponding tax bases used in the computation of taxable profit, and is accounted for using the balance sheet liability method. Deferred tax liabilities are generally recognised for all taxable temporary differences and deferred tax assets are recognised to the extent that it is probable that taxable profits will be available against which deductible temporary differences can be utilised.
(c) Investments Investments held as fixed assets are shown at cost less provision for impairment. Impairment reviews are conducted annually and whenever events or changes in circumstances indicate that the carrying amount may not be recoverable. An impairment loss is recognised in the income statement for the amount by which the asset’s carrying amount exceeds its recoverable amount.
The recoverable amount is the higher of the asset’s fair value less costs of sale and value in use. In assessing value in use, the estimated future cash flows are discounted to their present value using a post-tax discount rate that reflects current market assessments of the time value of money and the risks specific to the asset for which the estimates of future cash flows have not been adjusted. Assets are grouped at the lowest levels for which there are separately identifiable cash flows (cash-generating units).

HARVEY NASH GROUP PLC FINANCIAL STATEMENTS / 99
(d) Dividend distributionsDividend distributions to the Company’s shareholders are recognised as a liability in the Company’s financial statements in the period in which the dividends are approved by the Company’s shareholders. Interim dividends are recognised when paid.
4. Investments
Fixed asset investments
Shares in Group undertakings £ ’000
At 1 February 2014 52,308
Acquisition of Beaumont KK 838
Share options 17
At 1 February 2015 53,163
Share options -
At 31 January 2016 53,163
The Directors believe that the carrying value of the investments is supported by their underlying net assets.
The carrying value of the investments was tested against discounted future cash flows during the year. The forecasts were based on post-tax cash flows derived from approved budgets for FY16–FY17. Management believe the forecasts are reasonably achievable. Where the future cash flows could not support the carrying value, an impairment would be recognised.
Principal subsidiaries and associatesThe details of the principal subsidiary companies and branches owned directly or indirectly by Harvey Nash PLC, the Company, as at 31 January 2016 were as follows.
Name of company
Country of incorporation and
operation
Proportion of ordinary share capital and voting
rights Principal activity
Harvey Nash AG Switzerland 100% Recruitment consultancy
Harvey Nash BV The Netherlands 100% Recruitment consultancy
Harvey Nash GmbH Germany 100% Recruitment consultancy
Harvey Nash IT Consulting NV Belgium 100% Recruitment consultancy
Harvey Nash NV Belgium 100% Recruitment consultancy
Harvey Nash PLC United Kingdom 100% Recruitment consultancy
Impact Executives Ltd United Kingdom 100% Recruitment consultancy
Harvey Nash Inc United States 100% Recruitment consultancy
Harvey Nash (Ireland) Ltd Ireland 100% Recruitment consultancy
Alumni AB Sweden 100% Recruitment consultancy
Harvey Nash (Vietnam) Ltd Vietnam 100% Software development
Fila & Myszel Associates Sp. Poland 100% Recruitment consultancy
Bjerke & Luther AS Norway 100% Recruitment consultancy
Talent-IT BVBA Belgium 100% Recruitment consultancy
Beaumont KK Japan 100% Recruitment consultancy
A full list of subsidiaries is presented on page 101.
5. Debtors2016£’000
2015£’000
Amounts owed by subsidiary undertakings 16,915 13,722 Interest is charged at market rate on intercompany funding balances in accordance with formal loan agreements between the parties.
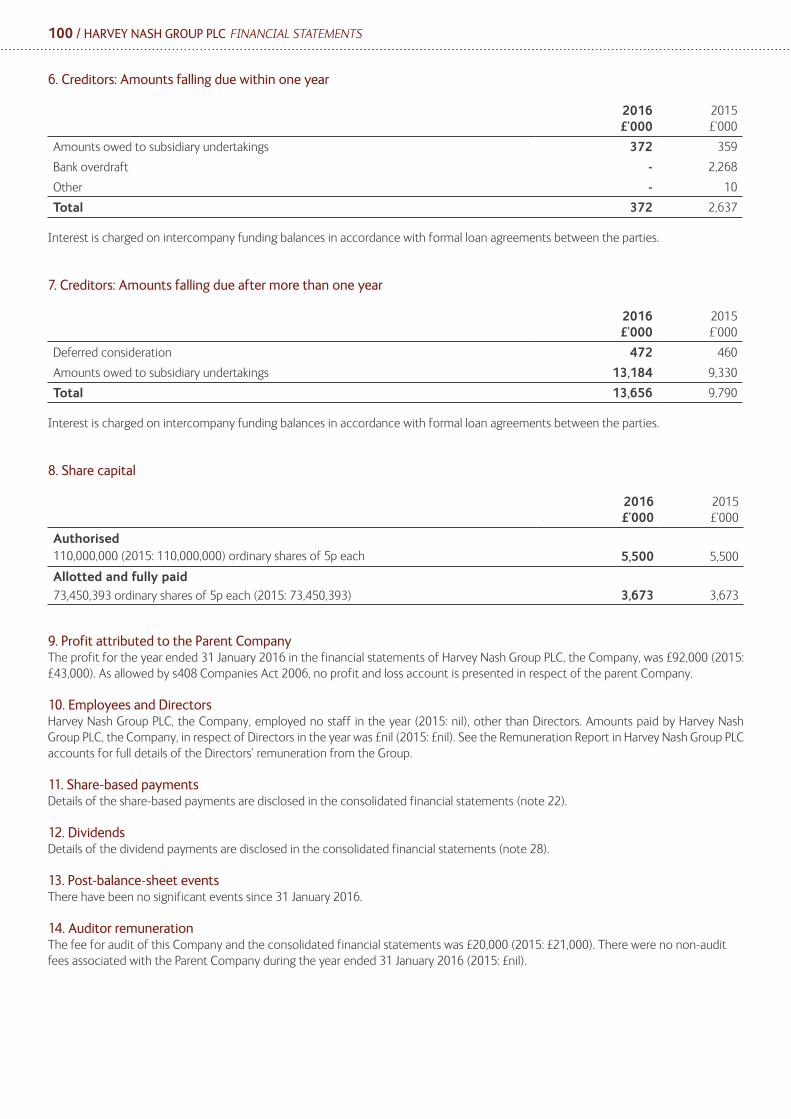
100 / HARVEY NASH GROUP PLC FINANCIAL STATEMENTS
6. Creditors: Amounts falling due within one year
2016£’000
2015£’000
Amounts owed to subsidiary undertakings 372 359
Bank overdraft - 2,268
Other - 10
Total 372 2,637
Interest is charged on intercompany funding balances in accordance with formal loan agreements between the parties.
7. Creditors: Amounts falling due after more than one year
2016£’000
2015£’000
Deferred consideration 472 460
Amounts owed to subsidiary undertakings 13,184 9,330
Total 13,656 9,790
Interest is charged on intercompany funding balances in accordance with formal loan agreements between the parties.
8. Share capital
2016£’000
2015£’000
Authorised110,000,000 (2015: 110,000,000) ordinary shares of 5p each 5,500 5,500
Allotted and fully paid73,450,393 ordinary shares of 5p each (2015: 73,450,393) 3,673 3,673
9. Profit attributed to the Parent CompanyThe profit for the year ended 31 January 2016 in the financial statements of Harvey Nash Group PLC, the Company, was £92,000 (2015: £43,000). As allowed by s408 Companies Act 2006, no profit and loss account is presented in respect of the parent Company.
10. Employees and DirectorsHarvey Nash Group PLC, the Company, employed no staff in the year (2015: nil), other than Directors. Amounts paid by Harvey Nash Group PLC, the Company, in respect of Directors in the year was £nil (2015: £nil). See the Remuneration Report in Harvey Nash Group PLC accounts for full details of the Directors’ remuneration from the Group.
11. Share-based paymentsDetails of the share-based payments are disclosed in the consolidated financial statements (note 22).
12. DividendsDetails of the dividend payments are disclosed in the consolidated financial statements (note 28).
13. Post-balance-sheet eventsThere have been no significant events since 31 January 2016.
14. Auditor remunerationThe fee for audit of this Company and the consolidated financial statements was £20,000 (2015: £21,000). There were no non-audit fees associated with the Parent Company during the year ended 31 January 2016 (2015: £nil).
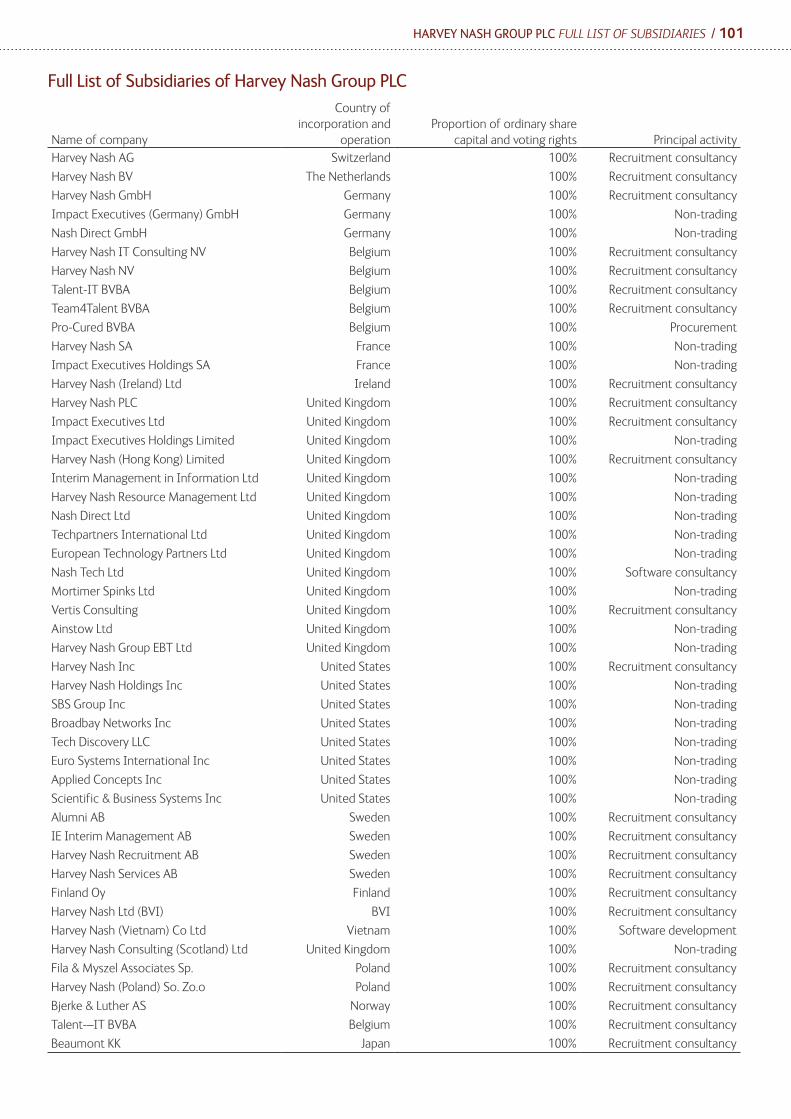
HARVEY NASH GROUP PLC FULL LIST OF SUBSIDIARIES / 101
Full List of Subsidiaries of Harvey Nash Group PLC
Name of company
Country of incorporation and
operationProportion of ordinary share
capital and voting rights Principal activity
Harvey Nash AG Switzerland 100% Recruitment consultancy
Harvey Nash BV The Netherlands 100% Recruitment consultancy
Harvey Nash GmbH Germany 100% Recruitment consultancy
Impact Executives (Germany) GmbH Germany 100% Non-trading
Nash Direct GmbH Germany 100% Non-trading
Harvey Nash IT Consulting NV Belgium 100% Recruitment consultancy
Harvey Nash NV Belgium 100% Recruitment consultancy
Talent-IT BVBA Belgium 100% Recruitment consultancy
Team4Talent BVBA Belgium 100% Recruitment consultancy
Pro-Cured BVBA Belgium 100% Procurement
Harvey Nash SA France 100% Non-trading
Impact Executives Holdings SA France 100% Non-trading
Harvey Nash (Ireland) Ltd Ireland 100% Recruitment consultancy
Harvey Nash PLC United Kingdom 100% Recruitment consultancy
Impact Executives Ltd United Kingdom 100% Recruitment consultancy
Impact Executives Holdings Limited United Kingdom 100% Non-trading
Harvey Nash (Hong Kong) Limited United Kingdom 100% Recruitment consultancy
Interim Management in Information Ltd United Kingdom 100% Non-trading
Harvey Nash Resource Management Ltd United Kingdom 100% Non-trading
Nash Direct Ltd United Kingdom 100% Non-trading
Techpartners International Ltd United Kingdom 100% Non-trading
European Technology Partners Ltd United Kingdom 100% Non-trading
Nash Tech Ltd United Kingdom 100% Software consultancy
Mortimer Spinks Ltd United Kingdom 100% Non-trading
Vertis Consulting United Kingdom 100% Recruitment consultancy
Ainstow Ltd United Kingdom 100% Non-trading
Harvey Nash Group EBT Ltd United Kingdom 100% Non-trading
Harvey Nash Inc United States 100% Recruitment consultancy
Harvey Nash Holdings Inc United States 100% Non-trading
SBS Group Inc United States 100% Non-trading
Broadbay Networks Inc United States 100% Non-trading
Tech Discovery LLC United States 100% Non-trading
Euro Systems International Inc United States 100% Non-trading
Applied Concepts Inc United States 100% Non-trading
Scientific & Business Systems Inc United States 100% Non-trading
Alumni AB Sweden 100% Recruitment consultancy
IE Interim Management AB Sweden 100% Recruitment consultancy
Harvey Nash Recruitment AB Sweden 100% Recruitment consultancy
Harvey Nash Services AB Sweden 100% Recruitment consultancy
Finland Oy Finland 100% Recruitment consultancy
Harvey Nash Ltd (BVI) BVI 100% Recruitment consultancy
Harvey Nash (Vietnam) Co Ltd Vietnam 100% Software development
Harvey Nash Consulting (Scotland) Ltd United Kingdom 100% Non-trading
Fila & Myszel Associates Sp. Poland 100% Recruitment consultancy
Harvey Nash (Poland) So. Zo.o Poland 100% Recruitment consultancy
Bjerke & Luther AS Norway 100% Recruitment consultancy
Talent-–IT BVBA Belgium 100% Recruitment consultancy
Beaumont KK Japan 100% Recruitment consultancy


103 / HARVEY NASH GROUP PLC OFFICE LOCATIONS
USANew JerseyU.S. Corporate Headquarters, 1680 Route 23 North, Suite 300, Wayne,NJ 07470, USATel: +1 (973) 646 2100
California475 Sansome Street, Suite 1710San Francisco, CA 94111, USATel: +1 (720) 935-7433
Illinois415 North LaSalle, Suite 202, Chicago,IL 60654, USATel: +1 (312) 379 7470
Houston11152 Westheimer Road, Suite 1010Houston, TX 77042, USATel: +1 (281) 574-7516
Colorado 4700 S. Syracuse Street,Suite 800, Denver, CO 80237, USATel: +1 (303) 244-9608
New York 60 E 42nd Street, Suite 2206, New York,NY 10165, USATel: +1 (212) 481 1317
Massachusetts844 Franklin Street, Unit 5AWrentham, MA 02093, USATel: +1 (508) 384-3806
Washington2101 Fourth Avenue, Suite 720, SeattleWA 98121, USATel: +1 (206) 956 9200
ASIA PACIFICVietnamHanoi, Unit 702, 6th Floor, HITC Building,239 Xuan Thuy Road, Cau Giay District, Hanoi, VietnamTel: +84 (0)4 834 2050
Ho Chi Minh City, Athena, 146 - 148 Cong Hoa Street,Tan Binh District, Ho Chi Minh City, VietnamTel: +84 (0)8 810 6200
Ho Chi Minh City, e.town, 364 Cong Hoa Street,Tan Binh District, Ho Chi Minh City, VietnamTel: +84 (0)8 810 6200
Hong KongUnit 1501, 15/F, Henley Building,5 Queens Road, Central, Hong KongTel: +852 2251 8393
SydneySuite 3.01, Level 3, 55 Hunter Street,Sydney NSW 2000, AustraliaTel: +61 (0) 2 8072 1100
TokyoLevel 14, Hibiya Central Building 1-2-9Nishi Shimbashi, Minato-ku, Tokyo 105-0003Tel: +81 3 5532 8663
SingaporeOne Raffles Quay, North Tower, Level 25, SingaporeTel: +65 9173 6691
EUROPELondon110 Bishopsgate,London, EC2N 4AY, UKTel: +44 (0)20 7333 0033
Birmingham4301 Waterside Centre, Birmingham Business Park,West Midlands, B37 7YN, UKTel: +44 (0)121 717 1919/1900
LeedsMarshalls Mill, Marshall Street,Leeds, LS11 9YJ, UKTel: +44 (0)113 202 8900
ManchesterLowry House, Spring Gardens,Manchester, M2 3AW, UKTel: +44 (0)161 638 8770
Newcastle Studio 308, Maling Exchange, Hoults YardWalker Road, Newcastle-upon-Tyne, NE6 2HLTel: +44 (0) 191 249 4070
Bristol Ten Victoria Street,Bristol, BS1 6BN, UKTel. +44 (0)117 313 9555
EdinburghWaverley Gate, 2-4 Waterloo PlaceEdinburgh, EH1 3EGTel: +44 (0)131 301 5111
Glasgow2 West Regent StreetGlasgow G2 1RW, UKTel: +44 (0) 141 343 3283
DublinUnit 2, 51 Sir John Rogerson’s Quay,Dublin 2, IrelandTel: +353 (0)1 6741400
Cork Regus Building 1000, City Gate,Mahon, Cork, IrelandTel: + 353 (0) 21 6019016
AntwerpIndiëstraat 2 B-2000 Antwerpen, BelgiumTel: +32 3 870 51 51
BrusselsNieuwe Gentsesteenweg 21/31702 Groot-Bijgaarden, BelgiumTel: +32 (0)2 463 1430
GhentKortrijksesteenweg 62B-9830 Sint-Martens-Latem, BelgiumTel : +32 (0)9 321 73 00
DüsseldorfGraf-Adolf-Platz 15, D-40213 Düsseldorf, GermanyTel: +49 (0)211 17 93 92 0 StuttgartBüchsenstrasse 10, D-70173Stuttgart, GermanyTel: +49 (0)711 207 05 0
FrankfurtHerriotstrasse, D-60528Frankfurt, GermanyTel: +49 (0)69 677 33 269 MunichLeonrodstrasse 52D-80636 München, GermanyTel: +49 (0)89 839306 0
HamburgHamburg Fleethof, Stadthausbrücke 3D-20355 Hamburg, GermanyTel: +49 (0)40 376 44 546
UtrechtIndustrieweg 4Maarssen, 3606 ASTel:+31 (0)346 581 070
GroningenVerlengde Hereweg 173,Groningen, 9721 AP, The NetherlandsTel: +31 (0)507 600 017
ZürichBadenerstrasse 15, Postfach, CH-8021, Zürich, SwitzerlandTel: +41 (0)44 296 88 44
GenevaRue Pierre Fatio 10,1204 Genève, SwitzerlandTel: +41 (0)22 319 35 55
Luxembourg5, rue Guillaume KrollL-1882 LuxembourgTel: +352 (0) 26 30 651
StockholmWorldTradeCenter, Kungsbron 1, Box 843,101 36 Stockholm, SwedenTel: +46 (0)8 796 17 00
GothenburgSödra Larmgatan 20,411 16 Göteborg, SwedenTel: +46 (0)31 60 42 90
MalmöGibraltargatan 7211 18 Malmö, SwedenTel: +46 (0) 40 611 83 40
CopenhagenBusiness Center, Havnegade 39,1058 Copenhagen K, DenmarkTel: +45 (0)77 99 32 60
HelsinkiUnionsgatan 2200130 Helsinki, FinlandTel: +358 50 599 6821
WarsawAl. Jerozolimskie 56 C, 00-803 Warszawa, PolandTel: +48 22 428 47 28
OsloTordenskioldsgate 6 0160 Oslo, Norway Tel: +47 22 40 40 80
Tel Aviv45 RothschildTel Aviv, Israel, 6578403Tel: 0584 1608 83

Harvey Nash Group plcwww.harveynash.com