have they not travelled in the land, and have they hearts
TRANSCRIPT

Linear Equations and their Graphs Aisha Khan
Have they not travelled in the land,
and have they hearts wherewith to
feel and ears wherewith to hear? For
indeed it is not the eyes that grow
blind, but it is the hearts, which are
within the bosoms, that grow blind.
Quran 22:46

Algebra I Spring 2014
Rationale: Changes in gas prices, tuition rates, and housing prices are something
that affects all of us at one point or another in our lives. Therefore, it is useful to be
able to predict how these figures have and will changes over time. This is done
through the use of algebra. In this unit, students learn about the graphs of lines,
something that is fundamental is all higher level math classes. In addition, this unit
teaches students the science of measuring and predicting change.
Summary: This unit begins with learning about the equations of lines, how to
construct them, and how to graph them. From there, students will be asked to
research college tuition prices from the past, graph this data, and come to a
conclusion about the cost of a college education five years from now. The unit will
end with the students presenting their findings in the form of a report and oral
presentation.
Essential Question(s):
How can I use linear equations in the real world?
How and when do I draw a line of best fit?
How can I use this information to solve a problem?
Common Core:
HSA.CED.A.2
o Create equations in two or more variables to represent relationships
between quantities; graph equations on coordinate axes with labels
and scales
HSA.REI.D.10
o Understand that the graph of an equation in two variables ins the set
of all its solutions plotted in the coordinate plane, often forming a
curve (which could be a line).
HSS-ID.B.6
o Represent data on two quantitative variables on a scatter plot, and
describe how the variables are related
Fit a function to the data; use functions fitted to data to solve
problems in the context of data. Use given functions or choose
a function suggested by the context. Emphasize linear,
quadratic and exponential models
Informally assess the fit of a function by plotting and analyzing
residuals.

Fit a linear function for a scatter plot that suggests a linear
association
HSS-ID.C.7
o Interpret the slope (rate of change) and the intercept (constant term) of
a linear model in the context of the data.
Literacy Strategies:
Exit Slip
Admit Slip
Mapping
Teacher-Student Correspondence
Reflective Writing
Multigenre project
Length of Unit: ~ 4 weeks
Materials and Resources:
- school: computers, internet access, and relevant software
- teacher: class time dedicated to the project
- student: time at home, a final report and presentation
Assessment:
- pre: class discussion about problem solving, lesson on coordinate grid if
necessary
- formative: in class writings, correspondence, quizzes to assess ability
- summative: final presentation and report

~ Day 1 Lesson Plan ~
Topic: Graphing and Writing Equations of Lines
Objective(s):
After administering the pretest, both students and teacher will be able to gauge the
level of expertise the students have with pre-algebra
Students will have a basic understanding of what algebra focuses on.
Materials needed:
SmartBoard, Whiteboard Paper, Pencil
Phase 1: Administer pretest; go over questions on white board with student
volunteers
Phase 2: Review material if necessary
Phase 3:
Guided Discussion:
Examples of insurance premiums vs Age/Gender
How can we use this information?
What steps did researchers have to take to collect the information and present it in
this form?
What are benefits of this kind of visual?
Phase 4: Recap
Assign practice problems if necessary
Exit Slip: Come up with your own example of algebra in real life

Presentation Model Lesson Plan
Topic: Graphing linear equations
Objective(s):
Given a set of linear equations, students will describe graph behavior
Given a set of linear equations, students will graph equations
Materials Needed:
SmartBoard
PowerPoint Presentation
Graph Paper
Worksheets (HW)
Phase 1: Introduction: Clarify aims and establish set.
Recall the 3 different forms of linear equations
Goal today is to predict graph behavior and to graph by hand
Phase 2: Present the advance organizer
Equation in slope intercept form, The graph of this equation
Most convenient for graphing
How do we get from here to here?
Phase 3: Present learning materials (outline of content):
Breaking down the parts of an equation in slope intercept form
Slope – rise/run
Y intercept
How those components manifest themselves on a graph
Starting point
Rate of change from one point to the next

Positive/negative slope and the direction of the graph
Steps for graphing an equation in slope intercept form
1. Place y intercept
2. Use slope graph next points
3. Check graph against original equation – do they match?
Phase 4: Application: (check for understanding and strengthen student thinking)
Ask students to demonstrate on the board
Worksheets to be completed during class
Homework for more practice
Source: Arends, R.I. (2008). Learning to Teach (7th
Ed). McGraw-Hill Higher
Education.

Direct Instruction Lesson Plan
Topic: Slope – Intercept form of the equation of the line
Objective(s):
Given a graph or a pair of points, students will write the slope – intercept form of
the equation of the corresponding line
Materials needed:
SmartBoard, Whiteboard, markers
Phase 1: Introduction: Clarify goals and establish set.
Have examples of lines and non – lines on the SmartBoard
Ask what makes a line a line
Review components of slope – intercept form
Phase 2: Demonstrate skill or process (use Task Analysis):
1. Find the slope
2. Fill in components of the equation
3. Plug in given point and solve for y – intercept
4. Write final equation
One example points equation, one graph equation
Phase 3: Provide guided practice:
Worksheet, going through one step at a time as a class for one of each type of
problem
Students finish remainder of worksheet individually and check their work with a
partner
Phase 4: Check for understanding and provide feedback:
Circulate as students work to make sure everyone works independently first
Have students put answers on the whiteboard when finished (ask for volunteers?)
Phase 5: Provide extended practice and transfer:

Homework: take the given table and write the equation of the line, predict the
output value for an input value not given beforehand.
Find the equation of the graph shown.
Problem-Based Instruction Model Lesson Plan
Problem: How much will you have to pay for a college education?
Content Objective(s):
Given a set of data, students will be able to draw a line of best fit with correct
slope.
Process Objective(s):
Students will use university websites to gather information on tuition rates and
offered majors.
Students will write a report of which university they would most likely attend and
why.
Students will use Microsoft Excel to graph lines to put in final paper.
Materials needed:
Computers, Graph Paper, SmartBoard
Phase 1: Introduction: Orient students to the problem:
Students will compare tuition rates ($/credit hour) at five different universities, two
chosen by the teacher, and three selected by the students. Universities must be
chosen based on location, and availability of preferred major.
Students will graph tuition rates over the last fifteen years and use this information
to predict how much they would pay if they chose to go to those universities (5
years away).
Finally, students will write a final summary, including graphs, of their findings and
choose which university they would ultimately choose and why. They will then
present these findings to the class using PowerPoint or other program
Phase 2: Organize students for study:

Show them how to find the tuition rates using an example of a university that they
will not be using.
Have students graph tuition rates on whiteboard, draw the line of best fit, and
predict the rate in 5 years.
Phase 3: Assist independent and group investigation:
Ask students to decide on a major they would like to investigate.
Give some links to popular universities and tips on how to navigate them.
Phase 4: Develop and present artifacts and exhibits:
If more than one student is investigating the same major, or if they are similar,
presentations will be given as a group.
Phase 5: Analyze and evaluate the problem-solving process:
In Class: students will write a short reflection on the process as a whole.
Discussion: what did you learn about your learning style, about presentations,
about college, etc?
Discussion Model Lesson Plan
Topic: Graphing and Writing Equations of Lines
Objective(s):
Given a series of points, students will write a linear equation with both slope and y
intercept correctly placed in the equation.
Given a series of points and the above mentioned equation, students will write the
equations of parallel and perpendicular lines and graph all three lines on the same
plane.
Materials needed:
SmartBoard, White Board
Phase 1: Clarify aims and establish set:
Review of all chapter material in preparation for exam
Understanding rates of change is essential moving forward.
Phase 2: Focus the discussion:
Rules: one voice at a time, keep discussion on topic
Q: How do we mathematically represent the idea of change?
Phase 3: Hold the discussion:
Guided Dicussion
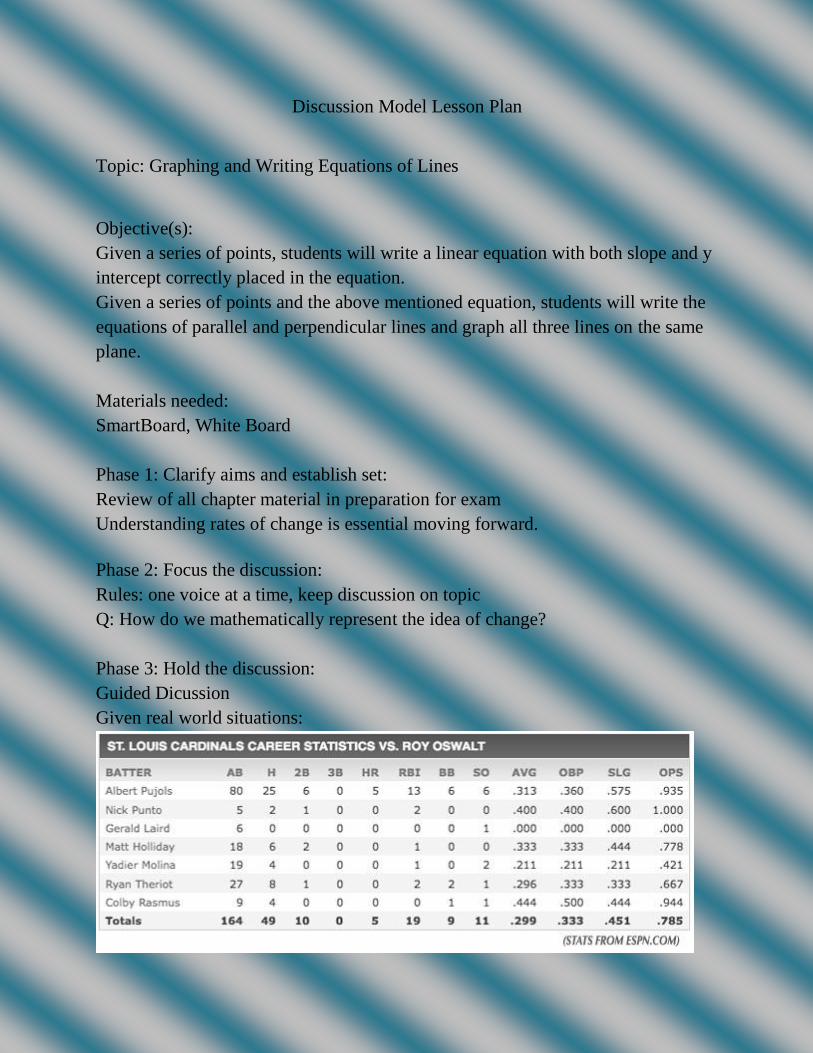
Given real world situations:

For each set of information: is the slope positive or negative? What does this
indicate?
For cards stats vs oswalt: list possible x and y variables. Graph a few. Find line of
best fit, predict stats for next AB.
How will the graphs differ from each player to the next?
Given some points from the above tables, graph avg vs opponent, hr vs avg, etc.
what would lines parallel to these represent?
Phase 4: End the discussion:
Reiterate process for graphing lines, lines of best fit, parallel and perpendicular
lines.
Phase 5: Debrief the discussion:
Exit slip: Practice Questions

You’re Invited!
What? A Conference of Experts Discussing the Rising Tuition Costs in
this Country
When? October 21st - October 25th, 2013
Who? The Panel of Experts in Ms. Khan’s Class
What to Bring: You, Your Expertise, and Your Research
Presentations begin at 9 am sharp!!
See Rubric (over)

Linear Equations – Final Presentation Rubric
Requirement 0-10 11-20 21-30 Score
Oral Presentation
-Presentation is difficult to understand, without use of terms -Visual Aids are irrelevant and/or difficult to understand
-Most of presentation is delivered clearly, with some terms -Visual aids are easily understood and mostly relevant
-Clearly delivered, using specific terminology -Visual aids are relevant and easily understood
/30
Written Report
-Report is poorly written, including less than half of necessary subsections -Less than half of subsections are not clearly identified with headings
-Report is acceptably written, including all or most subsections -Most subsections are identified with headings
-Report is well-written, and includes all necessary subsections -All subsections are identified with subheadings
/30
Appropriate Use of Algebraic
Concepts
-Concepts were used incorrectly and appropriate conclusions were drawn
-Concepts were used correctly; conclusions were not drawn appropriately
-Concepts were used correctly and appropriate conclusions were drawn
/30
Total
/90

Calendar
Monday Tuesday Wednesday Thursday Friday
Week
One
Pretest and
Intro
Lecture/Revie
w:
Coordinate
Grids and
Graphing
Lesson:
Breaking
Down an
Equation
Lesson:
Standard/
Slope-
Intercept/
Point-
Slope
Form
Quiz 1
Week
Two
Lesson:
Graphing
Graphing
cont.
Intro to
Project: Parts,
Expectations
Lab Day
Quiz 2
(short),
Lab Time
Week
Three
Check In with
Students:
Individual
Conferences
Project Work Project Work Project
Work
Review:
All
material
thus far
Week
Four
Presentations
Presentations
Presentations
Presentati
ons
Party!
Jeopardy
?