hawai‘i graduation...
TRANSCRIPT

TM
HAWAI‘I GRADUATION INITIATIVE
SHEEO Annual MeetingJuly 8, 2014
David Lassner, PresidentUniversity of Hawai‘i System


State’s Single Public Higher Education System
‣Headcount enrollment: approx. 60,000• 1 research/doctoral campus• 2 baccalaureate campuses• 7 community colleges
‣Education centers throughout the islands
‣ Primarily commuter campuses
‣No majority ethnic/racial group
‣Every campus is Native Hawaiian-serving

“55% of Hawai‘i’s working age adults to have a 2- or 4-year college degree by the year 2025.”
43% 43% 42% 43% 42% 42% 43% 47.3%
0%
55%
2006 2008 2010 2012 2014 2016 2018 2020 2022 2024
% o
f Pop
ulat
ion
w/ D
egre
e
Current Trend
GOAL
2025
CumulativeDegree Gap:56,803 degree holders
Source: NCHEMS & U.S. Census Bureau, American Community Survey, 1-year estimates, 2006 to 2012

UG Certificates Associate's Bachelor’s
761
3336
4301
FY2009 FY2010 FY2011 FY2012 FY2013
341
2408
3705
3.0%
17.4%
6.7%
Compounded Annual Growth Rate of UH Degrees Awarded

2282 2412 2615 2850 3061 3345 3545 3759 3985 4224 4477 4745 5029 5332 5652 5992 6352 67333696 3701 3584 3793 4048 4227 4495 4780 5084 5407 5752
61196512
69307376
78528359
8900
5978 6113 61996643 7109 7572 8040
8539 90699631
1022910864
1154112262
1302813844
1471115633
2008 2009 2010 2011 2012 2013 2014 2015 2016 2017 2018 2019 2020 2021 2022 2023 2024 2025
UHCCs UH 4-Yr
UH will need a 6% annual growth in Associate and Bachelor’s degrees to
reach the goal
Actual Degree production needed to reach goal
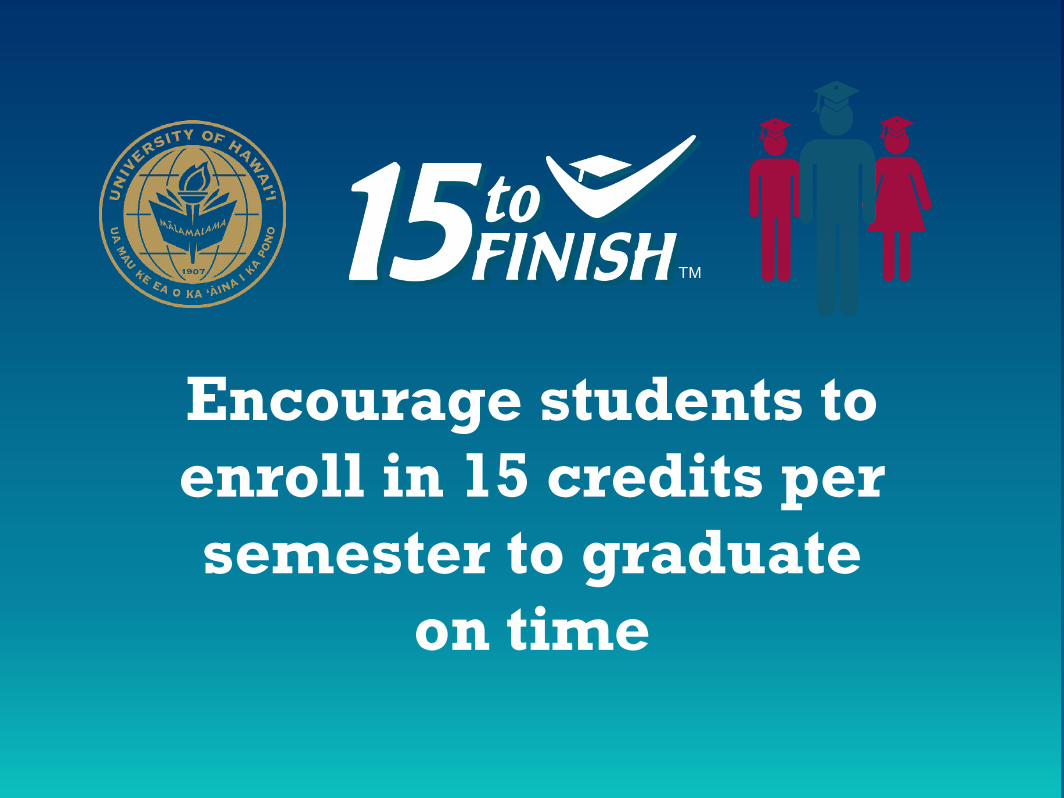
Encourage students to enroll in 15 credits per semester to graduate
on time
TM

Students who took ≥15 credits tended to be more prepared and have better academic success.
More importantly, at all but the lowest levels of academic preparation, students who took ≥15 credits generally had more academic success.
This held for Pell and URM students.
Analysis of <15 and ≥15 Credits

Credits Attempted
UH Manoa First-Time Freshmen, Fall 2009 to 2011¯

UH Community CollegesFirst-Time Freshmen Fall 2009 to 2011
Credits Attempted

Communications StrategyEngaging External Audiences
‣ Developed a branding theme for consistency in communications
‣ Created key messages by audience group
‣ Developed a media strategy—paid and earned
‣ Developed collateral material, website
‣ Enlisted partners to help spread the word

Communications StrategyEngaging Internal Audiences
‣Encouraged buy-in of advisors and other internal stakeholders through presentations of data analysis
‣Developed informational handouts and videos
‣ Incorporated the 15 to Finish message at New Student Orientations

Systemwide Credits AttemptedClassified Undergraduates
9,038 9,244 9,326
10,699 11,252
19,098
19,975 19,780 19,009
18,329
14,186
15,190 16,011 15,956
15,071
8,000
11,000
14,000
17,000
20,000
2009 2010 2011 2012 2013Fall Semester
12−14 Credits
1−11 Credits
≥15 Credits
+5.2%+14.7%
-5.5%-0.3%
-3.6%-3.9%

Institutionalize “15” as the New Norm
‣Revise definition of class standing
‣Modify scholarship requirements
‣Continue to establish partnerships, e.g., UH Bookstore promotion
‣ Implement 2- and 4-year academic maps
Next Step:
Complementary Strategies

Campus Scorecards
In 2010, created campus scorecards identifying measures that improve graduation rates based on academic literature and updated annually

Campus Strategies
‣ Campuses reduced credit requirements for a bachelor’s degree to 120
‣ Developed academic maps
‣ Created block and cohort scheduling
‣ Promoted English and math in the first year
‣ Improved course scheduling and availability (waitlist, monitor gateway courses, track failed registration attempts, etc.)
Campus Strategies Con’t
‣ Undergraduate research opportunities
‣ Outreach to non-returning students
‣ Veteran’s Taskforce
‣ Prior learning assessment
‣ Multiple remedial/developmental education strategies
‣ Supplemental instruction and course redesign

Campus Strategies Con’t
‣ Financial aid centralization for CCs
‣ Reduced summer tuition
‣ Provided targeted scholarships
‣ Federal Workstudy Pilot Project (Mānoa)
‣ Project Wai‘ale‘ale (Kaua‘i) and Paipai o Ko‘olau (Windward)
‣ Agree to Degree

Systemwide Automatic Admission
‣ Started in Spring 2010 for Fall 2010 admission
‣ Initially offered to AA students and expanded to include articulated programs
‣ Application fee waived and offer/acceptance all done electronically
‣ Participation increased by 138% since 2010
‣ In Spring 2014, 774 students took advantage of the program

Systemwide Reverse Credit Transfer
‣ Piloted in Spring 2013 with one campus and identified 300 eligible students
‣ Expanded to all seven community colleges in Fall 2013 and identified 600 students
‣ No cost to the student (all done electronically and student only pays a fee if they would like a diploma)
‣ To date, over 1,000 Reverse Credit Transfer degrees have been awarded

Graduation Pathway System (GPS)
‣ My Academic Planner (MAP) – intuitive, online academic map that continually recalculates and provides the students with their optimal path to completion
‣ Academic Pathway Velocity (APV) –measurement of academic program efficiency
‣ Communication campaign focused on completion – 15 to Finish

Philanthropic SupportFinancial and intellectual support make these
initiatives a reality.

TM
Mahalo!
www.15tofinish.com
www.hawaii.edu/hawaiigradinitiative