hays global skills index 2016 - the global skills landscape · as we look ahead beyond 2016, i hope...
TRANSCRIPT

In partnership with:
hays-index.com
THE GLOBAL SKILLS LANDSCAPE A COMPLEX PUZZLE The Hays Global Skills Index 2016

2 | The Hays Global Skills Index 2016 The Hays Global Skills Index 2016 | 1
CONTENTSIntroduction 2
Executive summary 4
Understanding the Index 5
The macroeconomic backdrop 6
The regional picture 18
The Americas 20
Asia Pacific 26
Europe and the Middle East 34
Contributors 53
Sources 53

2 | The Hays Global Skills Index 2016 The Hays Global Skills Index 2016 | 3
Welcome to the 2016 edition of the Hays Global Skills Index. In our fifth year of producing the Index, the need to address skills shortages is more critical than ever; the skills gap is fast becoming a skills chasm. As the world’s largest specialist recruiter, we feel it is our responsibility to continue to examine the global skills landscape and add our expertise and insight to the debate.
Looking back to our first report in 2012, we’re reminded how much has changed – in politics, business and technology – and the pressure on organisations to keep up.
2016 has been a year of momentous change. The EU referendum, the US presidential elections and the slowdown in emerging markets are just a few of the issues companies are contending with. We have seen workers’ strikes in France, political upheaval in Spain and ongoing debates about global border control.
At Hays, our focus is on placing great people into the right jobs and helping our clients find the talent they need, whichever country they are in. Our diversity by geography and specialism is more important now than ever.
The past year has seen much debate about how technology and automation will impact the global labour market. We know that automation is no longer limited to mechanical, repetitive tasks. Machines are now able to drive cars, draft annual reports, diagnose illnesses and create complex economic models.
While we often hear daunting predictions about the number of jobs this may replace, my view is that these technological advances will bring huge benefits to the global labour market. We need to remember the millions of new jobs that will be created, many of which aren’t even imaginable today. We also need to find ways of using robotics to make tasks more efficient, putting humans in control, making them better at their jobs and boosting productivity.
Never has this been more important. This year’s Hays Global Skills Index shows that as the global economy slowly recovers, businesses are still struggling to find the talent they need. In Europe, the skills gap has widened while productivity levels remain dismally low. In Asia, China and India are experiencing slower economic growth, which places its own pressure on employment. On the other side of the world in the US, the story is one of an increasing talent mismatch, manifested by simultaneous growth in both unemployment and job vacancies.
There are, however, some bright spots. Looking at the countries that fared particularly well this year, around 130,000 new jobs have been created in Italy since the start of 2015, while unemployment has also fallen. Germany’s labour market continues to be buoyant. In Japan the Government has introduced new ‘womenomics’ policies aimed at boosting the number of female workers.
Based on the trends we have seen from the past five years of the Hays Global Skills Index, and the views of our experts around the world, we have developed a set of strategic recommendations to governments and business leaders alike. We believe if these recommendations are implemented we will see positive changes in labour markets and societies around the world, as further jobs are created and economies run closer to their full potential.
1. Address skilled migration to tackle the ever-growing skills gap
The skills gap is something that we at Hays have been talking about for a long time, but the issue is becoming more serious as each year passes. To address this problem, we need to make a clear distinction between skilled migration and mass immigration, looking at new ways to ensure each market is attracting the best and most relevant talent. Governments need to identify skilled roles that aren’t being filled by local workers, opening up their labour markets to appeal to more overseas candidates regardless of their origin.
2. Implement smarter training programmes to ensure businesses are future-proofed
Businesses and governments need to work more closely together to create policies that will train and develop the skills of the future. These aren’t just new digital skills – such as coding, programming, informatics and data analysis – although these are critically important. It’s also the softer ‘employability skills’, including problem solving, communication and negotiation, which are often neglected in education but highly valued by business. This training must apply not only to new graduates, but also middle managers and older workers.
3. Tackle low productivity through better technology and employee engagement
Low productivity continues to be an obstacle to economic growth in many countries, particularly in Europe. Better technology is part of the solution. This could include anything from greater access and use of smart devices while on the move, to introducing new software to analyse customer data. Businesses also need to have open conversations with employees about how to improve their engagement with the business. Organisations can never be productive if their people are not productive; people can never be productive if they are not engaged.
As we look ahead beyond 2016, I hope that this year’s Hays Global Skills Index will provide a useful insight into global labour markets, mapping out what is needed to attract the best talent both now and in the future.
INTRODUCTION
Alistair Cox, Chief Executive, Hays plc
As the global economy slowly recovers, businesses are still struggling to find the talent they need.

4 | The Hays Global Skills Index 2016 The Hays Global Skills Index 2016 | 5
EXECUTIVE SUMMARYSkills shortages and skills mismatches are worrying issues for businesses. When employers find it difficult to recruit the people with the skills they need, there are real costs involved. These may be lost business, reduced productivity or a need to undertake additional training to upskill people. There are also implications for the workload and welfare of existing staff with increasing pressure to meet growing demand. For these reasons, Hays continues to monitor developments in skilled labour markets in which it operates. The Hays Global Skills Index (the Index) is one of our contributions to that debate.
The Index helps to identify where there are skills shortages, or too great a skill pool for the jobs available and also looks at the effect this has on wages. The report analyses how the global skilled labour market has changed over the previous year, but as this is our fifth year we have also looked back to the report’s initial year of 2012 to take a longer-term view of developments across the global labour market.
Movements in the overall Index• Across the 33 countries in which Hays operates, there is
evidence that the skilled labour market has tightened further since 2015. The overall average Index score has increased slightly from 2015.
• At the global level, the tightening in skilled labour markets was brought about by a strengthening in the demand for skilled labour, as the global economy continued its slow recovery. This has increased talent mismatch and wage pressures. The indicators for skilled labour supply, such as labour market and education flexibility, remained unchanged over the past year.
• By region, the increase in the overall Index score reflects more pressured skilled labour market conditions in Europe and the Middle East (EME), which has more than offset a slight easing in demand in the Americas and Asia Pacific.
Europe and the Middle East (EME)• In EME, the Index increased from 5.4 in 2015 to 5.5 in 2016,
suggesting skilled labour markets have tightened.1
• Moving through 2016, the demand for skilled labour in Europe has increased slightly. Growth has been particularly strong in several economies that were worst hit by the financial crisis, such as Ireland, Portugal and Spain.
• Echoing the global picture, the indicators around the supply of skilled labour have changed little in EME. As a result, wage pressures have emerged and talent mismatch has worsened, pushing the average Index score higher this year.
The Americas• In the Americas, the skilled labour market performance
is broadly unchanged compared to the previous year. This hides considerable disparity between, on the one hand, tight labour markets in the United States and Canada, and on the other, a downbeat picture in Central and Latin America, held back by economic turmoil in Brazil.
• The standout story across the Americas, however, is again one of increasing skills mismatch, brought about by simultaneous growth in both unemployment and job vacancies. This suggests companies are finding it increasingly difficult to find the people with the right skills among the unemployed.
• The growth in mismatch does not appear to have impacted wage pressures yet across the Americas. Both overall wage pressure and occupational wage pressure wielded a negative impact on the aggregate Index score in 2016.
Asia Pacific• In the Asia Pacific region, the picture is also one of divergence.2
• The Big 3 of China, India, and Japan have all experienced an easing in their labour markets. In the other Asia Pacific countries, the evidence is more mixed, pointing towards softer demand for skilled labour in some, but increased skill shortages in specific occupations and industries.
• Nowhere are the divergent experiences more evident than in the strength of wage pressures in the skilled labour market in the Asia Pacific region in 2016. While there seems to be a decline in the wage premium between high- and low-skill industries relative to the past, it seems to have increased in high-skill occupations relative to low-skill ones.
Global labour markets continue to be placed under pressure as they are impacted by ongoing economic uncertainty. The continued challenge to find skills in key areas is not unique to one country and businesses are struggling to manage their talent pipelines. While there is still a lot more that policy makers, business leaders and educational institutes can be doing to tackle the issue, we have seen examples of governments having a positive impact by implementing polices that are supportive to labour markets. The Hays Global Skills Index examines these changes in an effort to learn what can be done in other areas of the world and also continues to offer important insights into the puzzle that is the global skills crisis.
UNDERSTANDING THE INDEXThe Hays Global Skills Index is a complex, statistically-based report designed to assess the dynamics of skilled labour markets across 33 countries.
Seven indicators make up the Hays Global Skills Index The following seven indicators are given equal weight when calculating the overall Index score for each country. Each indicator measures how much pressure different factors are exerting on the local labour market. Higher scores mean that a country is experiencing more pressure than has historically been the case. Lower scores mean that a country is experiencing less pressure than has historically been the case.
Education flexibility
In today’s global and technology-driven economies, raising educational standards is crucial to bridging skills gaps. This indicator provides a comprehensive view of the state of education. The lower the score, the better the chance that the education system is flexible enough to meet labour market needs. The higher the score, the less likely an education system is equipped to build a solid talent pipeline.
Labour market participation
Bringing more people into the workforce is a powerful way to improve economic and labour market performance. Countries that can raise the employee participation rate can gain an edge over countries with less scope to do so. The lower the score, the larger the potential pool of workers. The higher the score, the lower number of workers there are available to join the workforce.
Labour market flexibility
Governments play an important part in determining how well labour markets function. For instance, they can cut red tape, avoid laws that discourage hiring and adapt policies that welcome talented people from abroad. The lower the score, the better aligned governmental policies are with labour market dynamics. A higher score means there are more barriers restricting the local labour market.
Talent mismatch
This indicator measures the gap between the skills that businesses are looking for and the skills available in the labour market. A higher score indicates that businesses are facing a serious problem in matching available talent with unfilled jobs. A lower score suggests employers are having an easier time finding workers with the skills they need.
Overall wage pressure
Skills shortages are likely to be an important issue when wages are growing faster than the overall cost of living. A higher score indicates the presence of overall wage pressures that are higher than the historic norm for that country. A lower score tells us wages are not rising quickly and those pressures aren’t as apparent.
Wage pressure in high-skill industries
Some industries require higher-skilled staff than others. As it takes time to undertake the training necessary to work in those industries, it potentially makes them more vulnerable to skills shortages as the number of people qualified to start work cannot be changed quickly. A higher score indicates that wages in high-skill industries are growing faster than in low-skill industries relative to the past, which is indicative of the emergence of sector-specific skills shortages (such as in engineering or technology). A lower score tells us wages for those in high-skill industries are rising more slowly or in line with wages in low-skill industries.
Wage pressure in high-skill occupations
Some occupations require a higher than average amount of training, education and experience. These are called high-skill occupations. Rising wage pressure in this category signals that these occupations are experiencing shortages of workers with the necessary skills. The higher the score, the greater the presence of skills shortages affecting high-skill occupations. A lower score tells us wages for those in high-skill occupations are rising more slowly than those in low-skill occupations.
Each country’s overall Index score is accompanied by a visual indicating the score range for each indicator (see below).
5.0
5.2
5.2
6.4
5.7
6.2
4.2
0 2.5 5 7.5 10
Breakdown of seven indicator scores
0 2.5 5 7.5 10
Overall score
5.4in 20155.5
The analysis on which the Hays Global Skills Index was based utilised data as of Q2 2016. Developments subsequent to this date are not reflected in the 2016 findings.
1. The EME and global indices now include the United Arab Emirates in both 2016 and 2015 for the first time this year. 2. The Asia Pacific and global indices now include the Malaysia in both 2016 and 2015 for the first time this year.

6 | The Hays Global Skills Index 2016 The Hays Global Skills Index 2016 | 7
The global economy continues to recover from the effects of the financial crisis but growth remains modest at best. Even the emerging ‘giants’, China and India are experiencing slower rates of GDP growth than they enjoyed a few years ago, while Brazil is in recession. Relatedly, any improvements in skilled labour market conditions have been limited and patchy, highlighting how conditions have profoundly shifted: companies’ demand for skilled labour is no longer buoyed by surging world trade and global economic growth.
At a regional and country level, the macro picture is mixed: some economies have strengthened, while others – particularly emerging and developing economies – have suffered as a result of low commodity prices and tightening financial conditions. Certain emerging markets, such as Brazil and Russia, are still stuck in very deep recessions, while others, like Ireland had managed to outpace most developed economies thanks to an uplift in household spending.
Consequently, skilled labour market conditions vary markedly in different parts of the world. Grouped into large overarching regions, however, it is possible to discern some headline patterns. The overall Index score increased slightly from 2015, as changes in skilled labour market conditions in Europe and the Middle East (EME) more than offset a very slight loosening in the Americas and Asia Pacific. The annual change in Index scores should not mask the overall position that suggests
skilled labour markets in the Americas and EME remain tight relative to the past, while Asia Pacific remains little changed from historic trends.
Drilling down into the seven separate indicators that make up the Hays Global Skills Index provides us with additional detail of skilled labour market conditions across the world. At the global level, there has been no change in the indicators of skilled labour supply: education flexibility, the labour market participation rate and labour flexibility are all unchanged in 2016 from their 2015 levels. This suggests a strengthening in companies’ demand for skilled labour is likely to explain the worsening in talent mismatch score and the increases in overall and occupational wage pressures, which boosted the aggregate score.
The unchanged nature of the three indicators that directly relate to the supply of skilled labour at the global level should also not mask the changes that are occurring in individual countries.
These relate to policy decisions made by each individual country’s governments, these are discussed in a section of their own.
THE MACROECONOMIC BACKDROP
Overall score
Educationflexibility
Labour marketparticipation
Wage pressure inhigh-skill industries
Wage pressure inhigh-skill occupations
Overall wagepressure
Talentmismatch
Labour marketflexibility
2016 2015Figure 1: HGSI indicator scores (2016 vs 2015)*
5.35.4
5.05.0
5.25.2
5.25.2
6.26.4
5.55.7
6.36.2
4.14.2
*The comparisons between Index values for 2016 and 2015 include Malaysia and UAE, which are included for the first time this year. The 2015 estimate is therefore di�erent from that published in last year’s report
Malaysia and the United Arab Emirates – two new additions to the Hays Global Skills IndexFrom the outset, the Index aimed to cover all 33 countries in which Hays operates, though this was never going to be easy given the quantity of information needed to construct the Index for each country. We started in 2012 with 27 countries. The next year, we added Austria, Chile and Luxembourg. Colombia followed in 2014, taking the total to 31, and missing only Malaysia and the United Arab Emirates (UAE). This year both countries have been added to the Index, though a lack of data on vacancies (used to build the talent mismatch indicator) has meant that for these two countries the overall Index score has been calculated using just six indicators.
In Malaysia, the labour market is performing fairly well with an overall score of 5.3, indicating average pressures on the market and consistency in line with its historical performance.
One indicator that stands out is the high labour market participation rate (score of 3.7), which boosts the supply of labour available. However, this is negated by relatively poor (and worsening year-on-year) labour market flexibility (score of 6.1).
The UAE overall score of 4.8 suggests that the labour market is close to being in balance. It achieves this in a very different way to Malaysia, for example, by having a flexible and open labour market which attracts international migrants (seen in the low flexibility indicator score). This compensates for the inflexibility of the local educational system and a relatively low participation rate amongst local Emirati (seen in the reasonably high participation score of 5.6).
In this report UAE comes under the region Europe and the Middle East (EME), while Malaysia completes the Asia Pacific bloc.
The region is still attractive to international job seekers and interest in moving here remains high. For those organisations which are hiring there is no critical shortage of talent.Chris Greaves, Managing Director, Hays UAE

8 | The Hays Global Skills Index 2016 The Hays Global Skills Index 2016 | 9
3.0 3.5 4.0 5.04.5 5.5 6.0 6.5 7.0
2015 score
Year-on-yeardi�erence
2016 score
Russia
Australia
Malaysia
+0.1
–0.3
+0.4
+0.1
–0.1
+0.6
+0.1
+0.2
–0.2
–0.1
–0.1
+0.8
+1.0
–0.2
n/c
+0.2
+0.4
–0.3
+0.1
+0.1
+0.1
+0.3
–0.2
–0.1
n/c
–0.1
–0.2
n/c
n/c
+0.4
–0.4
–0.3
–0.3
Portugal
Sweden
Spain
Germany
Ireland
Canada
Brazil
Chile
Austria
China
Poland
New Zealand
India
Hong Kong
Switzerland
Singapore
Italy
Belgium
Japan
France
United States
Mexico
Colombia
United Kingdom
United ArabEmirates
Denmark
Hungary
Luxembourg
Czech Republic
The Netherlands
Figure 2: Hays Global Skills Index scores (by country)
Turning to wage pressures, overall wage pressure – the increase in wages over and above the cost of living – recorded a sharp increase (0.64). By contrast, wage pressure in high-skill industries and wage pressure in high-skill occupations changed little, suggesting that pressures are not any more pronounced in those parts of the labour market than others. This contrast is perhaps surprising, since the strong pick up in talent mismatch (0.22) suggests that employers are finding it increasingly difficult to fill vacancies despite continuing high rates of unemployment, a difficulty that is by definition more likely to affect higher-skilled industries more.
Figure 4 reports the indicator scores for the region, together with their values five years ago when the Hays Global Skills Index was first created. Four of the five indicators have increased suggesting the skilled labour market has tightened between 2012 and 2016 which is broadly what would be expected as the economy recovers. The only indicator that has not increased is wage pressure in high-skill occupations, which only marginally changed.
Europe and the Middle East (EME)Demand for skilled labour in Europe seems to have picked up slightly in 2016 given modest economic growth across the region. Another positive theme this year is evidence of economic recovery among several of the economies worst hit by the financial crisis (Ireland, Portugal and Spain), arguably lending credibility to claims that tough labour market reforms are finally starting to pay off. As a result, some noted disparities in European skilled labour markets have started to decline across the continent. All is far from rosy, however. Unemployment remains high, pay and productivity growth remains weak and the workforces in some countries are set to decline in size in the near future.
Labour market conditions have tightened across the EME region. Figure 3 shows the average scores for 19 EME countries. Both employment indicators have tightened: talent mismatch recorded a large increase (0.22), indicating the number of unfilled job vacancies remains high despite high numbers of unemployed workers. Labour market participation also increased slightly (0.04), signalling a fall in participation rates across the region. Though less dramatic, this is worrying as poor employment prospects might be acting to discourage some from looking for work. This may be important as working-age populations begin to decline in the future (as an ageing population and lower birth rate impact the numbers of working-age people in countries like Germany).
Rising Falling
0.04
0.22
0.64
0.04
-0.01
Figure 3: EME – HGSI changes (2016 vs 2015)
Wage pressure inhigh-skill industries
Wage pressure inhigh-skill occupations
Overall wagepressure
Talentmismatch
Labour marketparticipation
Wage pressure inhigh-skill industries
Wage pressure inhigh-skill occupations
Overall wagepressure
Talentmismatch
Labour marketparticipation
2016 2012
4.85.4
5.86.6
2.95.7
5.96.2
4.64.4
Figure 4: EME – HGSI indicator scores (2016 vs 2012)

10 | The Hays Global Skills Index 2016 The Hays Global Skills Index 2016 | 11
Figure 4 also points toward a sharp pickup in overall wage pressure, despite there being plenty of flexibility in the labour market. An explanation that this might reflect improved productivity rather than higher costs (and prices for their customers) is, unfortunately, ruled out by Europe’s productivity
record: over the past decade pay has risen faster than productivity in all but four of the 19 countries. Of these four, Ireland and Spain have faced tough austerity programmes, while Luxembourg and the United Kingdom have had exceptionally weak pay growth.
The Americas Taken as a whole, economic growth in the Americas has also been subdued over the past year, but this overall impression hides two different stories within the continent. North America has performed well, relatively, enjoying another year of growth, while Latin America has been dragged down by the severe recession in Brazil. A common theme across both parts of the Americas, nonetheless, is a rebound in labour market participation.
The US labour market remains under strain. Talent mismatch and wage pressure in high-skill industries are both stuck around ten (the Hays Global Skills Index’s highest score). Yet in a positive development, participation rates continue to recover from their precipitous fall following the 2008 recession, with labour market participation falling by 0.4 points. Partly offsetting this positive development, however, the US must confront the problems of both an ageing workforce and sluggish productivity growth that remains well below its pre-recession level. Canada has also fared relatively well: wage pressures have eased, notably in high-skill occupations.
Turning to Central and South America (Figure 5), the picture is more downbeat. Brazil is the biggest cause of concern. By the end of this year, GDP is likely to have fallen by over eight per cent in the past two years, with the unemployment rate expected to end the year at around 12 per cent (up from 6.5 per cent in the final quarter of 2014). This large jump is one reason for the large increase in talent mismatch in Figure 5 rather than because of worsening matching per se. Colombia’s labour market also took a turn for the worse on the back of slowing economic growth, albeit the economy is expected to pick up again next year. In contrast, Chile has performed well with the economy growing at about two per cent and positive supply-side developments helping to edge down its overall Index score by 0.1 on improving labour market participation and talent mismatch.
Arguably, the Americas encapsulates the global story within one continent. The US was at the epicentre of the financial crisis in 2008, while the tail end of the storm has hit the continent’s commodity exporters, as commodity prices collapsed, with Brazil the most prominent casualty.
Yet while Brazil’s problems cast a shadow over the region’s immediate prospects, the continent’s skilled labour markets are showing remarkable resilience. This is shown in Figure 6 that compares the region’s scores this year with those of 2012. Employment conditions have actually improved over the five years, whether measured by labour market participation or talent mismatch. Overall wage pressures have also been restrained, despite strong commodity prices over much of the period and the strength of the US economy. The picture at the industry and occupational level is less clear cut. High-skill industries have faced increasing wage pressures, but this is not corroborated by the evidence on high-skill occupational wages. This suggests high-skill occupations are spread across a range of industries, not just located within the high-skill ones.
Rising Falling
0.05
0.6
0.03
-0.03
-0.05
Figure 5: Central and South America* – HGSI changes (2016 vs 2015)
* Countries covered: Brazil, Chile, Colombia and Mexico
Wage pressure inhigh-skill industries
Wage pressure inhigh-skill occupations
Overall wagepressure
Talentmismatch
Labour marketparticipation
Key insight: Are we in a ‘new normal’ of weak employment growth and higher unemployment?The majority of this report focuses on developments in the skilled labour market up to mid-2016. But a new report by the International Labour Organisation (ILO) suggests the outlook over the next few years may be more pessimistic.3 This reflects downward revisions to forecasts as to the rate at which the world economy is expected to grow over the next few years, in particular, the more negative outlook for growth in emerging and developing economies. In turn, this and other developments are expected to negatively impact commodity prices, which will adversely affect the economies and labour markets of the commodity exporters in the Hays Global Skills Index, such as Australia, Brazil, Canada, Chile and Russia.
The ILO forecasts that the numbers of unemployed will increase by 2.3 million in 2016 to stand at 199.4 million across the globe. Some 2.4 million additional people will be looking for work in emerging economies and 0.5 million in developing economies. The forecast predicts a further 1.1 million increase in global unemployment in 2017. Long periods of unemployment erode people’s skills and productive potential.
The numbers forecast to be unemployed around the world over the next two years are dwarfed by the numbers of working-age people who choose not to participate in the labour market.
The ILO estimate this untapped source of labour supply exceeds two billion around the globe. They estimate a further 26 million joined their ranks in 2015. The ILO projections predict participation rates are likely to fall in the next few years, from 62.9 per cent in 2015 to 62.5 per cent in 2020, with developed and emerging economies forecast to see declines in activity rates. The forecast decline in participation is expected to be part cyclical and part structural. Unemployment and a weak labour market outlook will cause some jobseekers to become discouraged and drop out of the labour market. The ILO identifies an ageing population and increasing years spent in education in many countries as possible drivers of the participation rate.
The combination of the less optimistic demand outlook and falling participation rates leads to relatively subdued predictions for employment growth in 2016 and 2017. The ILO forecasts that employment will grow by less than one per cent a year in Eastern Asia, Western Europe, Canada and the United States. Latin America and the Caribbean are forecast to fare slightly better.
Rising Falling
3.2
3.1
2.2
-0.7
ILO forecasts for average annual growth in employment in 2016 and 2017 (%)
Non-GCC Arab States
Sub-Saharan Africa
North Africa
Southern Asia
GCC Arab States
South-Eastern Asia and the Pacific
Latin America and the Caribbean
Central and Western Asia
United States
Canada
Western Europe
Eastern Asia
Eastern Europe
1.5
1.5
1.4
1.3
0.9
0.8
0.25
0.15
2.0 The overall shortage of skilled workers shows no sign of improving, especially as more baby boomers retire every year without enough experienced professionals available to replace them.Rowan O’Grady, President, Hays Canada
3. International Labour Organization, “World employment and social outlook: Trends 2016”, 2016.

12 | The Hays Global Skills Index 2016 The Hays Global Skills Index 2016 | 13
Key insight: Robots and the workplace – what are the implications for workers?The past year has seen a great deal of interest in how the technological revolution is changing the way we live and work. Automation is currently no longer confined to simple routine physical tasks; machines are more and more capable of conducting non-routine cognitive tasks, such as driving or legal writing.4 Experts predict that robotics and artificial intelligence (AI) will pervade ordinary life in the coming decade, with huge implications for a wide range of sectors including healthcare, transport and logistics, customer service, and home maintenance.5 According to recent studies widely cited by the press, as many as half of all jobs in the US and the UK will be transformed or disappear.6 Given the scale of its possible impact, the World Economic Forum has called it the ‘fourth industrial revolution’, although many jobs in the service sector are as vulnerable as those in industry.
Whether so much change brings in its wake a better or bleaker future for the employee and employers remains to be seen. Some experts optimistically argue that “advances in robotics and AI are likely to provide new opportunities for human workers that are not realised at this time”, hence benefitting both employers and employees.7 With this respect, a clear distinction must be made between AI and intelligence amplification (IA). While the former makes robots autonomous and detached from humans, the latter puts humans in control and makes them better at their jobs. Therefore IA gives humans the chance to leave robotic tasks to robots and find more fulfilling and rewarding work for themselves, which would be beneficial for both firms and workers. It may not be an easy or smooth transition, but big gains could lie ahead and not taking advantage would represent a missed opportunity.
A study by the Pew Research Center interviewed a number of experts about how they thought networked automated, AI applications and robotic devices will affect jobs by 2025. Half of the respondents (52 per cent) expect that the coming changes shall not displace more jobs than they create within this time horizon. Although they think many tasks currently performed by humans will in essence be taken over by robots, they also believe that human ingenuity will generate new occupations, industries, and ways to make a living, as it has been doing throughout history. In addition, many argue that there are some jobs which only humans have the ability to do, for example because they involve creativity or critical thinking. A general manager at Microsoft put it this way; “It is clear that advances in automation will eliminate some jobs, but they will create others as well as free up some resources that could be applied to other pursuits. I do not foresee a situation where we will have successfully automated humans out of work. On the contrary, I see a situation where we have greater need for higher-skilled workers who are comfortable with using and creating technologies.”7
Back in 2011, our report ‘Creating Jobs in a Global Economy, 2011-2030’ looked at many of these themes. It remains our view that the continuing technological revolution will bring with it both winners and losers. Being adaptable and willing to invest in one’s skills will be a key factor in deciding whether or not your role is future proof.
Wage pressure inhigh-skill industries
Wage pressure inhigh-skill occupations
Overall wagepressure
Talentmismatch
Labour marketparticipation
2016 2012
6.25.4
6.86.6
4.95.1
5.36.5
4.73.2
Figure 6: The Americas – HGSI indicator scores (2016 vs 2012)
4. Carl Benedikt Frey, Michael A. Osborne, “The future of employment: how susceptible are jobs to computerisation?”, 17 September 2013. 5. These include David Clark, senior research scientist at MIT’s Computer Science and Artificial Intelligence. Laboratory, Gary Kreps, professor of
communication and director of the Center for Health and Risk Communication at George Mason University, Daren C. Brabham, assistant professor
at the Annenberg School for Communication & Journalism, University of Southern California, and many other interviewed by Pew Research Centre. 6. See for example World Economic Forum, “The Future of Jobs”. And CBRE, Genesis, “Emerging Trends Point to Workplace Revolution”, 6 November 2014. 7. Pew Research Centre, “AI, Robotics, and the Future of Jobs”, 6 August 2014.
Asia PacificDespite growing less rapidly than in previous years, the Asia Pacific region displayed lively growth rates last year, with the two ‘giants’, China and India, taking the lead. The region also stands out being less affected by an ageing workforce while also being more successful at sustaining growth in productivity and pay, albeit at below the pre-global crisis rate. All said and done, Asia Pacific appears the stronger performing region over the past 12 months.
This appearance of ‘business as usual’ is deceptive, however, with the performance of the region’s skilled labour markets increasingly divided into two blocs. On one hand, the Big 3 of China, India, and Japan have experienced an easing in their labour markets (Figure 7). For India and Japan, the easing is most apparent in wage pressure in high-skill industries and talent mismatch. For China, where labour supply has also improved (labour market participation fell by 0.9 points), overall wage pressure has fallen sharply by two points.
In the other Asia Pacific countries (Figure 8), a somewhat different picture emerges. This group includes the commodity exporters, Australia and New Zealand, together with the smaller trading nations of Hong Kong and Singapore. Overall wage pressure has eased, consistent with softer demand. But despite this, the other indicators all point to increased skills shortages. Talent mismatch has increased, indicating that firms are finding
it harder to fill posts, despite an easing in demand. Moreover, this is corroborated by wage pressure in high-skill industries and high-skill occupations which have both increased. So it appears that these countries which have played an important role in powering the region’s economy, are now finding it hard to adjust to changing patterns of demand among their larger trading partners.
Rising Falling
0.23
-0.68
-0.75
-0.13
-0.23
Figure 7: Big 3* – HGSI changes (2016 vs 2015)
* Comprises China, India and Japan
Wage pressure inhigh-skill industries
Wage pressure inhigh-skill occupations
Overall wagepressure
Talentmismatch
Labour marketparticipation
Rising Falling
0.55
0.18
0.17
0.05
-0.25
Figure 8: Rest of Asia Pacific* – HGSI changes (2016 vs 2015)
* Comprises Australia, New Zealand, Hong Kong, Singapore and Malaysia
Wage pressure inhigh-skill industries
Wage pressure inhigh-skill occupations
Overall wagepressure
Talentmismatch
Labour marketparticipation

14 | The Hays Global Skills Index 2016 The Hays Global Skills Index 2016 | 15
Figure 9 looks at how the region’s Big 3 economies compare in 2016 relative to five years ago when the Hays Global Skills Index was first constructed in 2012. Overall wage pressures have increased markedly and, as in Europe, pay has run ahead of improvements in productivity (except for Japan, where real pay has decreased over the past decade). Yet this does not appear to have been driven by mounting skills shortages as neither
wage pressure in high-skill industries, nor wage pressure in high-skill occupations have increased. Indeed, the former fell noticeably. Moreover, talent mismatch eased a bit. So despite the superficial differences between Japan on the one hand and the two emerging giants on the other, all three appear to have remained fairly balanced.
While the region has so far come through this turbulent period relatively unscathed, this could give a misleading impression of its prospects. With the fall in commodity prices and world trade growing well below the rates seen pre-crisis, it seems likely that the region will need to adjust to lower growth expectations.
For many countries this will mean re-equipping (and re-skilling) for a future in which their economies depend more firmly on domestic consumers.
Wage pressure inhigh-skill industries
Wage pressure inhigh-skill occupations
Overall wagepressure
Talentmismatch
Labour marketparticipation
2016 2012
3.74.6
6.56.1
5.37.4
5.13.8
4.34.3
Figure 9: The Big 3* – HGSI indicator scores (2016 vs 2012)
* Comprises China, India and Japan
Countries that are heading in the right directionSince the publication of the 2015 edition of the Hays Global Skills Index, skilled labour market performance across the 33 countries included in its calculation has varied markedly. This reflects differences in economic circumstances and the effects of varying government labour market policies. But four countries’ skilled labour markets are worth focusing on as performing well in 2016, according to the Index.
Italy’s labour market strengthened in 2016. Around 130,000 jobs have been created since the start of 2015 and the jobless rate had fallen to 11.7 per cent by April 2016, from its post-recession peak of 12.8 per cent in 2014. The labour market has been boosted by fiscal incentives encouraging firms to hire permanent workers and by labour market reforms. For example, the Jobs Act 2014-15 aims at enhancing labour market flexibility, by easing access to the labour market particularly for the youth. Among younger jobseekers (15-24), the unemployment rate is about 37 per cent in Italy, among the highest in Europe, and around two million young people are neither studying nor working in the country. The introduction of a contract with increasing guarantees should have a positive impact on permanent employment as it creates incentives for employers to offer jobs to individuals with little or no experience, in turn, encouraging new talent into the labour force. Consequently, Italy’s overall Index score, increased by 0.4 per cent to 4.4.
Hungary’s economy has grown strongly over the last three years. In 2015, GDP growth was around three per cent, boosted by strong domestic demand. Private sector employment growth, aided by public works, had reduced the unemployment rate to six per cent in March 2016, its lowest since 2004. Positively, despite this, and the strong growth, our overall Index suggests that skills shortages have eased, lowering the country’s overall Index score from 6.3 in 2015 to 6.1 in 2016. This reflects a slowdown in wage pressures, and positive supply-side developments including an increase in labour participation and enhancements in labour flexibility. The main challenge continues to be widespread skills mismatches, reflecting differences in the kind of talent that employers are seeking and what the workforce has to offer.
Germany’s labour market continues to be buoyant, boosted by strong domestic demand in the economy – wage growth is, consequently, robust. Helpful supply-side developments reduced the value of the Index slightly from 6.4 in 2015 to 6.3 in 2016, moving it closer to balance. Among these were increases in both educational and labour market flexibility, and an increase in the participation rate. It is important the supply side continues to improve in the future, to prevent the build-up of bottlenecks in the labour market and a further acceleration of wage growth, which might otherwise undermine the positive trajectory.
Japan is undertaking an ongoing programme of structural reforms to tackle the problems it faces. Amongst these are its shrinking workforce, which negatively impacts the supply of labour. To attempt to address this problem the government has implemented a number of policies, including the so called ‘womenomics’ policies, aimed at boosting female participation rates. It is also trying to boost inward migration, by making it easier for highly skilled foreign professionals to obtain visas, especially in the IT field. By those efforts, talent mismatch and labour market participation improved slightly this year, leading to a modest shift towards a more balanced position in the Index from 6.1 in 2015 to 6.0 in 2016.
The talent pool is now being supplemented by increased female participation in the workforce… Wages for temporary workers are rising and skilled migration is being endorsed by the government.Marc Burrage, Managing Director, Hays Japan
While overall wage pressures have eased slightly in comparison to 2015, talent shortages and increasing regulations have resulted in a tightening in the labour market, and employers must be flexible and innovative to attract top talent.Dean Stallard, Regional Director, Hays Hong Kong
16 | The Hays Global Skills Index 2016 The Hays Global Skills Index 2016 | 17
The role governments have to playThe global financial crisis has had a lasting impact on the global economy. What had first seemed a crisis that affected the developed economies of Europe and North America, has eventually taken the wind out of the sails of many emerging economies, through much weaker flows in world trade and most recently lower world commodity prices. Labour markets have felt the brunt of these shocks, with higher unemployment, less employment security, and pay often struggling to keep pace with costs of living. In the face of such pressures, it is perhaps not surprising that the past few years have seen governments especially active in intervening in labour markets.
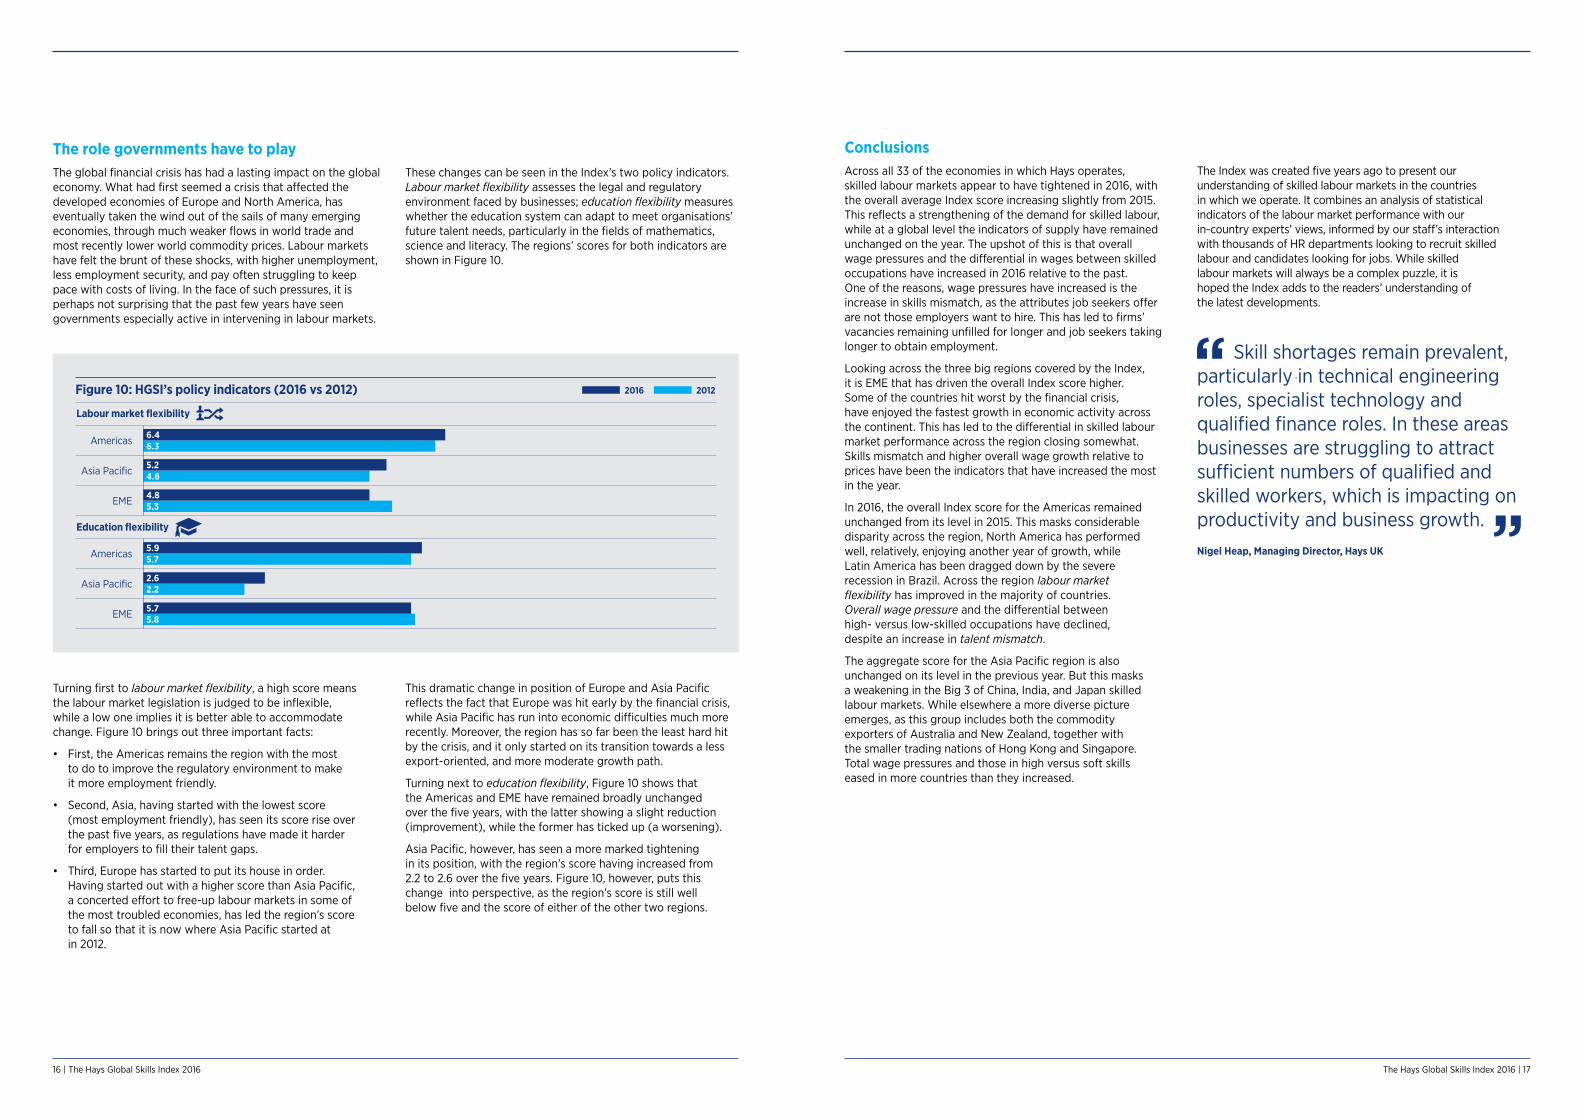
These changes can be seen in the Index’s two policy indicators. Labour market flexibility assesses the legal and regulatory environment faced by businesses; education flexibility measures whether the education system can adapt to meet organisations’ future talent needs, particularly in the fields of mathematics, science and literacy. The regions’ scores for both indicators are shown in Figure 10.
Turning first to labour market flexibility, a high score means the labour market legislation is judged to be inflexible, while a low one implies it is better able to accommodate change. Figure 10 brings out three important facts:
• First, the Americas remains the region with the most to do to improve the regulatory environment to make it more employment friendly.
• Second, Asia, having started with the lowest score (most employment friendly), has seen its score rise over the past five years, as regulations have made it harder for employers to fill their talent gaps.
• Third, Europe has started to put its house in order. Having started out with a higher score than Asia Pacific, a concerted effort to free-up labour markets in some of the most troubled economies, has led the region’s score to fall so that it is now where Asia Pacific started at in 2012.
This dramatic change in position of Europe and Asia Pacific reflects the fact that Europe was hit early by the financial crisis, while Asia Pacific has run into economic difficulties much more recently. Moreover, the region has so far been the least hard hit by the crisis, and it only started on its transition towards a less export-oriented, and more moderate growth path.
Turning next to education flexibility, Figure 10 shows that the Americas and EME have remained broadly unchanged over the five years, with the latter showing a slight reduction (improvement), while the former has ticked up (a worsening).
Asia Pacific, however, has seen a more marked tightening in its position, with the region’s score having increased from 2.2 to 2.6 over the five years. Figure 10, however, puts this change into perspective, as the region’s score is still well below five and the score of either of the other two regions.
Asia Pacific
Americas
EME
Asia Pacific
Americas
EME
Labour market flexibility
Education flexibility
2016 2012Figure 10: HGSI’s policy indicators (2016 vs 2012)
6.36.4
4.85.2
5.34.8
5.75.9
2.22.6
5.85.7
ConclusionsAcross all 33 of the economies in which Hays operates, skilled labour markets appear to have tightened in 2016, with the overall average Index score increasing slightly from 2015. This reflects a strengthening of the demand for skilled labour, while at a global level the indicators of supply have remained unchanged on the year. The upshot of this is that overall wage pressures and the differential in wages between skilled occupations have increased in 2016 relative to the past. One of the reasons, wage pressures have increased is the increase in skills mismatch, as the attributes job seekers offer are not those employers want to hire. This has led to firms’ vacancies remaining unfilled for longer and job seekers taking longer to obtain employment.
Looking across the three big regions covered by the Index, it is EME that has driven the overall Index score higher. Some of the countries hit worst by the financial crisis, have enjoyed the fastest growth in economic activity across the continent. This has led to the differential in skilled labour market performance across the region closing somewhat. Skills mismatch and higher overall wage growth relative to prices have been the indicators that have increased the most in the year.
In 2016, the overall Index score for the Americas remained unchanged from its level in 2015. This masks considerable disparity across the region, North America has performed well, relatively, enjoying another year of growth, while Latin America has been dragged down by the severe recession in Brazil. Across the region labour market flexibility has improved in the majority of countries. Overall wage pressure and the differential between high- versus low-skilled occupations have declined, despite an increase in talent mismatch.
The aggregate score for the Asia Pacific region is also unchanged on its level in the previous year. But this masks a weakening in the Big 3 of China, India, and Japan skilled labour markets. While elsewhere a more diverse picture emerges, as this group includes both the commodity exporters of Australia and New Zealand, together with the smaller trading nations of Hong Kong and Singapore. Total wage pressures and those in high versus soft skills eased in more countries than they increased.
The Index was created five years ago to present our understanding of skilled labour markets in the countries in which we operate. It combines an analysis of statistical indicators of the labour market performance with our in-country experts’ views, informed by our staff’s interaction with thousands of HR departments looking to recruit skilled labour and candidates looking for jobs. While skilled labour markets will always be a complex puzzle, it is hoped the Index adds to the readers’ understanding of the latest developments.
Skill shortages remain prevalent, particularly in technical engineering roles, specialist technology and qualified finance roles. In these areas businesses are struggling to attract sufficient numbers of qualified and skilled workers, which is impacting on productivity and business growth.Nigel Heap, Managing Director, Hays UK

18 | The Hays Global Skills Index 2016 The Hays Global Skills Index 2016 | 19
THE REGIONAL PICTUREThe country dashboards present a detailed breakdown of labour market pressures for each of the 33 countries featured in the Hays Global Skills Index. Seven indicators contribute equally to the overall Index score for each country,* providing insights into the state of the economy, the makeup of the labour market, education and wage pressures by industry and occupation.
* Due to the lack of availability of Colombian occupational wage data, the overall Index score was calculated using six indicators. Due to the lack of availability of Malaysian structural unemployment data, we did not calculate the country’s Talent Mismatch score and therefore the overall Index score was calculated using six indicators. Due to the lack of availability of UAE structural and long-term unemployment and vacancies data, we did not calculate the country’s Talent Mismatch score and therefore the overall Index score was calculated using six indicators.
Note: The analysis on which the Hays Global Skills Index was based utilised data as of Q2 2016.Developments subsequent to this date are not reflected in the 2016 findings.
Note: The analysis on which the Hays Global Skills Index was based utilised data as of Q2 2016. Developments subsequent to this date are not reflected in the 2016 findings.
THE A
MERICA
STHE
AM
ERIC
AS
20 | The Hays Global Skills Index 2016 The Hays Global Skills Index 2016 | 21
CANADACountry profileReal GDP growth was strong in the early part of 2016, supported by consumer spending and net trade.
Business investment remains weak, as energy and commodity companies cut investment spending due to the low level of oil, gas and other commodity prices.
Both monetary and fiscal policy remain accommodating, enhancing the prospects for stronger growth.
Background economic data2015 2016†
Population 35.8 m 36.2m
GDP
GDP (Billion CAD*) 1,990 2,014
GDP growth 1.1% 1.2%
GDP/head (CAD*) 55,600 55,600
Unemployment
Unemployment rate 6.9% 7.0%
Long-term unemployment rate 0.5% 0.5%
*2016 prices †Average forecast figures for 2016
View from the groundThe Canadian economy is still feeling the effect of the downturn in the oil and gas and commodities markets. This has especially impacted Alberta, with the Fort McMurray wildfires causing further setbacks for the region. Nationally we are seeing positive signs, with GDP expanding at its fastest rate in a year in the first quarter of 2016, and the three biggest provinces – British Columbia, Ontario and Quebec – are all seeing steady growth. This is largely driven by booming construction, a strong banking and financial sector, and the fast growing IT and technology sector. The overall shortage of skilled workers shows no sign of improving, especially as more baby boomers retire every year without enough experienced professionals available to replace them.
Rowan O’Grady, President, Hays Canada
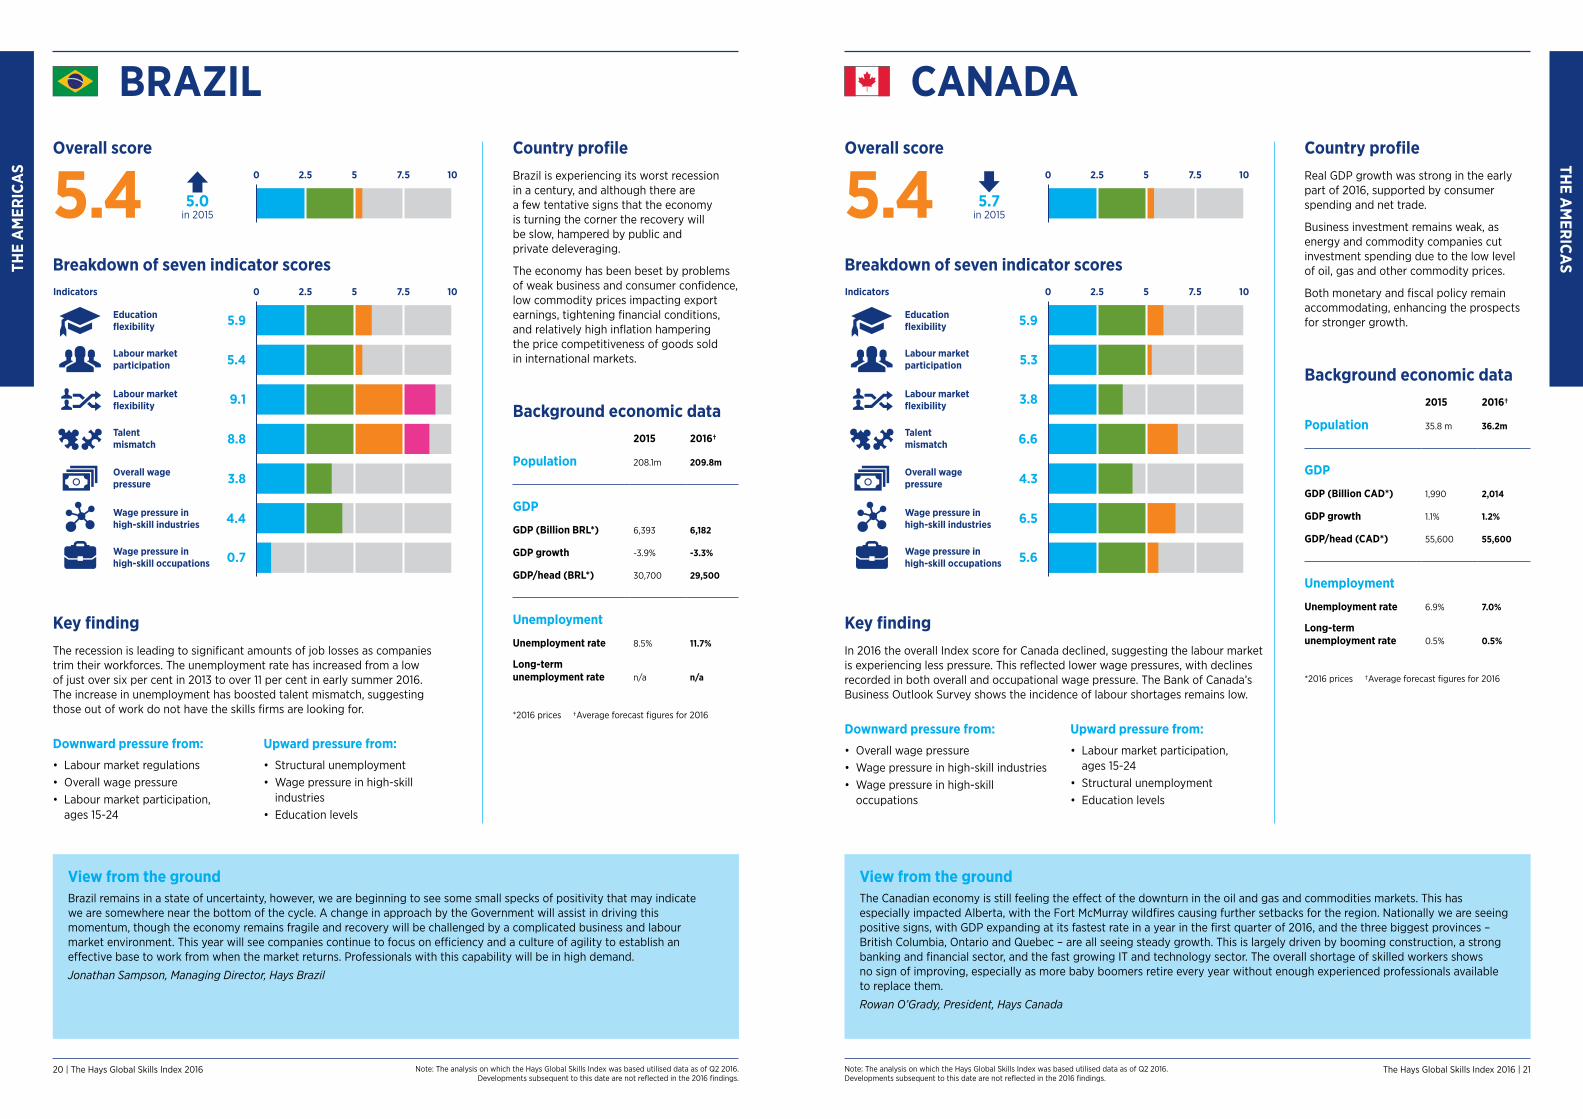
Key findingIn 2016 the overall Index score for Canada declined, suggesting the labour market is experiencing less pressure. This reflected lower wage pressures, with declines recorded in both overall and occupational wage pressure. The Bank of Canada’s Business Outlook Survey shows the incidence of labour shortages remains low.
Downward pressure from:• Overall wage pressure • Wage pressure in high-skill industries• Wage pressure in high-skill
occupations
Upward pressure from:• Labour market participation,
ages 15-24• Structural unemployment• Education levels
Breakdown of seven indicator scores
5.9
3.8
5.3
6.6
4.3
6.5
5.6
0Indicators 2.5 5 7.5 10
Wage pressure in high-skill occupations
Educationflexibility
Labour market participation
Labour market flexibility
Talent mismatch
Overall wage pressure
Wage pressure in high-skill industries
Overall score
5.7in 20155.4 0 2.5 5 7.5 10
View from the groundBrazil remains in a state of uncertainty, however, we are beginning to see some small specks of positivity that may indicate we are somewhere near the bottom of the cycle. A change in approach by the Government will assist in driving this momentum, though the economy remains fragile and recovery will be challenged by a complicated business and labour market environment. This year will see companies continue to focus on efficiency and a culture of agility to establish an effective base to work from when the market returns. Professionals with this capability will be in high demand.
Jonathan Sampson, Managing Director, Hays Brazil
Country profileBrazil is experiencing its worst recession in a century, and although there are a few tentative signs that the economy is turning the corner the recovery will be slow, hampered by public and private deleveraging.
The economy has been beset by problems of weak business and consumer confidence, low commodity prices impacting export earnings, tightening financial conditions, and relatively high inflation hampering the price competitiveness of goods sold in international markets.
Background economic data2015 2016†
Population 208.1m 209.8m
GDP
GDP (Billion BRL*) 6,393 6,182
GDP growth -3.9% -3.3%
GDP/head (BRL*) 30,700 29,500
Unemployment
Unemployment rate 8.5% 11.7%
Long-term unemployment rate n/a n/a
*2016 prices †Average forecast figures for 2016
Key findingThe recession is leading to significant amounts of job losses as companies trim their workforces. The unemployment rate has increased from a low of just over six per cent in 2013 to over 11 per cent in early summer 2016. The increase in unemployment has boosted talent mismatch, suggesting those out of work do not have the skills firms are looking for.
Downward pressure from:• Labour market regulations• Overall wage pressure • Labour market participation,
ages 15-24
Upward pressure from:• Structural unemployment• Wage pressure in high-skill
industries• Education levels
Breakdown of seven indicator scores
5.9
9.1
5.4
8.8
3.8
4.4
0.7
0Indicators 2.5 5 7.5 10
Wage pressure in high-skill occupations
Educationflexibility
Labour market participation
Labour market flexibility
Talent mismatch
Overall wage pressure
Wage pressure in high-skill industries
Overall score
5.0in 20155.4 0 2.5 5 7.5 10
BRAZIL

Note: The analysis on which the Hays Global Skills Index was based utilised data as of Q2 2016.Developments subsequent to this date are not reflected in the 2016 findings.
Note: The analysis on which the Hays Global Skills Index was based utilised data as of Q2 2016. Developments subsequent to this date are not reflected in the 2016 findings.
THE A
MERICA
STHE
AM
ERIC
AS
22 | The Hays Global Skills Index 2016 The Hays Global Skills Index 2016 | 23
COLOMBIACountry profileDespite facing a severe terms of trade deterioration due to the decline in commodity prices, the Colombian economy was one of the region’s top performers last year.
Real GDP growth is projected to be between two and three per cent in 2016, before gradually increasing in the medium term.
Background economic data2015 2016†
Population 48.2m 48.6m
GDP
GDP (Billion COP*) 842,086 863,969
GDP growth 3.1% 2.6%
GDP/head (COP*) 17,470,700 17,766,500
Unemployment
Unemployment rate 9.0% 9.4%
Long-term unemployment rate n/a n/a
*2016 prices †Average forecast figures for 2016
Due to the lack of availability of Colombian occupational wage data, the overall Index score was calculated using six indicators.
View from the groundColombia’s economy slowed during 2015 and continued to do so in the first half of 2016. Following the sharp drop in oil price, the country has been left with a unsustainable external imbalance hitting the crude-dependent economy hard and causing a devaluation of the Colombian Peso and a 6.7 per cent inflation rate for 2015. Industrial and tourism sectors benefitted from the new exchange rate and consequently the economy has stabilised at a lower growth rate. This has affected the labour market with less pressure on salaries, mainly for high-skill industries. Even three per cent economic growth would not be enough to reduce the overall labour market pressure the country is currently experiencing.
Axel Dono, Managing Director, Hays Colombia
Key findingColombia’s overall Index score increased in 2016 suggesting the skilled labour market has tightened. This reflects the twin impacts of reduced labour supply (as measured by a deterioration in education flexibility and labour market participation) and increased overall wage pressures.
Downward pressure from:• Wage pressure in high-skill
industries• Education levels• Labour market participation,
ages 55-64
Upward pressure from:• Overall wage pressure • Labour market participation• Structural unemployment
Breakdown of seven indicator scores
6.1
7.3
8.3
6.6
5.0
3.2
n/a
0Indicators 2.5 5 7.5 10
Wage pressure in high-skill occupations
Educationflexibility
Labour market participation
Labour market flexibility
Talent mismatch
Overall wage pressure
Wage pressure in high-skill industries
Overall score
5.9in 20156.1 0 2.5 5 7.5 10
View from the groundLast year was characterised by rising unemployment and economic growth around two per cent. Chile continues to face important challenges and so management of the economy must be fiscally responsible in order to provide a solid foundation for maintaining and increasing the country’s medium- and long-term growth. The country has experienced an economic slowdown over the past two years, this year it is still expected to grow but at a slower pace. During this time government reforms were undertaken, but have not helped to tackle the country’s poor productivity.
Pedro Lacerda, Managing Director, Hays Chile
Country profileThe outlook for Chile remains mixed. While both consumer and business sentiment stayed at pessimistic levels, reflecting uncertainty about the impact of constitutional and labour market reforms, nominal wage growth continues to outstrip inflation and industrial production may be stabilising.
Over the last year, a mini boom in the construction sector which spurred job creation has kept unemployment low.
Background economic data2015 2016†
Population 18.0m 18.2m
GDP
GDP (Billion CLP*) 161,704 164,524
GDP growth 2.1% 1.7%
GDP/head (CLP*) 8,998,100 9,062,800
Unemployment
Unemployment rate 6.2% 6.7%
Long-term unemployment rate n/a n/a
*2016 prices †Average forecast figures for 2016
Key findingThe past year was characterised by rising unemployment rates in Chile. Skills mismatch is continuing to ease as a result of a reduction in vacancies. The country’s higher participation rates push the final score further down.
Downward pressure from:• Job vacancies• Labour market participation• Wage pressure in high-skill
occupations
Upward pressure from:• Structural unemployment• Wage pressure in high-skill
industries• Education levels
Breakdown of seven indicator scores
5.9
6.2
5.1
2.9
5.8
5.0
1.8
0Indicators 2.5 5 7.5 10
Wage pressure in high-skill occupations
Educationflexibility
Labour market participation
Labour market flexibility
Talent mismatch
Overall wage pressure
Wage pressure in high-skill industries
Overall score
4.8in 20154.7 0 2.5 5 7.5 10
CHILE

Note: The analysis on which the Hays Global Skills Index was based utilised data as of Q2 2016.Developments subsequent to this date are not reflected in the 2016 findings.
Note: The analysis on which the Hays Global Skills Index was based utilised data as of Q2 2016. Developments subsequent to this date are not reflected in the 2016 findings.
THE A
MERICA
STHE
AM
ERIC
AS
24 | The Hays Global Skills Index 2016 The Hays Global Skills Index 2016 | 25
UNITED STATESCountry profileBroadly speaking, the United States economy continues to perform well. Labour demand continues to pick up.
Over the past year, about 2.4 million new jobs have been created.
The unemployment rate has declined to 4.7 per cent, its lowest level since before the financial crisis and ensuing recession.
Background economic data2015 2016†
Population 321.4m 324.0m
GDP
GDP (Billion USD*) 18,244 18,518
GDP growth 2.6% 1.5%
GDP/head (USD*) 56,800 57,200
Unemployment
Unemployment rate 5.3% 4.8%
Long-term unemployment rate 1.2% 1.0%
*2016 prices †Average forecast figures for 2016
View from the groundAs the economy improves for another quarter in a row, we are seeing increased job creation and higher wages. Labour force participation has increased, however, we are not seeing that translate into reduced skills shortages. There is a talent mismatch, so employers are still struggling to fill niche roles, while some job seekers are struggling to find a suitable role. The country’s busiest sectors such as construction, IT and technology, banking and financial, and life sciences are experiencing talent shortages that challenge productivity and growth. The 2016 election result will have a significant impact on the federal economy, but it will be some time before we know the full ramifications.
Dan Rodriguez, Managing Director, Hays USA
Key findingIn 2016, skilled labour markets across the United States have become slightly healthier according to the Hays Global Skills Index. This primarily reflects declining wage pressures, and improvements in labour supply as education flexibility and labour market participation rose.
Downward pressure from:• Labour market participation• Long-term unemployment• Wage pressure in high-skill
occupations
Upward pressure from:• Wage pressure in high-skill
industries• Job vacancies• Education levels
Breakdown of seven indicator scores
6.6
4.8
3.7
10.0
6.5
9.9
4.9
0Indicators 2.5 5 7.5 10
Wage pressure in high-skill occupations
Educationflexibility
Labour market participation
Labour market flexibility
Talent mismatch
Overall wage pressure
Wage pressure in high-skill industries
Overall score
6.9in 20156.6 0 2.5 5 7.5 10
View from the groundMexico has recently seen changes made to its economic model, the expansion of Mexican companies and a large increase in foreign investment, all of which has led to further demand for skilled professionals, many of which are not available in Mexico. The Index indicators show us that this vicious circle is a major factor of wage pressures, evident in the country as a response to the supply and demand of skilled individuals, especially in highly specialised industries. On the other hand, the structural reforms designed to improve the competitiveness of the country are certainly a big step in the right direction, but the combination of a continued lack of qualified talent, strong wage pressure in highly skilled sectors and restrictions on labour flexibility should be finally resolved if we want to become an incubator for world-class talent.
Gerardo Kanahuati, Country Manager, Hays Mexico
Country profileMexican GDP growth remains remarkably strong considering the external headwinds the economy is facing.
Domestic demand continues to drive growth, with strong consumer spending supported by solid labour market conditions particularly in the service sector and an increase in funds sent home from overseas.
Background economic data2015 2016†
Population 127.2m 128.8m
GDP
GDP (Billion MXN*) 18,702 19,139
GDP growth 2.5% 2.3%
GDP/head (MXN*) 147,000 148,600
Unemployment
Unemployment rate 4.3% 4.2%
Long-term unemployment rate 0.1% 0.1%
*2016 prices †Average forecast figures for 2016
Key findingMexico’s overall Index score remains unchanged on the year. Upward pressure from a reduction in the supply of labour due to lower participation, was offset with a rise in talent mismatch and overall wage pressures.
Downward pressure from:• Long-term unemployment• Labour market regulations• Overall wage pressure
Upward pressure from:• Labour market participation• Wage pressure in high-skill
industries• Education levels
Breakdown of seven indicator scores
4.8
7.0
4.8
4.7
5.0
10.0
3.0
0Indicators 2.5 5 7.5 10
Wage pressure in high-skill occupations
Educationflexibility
Labour market participation
Labour market flexibility
Talent mismatch
Overall wage pressure
Wage pressure in high-skill industries
Overall score
5.6in 20155.6 0 2.5 5 7.5 10
MEXICO
26 | The Hays Global Skills Index 2016 The Hays Global Skills Index 2016 | 27
ASIA
PACIFICA
SIA
PA
CIFI
C
Note: The analysis on which the Hays Global Skills Index was based utilised data as of Q2 2016.Developments subsequent to this date are not reflected in the 2016 findings.
Note: The analysis on which the Hays Global Skills Index was based utilised data as of Q2 2016. Developments subsequent to this date are not reflected in the 2016 findings.
CHINACountry profileThe latest Chinese data suggests risks of a severe slowdown in Chinese GDP growth have abated, as better exports and steady infrastructure investment offset downward pressures from increasingly weak corporate investment.
Some forecasters (like the IMF) predict the Chinese economy will settle at about six per cent growth in 2017.
Risks to this forecast surface from rapidly rising credit growth, excess capacity in sectors such as coal mining and steel production, and the state of the financial sector.
Background economic data2015 2016†
Population 1,376.8m 1,382.9m
GDP
GDP (Billion CNY*) 69,161 73,674
GDP growth 6.9% 6.5%
GDP/head (CNY*) 50,200 53,300
Unemployment
Unemployment rate 4.0% 4.0%
Long-term unemployment rate n/a n/a
*2016 prices †Average forecast figures for 2016
View from the groundAs China’s labour market adjusts to the slower overall economic growth rate, employers are facing talent management challenges often specific to their individual industry sector. Recruitment and retention within traditional manufacturing and industrial sectors are driven by the need to increase productivity, with employers focused on upskilling their leadership and technical teams in a climate of tight cost control. In contrast, the ongoing skills shortage in the High Tech industrial, Internet and eCommerce, and Lifestyle Services sectors continues to fuel fierce competition for talent, and put upwards pressure on salaries. Employers are advised to have a strong industry-specific recruitment strategy in place, integrating their Employee Value Proposition (EVP) throughout the employee lifecycle.
Simon Lance, Managing Director, Hays China
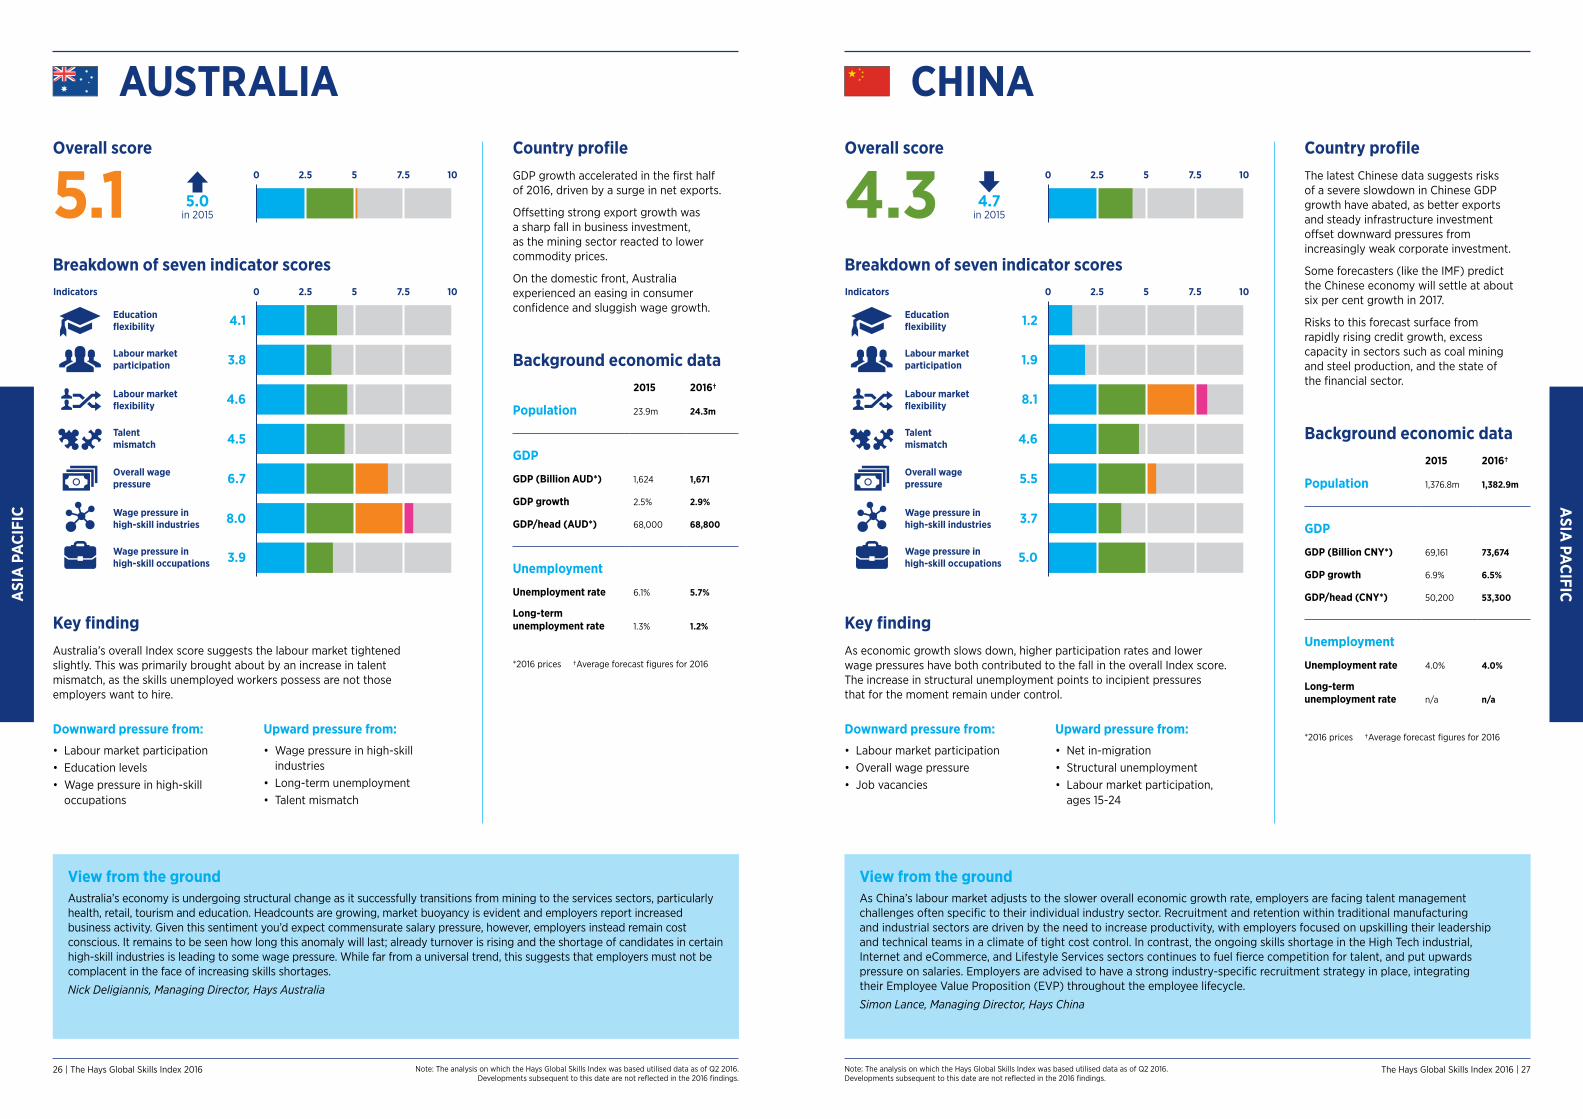
Key findingAs economic growth slows down, higher participation rates and lower wage pressures have both contributed to the fall in the overall Index score. The increase in structural unemployment points to incipient pressures that for the moment remain under control.
Downward pressure from:• Labour market participation• Overall wage pressure• Job vacancies
Upward pressure from:• Net in-migration • Structural unemployment• Labour market participation,
ages 15-24
Breakdown of seven indicator scores
1.2
8.1
1.9
4.6
5.5
3.7
5.0
0Indicators 2.5 5 7.5 10
Wage pressure in high-skill occupations
Educationflexibility
Labour market participation
Labour market flexibility
Talent mismatch
Overall wage pressure
Wage pressure in high-skill industries
Overall score
4.7in 20154.3 0 2.5 5 7.5 10
View from the groundAustralia’s economy is undergoing structural change as it successfully transitions from mining to the services sectors, particularly health, retail, tourism and education. Headcounts are growing, market buoyancy is evident and employers report increased business activity. Given this sentiment you’d expect commensurate salary pressure, however, employers instead remain cost conscious. It remains to be seen how long this anomaly will last; already turnover is rising and the shortage of candidates in certain high-skill industries is leading to some wage pressure. While far from a universal trend, this suggests that employers must not be complacent in the face of increasing skills shortages.
Nick Deligiannis, Managing Director, Hays Australia
Country profileGDP growth accelerated in the first half of 2016, driven by a surge in net exports.
Offsetting strong export growth was a sharp fall in business investment, as the mining sector reacted to lower commodity prices.
On the domestic front, Australia experienced an easing in consumer confidence and sluggish wage growth.
Background economic data2015 2016†
Population 23.9m 24.3m
GDP
GDP (Billion AUD*) 1,624 1,671
GDP growth 2.5% 2.9%
GDP/head (AUD*) 68,000 68,800
Unemployment
Unemployment rate 6.1% 5.7%
Long-term unemployment rate 1.3% 1.2%
*2016 prices †Average forecast figures for 2016
AUSTRALIA
Key findingAustralia’s overall Index score suggests the labour market tightened slightly. This was primarily brought about by an increase in talent mismatch, as the skills unemployed workers possess are not those employers want to hire.
Downward pressure from:• Labour market participation• Education levels• Wage pressure in high-skill
occupations
Upward pressure from:• Wage pressure in high-skill
industries• Long-term unemployment• Talent mismatch
Breakdown of seven indicator scores
4.1
4.6
3.8
4.5
6.7
8.0
3.9
0Indicators 2.5 5 7.5 10
Wage pressure in high-skill occupations
Educationflexibility
Labour market participation
Labour market flexibility
Talent mismatch
Overall wage pressure
Wage pressure in high-skill industries
Overall score
5.0in 20155.1 0 2.5 5 7.5 10

28 | The Hays Global Skills Index 2016 The Hays Global Skills Index 2016 | 29
ASIA
PACIFICA
SIA
PA
CIFI
C
Note: The analysis on which the Hays Global Skills Index was based utilised data as of Q2 2016.Developments subsequent to this date are not reflected in the 2016 findings.
Note: The analysis on which the Hays Global Skills Index was based utilised data as of Q2 2016. Developments subsequent to this date are not reflected in the 2016 findings.
INDIACountry profileThe latest headline GDP figures cement India’s position as one of the brighter spots amongst the emerging markets.
Investment growth continues to disappoint, suggesting growth has yet to become broad based.
Population demographics are very favourable, with the working-age population predicted to grow strongly.
Background economic data2015 2016†
Population 1,313.0m 1,328.8m
GDP
GDP (Billion INR*) 136,873 147,169
GDP growth 7.2% 7.5%
GDP/head (INR*) 104,200 110,800
Unemployment
Unemployment rate 5.5% 5.5%
Long-term unemployment rate n/a n/a
*2016 prices †Average forecast figures for 2016
View from the groundIndia’s growth will significantly depend on the way the global economy performs, as the last few years have witnessed a growing correlation, especially growth in the export of services. Last year many organisations adopted a comprehensive approach to reward which is beginning to show an impact and is one of the contributing reasons for the ’wage pressure in high-skill industries’ indicator falling. Uncertainty in the market has made the workforce cautious of change and therefore employers will need to focus on innovative attraction strategies in high-skilled/niche workforces along with retention focusing on agile and dynamic skill development plans.
Matthew Dickason, Global Managing Director, Hays Talent Solutions
Key findingIndia’s skilled labour market experienced less pressure in 2016 according to the Hays Global Skills Index. This largely reflected the narrowing of the high-skill industry wage premium which can be traced to strong growth in compensation in the industrial sector.
Downward pressure from:• Wage pressure in high-skill
industries• Overall wage pressure• Structural unemployment
Upward pressure from:• Education levels• Long-term unemployment• Labour market regulations
Breakdown of seven indicator scores
0.3
8.5
4.1
4.9
6.4
4.2
5.0
0Indicators 2.5 5 7.5 10
Wage pressure in high-skill occupations
Educationflexibility
Labour market participation
Labour market flexibility
Talent mismatch
Overall wage pressure
Wage pressure in high-skill industries
Overall score
5.0in 20154.8 0 2.5 5 7.5 10
View from the groundWith Hong Kong being an open economy, it can be susceptible to external factors, and this is highlighted through slower GDP growth due to current global economic conditions, particularly in China. Hong Kong’s position as a leading global financial centre and regional hub remains stable with continuous candidate demand and vacancy activity indicating positive business sentiment. While overall wage pressures have eased slightly in comparison to 2015, talent shortages and increasing regulations have resulted in a tightening in the labour market, and employers must be flexible and innovative to attract top talent.
Dean Stallard, Regional Director, Hays Hong Kong
Country profileHong Kong’s economy displays poor growth rates this year.
Consumer spending, generally the key driver of growth, is falling, while investment is dipping mainly due to a large fall of private investment in machinery and equipment.
However, on the positive side, the labour market remains fairly solid and fiscal policy is now providing support.
Background economic data2015 2016†
Population 7.3m 7.4m
GDP
GDP (Billion HKD*) 2,447 2,468
GDP growth 2.4% 0.9%
GDP/head (HKD*) 335,400 335,700
Unemployment
Unemployment rate 3.3% 3.4%
Long-term unemployment rate n/a n/a
*2016 prices †Average forecast figures for 2016
HONG KONG
Key findingSlowing growth in participation rates and stable net in-migration are indicative of upward pressure in the labour market. Relief is provided by an easing in overall wage pressure, fewer job vacancies and improved education levels.
Downward pressure from:• Overall wage pressure• Job vacancies• Education levels
Upward pressure from:• Labour market participation• Net in-migration • Talent mismatch
Breakdown of seven indicator scores
1.8
2.7
6.2
5.0
9.3
6.2
0.0
0Indicators 2.5 5 7.5 10
Wage pressure in high-skill occupations
Educationflexibility
Labour market participation
Labour market flexibility
Talent mismatch
Overall wage pressure
Wage pressure in high-skill industries
Overall score
4.5in 20154.5 0 2.5 5 7.5 10

30 | The Hays Global Skills Index 2016 The Hays Global Skills Index 2016 | 31
ASIA
PACIFICA
SIA
PA
CIFI
C
Note: The analysis on which the Hays Global Skills Index was based utilised data as of Q2 2016.Developments subsequent to this date are not reflected in the 2016 findings.
Note: The analysis on which the Hays Global Skills Index was based utilised data as of Q2 2016. Developments subsequent to this date are not reflected in the 2016 findings.
MALAYSIACountry profileThe Malaysian economy is estimated to have grown by five per cent in 2015, below the six per cent growth in real GDP posted in 2014.
Forecasters expect growth in 2016 and 2017 to be between four and five per cent.
Exporters will benefit from the sharp depreciation in the Ringgit last year.
Background economic data2015 2016†
Population 30.4m 30.8m
GDP
GDP (Billion MYR*) 1,157 1,207
GDP growth 5.0% 4.3%
GDP/head (MYR*) 38,100 39,200
Unemployment
Unemployment rate 3.1% 3.4%
Long-term unemployment rate n/a n/a
*2016 prices †Average forecast figures for 2016
Due to the lack of availability of Malaysian structural unemployment data, we did not calculate the country’s Talent Mismatch score and therefore the overall Index score was calculated using six indicators.
View from the groundDespite the global economic downturn in 2016, Malaysia has emerged fairly resilient to external factors, with stronger GDP growth expected compared to its neighbours. While currency devaluation, increasing taxes and costs have resulted in slower business growth, a fundamental shortage of skilled talent in Malaysia bolsters hiring sentiments in the skilled human capital market, as seen from strong candidate demand and vacancy activity. With tightening labour regulations, talent shortages and a higher cost of living, it is not surprising that the labour market is stressed, placing upward pressure on wages. We expect competition for highly skilled talent to intensify.
Tom Osborne, Regional Director, Hays Malaysia
Key findingMalaysia’s overall Index score suggests skilled labour market conditions tightened in 2016. This reflects a growth in wage pressures evident both at the industry level and for high-skill occupations. These wage pressures were boosted by a tightening in the flexibility of the labour market, which adversely impacted labour supply.
Downward pressure from:• Overall wage pressure• Labour market participation,
ages 55-64• Labour market participation
Upward pressure from:• Wage pressure in high-skill
occupations• Wage pressure in high-skill
industries• Education levels
Breakdown of seven indicator scores
5.4
6.1
3.7
n/a
5.3
5.2
4.9
0Indicators 2.5 5 7.5 10
Wage pressure in high-skill occupations
Educationflexibility
Labour market participation
Labour market flexibility
Talent mismatch
Overall wage pressure
Wage pressure in high-skill industries
Overall score**
4.8in 20155.1 0 2.5 5 7.5 10
View from the groundLabour market reforms and initiatives are slowly leading Japan in the right direction, however, further changes are required to address ongoing structural challenges. The talent pool is now being supplemented by increased female participation in the workforce; a key opportunity requiring ongoing attention. Wages for temporary workers are rising and skilled migration is being endorsed by the government. Nevertheless, the talent mismatch continues to be one of the main challenges, despite the slight reduction from the highest possible score of 10 last year to 9.8 this year. With the added tension of high overall wage pressure, competition for talent will remain fierce in a challenging labour market.
Marc Burrage, Managing Director, Hays Japan
Country profileThe Japanese economy expanded very little over the past year.
The GDP breakdown shows a partial recovery in consumer spending and net exports, while business investment exerted a drag on expansion.
On the fiscal side, a stimulus package was approved in August; the package put particular emphasis on ensuring equal pay for equal work and raised the minimum wage.
Other reforms, such as reducing excessive work hours and encouraging telecommuting, aimed at opening up the labour market to women.
Background economic data2015 2016†
Population 126.5m 126.3m
GDP
GDP (Billion JPY*) 501,573 502,192
GDP growth 0.6% 0.1%
GDP/head (JPY*) 3,963,600 3,976,400
Unemployment
Unemployment rate 3.4% 3.0%
Long-term unemployment rate 1.3% 1.0%
*2016 prices †Average forecast figures for 2016
JAPAN
Key findingA lower long-term unemployment rate and a narrowing of the high-skill industry wage premium have both contributed to the fall in the overall Index score. However, rising job vacancies point to early pressures in the skilled labour market.
Downward pressure from:• Long-term unemployment• Wage pressure in high-skill
industries• Labour market participation,
ages 15-24
Upward pressure from:• Job vacancies • Overall wage pressure• Wage pressure in high-skill
occupations
Breakdown of seven indicator scores
2.9
6.7
6.0
9.8
8.2
1.0
7.1
0Indicators 2.5 5 7.5 10
Wage pressure in high-skill occupations
Educationflexibility
Labour market participation
Labour market flexibility
Talent mismatch
Overall wage pressure
Wage pressure in high-skill industries
Overall score
6.1in 20156.0 0 2.5 5 7.5 10
** Malaysia has been included in the Index for the first time this year. The country’s 2015 score reflects data for that year, and has been included for comparison purposes.

32 | The Hays Global Skills Index 2016 The Hays Global Skills Index 2016 | 33
ASIA
PACIFICA
SIA
PA
CIFI
C
Note: The analysis on which the Hays Global Skills Index was based utilised data as of Q2 2016.Developments subsequent to this date are not reflected in the 2016 findings.
Note: The analysis on which the Hays Global Skills Index was based utilised data as of Q2 2016. Developments subsequent to this date are not reflected in the 2016 findings.
Country profileLast year, New Zealand was characterised by robust GDP growth.
Net exports were a key driver behind the solid outcome, with a surge in tourism more than offsetting subdued goods exports.
Meanwhile, all the key elements of final domestic demand grew at a reasonable pace.
Household spending is forecast to remain robust this year, supported by firm labour market conditions.
Background economic data2015 2016†
Population 4.5m 4.6m
GDP
GDP (Billion NZD*) 250 257
GDP growth 3.0% 2.7%
GDP/head (NZD*) 55,200 56,200
Unemployment
Unemployment rate 5.4% 5.4%
Long-term unemployment rate 0.7% 0.7%
*2016 prices †Average forecast figures for 2016
View from the groundNew Zealand may no longer be a ‘rock star’ economy but a construction industry building significant momentum, most notably in Auckland, and a growing services sector are creating new roles and keeping the job market buoyant. At the same time, they are absorbing the inflow of both migrants and Kiwi’s returning home from Australia, with demand exceeding even this increased candidate supply. Yet as these findings show, labour market participation is already on the high side while wage pressure in high-skill industries cannot get more acute. Clearly new and creative strategies are required to identify and successfully attract the right candidates, especially in high-skill industries.
Jason Walker, Managing Director, Hays New Zealand
Key findingStrong net inward migration has boosted the talent pool available in New Zealand. This has led to employment growth and helped keep wage pressures relatively subdued. The Index rose due to an increase in the differences in wages paid in high-skill occupations relative to low-skilled ones.
Downward pressure from:• Growth in the working-age
population• Overall wage pressure• Education levels
Upward pressure from:• Labour market participation• Wage pressure in high-skill
occupations• Job vacancies
Breakdown of seven indicator scores
4.7
4.3
6.8
4.8
2.7
10.0
3.4
0Indicators 2.5 5 7.5 10
Wage pressure in high-skill occupations
Educationflexibility
Labour market participation
Labour market flexibility
Talent mismatch
Overall wage pressure
Wage pressure in high-skill industries
Overall score
5.1in 20155.2 0 2.5 5 7.5 10
NEW ZEALAND
View from the groundSingapore remains a popular choice as a strategic regional hub for multinational corporations looking to expand in Asia, particularly Southeast Asia. With IT, life sciences and banking & financial services as major driving forces behind a highly active recruitment market, businesses in Singapore continue to display positive albeit more cautious hiring sentiments. Temporary and contract roles are increasingly prevalent solutions to work around headcount limitations. While overall wage pressure has decreased slightly in comparison to 2015 (5.8 to 5.0), the local talent pool remains tight in high-skilled industries, placing upward wage pressure on roles in demand as employers seek to attract and retain talent.
Lynne Roeder, Managing Director, Hays Singapore
Country profileEconomic growth in Singapore has slowed down markedly in recent years.
Real GDP rose by two per cent in 2015, compared to 3.3 per cent in 2014.
This has led to an easing in labour market conditions.
The growth in net employment slowed down markedly in 2015, while the unemployment rate remained little changed.
Background economic data2015 2016†
Population 5.5m 5.6m
GDP
GDP (Billion SGD*) 402 410
GDP growth 2.0% 2.0%
GDP/head (SGD*) 72,400 72,900
Unemployment
Unemployment rate 1.9% 2.0%
Long-term unemployment rate 0.6% 0.6%
*2016 prices †Average forecast figures for 2016
Key findingLow scores for education and labour market flexibility highlight the slack in the Singaporean labour market. However, sustained periods of high long-term unemployment can exacerbate the skills shortage issues intimated by the wage premium in high-skill industries and occupations.
Downward pressure from:• Overall wage pressure• Education levels• Labour market participation
Upward pressure from:• Structural unemployment• Wage pressure in high-skill
occupations• Job vacancies
Breakdown of seven indicator scores
0.7
0.7
5.5
6.1
5.0
8.4
6.4
0Indicators 2.5 5 7.5 10
Wage pressure in high-skill occupations
Educationflexibility
Labour market participation
Labour market flexibility
Talent mismatch
Overall wage pressure
Wage pressure in high-skill industries
Overall score
4.7in 20154.7 0 2.5 5 7.5 10
SINGAPORE

34 | The Hays Global Skills Index 2016 The Hays Global Skills Index 2016 | 35
EURO
PE AN
D TH
E MID
DLE EA
STEURO
PE A
ND
TH
E M
IDD
LE E
AST
Note: The analysis on which the Hays Global Skills Index was based utilised data as of Q2 2016.Developments subsequent to this date are not reflected in the 2016 findings.
Note: The analysis on which the Hays Global Skills Index was based utilised data as of Q2 2016. Developments subsequent to this date are not reflected in the 2016 findings.
Country profileThe Austrian economy continues to recover, on the back of a strong pickup in exports.
Real GDP growth in 2016 is forecast to be twice the size of that in 2015.
However, the upturn in industrial production has not yet led to a pickup in the labour market.
Hours worked has shown little growth in recent years.
Background economic data2015 2016†
Population 8.6m 8.6m
GDP
GDP (Billion EUR*) 345 350
GDP growth 0.9% 1.2%
GDP/head (EUR*) 40,300 40,500
Unemployment
Unemployment rate 5.7% 5.9%
Long-term unemployment rate 1.6% 1.6%
*2016 prices †Average forecast figures for 2016
AUSTRIA
View from the groundThe Austrian economy has improved in certain areas in 2016, such as a small increase in imports, a very slight increase in the GNP, growth in consumer spending and an increase of gross industrial investments. On the other hand there were several negative factors, such as a continued increase in unemployment, an increase in inflation rates and an increase of the ratio debt to GNP. Unfortunately, the outlook for 2017 is not rosy. Austria is expected to experience no GNP growth, reduced consumer spending, stagnant industrial investment, a marked increase in unemployment and a further increase in inflation. Highly educated specialists are still in demand, but Austria must compete with Germany in trying to retain and attract the sought-after talent.
Mark Frost, Managing Director, Hays Austria
Key findingOverall wage pressure will continue to be the main issue for Austrian employers as Austria’s high and growing rate of long-term unemployment will increase the difficulty of recruiting the skilled personnel firms require.
Downward pressure from:• Net in-migration • Job vacancies• Education levels
Upward pressure from:• Long-term unemployment• Overall wage pressure• Labour market participation
Breakdown of seven indicator scores
5.0
3.4
5.7
3.6
8.2
7.2
3.6
0Indicators 2.5 5 7.5 10
Wage pressure in high-skill occupations
Educationflexibility
Labour market participation
Labour market flexibility
Talent mismatch
Overall wage pressure
Wage pressure in high-skill industries
Overall score
5.1in 20155.2 0 2.5 5 7.5 10
Country profileThe new administration has taken significant steps to boost job creation and cope with the cost of an ageing population – particularly through wage moderation, pension reform and a tax shift.
Businesses are taking advantage of the latter reform that reduces labour costs, helping the unemployment rate to drop, by also boosting private consumption.
Background economic data2015 2016†
Population 11.3m 11.3m
GDP
GDP (Billion EUR*) 415 420
GDP growth 1.4% 1.4%
GDP/head (EUR*) 36,700 37,000
Unemployment
Unemployment rate 8.5% 8.3%
Long-term unemployment rate 4.2% 4.0%
*2016 prices †Average forecast figures for 2016
BELGIUM
View from the groundIn 2015, the Belgian economy grew by 1.4 per cent and performed better than previously expected. The outlook for 2016 shows a similar growth pace but that should pick up again in 2017 to reach 1.5 per cent, the critical threshold for significant job creation. Thanks to structural reforms initiated by the Belgian Federal Government, such as lower taxes on labour, the overall job market will continue to improve. It is expected that around 140,000 extra jobs will be created up to 2018. However, skills shortages in high-skill areas such as engineering, IT, pharma and digital will continue to put pressure on the Belgian job market. On the other hand, important developments for the country are readiness for investments in R&D, rise of flexible jobs and digital and data profiles.
Robby Vanuxem, Managing Director, Hays Belgium
Key findingBelgium keeps attracting skilled foreign workers, with obvious gains to the alleviating the country’s skills gaps. Decreases in the overall and industrial wage pressures provide a further downward push to the overall score.
Downward pressure from:• Net in-migration • Overall wage pressure• Wage pressure in high-skill
industries
Upward pressure from:• Long-term unemployment• Labour market participation,
ages 15-24• Labour market regulations
Breakdown of seven indicator scores
6.0
3.6
5.8
1.6
2.6
0.0
4.3
0Indicators 2.5 5 7.5 10
Wage pressure in high-skill occupations
Educationflexibility
Labour market participation
Labour market flexibility
Talent mismatch
Overall wage pressure
Wage pressure in high-skill industries
Overall score
3.7in 20153.4 0 2.5 5 7.5 10

36 | The Hays Global Skills Index 2016 The Hays Global Skills Index 2016 | 37
EURO
PE AN
D TH
E MID
DLE EA
STEURO
PE A
ND
TH
E M
IDD
LE E
AST
Note: The analysis on which the Hays Global Skills Index was based utilised data as of Q2 2016.Developments subsequent to this date are not reflected in the 2016 findings.
Note: The analysis on which the Hays Global Skills Index was based utilised data as of Q2 2016. Developments subsequent to this date are not reflected in the 2016 findings.
Country profileThe Czech economy is experiencing a sharp deceleration in growth this year, with domestic demand likely to be the key driver.
However, the underlying outlook for the economy remains positive.
As investment cools, private consumption is forecast to take over as the main driver of growth, underpinned by very low inflationary pressures and a strong labour market.
Background economic data2015 2016†
Population 10.5m 10.5m
GDP
GDP (Billion CZK*) 4,604 4,699
GDP growth 4.6% 2.1%
GDP/head (CZK*) 437,000 445,500
Unemployment
Unemployment rate 5.1% 4.2%
Long-term unemployment rate 2.3% 1.5%
*2016 prices †Average forecast figures for 2016
CZECH REPUBLIC
View from the groundThe Czech Republic continues to enjoy positive economic trends from previous years. Proven success brings more investors to the country where we begin to see a shift from low to higher added value products. A stable political climate creates healthy entrepreneurship conditions. Export continues to be the main economy driver, with a key focus towards technologies. Industrial manufacturing stands for more than 47 per cent share of the overall GDP, making Czech Republic the most industrialised country in the EU. Further growth is expected in the business service segment, where more tasks and services are being deployed. Talent mismatch is prevalent now in more fields, which revitalise wage pressure after years of stagnation.
Ladislav Kučera, Managing Director, Hays Czech Republic
Key findingThe narrowing of the high-skill industry wage premium can be traced to strong earnings growth in the real estate sector. Low inflation, falling unemployment and rising real wages facilitate strong consumption growth.
Downward pressure from:• Wage pressure in high-skill
industries• Structural unemployment• Long-term unemployment
Upward pressure from:• Job vacancies• Labour market participation,
ages 15-24• Overall wage pressure
Breakdown of seven indicator scores
7.7
3.2
4.3
2.5
3.7
5.1
6.3
0Indicators 2.5 5 7.5 10
Wage pressure in high-skill occupations
Educationflexibility
Labour market participation
Labour market flexibility
Talent mismatch
Overall wage pressure
Wage pressure in high-skill industries
Overall score
4.9in 20154.7 0 2.5 5 7.5 10
Country profileThe strong labour market remains the key driver of the Danish economy.
Unemployment continues to trend downwards as the economic recovery continues, and wages remain robust along with salary growth.
The strong labour market is a central factor underpinning the robust growth in the consumer sector.
However, with the labour market continuing to pick up, spare resources will become increasingly scarce, potentially threatening the recovery.
Background economic data2015 2016†
Population 5.7m 5.7m
GDP
GDP (Billion DKK*) 2,000 2,027
GDP growth 1.0% 1.3%
GDP/head (DKK*) 353,300 356,600
Unemployment
Unemployment rate 6.2% 5.9%
Long-term unemployment rate 1.6% 1.4%
*2016 prices †Average forecast figures for 2016
DENMARK
View from the groundWe’re seeing a continuation of trends from last year. Companies are not only looking to bring international talent to Denmark, but are placing jobs in countries where talent already exists. This reality will become more predominant in the future as digitalisation and virtualisation of the workplace make remote workplaces more feasible. As expected, the number of job vacancies has significantly increased this year. This, coupled with a low unemployment rate and overall talent mismatch in the market, is resulting in increasing wage pressure for businesses in Denmark.
Morten Andersen, Business Director, Hays Denmark
Key findingAn uptick in the vacancy rate and increased wage pressure suggest the overall Index score is subject to upward pressures. In the long-term the declining labour market participation will weigh heavily on the Danish labour market.
Downward pressure from:• Structural unemployment• Long-term unemployment• Education levels
Upward pressure from:• Job vacancies• Overall wage pressure• Labour market participation
Breakdown of seven indicator scores
6.1
3.4
4.6
7.7
7.1
6.0
5.8
0Indicators 2.5 5 7.5 10
Wage pressure in high-skill occupations
Educationflexibility
Labour market participation
Labour market flexibility
Talent mismatch
Overall wage pressure
Wage pressure in high-skill industries
Overall score
5.0in 20155.8 0 2.5 5 7.5 10

38 | The Hays Global Skills Index 2016 The Hays Global Skills Index 2016 | 39
EURO
PE AN
D TH
E MID
DLE EA
STEURO
PE A
ND
TH
E M
IDD
LE E
AST
Note: The analysis on which the Hays Global Skills Index was based utilised data as of Q2 2016.Developments subsequent to this date are not reflected in the 2016 findings.
Note: The analysis on which the Hays Global Skills Index was based utilised data as of Q2 2016. Developments subsequent to this date are not reflected in the 2016 findings.
Country profileHousehold consumption is rebounding in France, fuelled by the lack of inflationary pressures and a slowly recovering labour market.
The country’s labour laws continue to cause controversy and stir public debate, although it is expected to support more sustained job creation in the private sector.
Background economic data2015 2016†
Population 66.3m 66.6m
GDP
GDP (Billion EUR*) 2,201 2,232
GDP growth 1.2% 1.4%
GDP/head (EUR*) 33,200 33,500
Unemployment
Unemployment rate 10.4% 9.9%
Long-term unemployment rate 4.4% 4.1%
*2016 prices †Average forecast figures for 2016
FRANCE
View from the groundFrance experienced vigorous economic activity in the first quarter of 2016 and growth is expected to be 1.4 per cent this year. Labour market reforms are providing businesses with more flexibility, which in turn could then be encouraged to hire more workers and increase their output. The labour market is already taking advantage of recent Government support for the employment market, including easier access to regulated professions and reduced labour costs, which will likely result in a beneficial competitive environment. The forecast unemployment rate is under 10 per cent for the end of the year. The region, therefore, could resist the current economic uncertainty witnessed internationally.
Tina Ling, Managing Director, Hays France & Benelux
Key findingLabour market flexibility will continue to be the main issue for French employers. The country’s high and growing rate of long-term unemployment will increase the difficulty of recruiting the skilled personnel firms require.
Downward pressure from:• Labour market participation• Structural unemployment• Overall wage pressure
Upward pressure from:• Long-term unemployment• Wage pressure in high-skill
industries• Job vacancies
Breakdown of seven indicator scores
3.8
8.2
5.0
6.7
5.3
5.5
3.9
0Indicators 2.5 5 7.5 10
Wage pressure in high-skill occupations
Educationflexibility
Labour market participation
Labour market flexibility
Talent mismatch
Overall wage pressure
Wage pressure in high-skill industries
Overall score
5.3in 20155.5 0 2.5 5 7.5 10
Country profileLike the Eurozone as a whole, the German economy experienced a healthy growth over the past year.
A key source of this strength was a robust rise in industrial production.
There are signs from recent pay deals that wage pressures are building as a result of labour market tightness.
This in turn may encourage firms to raise capacity primarily via capital spending rather than raising headcounts.
Background economic data2015 2016†
Population 81.7m 82.2m
GDP
GDP (Billion EUR*) 3,076 3,120
GDP growth 1.5% 1.4%
GDP/head (EUR*) 37,700 37,900
Unemployment
Unemployment rate 4.6% 4.2%
Long-term unemployment rate 2.1% 1.7%
*2016 prices †Average forecast figures for 2016
GERMANY
View from the groundThe rate of employment in Germany is at a record level. More than 43m people participate in the labour market and the stability of the German labour market is expected to continue in the coming years. There is a great demand for combining IT with Engineering as well as looking for IT security and Big Data experts, however, only a limited number are available. This clearly demonstrates that there is an ongoing need for an education system that is able to adjust to the needs of business and address trends more quickly. Also, Germany needs more flexible forms of employment, such as the use of freelancers for upcoming project work. It is a really big trend, but the German Government doesn’t yet recognise this need and currently regulates the labour market without a differentiation between specialists and blue-collar workers.
Klaus Breitschopf, Managing Director, Hays Germany
Key findingSustained rates of economic participation are exerting downward pressure on the overall Index score, only partially offset by growing wage pressures and labour shortages. Rising salaries ensure that households’ financial balance sheets remain strong.
Downward pressure from:• Labour market participation• Long-term unemployment• Net in-migration
Upward pressure from:• Job vacancies• Overall wage pressure• Education levels
Breakdown of seven indicator scores
6.1
6.7
5.5
3.4
6.2
9.9
6.6
0Indicators 2.5 5 7.5 10
Wage pressure in high-skill occupations
Educationflexibility
Labour market participation
Labour market flexibility
Talent mismatch
Overall wage pressure
Wage pressure in high-skill industries
Overall score
6.4in 20156.3 0 2.5 5 7.5 10
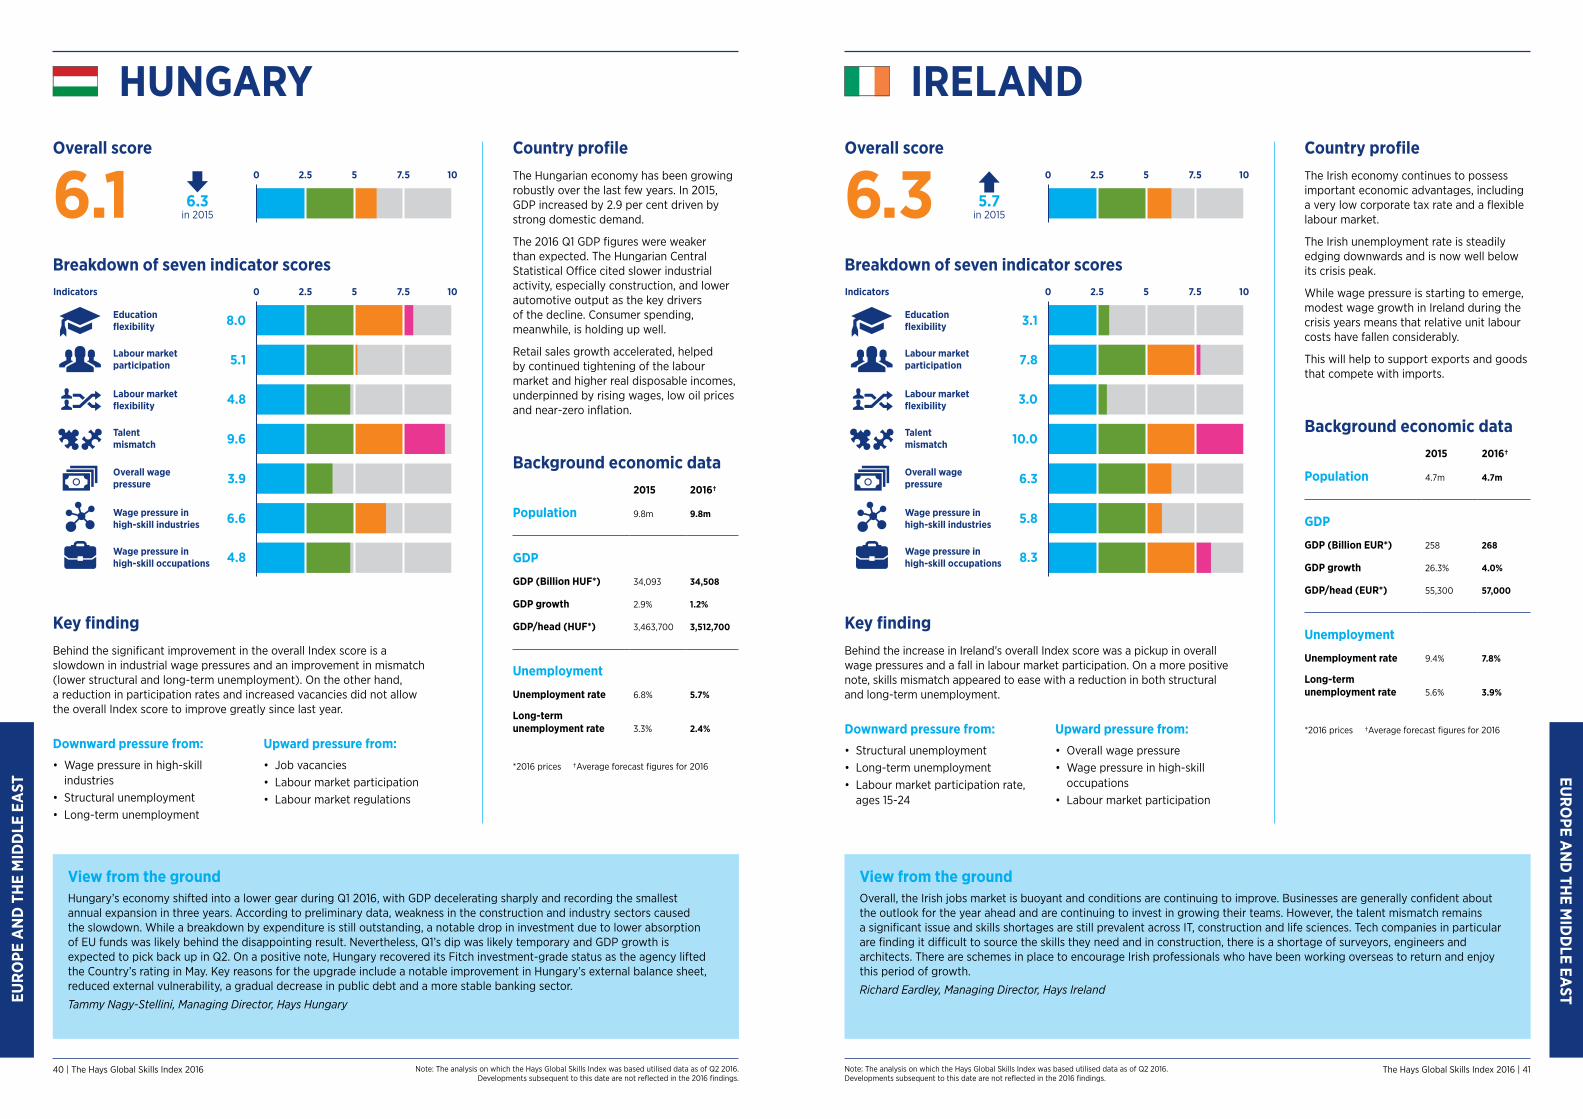
40 | The Hays Global Skills Index 2016 The Hays Global Skills Index 2016 | 41
EURO
PE AN
D TH
E MID
DLE EA
STEURO
PE A
ND
TH
E M
IDD
LE E
AST
Note: The analysis on which the Hays Global Skills Index was based utilised data as of Q2 2016.Developments subsequent to this date are not reflected in the 2016 findings.
Note: The analysis on which the Hays Global Skills Index was based utilised data as of Q2 2016. Developments subsequent to this date are not reflected in the 2016 findings.
Country profileThe Hungarian economy has been growing robustly over the last few years. In 2015, GDP increased by 2.9 per cent driven by strong domestic demand.
The 2016 Q1 GDP figures were weaker than expected. The Hungarian Central Statistical Office cited slower industrial activity, especially construction, and lower automotive output as the key drivers of the decline. Consumer spending, meanwhile, is holding up well.
Retail sales growth accelerated, helped by continued tightening of the labour market and higher real disposable incomes, underpinned by rising wages, low oil prices and near-zero inflation.
Background economic data2015 2016†
Population 9.8m 9.8m
GDP
GDP (Billion HUF*) 34,093 34,508
GDP growth 2.9% 1.2%
GDP/head (HUF*) 3,463,700 3,512,700
Unemployment
Unemployment rate 6.8% 5.7%
Long-term unemployment rate 3.3% 2.4%
*2016 prices †Average forecast figures for 2016
HUNGARY
View from the groundHungary’s economy shifted into a lower gear during Q1 2016, with GDP decelerating sharply and recording the smallest annual expansion in three years. According to preliminary data, weakness in the construction and industry sectors caused the slowdown. While a breakdown by expenditure is still outstanding, a notable drop in investment due to lower absorption of EU funds was likely behind the disappointing result. Nevertheless, Q1’s dip was likely temporary and GDP growth is expected to pick back up in Q2. On a positive note, Hungary recovered its Fitch investment-grade status as the agency lifted the Country’s rating in May. Key reasons for the upgrade include a notable improvement in Hungary’s external balance sheet, reduced external vulnerability, a gradual decrease in public debt and a more stable banking sector.
Tammy Nagy-Stellini, Managing Director, Hays Hungary
Key findingBehind the significant improvement in the overall Index score is a slowdown in industrial wage pressures and an improvement in mismatch (lower structural and long-term unemployment). On the other hand, a reduction in participation rates and increased vacancies did not allow the overall Index score to improve greatly since last year.
Downward pressure from:• Wage pressure in high-skill
industries• Structural unemployment• Long-term unemployment
Upward pressure from:• Job vacancies• Labour market participation• Labour market regulations
Breakdown of seven indicator scores
8.0
4.8
5.1
9.6
3.9
6.6
4.8
0Indicators 2.5 5 7.5 10
Wage pressure in high-skill occupations
Educationflexibility
Labour market participation
Labour market flexibility
Talent mismatch
Overall wage pressure
Wage pressure in high-skill industries
Overall score
6.3in 20156.1 0 2.5 5 7.5 10
Country profileThe Irish economy continues to possess important economic advantages, including a very low corporate tax rate and a flexible labour market.
The Irish unemployment rate is steadily edging downwards and is now well below its crisis peak.
While wage pressure is starting to emerge, modest wage growth in Ireland during the crisis years means that relative unit labour costs have fallen considerably.
This will help to support exports and goods that compete with imports.
Background economic data2015 2016†
Population 4.7m 4.7m
GDP
GDP (Billion EUR*) 258 268
GDP growth 26.3% 4.0%
GDP/head (EUR*) 55,300 57,000
Unemployment
Unemployment rate 9.4% 7.8%
Long-term unemployment rate 5.6% 3.9%
*2016 prices †Average forecast figures for 2016
IRELAND
View from the groundOverall, the Irish jobs market is buoyant and conditions are continuing to improve. Businesses are generally confident about the outlook for the year ahead and are continuing to invest in growing their teams. However, the talent mismatch remains a significant issue and skills shortages are still prevalent across IT, construction and life sciences. Tech companies in particular are finding it difficult to source the skills they need and in construction, there is a shortage of surveyors, engineers and architects. There are schemes in place to encourage Irish professionals who have been working overseas to return and enjoy this period of growth.
Richard Eardley, Managing Director, Hays Ireland
Key findingBehind the increase in Ireland’s overall Index score was a pickup in overall wage pressures and a fall in labour market participation. On a more positive note, skills mismatch appeared to ease with a reduction in both structural and long-term unemployment.
Downward pressure from:• Structural unemployment• Long-term unemployment• Labour market participation rate,
ages 15-24
Upward pressure from:• Overall wage pressure• Wage pressure in high-skill
occupations• Labour market participation
Breakdown of seven indicator scores
3.1
3.0
7.8
10.0
6.3
5.8
8.3
0Indicators 2.5 5 7.5 10
Wage pressure in high-skill occupations
Educationflexibility
Labour market participation
Labour market flexibility
Talent mismatch
Overall wage pressure
Wage pressure in high-skill industries
Overall score
5.7in 20156.3 0 2.5 5 7.5 10

42 | The Hays Global Skills Index 2016 The Hays Global Skills Index 2016 | 43
EURO
PE AN
D TH
E MID
DLE EA
STEURO
PE A
ND
TH
E M
IDD
LE E
AST
Note: The analysis on which the Hays Global Skills Index was based utilised data as of Q2 2016.Developments subsequent to this date are not reflected in the 2016 findings.
Note: The analysis on which the Hays Global Skills Index was based utilised data as of Q2 2016. Developments subsequent to this date are not reflected in the 2016 findings.
Country profileThe Italian economy is expanding, supported by industrial production.
Domestic demand, mainly consumption and stock building, is estimated to have driven the economy.
However, net external trade, amid a very sluggish global background, was probably a slight drag on growth.
The recovery in private consumption is expected to proceed at a reasonable pace, helped by some fiscal measures and by the gradual improvement in the labour market.
Background economic data2015 2016†
Population 61.1m 61.2m
GDP
GDP (Billion EUR*) 1,655 1,670
GDP growth 0.6% 0.9%
GDP/head (EUR*) 27,100 27,300
Unemployment
Unemployment rate 11.9% 11.4%
Long-term unemployment rate 7.3% 6.7%
*2016 prices †Average forecast figures for 2016
ITALY
View from the groundItaly has seen unemployment fall slightly over the past year, however, there are still reasons to be cautious about the country’s future prospects. For instance, pressures within the financial sector have resurfaced recently and the country continues to experience weak global demand, these present a risk to Italy’s growth ambitions. With the Job Act’s reform in place the economy is growing and jobs are being created. While at first this seems to be very encouraging news, it is still too early to measure its impact and time will tell whether the Act is a true success or not.
Carlos Soave, Managing Director, Hays Italy
Key findingWith the economy growing modestly, wage pressures are starting to appear at the industry level. The expanding economy has enhanced labour market participation and reduced structural unemployment, which will in turn support spending.
Downward pressure from:• Labour market participation• Wage pressure in high-skill
occupations• Structural unemployment
Upward pressure from:• Wage pressure in high-skill
industries• Long-term unemployment• Job vacancies
Breakdown of seven indicator scores
6.2
6.1
2.8
8.2
4.0
2.2
1.3
0Indicators 2.5 5 7.5 10
Wage pressure in high-skill occupations
Educationflexibility
Labour market participation
Labour market flexibility
Talent mismatch
Overall wage pressure
Wage pressure in high-skill industries
Overall score
4.0in 20154.4 0 2.5 5 7.5 10
Country profileAfter significantly outperforming the Eurozone in 2014 and 2015, Luxembourg’s economy is projected to slow this year.
Last year’s growth was driven by a sharp improvement in net exports of financial services, but with less favourable market conditions the growth contribution from the external sector is expected to decline.
The falling unemployment rate and the prospect of a cost of living pay rise should inflation rise above 2.5 per cent, could add to wage pressures over the medium term.
Background economic data2015 2016†
Population 0.6m 0.6m
GDP
GDP (Billion EUR*) 52 54
GDP growth 4.8% 3.4%
GDP/head (EUR*) 93,200 95,300
Unemployment
Unemployment rate 6.5% 6.3%
Long-term unemployment rate 1.8% 1.7%
*2016 prices †Average forecast figures for 2016
LUXEMBOURG
View from the groundLast year, Luxembourg achieved positive economic growth of 4.8 per cent, almost three times the total amount of European growth over the same period. This is very impressive considering the country has faced multiple challenges: the automatic exchange of information in tax matters, an increase in VAT and the loss of revenue related to e-commerce. From an employment point of view, the performance is good, with a growth of 2.5 per cent representing a net creation of 8,500 jobs. Nevertheless, the unemployment rate remains high at 6.3 per cent, creating structural unemployment due to the mismatch between skills available and those the labour market needs. For 2016, GDP growth forecasts should be around 3.4 per cent due to strong international exposure, with external factors expected to have a strong impact on the economy.
Tina Ling, Managing Director, Hays France & Benelux
Key findingWhile wage pressure remains a concern, long-term unemployment is falling together with some improvement in net in-migration and participation rates. As a result of the former, the cost competitiveness of Luxembourg’s economy continues to be eroded, reducing its attractiveness to foreign investors.
Downward pressure from:• Long-term unemployment• Net in-migration• Labour market participation
Upward pressure from:• Overall wage pressure• Job vacancies• Wage pressure in high-skill
industries
Breakdown of seven indicator scores
5.6
3.9
4.2
9.5
9.7
7.3
5.4
0Indicators 2.5 5 7.5 10
Wage pressure in high-skill occupations
Educationflexibility
Labour market participation
Labour market flexibility
Talent mismatch
Overall wage pressure
Wage pressure in high-skill industries
Overall score
6.1in 20156.5 0 2.5 5 7.5 10
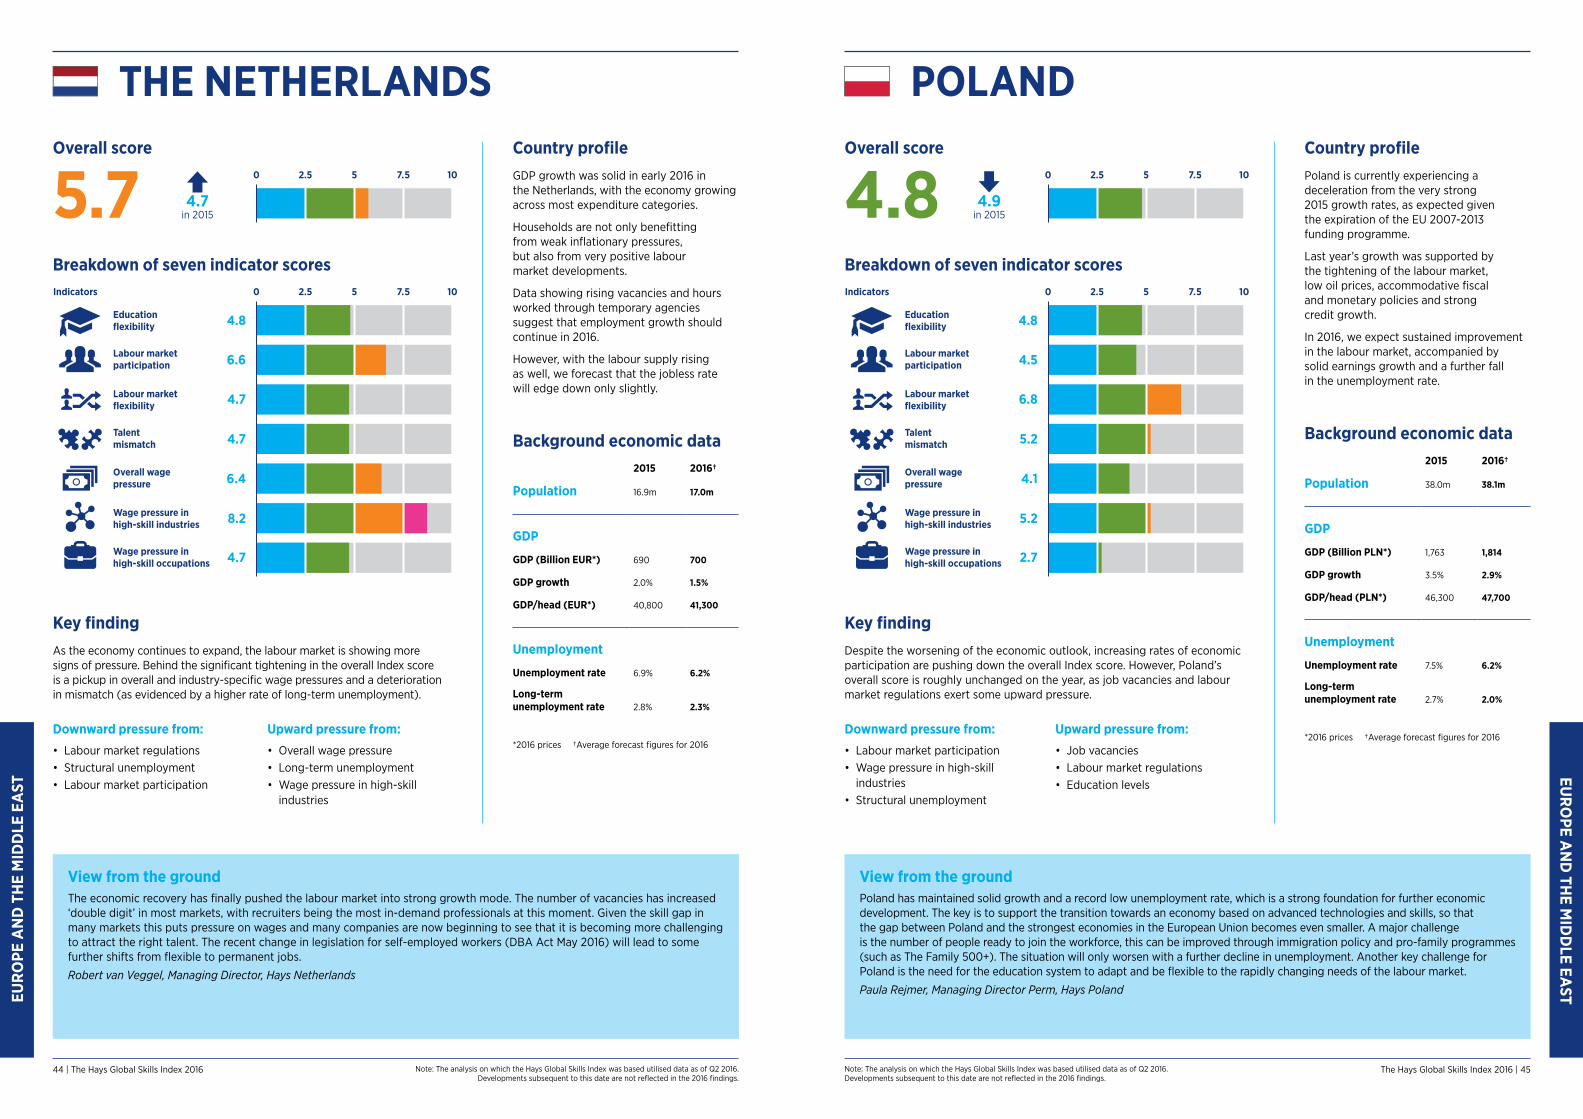
44 | The Hays Global Skills Index 2016 The Hays Global Skills Index 2016 | 45
EURO
PE AN
D TH
E MID
DLE EA
STEURO
PE A
ND
TH
E M
IDD
LE E
AST
Note: The analysis on which the Hays Global Skills Index was based utilised data as of Q2 2016.Developments subsequent to this date are not reflected in the 2016 findings.
Note: The analysis on which the Hays Global Skills Index was based utilised data as of Q2 2016. Developments subsequent to this date are not reflected in the 2016 findings.
Country profileGDP growth was solid in early 2016 in the Netherlands, with the economy growing across most expenditure categories.
Households are not only benefitting from weak inflationary pressures, but also from very positive labour market developments.
Data showing rising vacancies and hours worked through temporary agencies suggest that employment growth should continue in 2016.
However, with the labour supply rising as well, we forecast that the jobless rate will edge down only slightly.
Background economic data2015 2016†
Population 16.9m 17.0m
GDP
GDP (Billion EUR*) 690 700
GDP growth 2.0% 1.5%
GDP/head (EUR*) 40,800 41,300
Unemployment
Unemployment rate 6.9% 6.2%
Long-term unemployment rate 2.8% 2.3%
*2016 prices †Average forecast figures for 2016
THE NETHERLANDS
View from the groundThe economic recovery has finally pushed the labour market into strong growth mode. The number of vacancies has increased ‘double digit’ in most markets, with recruiters being the most in-demand professionals at this moment. Given the skill gap in many markets this puts pressure on wages and many companies are now beginning to see that it is becoming more challenging to attract the right talent. The recent change in legislation for self-employed workers (DBA Act May 2016) will lead to some further shifts from flexible to permanent jobs.
Robert van Veggel, Managing Director, Hays Netherlands
Key findingAs the economy continues to expand, the labour market is showing more signs of pressure. Behind the significant tightening in the overall Index score is a pickup in overall and industry-specific wage pressures and a deterioration in mismatch (as evidenced by a higher rate of long-term unemployment).
Downward pressure from:• Labour market regulations• Structural unemployment• Labour market participation
Upward pressure from:• Overall wage pressure• Long-term unemployment• Wage pressure in high-skill
industries
Breakdown of seven indicator scores
4.8
4.7
6.6
4.7
6.4
8.2
4.7
0Indicators 2.5 5 7.5 10
Wage pressure in high-skill occupations
Educationflexibility
Labour market participation
Labour market flexibility
Talent mismatch
Overall wage pressure
Wage pressure in high-skill industries
Overall score
4.7in 20155.7 0 2.5 5 7.5 10
Country profilePoland is currently experiencing a deceleration from the very strong 2015 growth rates, as expected given the expiration of the EU 2007-2013 funding programme.
Last year’s growth was supported by the tightening of the labour market, low oil prices, accommodative fiscal and monetary policies and strong credit growth.
In 2016, we expect sustained improvement in the labour market, accompanied by solid earnings growth and a further fall in the unemployment rate.
Background economic data2015 2016†
Population 38.0m 38.1m
GDP
GDP (Billion PLN*) 1,763 1,814
GDP growth 3.5% 2.9%
GDP/head (PLN*) 46,300 47,700
Unemployment
Unemployment rate 7.5% 6.2%
Long-term unemployment rate 2.7% 2.0%
*2016 prices †Average forecast figures for 2016
POLAND
View from the groundPoland has maintained solid growth and a record low unemployment rate, which is a strong foundation for further economic development. The key is to support the transition towards an economy based on advanced technologies and skills, so that the gap between Poland and the strongest economies in the European Union becomes even smaller. A major challenge is the number of people ready to join the workforce, this can be improved through immigration policy and pro-family programmes (such as The Family 500+). The situation will only worsen with a further decline in unemployment. Another key challenge for Poland is the need for the education system to adapt and be flexible to the rapidly changing needs of the labour market.
Paula Rejmer, Managing Director Perm, Hays Poland
Key findingDespite the worsening of the economic outlook, increasing rates of economic participation are pushing down the overall Index score. However, Poland’s overall score is roughly unchanged on the year, as job vacancies and labour market regulations exert some upward pressure.
Downward pressure from:• Labour market participation• Wage pressure in high-skill
industries• Structural unemployment
Upward pressure from:• Job vacancies• Labour market regulations• Education levels
Breakdown of seven indicator scores
4.8
6.8
4.5
5.2
4.1
5.2
2.7
0Indicators 2.5 5 7.5 10
Wage pressure in high-skill occupations
Educationflexibility
Labour market participation
Labour market flexibility
Talent mismatch
Overall wage pressure
Wage pressure in high-skill industries
Overall score
4.9in 20154.8 0 2.5 5 7.5 10

46 | The Hays Global Skills Index 2016 The Hays Global Skills Index 2016 | 47
EURO
PE AN
D TH
E MID
DLE EA
STEURO
PE A
ND
TH
E M
IDD
LE E
AST
Note: The analysis on which the Hays Global Skills Index was based utilised data as of Q2 2016.Developments subsequent to this date are not reflected in the 2016 findings.
Note: The analysis on which the Hays Global Skills Index was based utilised data as of Q2 2016. Developments subsequent to this date are not reflected in the 2016 findings.
Country profileThe Portuguese economy is only expected to grow marginally in 2016, with net exports dragging growth down.
Stagnant labour market conditions suggest that consumption is not expected to accelerate anytime soon.
The unemployment rate has not fallen considerably since last year, in marked contrast to the previous two years when unemployment fell noticeably.
Moreover, current political fragmentation is impeding a consensus forming to implement further structural reforms that look to address remaining product and labour markets rigidities.
Background economic data2015 2016†
Population 10.4m 10.4m
GDP
GDP (Billion EUR*) 183 185
GDP growth 1.5% 1.0%
GDP/head (EUR*) 17,600 17,800
Unemployment
Unemployment rate 12.6% 11.3%
Long-term unemployment rate 7.5% 6.3%
*2016 prices †Average forecast figures for 2016
PORTUGAL
View from the groundDespite the underlying ambiguity in the evolution of the Portuguese economy, the labour market doesn’t seem to be reflecting that uncertainty any more than it was before, and unemployment rates keep dropping, albeit modestly. In general, the labour market has recovered some dynamism and although this may not be enough to solve structural issues, such as long-term unemployment and talent mismatch, there is now a visible effort to discuss this and a more proactive communication between the educational system and employers. On the other hand, talent shortages in high-skill industries such as Information Technology are keeping wage pressures up.
Paula Baptista, Managing Director, Hays Portugal
Key findingAmong the 33 countries included in the Hays Global Skills Index, Portugal is characterised by very little pressure on highly-skilled workers, but continues to display top-end scores when it comes to talent mismatch, with the highest structural unemployment rate across the countries.
Downward pressure from:• Wage pressure in high-skill
industries• Labour market participation• Wage pressure in high-skill
occupations
Upward pressure from:• Long-term unemployment• Net in-migration• Job vacancies
Breakdown of seven indicator scores
5.0
6.2
5.2
10.0
4.8
8.9
0.0
0Indicators 2.5 5 7.5 10
Wage pressure in high-skill occupations
Educationflexibility
Labour market participation
Labour market flexibility
Talent mismatch
Overall wage pressure
Wage pressure in high-skill industries
Overall score
5.9in 20155.7 0 2.5 5 7.5 10
Country profileThe Russian economy’s contraction is expected to slow in 2016, translating into a shallower recession compared to 2015.
With working-age population declining and the participation rate already fairly high, there is likely to be limited scope for labour force growth.
Real wage growth is stagnant, keeping disposable income growth in negative territory.
Background economic data2015 2016†
Population 143.5m 143.4m
GDP
GDP (Billion RUB*) 85,833 84,940
GDP growth -3.7% -1.0%
GDP/head (RUB*) 598,300 592,300
Unemployment
Unemployment rate 5.6% 5.8%
Long-term unemployment rate 1.6% 1.7%
*2016 prices †Average forecast figures for 2016
RUSSIA
View from the groundRussia has recently experienced turbulence in its economy and particularly its labour market. Many industries have been affected by this, mainly the banking, oil and gas, automotive, and construction and property sectors. Due to a series of mergers, acquisitions, job cuts, and in some cases even businesses leaving the market, vast amounts of workers are now unemployed and ready to join the workforce once again, which is reflected in the labour market participation indicator versus its 2015 figure. Another challenge has been the recent government policies which have resulted in laws restricting foreign-owned companies in Russia. However, despite all the factors mentioned, there is hope the labour market will speed up when economic sanctions are lifted and the economy can begin to recover.
Alexey Shteingardt, Managing Director, Hays Russia
Key findingThe narrowing of the high-skill industry wage premium can be traced to strong growth in compensation in the manufacturing of electronic equipment and of wood products. Lower participation rates have partly offset these downward pressures.
Downward pressure from:• Wage pressure in high-skill
industries• Long-term unemployment• Education levels
Upward pressure from:• Labour market participation• Net in-migration• Structural unemployment
Breakdown of seven indicator scores
6.9
7.3
6.0
4.4
5.4
6.7
4.8
0Indicators 2.5 5 7.5 10
Wage pressure in high-skill occupations
Educationflexibility
Labour market participation
Labour market flexibility
Talent mismatch
Overall wage pressure
Wage pressure in high-skill industries
Overall score
6.0in 20155.9 0 2.5 5 7.5 10

48 | The Hays Global Skills Index 2016 The Hays Global Skills Index 2016 | 49
EURO
PE AN
D TH
E MID
DLE EA
STEURO
PE A
ND
TH
E M
IDD
LE E
AST
Note: The analysis on which the Hays Global Skills Index was based utilised data as of Q2 2016.Developments subsequent to this date are not reflected in the 2016 findings.
Note: The analysis on which the Hays Global Skills Index was based utilised data as of Q2 2016. Developments subsequent to this date are not reflected in the 2016 findings.
Country profileEconomic growth is moderating from the peak reached in mid-2015 and the short-term outlook remains positive as Spain continues to benefit from strong tailwinds.
Although unemployment remains very high by European standards, job creation continues to be strong, with the jobless rate falling to a six-year low of 20 per cent in Q2.
Background economic data2015 2016†
Population 46.4m 46.3m
GDP
GDP (Billion EUR*) 1,086 1,118
GDP growth 3.2% 3.0%
GDP/head (EUR*) 23,400 24,200
Unemployment
Unemployment rate 22.1% 19.8%
Long-term unemployment rate 11.6% 9.3%
*2016 prices †Average forecast figures for 2016
SPAIN
View from the groundSpain has created jobs during 2016, a genuine cause for celebration – especially for those new and returning wage earners. The country has also spent a large part of the year without a government following an inconclusive general election in December 2015, repeated in June 2016. This policy-making hiatus has delayed the reforms and evolution that we hope to see in order to ensure that the Spanish world of work becomes more efficient and equitable. Education systems that focus on increased employability should be top of the list so that the critical levels of talent mismatch and sectorial wage inflation begin to normalise.
Chris Dottie, Managing Director, Hays Spain
Key findingUpward pressures from a widening in pay differentials across industries is being partly offset by fewer job vacancies and a fall in structural unemployment (albeit still high). However, without additional reforms, high structural unemployment could drag on consumption and the welfare bill over the medium term.
Downward pressure from:• Job vacancies• Structural unemployment• Education levels
Upward pressure from:• Wage pressure in high-skill
industries• Long-term unemployment• Labour market participation,
ages 55-64
Breakdown of seven indicator scores
4.3
5.3
7.2
10.0
4.7
10.0
4.0
0Indicators 2.5 5 7.5 10
Wage pressure in high-skill occupations
Educationflexibility
Labour market participation
Labour market flexibility
Talent mismatch
Overall wage pressure
Wage pressure in high-skill industries
Overall score
6.4in 20156.5 0 2.5 5 7.5 10
Country profileIn Sweden, solid consumption and investment spending are forecast to support GDP growth in 2016.
The labour market is continuing to strengthen, with the unemployment rate falling. Looking ahead, strong domestic demand and output growth this year should help labour market conditions to improve further.
In addition, at the beginning of the year the government launched a fast-track initiative to help refugees enter the labour market; this should increase the integration of refugees on a work and cultural basis as language lessons are part of this.
Background economic data2015 2016†
Population 9.8m 9.8m
GDP
GDP (Billion SEK*) 4,222 4,351
GDP growth 3.9% 3.1%
GDP/head (SEK*) 432,200 441,900
Unemployment
Unemployment rate 7.4% 6.8%
Long-term unemployment rate 1.2% 1.1%
*2016 prices †Average forecast figures for 2016
SWEDEN
View from the groundSweden’s overall score has increased by 0.1 compared to the previous year, although the labour market overall is getting stronger and the unemployment rate decreasing. An area where we see the highest stress levels is within high-skill industries. As stated last year we believe short-term solutions have to come from business initiatives as we see no political solution in the near future. An additional factor at play is the high amount of refugees Sweden has accepted, it remains to see how this will impact the labour market but for now the economy stays strong.
Johan Alsen, Managing Director, Hays Sweden
Key findingIncreasing job vacancy rates and rising real wages in high-skilled industries are indicative of improving economic conditions and represent increased stresses in the labour market. Relief is provided by an improvement in Swedish regulatory environment.
Downward pressure from:• Labour market regulations• Structural unemployment• Long-term unemployment
Upward pressure from:• Job vacancies• Wage pressure in high-skill
industries• Net in-migration
Breakdown of seven indicator scores
8.4
4.9
4.0
7.9
7.6
9.7
4.8
0Indicators 2.5 5 7.5 10
Wage pressure in high-skill occupations
Educationflexibility
Labour market participation
Labour market flexibility
Talent mismatch
Overall wage pressure
Wage pressure in high-skill industries
Overall score
6.7in 20156.8 0 2.5 5 7.5 10
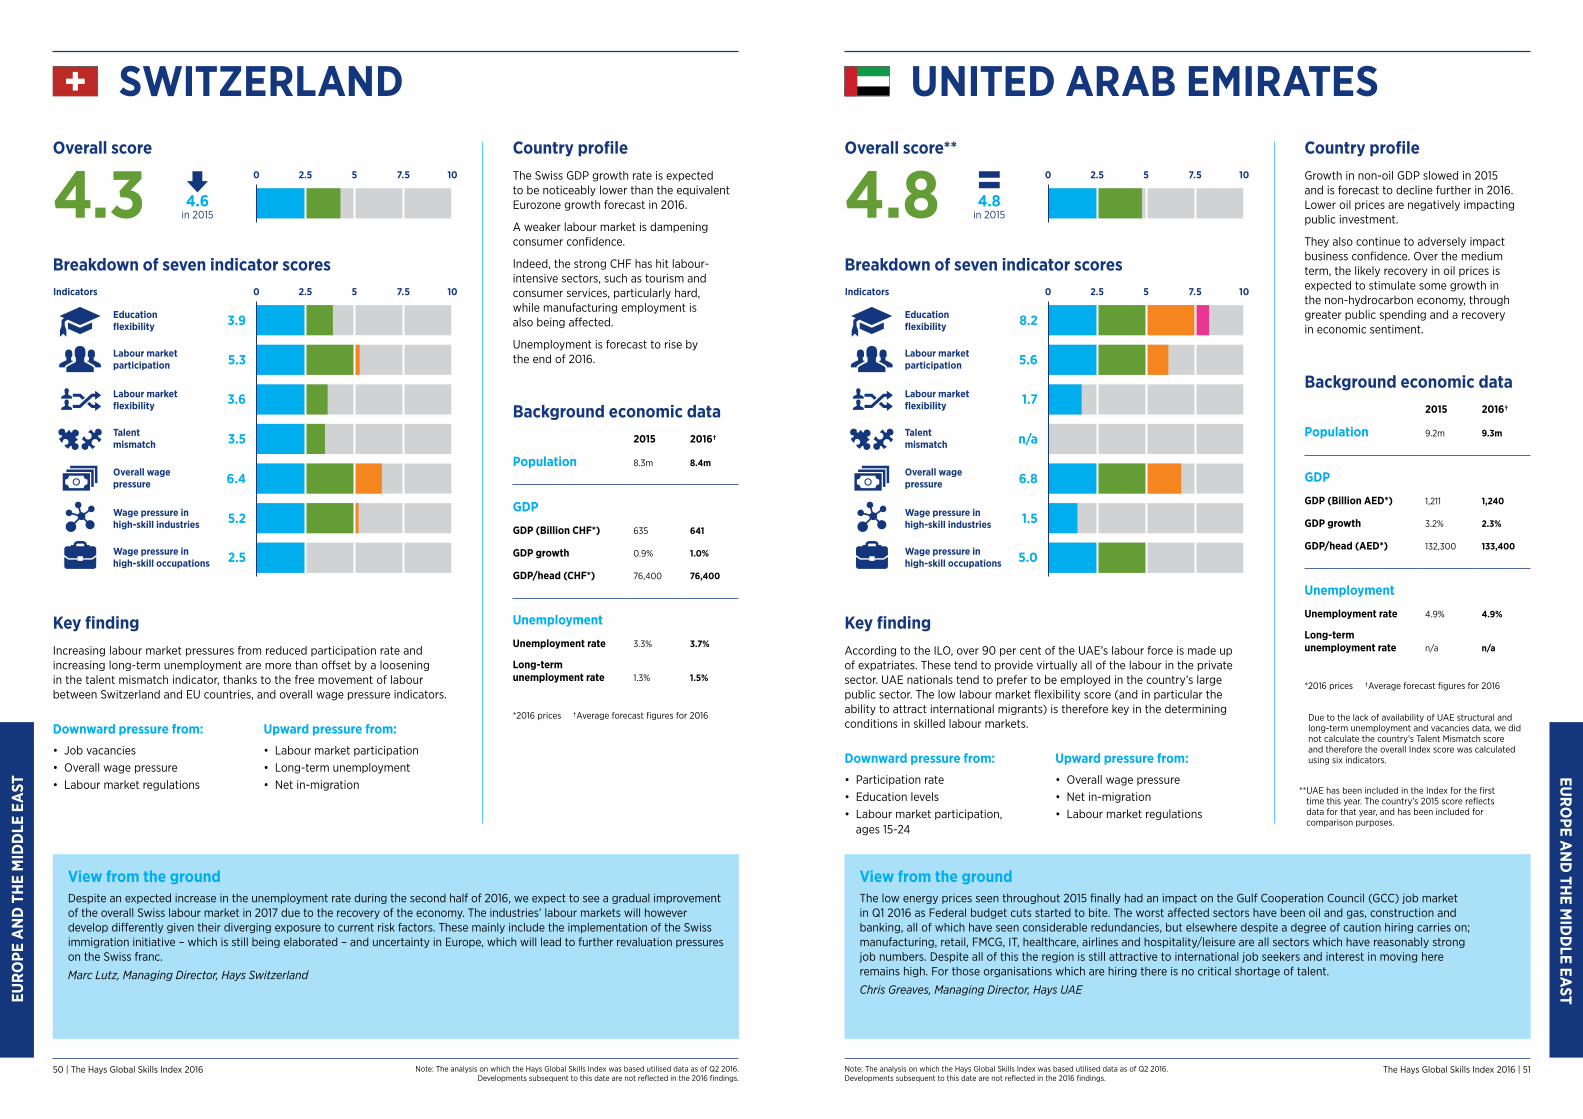
50 | The Hays Global Skills Index 2016 The Hays Global Skills Index 2016 | 51
EURO
PE AN
D TH
E MID
DLE EA
STEURO
PE A
ND
TH
E M
IDD
LE E
AST
Note: The analysis on which the Hays Global Skills Index was based utilised data as of Q2 2016.Developments subsequent to this date are not reflected in the 2016 findings.
Note: The analysis on which the Hays Global Skills Index was based utilised data as of Q2 2016. Developments subsequent to this date are not reflected in the 2016 findings.
Country profileThe Swiss GDP growth rate is expected to be noticeably lower than the equivalent Eurozone growth forecast in 2016.
A weaker labour market is dampening consumer confidence.
Indeed, the strong CHF has hit labour-intensive sectors, such as tourism and consumer services, particularly hard, while manufacturing employment is also being affected.
Unemployment is forecast to rise by the end of 2016.
Background economic data2015 2016†
Population 8.3m 8.4m
GDP
GDP (Billion CHF*) 635 641
GDP growth 0.9% 1.0%
GDP/head (CHF*) 76,400 76,400
Unemployment
Unemployment rate 3.3% 3.7%
Long-term unemployment rate 1.3% 1.5%
*2016 prices †Average forecast figures for 2016
SWITZERLAND
View from the groundDespite an expected increase in the unemployment rate during the second half of 2016, we expect to see a gradual improvement of the overall Swiss labour market in 2017 due to the recovery of the economy. The industries’ labour markets will however develop differently given their diverging exposure to current risk factors. These mainly include the implementation of the Swiss immigration initiative – which is still being elaborated – and uncertainty in Europe, which will lead to further revaluation pressures on the Swiss franc.
Marc Lutz, Managing Director, Hays Switzerland
Key findingIncreasing labour market pressures from reduced participation rate and increasing long-term unemployment are more than offset by a loosening in the talent mismatch indicator, thanks to the free movement of labour between Switzerland and EU countries, and overall wage pressure indicators.
Downward pressure from:• Job vacancies• Overall wage pressure• Labour market regulations
Upward pressure from:• Labour market participation• Long-term unemployment• Net in-migration
Breakdown of seven indicator scores
3.9
3.6
5.3
3.5
6.4
5.2
2.5
0Indicators 2.5 5 7.5 10
Wage pressure in high-skill occupations
Educationflexibility
Labour market participation
Labour market flexibility
Talent mismatch
Overall wage pressure
Wage pressure in high-skill industries
Overall score
4.6in 20154.3 0 2.5 5 7.5 10
Country profileGrowth in non-oil GDP slowed in 2015 and is forecast to decline further in 2016. Lower oil prices are negatively impacting public investment.
They also continue to adversely impact business confidence. Over the medium term, the likely recovery in oil prices is expected to stimulate some growth in the non-hydrocarbon economy, through greater public spending and a recovery in economic sentiment.
Background economic data2015 2016†
Population 9.2m 9.3m
GDP
GDP (Billion AED*) 1,211 1,240
GDP growth 3.2% 2.3%
GDP/head (AED*) 132,300 133,400
Unemployment
Unemployment rate 4.9% 4.9%
Long-term unemployment rate n/a n/a
*2016 prices †Average forecast figures for 2016
Due to the lack of availability of UAE structural and long-term unemployment and vacancies data, we did not calculate the country’s Talent Mismatch score and therefore the overall Index score was calculated using six indicators.
View from the groundThe low energy prices seen throughout 2015 finally had an impact on the Gulf Cooperation Council (GCC) job market in Q1 2016 as Federal budget cuts started to bite. The worst affected sectors have been oil and gas, construction and banking, all of which have seen considerable redundancies, but elsewhere despite a degree of caution hiring carries on; manufacturing, retail, FMCG, IT, healthcare, airlines and hospitality/leisure are all sectors which have reasonably strong job numbers. Despite all of this the region is still attractive to international job seekers and interest in moving here remains high. For those organisations which are hiring there is no critical shortage of talent.
Chris Greaves, Managing Director, Hays UAE
Key findingAccording to the ILO, over 90 per cent of the UAE’s labour force is made up of expatriates. These tend to provide virtually all of the labour in the private sector. UAE nationals tend to prefer to be employed in the country’s large public sector. The low labour market flexibility score (and in particular the ability to attract international migrants) is therefore key in the determining conditions in skilled labour markets.
Downward pressure from:• Participation rate • Education levels• Labour market participation,
ages 15-24
Upward pressure from:• Overall wage pressure• Net in-migration• Labour market regulations
UNITED ARAB EMIRATES
Breakdown of seven indicator scores
8.2
1.7
5.6
n/a
6.8
1.5
5.0
0Indicators 2.5 5 7.5 10
Wage pressure in high-skill occupations
Educationflexibility
Labour market participation
Labour market flexibility
Talent mismatch
Overall wage pressure
Wage pressure in high-skill industries
Overall score**
4.8in 20154.8 0 2.5 5 7.5 10
** UAE has been included in the Index for the first time this year. The country’s 2015 score reflects data for that year, and has been included for comparison purposes.

The Hays Global Skills Index 2016 | 5352 | The Hays Global Skills Index 2016
EURO
PE A
ND
TH
E M
IDD
LE E
AST
Note: The analysis on which the Hays Global Skills Index was based utilised data as of Q2 2016.Developments subsequent to this date are not reflected in the 2016 findings.
View from the groundDespite a sustained period of uncertainty due to Brexit, the UK remains an attractive place to do business and to work. Skills shortages remain prevalent, particularly in technical engineering roles, specialist technology and qualified finance roles. In these areas businesses are struggling to attract sufficient numbers of qualified and skilled workers, which is impacting on productivity and business growth. Many of these companies are continuing to invest in STEM and diversity initiatives in order to improve their talent pipeline and combat future skills shortages. Overall, wage growth is steady but candidates in skills-short areas are enjoying significant salary increases.
Nigel Heap, Managing Director, Hays UK
Key findingWith the economy recovering, wage pressures are evident particularly for high-skill roles. On the other hand, the buoyant economy has reduced both long-term and structural unemployment. Uncertainty over the UK’s future in the aftermath of the Brexit vote casts doubt on the labour market outlook in the near future.
Downward pressure from:• Wage pressure in high-skill
industries• Long-term unemployment• Structural unemployment
Upward pressure from:• Overall wage pressure• Job vacancies• Net in-migration
UNITED KINGDOM
Breakdown of seven indicator scores
4.4
5.3
6.7
9.7
5.1
7.5
5.0
0Indicators 2.5 5 7.5 10
Wage pressure in high-skill occupations
Educationflexibility
Labour market participation
Labour market flexibility
Talent mismatch
Overall wage pressure
Wage pressure in high-skill industries
Overall score
6.1in 20156.2 0 2.5 5 7.5 10
CONTRIBUTORSHaysHays has been helping organisations and businesses fill permanent positions, contract roles and temporary assignments, across the private and public sectors for more than 40 years. As the world’s largest specialist recruitment agency, last year alone Hays helped over a quarter of a million professional people worldwide find their next career role. With over 9,000 staff operating from 252 offices across 33 countries, Hays is a market leader in the UK and Asia Pacific and one of the market leaders in Continental Europe and Latin America and has a growing presence in North America.
Hays works across 20 specialist areas, from healthcare to energy, finance to construction and education to IT. Its recruiting experts deal with 6 million CVs a year and conduct nearly 50,000 interviews per month. Last year Hays worked with clients, large and small, across the globe to find over 67,000 permanent employees and to fill 220,000 temporary assignments.
Every day Hays helps clients simultaneously dealing with talent shortages in certain markets, while having to reshape workforces in others. The nature of employment is also changing fast, with technological advances driving evolutions in the way people work. Hays understands these complexities and is uniquely positioned across its markets to solve them.
The depth and breadth of Hays’ expertise ensures that it understands the impact the right individual can have on an organisation and how the right job can transform a person’s life.
To find out more about Hays, visit haysplc.com
Oxford EconomicsOxford Economics was founded in 1981 as a commercial venture with Oxford University’s business college to provide economic forecasting and modelling to UK companies and financial institutions expanding abroad. Since then, Oxford Economics has become one of the world’s foremost independent global advisory firms, providing reports, forecasts and analytical tools on 200 countries, 100 industrial sectors and over 3,000 cities and an unparalleled ability to forecast external market trends and assess their economic, social and business impact.
Headquartered in Oxford, England, with regional centres in London, New York, and Singapore, Oxford Economics has offices across the globe in Belfast, Chicago, Dubai, Miami, Milan, Paris, Philadelphia, San Francisco, and Washington DC. Oxford Economics employs over 250 full-time people, including more than 150 professional economists, together with a contributor network of over 500 economists, analysts, journalists and academics around the world.
Oxford Economics is a key adviser to corporate, financial and government decision-makers and thought leader with a global client base of over 850 international organisations, including leading multinational companies and financial institutions; key government bodies and trade associations; and top universities, consultancies, and think tanks.
For more information, visit www.oxfordeconomics.com
Data sources for indicator scoresThe analysis on which the Hays Global Skills Index was based utilised data as of Q2 2016. Developments subsequent to this date are not reflected in the 2016 findings.
Labour freedomHeritage Foundation, 2016 Index of Economic Freedom
Improvements in education levelsBarro and Lee dataset (www.barrolee.com)
Change in economic participation rate (overall)Oxford Economics Global Macro Model
Change in economic participation (15-24 year olds)International Labour Organizaton (ILO)
Change in economic participation (55-64 year olds)International Labour Organizaton (ILO)
Economic participation rate rankInternational Labour Organizaton (ILO)
Output gap (% GDP)International Monetary Fund (IMF)
Long-term unemployment rateOrganization for Economic Cooperation and Development (OECD), National statistical agencies
Vacancies (000s)Organization for Economic Cooperation and Development (OECD), Eurostat, National statistical agencies
GDP (LC, real, billion)Oxford Economics Global Macro Model
GDP growth (real)Oxford Economics Global Macro Model
Population (mn)Oxford Economics Global Macro Model
Unemployment rateOxford Economics Global Macro Model
GDP/head (LC, real)Oxford Economics Global Macro Model
Government balanceOxford Economics Global Macro Model
Current accountOxford Economics Global Macro Model
Non-Accelerating Inflation Rate of Unemployment (NAIRU)Oxford Economics Global Macro Model
CPI inflationOxford Economics Global Macro Model
PPI inflationOxford Economics Global Macro Model
Imports + Exports (% GDP)Oxford Economics Global Macro Model
Net migrationUS Government
International Surveys of Educational Attainment in reading, mathematics, and sciencePISA: Programme for International Student Assessment (OECD) TIMSS: Trends in International Mathematics and Science Study (Boston College, TIMSS & PIRLS International Study Center) PIRLS: Progress in International Reading Literacy Study PIAAC: Programme for the international assessment of adult competencies (OECD) LLECE: Latin American laboratory for assessment of the quality of education (UNESCO)
Real earningsOxford Economics Global Macro Model
Earnings by industryNational statistical agencies
Earnings by occupationNational statistical agencies
Country profileSupported by a narrow majority, UK voters decided to exit from the EU in mid-2016.
In the near term, the referendum result may slow domestic demand growth as greater uncertainty and lower confidence affect households and companies’ decisions. This may effect labour demand, in terms of recruitment and average hours worked.
The latest CBI survey suggests 18 percent of industrial firms’ output would be limited by shortages of skilled staff. This is also true in the service sector, where 35 per cent of service sector firms said the availability of professional staff is likely to limit their ability to increase their level of business over the next year.
Background economic data2015 2016†
Population 65.2m 65.6m
GDP
GDP (Billion GBP*) 1,875 1,909
GDP growth 2.2% 1.8%
GDP/head (GBP*) 28,800 29,100
Unemployment
Unemployment rate 5.4% 5.0%
Long-term unemployment rate 1.9% 1.7%
*2016 prices †Average forecast figures for 2016

54 | The Hays Global Skills Index 2016
THE BREADTH OF HAYS’ EXPERTISE WORLDWIDE
haysplc.com
© Copyright Hays plc 2016. HAYS, the Corporate and Sector H devices, Recruiting experts worldwide, the HAYS Recruiting experts worldwide logo and Powering the World of Work are trade marks of Hays plc. The Corporate and Sector H devices are original designs protected by registration in many countries. All rights are reserved. The reproduction or transmission of all or part of this work, whether by photocopying or storing in any medium by electronic means or otherwise, without the written permission of the owner, is restricted. The commission of any unauthorised act in relation to the work may result in civil and/or criminal action. PLC-15796
Hays plc 250 Euston Road London NW1 2AF
Listed below are the main offices for each of our countries of operation. To find your local office, please visit haysplc.com
AustraliaT: +61 (0)2 8226 9600 F: +61 (0)2 9233 1110 Level 11, Chifley Tower 2 Chifley Square Sydney NSW 2000 [email protected] hays.com.au
AustriaT: +43 1 535 34 43 0 F: +43 1 535 34 43 299 Europaplatz 3/5 1150 Vienna [email protected] hays.at
BelgiumT: +32 (0)56 653600 F: +32 (0)56 228761 Brugsesteenweg 255 b2 B-8500 Kortrijk [email protected] hays.be
BrazilT: +55 11 3046 9800 F: +55 11 3046 9820 Rua Pequetita 215 – 13° andar Sao Paulo, SP 04552-060 [email protected] hays.com.br
CanadaT: +1 416 367 4297 F: +1 416 203 1923 6 Adelaide Street East Suite 600, Toronto, Ontario M5C 1H6 [email protected] hays.ca
ChileT: +56 (2) 449 1340 F: +56 (2) 449 1340 Cerro el Plomo 5630 Of. 1701 Las Condes, SantiagoP.O. 7560742 [email protected] hays.cl
ChinaT: +86 (0)21 2322 9600 F: +86 (0)21 5382 4947 Unit 3001 Wheelock Square No. 1717 West Nan Jing Road Shanghai 200040 [email protected] hays.cn
ColombiaT: +57 (1) 742 25 02 F: +57 (1) 742 00 28 Paralelo 108 Autopista Norte # 108-27 Torre 2 – Oficina 1105 Bogotá D.C. [email protected] hays.com.co
Czech RepublicT: +420 225 001 711 F: +420 225 001 723 Olivova 4/2096 110 00 Praha 1 [email protected] hays.cz
DenmarkT: +45 33 38 32 00 F: +45 33 38 32 99 Kongens Nytorv 8 DK-1050 København K [email protected] hays.dk
FranceT: +33 (0)1 45 26 62 31 F: +33 (0)1 53 04 35 89 147, bd Haussmann 75008 Paris [email protected] hays.fr
GermanyT: +49 (0)621 1788 0 F: +49 (0)621 1788 1299 Willy-Brandt-Platz 1-3 68161 Mannheim [email protected] hays.de
Hong KongT: +852 2521 8884 F: +852 2521 8499 6604-06,66/F, ICC 1 Austin Road West West KowloonHong Kong [email protected] hays.com.hk
HungaryT: +36 1 501 2400 F: +36 1 501 2402 Bank Center1054 Budapest Szabadság tér 7. Gránit torony 10. emelet [email protected] hays.hu
IndiaT: +91 124 475 2500 11th Floor, Building 9b DLF Cyber City Gurgaon 122002 hays.com
IrelandT: +353 (0)1 897 2481 F: +353 (0)1 670 4738 2 Dawson Street Dublin 2 [email protected] hays.ie
ItalyT: +39 (0)2 888 931 F: +39 (0)2 888 93 41 Corso Italia, 13 20122 Milano [email protected] hays.it
JapanT: +81 (0)3 3560 1188 F: +81 (0)3 3560 1189 Izumi Garden Tower 28F 1-6-1 Roppongi Minato-ku Tokyo, 106-6028 [email protected] hays.co.jp
LuxembourgT: +352 268 654 F: +352 268 654 10 65 Avenue de la GareL-1611 Luxembourg [email protected] hays.lu
MalaysiaT: +603 2786 8600 F: +603 2786 8601 Level 23 Menara 3 Petronas KLCC 50088 Kuala Lumpur [email protected] hays.com.my
MexicoT: +52 (55) 52 49 25 00 F: +52 (55) 52 02 76 07 Torre Optima 1 Paseo de las Palmas 405 Piso 10 Col. Lomas de Chapultepec C.P. 11 000 Mexico DF [email protected] hays.com.mx
The NetherlandsT: +31 (0)20 3630 310 F: +31 (0)20 3630 316 H.J.E. Wenckebachweg 210 1096 AS Amsterdam [email protected] hays.nl
New ZealandT: +64 (0)9 377 4774 F: +64 (0)9 377 5855 Level 12, PWC Tower 188 Quay Street Auckland 1010 [email protected] hays.net.nz
PolandT: +48 (0)22 584 56 50 F: +48 (0)22 584 56 51 Ul. Złota 59 00-120 Warszawa [email protected] hays.pl
PortugalT: +351 21 782 6560 F: +351 21 782 6566 Avenida da República 90Galeria Fracção 4, 1600-206 Lisboa [email protected] hays.pt
RussiaT: +7 495 228 2208 F: +7 495 228 2500 Citydel Business Center 9, Zemlyanoy Val 105 064 Moscow [email protected] hays.ru
SingaporeT: +65 (0) 6223 4535 F: +65 (0) 6223 6235 80 Raffles Place #27-20 UOB Plaza 2 Singapore 048624 [email protected] hays.com.sg
SpainT: +34 91 456 6998 F: +34 91 443 0770 Plaza de Colón 2 Torre 2, Planta 3 28046 Madrid [email protected] hays.es
SwedenT: +46 (0)8 588 043 00 F: +46 (0)8 588 043 99 Stureplan 4C 11435 Stockholm [email protected] hays.se
SwitzerlandT: +41 (0)44 2255 000 F: +41 (0)44 2255 299 Nüschelerstr. 32 8001 Zürich [email protected] hays.ch
United Arab EmiratesT: +971 (0)4 559 5800 F: +971 (0)4 368 6794 Block 19, 1st Floor Office F-02 Knowledge Village P.O. Box 500340, Dubai [email protected] hays.ae
United KingdomT: +44 (0)20 3465 0021 4th Floor 107 Cheapside London EC2V 6DB [email protected] hays.co.uk
USAT: +1 (813) 936 7004 F: +1 (813) 936 2925 4300 West Cypress St.Suite 900Tampa, FL 33607 [email protected] hays-us.com