hazard identification and risk … 2 hazard identification and risk assessment (hira) 2011 r2016...
TRANSCRIPT

CHAPTER 2HAZARD IDENTIFICATION AND RISK ASSESSMENT(HIRA) 2011 2016
HURON COUNTY MULTI JURISDICTIONAL HAZARD MITIGATION PLAN 2011 2016 Page 17
This section of the Plan describes the Local Hazard Identification and Risk Assessment (HIRA) summaryundertaken by Huron County and participating municipalities in the preparation of this HazardMitigation Plan Update. This section consists of the following subsections:
INTRODUCTION AND UPDATE SUMMARYSEVERE SUMMER STORMSTEMPERATURE EXTREMESSEVERE WINTER STORMSFLOODINGHIGH WIND EVENTS (INCLUDING TORNADO)DROUGHTEARTHQUAKE
INTRODUCTION AND UPDATE SUMMARY________________________________
A key step in preventing disasterlosses in Huron County is developinga comprehensive understanding ofthe hazards that pose risks to itscommunities.
The Local Hazard Identification and Risk Assessment (HIRA) summary is a process or application of amethodology for evaluating risk as defined by probability and frequency of occurrence of a hazardevent, exposure to people and property to the hazard, and consequences of that exposure. Differentmethodologies exist for assessing the risk of hazard events, ranging from qualitative to quantitative.
Huron County and its communities are vulnerable to a wide range of natural and technological hazardsthat threaten life and property. The hazards identified by the Huron County Mitigation PlanningCommittee for inclusion in this HIRA summary are those determined to be of actual potential threat toHuron County, and are consistent with the hazards identified by the State of Ohio and the FederalEmergency Management Agency for this part of the State and this region of the country. The hazardsfor this 2011 Plan update include:
SEVERE SUMMER STORMSTEMPERATURE EXTREMESSEVERE WINTER STORMSFLOODINGHIGH WIND EVENTS (INCLUDING TORNADO)DROUGHTEARTHQUAKES
Figure 2 1: Definitions Associated with Risk Assessment

CHAPTER 2HAZARD IDENTIFICATION AND RISK ASSESSMENT(HIRA) 2011 2016
HURON COUNTY MULTI JURISDICTIONAL HAZARD MITIGATION PLAN 2011 2016 Page 18
Some of these hazards can be interrelated (for example, severe storms can produce high wind/tornadoactivity and can cause flooding), and thus discussion of these hazards may overlap where necessarythroughout the HIRA.
Of the twelve natural hazards profiled in the State of Ohio’s 2011 Hazard Mitigation Plan, six areincluded in this Plan update.
Table 2 1: State/Local Plan Hazards MatrixSTATE OF OHIO HAZARD
MITIGATION PLANHURON COUNTYMITIGATION PLAN
RATIONALE
FloodSeiche/Coastal Flooding Not a coastal countyTornadoes
Landslides Due to relative flat topography, landslides areconsidered to be a low hazard
Winter StormsSevere Summer Storms
Invasive SpeciesAlthough discussed, this was not considered bythe local mitigation planning committee to be amoderate to high hazard
Coastal Erosion Not a coastal county
WildfireAlthough wildfire/brush fire could occur due todrought or lightning strikes, the frequency ofwildfire is considered to be extremely low
Land Subsidence Due to general topography, land subsidence isnot a moderate to high hazard
DroughtsEarthquakes
Table 2 2 documents the review by the Huron County Mitigation Planning Committee as it relates tothose hazards that were to be re evaluated and/or identified, analyzed, and addressed through theupdating of the Countywide HIRA summary. Hazards were either continued, deleted, changed, or newhazards were identified.
Table 2 2: Evaluation of Hazards for Inclusion in 2011 HIRA Summary2006 HAZARD STATUS NOTES 2011 HAZARD
Class I Dams Deleted Dams are covered under a separateHuron County planning mechanism
n/a
Drought/ExtremeHeat
Deferred Renamed to “TemperatureExtremes” and includes ExtremeCold
Temperature Extremes
Earthquake Deferred N/A EarthquakeFlood Deferred N/A Flood
Hailstorm Deferred, Changed To be profiled as a sub hazard under“Severe Summer Storms”
Severe Summer Storms
Severe Winter Storm Deferred No change Severe Winter StormTornado Deferred, Changed To be profiled under “High Wind High Wind Events

CHAPTER 2HAZARD IDENTIFICATION AND RISK ASSESSMENT(HIRA) 2011 2016
HURON COUNTY MULTI JURISDICTIONAL HAZARD MITIGATION PLAN 2011 2016 Page 19
Events”
Windstorm Deferred, Changed To be profiled under “High WindEvents”
High Wind Events
As with the previous Hazard Mitigation Plan (HMP), information and data associated with hazards thatcould impact Huron County were obtained through review of historical data from news media resources,discussions with community residents, County officials, and representatives from the Ohio EmergencyManagement Agency, Ohio Department of Natural Resources, the National Weather Service, and TheNational Climatic Data Center (NCDC). Additional sources of data and information are identified underspecific hazards profiled. This information assisted the Hazard Mitigation Planning Team in their reevaluation and identification of hazards for the 2011 Plan Update.
To further focus on the list of identified hazards for this Plan, Table 2 3 presents a list of all federaldisaster and emergency declarations that have occurred in Huron County since 1953, according to theFederal Emergency Management Agency. This list presents the foundation for identifying what hazardspose the greatest risk within Huron County.
Table 2 3: Presidential Disaster and Emergency Declarations in Huron CountyDECLARATION # DATE EVENT DETAILS
FEMA EM 3286 OH 04/24/2008 Snow
FEMA DR 1651 OH 07/02/2006 Severe Storms, Tornadoes, Straight LineWinds, and Flooding
FEMA EM 3250 OH 09/13/2005 Hurricane Katrina Evacuation
FEMA DR 1580 OH 02/15/2005 Severe Winter Storms, Flooding andMudslides
FEMA EM 3198 OH 01/11/2005 SnowFEMA EM 3187 OH 09/23/2003 Power OutageFEMA DR 1444 OH 11/18/2002 Severe Storms and TornadoesFEMA DR 3055 OH 01/26/1978 Blizzards and SnowstormsFEMA EM 3029 OH 02/02/1977 SnowstormsFEMA DR 266 OH 07/15/1969 Tornadoes, Severe Storms, Flooding
Once the hazards were identified and evaluated for inclusion into the 2011 Plan update, the MitigationPlanning Committee then ranked these based on a Risk Factor (RF) approach. Hazards were ranked inorder to provide structure and prioritize the mitigation goals and actions discussed in this plan. Rankingwas both quantitative and qualitative. First, the quantitative analysis considered all the GIS and HAZUSdata available. Then, a qualitative approach, the Risk Factor (RF) approach, was used to provideadditional insights on the specific risks associated with each hazard. This process can also be a valuablecross check or validation of the quantitative analysis performed.
The RF approach combines historical data, local knowledge, and consensus opinions to producenumerical values that allow identified hazards to be ranked against one another. During the planningprocess, the Huron County Mitigation Planning Committee compared the results of the hazard profile

CHAPTER 2HAZARD IDENTIFICATION AND RISK ASSESSMENT(HIRA) 2011 2016
HURON COUNTY MULTI JURISDICTIONAL HAZARD MITIGATION PLAN 2011 2016 Page 20
against their local knowledge to generate a set of ranking criteria. These criteria were used to evaluatehazards and identify the highest risk hazard.
RF values are obtained by assigning varying degrees of risk to five categories for each hazard: (1)probability, (2) impact, (3) spatial extent, (4) warning time, and (5) duration. Each degree of risk isassigned a value ranging from 1 to 4 and a weighing factor for each category was agreed upon by theMitigation Planning Committee. Based upon any unique concerns for the planning area, the MitigationPlanning Committee may also adjust the RF weighting scheme. To calculate the RF value for a givenhazard, the assigned risk value for each category is multiplied by the weighting factor. The sum of allfive categories equals the final RF value, as demonstrated in the example equation below:
RF Value = [(Probability x .30) + (Impact x .30) +(Spatial Extent x .20) + (Warning Time x .10) + (Duration x .10)]
Table 2 4: Risk Factor Criteria
RISK ASSESSMENT CATEGORY LEVEL DEGREE OF RISK LEVEL INDEX WEIGHT
PROBABILITYWhat is the likelihood of a hazard event
occurring in a given year?
UNLIKELY LESS THAN 1% ANNUAL PROBABILITY 1
30%POSSIBLE BETWEEN 1 & 10% ANNUAL PROBABILITY 2
LIKELY BETWEEN 10 &100% ANNUALPROBABILITY 3
HIGHLY LIKELY 100% ANNUAL PROBABILTY 4
IMPACTIn terms of injuries, damage, or death, wouldyou anticipate impacts to be minor, limited,critical, or catastrophic when a significant
hazard event occurs?
MINOR
VERY FEW INJURIES, IF ANY. ONLY MINORPROPERTY DAMAGE & MINIMALDISRUPTION OF QUALITY OF LIFE.
TEMPORARY SHUTDOWN OF CRITICALFACILITIES.
1
30%
LIMITED
MINOR INJURIES ONLY. MORE THAN 10%OF PROPERTY IN AFFECTED AREA
DAMAGED OR DESTROYED. COMPLETESHUTDOWN OF CRITICAL FACILITIES FOR
MORE THAN ONE DAY.
2
CRITICAL
MULTIPLE DEATHS/INJURIES POSSIBLE.MORE THAN 25% OF PROPERTY INAFFECTED AREA DAMAGED OR
DESTROYED. COMPLETE SHUTDOWN OFCRITICAL FACILITIES FOR MORE THAN ONE
WEEK.
3
CATASTROPHIC
HIGH NUMBER OF DEATHS/INJURIESPOSSIBLE. MORE THAN 50% OF PROPERTY
IN AFFECTED AREA DAMAGED ORDESTROYED. COMPLETE SHUTDOWN OFCRITICAL FACILITIES FOR 30 DAYS OR
MORE.
4
SPATIAL EXTENTHow large of an area could be impacted by a NEGLIGIBLE LESS THAN 1% OF AREA AFFECTED 1 20%

CHAPTER 2HAZARD IDENTIFICATION AND RISK ASSESSMENT(HIRA) 2011 2016
HURON COUNTY MULTI JURISDICTIONAL HAZARD MITIGATION PLAN 2011 2016 Page 21
Table 2 4: Risk Factor Criteria
RISK ASSESSMENT CATEGORY LEVEL DEGREE OF RISK LEVEL INDEX WEIGHT
hazard event? Are impacts localized orregional? SMALL BETWEEN 1 & 10% OF AREA AFFECTED 2
MODERATE BETWEEN 10 & 50% OF AREA AFFECTED 3
LARGE BETWEEN 50 & 100% OF AREA AFFECTED 4
WARNING TIMEIs there usually some lead time associated withthe hazard event? Have warning measures
been implemented?
MORE THAN 24HRS SELF DEFINED 1
10%12 TO 24 HRS SELF DEFINED 2
6 TO 12 HRS SELF DEFINED 3
LESS THAN 6HRS SELF DEFINED 4
DURATIONHow long does the hazard event usually last?
LESS THAN 6HRS SELF DEFINED 1
10%
LESS THAN 24HRS SELF DEFINED 2
LESS THAN 1WEEK SELF DEFINED 3
MORE THAN 1WEEK SELF DEFINED 4
According to the default weighting scheme applied, the highest possible RF value is 4.0. Themethodology illustrated above lists categories that are used to calculate the variables for the RF value.
RANKING RESULTS
Table 2 5: Risk Factor Results for Huron County# NATURAL HAZARDS PROBABILITY IMPACT SPATIAL
EXTENTWARNING
TIMEDURATION RF
RATING1 Severe Summer Storms 4 (1.2) 2 (.6) 4 (.8) 2 (.2) 2 (.2) 3.02 Temperature Extremes 4 (1.2) 1 (.3) 4 (.8) 1 (.1) 3 (.3) 2.73 Severe Winter Storms 3 (.9) 1 (.3) 4 (.8) 1 (.1) 3 (.3) 2.44 Flood 3 (.9) 2 (.6) 2 (.4) 2 (.2) 3 (.3) 2.45 High Wind Events 3 (.9) 1 (.3) 3 (.6) 3 (.3) 2 (.2) 2.36 Drought 2 (.6) 1 (.3) 4 (.8) 1 (.1) 4 (.4) 2.27 Earthquake 1 (.3) 1 (.3) 2 (.4) 4 (.4) 1 (.1) 1.5
Based on the RF analysis, the natural hazard with the highest risk potential is “Severe Summer Storms”,which has a value of 3.0. This is primarily due to the probability of the hazard occurring and the spatialextent of the potential widespread damage within the affected areas of the County. “TemperatureExtremes” was qualitatively calculated as second in risk potential, with a value of 2.7.
Severe Winter Storms, Flooding, High Wind Events, and Drought were all in the moderate risk categorywith scores ranging from 2.2 – 2.4. Earthquakes were identified as the seventh and final hazardidentified by the planning team, with a rating of “low risk.” The conclusions drawn from the qualitative

CHAPTER 2HAZARD IDENTIFICATION AND RISK ASSESSMENT(HIRA) 2011 2016
HURON COUNTY MULTI JURISDICTIONAL HAZARD MITIGATION PLAN 2011 2016 Page 22
and quantitative assessments, combined with final determinations from the Huron County MitigationPlanning Committee, were fitted into three categories for a final summary of hazard risk for HuronCounty based on High, Moderate or Low risk designations.
Table 2 6: Conclusions on Hazard Risk for Huron CountyHIGH RISK (3.0 or higher) Severe Summer StormsMODERATE RISK (2.0 – 2.9) High Wind Events, Severe Winter Storms, Flood, High
Wind Events, DroughtLOW RISK (0.1 – 1.9) Earthquake

CHAPTER 2HAZARD IDENTIFICATION AND RISK ASSESSMENT(HIRA) 2011 2016
HURON COUNTY MULTI JURISDICTIONAL HAZARD MITIGATION PLAN 2011 2016 Page 23
SEVERE SUMMER STORMS _______________________________________
NATURAL HAZARDS PROBABILITY IMPACT SPATIAL EXTENT WARNINGTIME
DURATION RF RATING(PRIORITY)
Severe SummerStorms
4 (1.2) 2 (.6) 4 (.8) 2 (.2) 2 (.2) 3.0
HIGH RISK (3.0 or higher)
HAZARD IDENTIFICATION
Severs storms can occur during any season in Huron County. Thunderstorms, associated with strongwinds, heavy precipitation, and lightning strikes can all be hazardous under the right conditions andlocations. Strong winds and tornadoes can take down trees, damage structures, tip high profile vehicles,and create high velocity flying debris. Large hail can damage crops, dent vehicles, break windows, andinjure or kill livestock, pets, and people.
Thunderstorms affect relatively smallareas when compared with hurricanes andwinter storms. Despite their small size, allthunderstorms are dangerous. The typicalthunderstorm is 15 miles in diameter andlasts an average of 30 minutes. Of theestimated 100,000 thunderstorms thatoccur each year in the United States,about 10 percent are classified as severe.
The National Weather Service considers athunderstorm severe if it produces hail atleast 3/4 inch in diameter, winds of 58 MPH or stronger, or a tornado. Every thunderstorm needs threebasic components: (1) moisture to form clouds and rain (2) unstable air which is warm air that risesrapidly and (3) lift, which is a cold or warm front capable of lifting air to help form thunderstorms.
Lightning, although not considered severe by the National Weather Service definition, can accompanyheavy rain during thunderstorms. Lightning develops when ice particles in a cloud move around,colliding with other particles. These collisions cause a separation of electrical charges. Positivelycharged ice particles rise to the top of the cloud and negatively charged ones fall to the middle andlower sections of the cloud. The negative charges at the base of the cloud attract positive charges at thesurface of the Earth. Invisible to the human eye, the negatively charged area of the cloud sends acharge called a stepped leader toward the ground. Once it gets close enough, a channel developsbetween the cloud and the ground. Lightning is the electrical transfer through this channel. Thechannel rapidly heats to 50,000 degrees Fahrenheit and contains approximately 100 million electricalvolts. The rapid expansion of the heated air causes thunder.
Figure 2 1: Thunderstorm looms over the City of Norwalk onSeptember 17, 2010

CHAPTER 2HAZARD IDENTIFICATION AND RISK ASSESSMENT(HIRA) 2011 2016
HURON COUNTY MULTI JURISDICTIONAL HAZARD MITIGATION PLAN 2011 2016 Page 24
Hail develops when a super cooled droplet collects a layer of ice and continues to grow, sustained by theupdraft. Once the hail stone cannot be held up any longer by the updraft, it falls to the ground.Nationally, hailstorms cause nearly $1 billion in property and crop damage annually, as peak activitycoincides with peak agricultural seasons. Severe hailstorms also cause considerable damage to buildingsand automobiles, but rarely result in loss of life.
A tornado is a violent windstorm characterized by a twisting, funnel shaped cloud extending to theground. Tornadoes are most often generated by thunderstorm activity (but sometimes result fromhurricanes or tropical storms) when cool, dry air intersects and overrides a layer of warm, moist airforcing the warm air to rise rapidly. The damage caused by a tornado is a result of high wind velocitiesand wind blown debris. According to the National Weather Service, tornado wind speeds can rangebetween 30 to more than 300 miles per hour. They are more likely to occur during the spring and earlysummer months of March through June and are most likely to form in the late afternoon and earlyevening. Most tornadoes are a few dozen yards wide and touchdown briefly, but even small, short livedtornadoes can inflict tremendous damage. Destruction ranges from minor to catastrophic depending onthe intensity, size, and duration of the storm. Structures made of light materials such as mobile homesare most susceptible to damage. Each year, an average of over 800 tornadoes is reported nationwide,resulting in an average of 80 deaths and 1,500 injuries (NOAA, 2002). Tornadoes will also be addressedas a high wind hazard.
HAZARD PROFILE
Dangerous and damaging factors of a severe storm include tornadoes, hail, lightning strikes, flashflooding, and winds associated with downbursts and microbursts. Reported severe weather events overthe past 57 years provide an acceptable framework for determining the magnitude of such storms thatcan be expected and planned for accordingly. FEMA places this region in Zone IV (250 MPH) forstructural wind design (Federal Emergency Management Agency, 2008). Large hail can damagestructures, break windows, dent vehicles, ruin crops, and kill or injure people and livestock. Based onpast occurrences, hail sizes greater than 1.75 inches in diameter are possible and should be accountedfor in future planning activities. Non tornadic, thunderstorm, and non thunderstorm winds over 100mph will be addressed in the high wind hazard section. These types of winds can remove roofs, movemobile homes, topple trees, take down utility lines, and destroy poorly built or weak structures.
There have been nearly two hundred recorded severe storms that have either directly or indirectlyimpacted Huron County since 1963. Reported damages to infrastructure and agriculture have beensignificant. One particular storm occurred on July 13, 1995 in which damages sustained included nineinjuries and one fatality. This storm also impacted 31 other counties across Ohio and as the stormtracked southward, wind gusts reached recorded levels of over 87 mph. The storm traveled more than1,400 miles in a little over a day, and caused millions of dollars in damage, destroyed millions of trees,and ultimately killed seven people.

CHAPTER 2HAZARD IDENTIFICATION AND RISK ASSESSMENT(HIRA) 2011 2016
HURON COUNTY MULTI JURISDICTIONAL HAZARD MITIGATION PLAN 2011 2016 Page 25
Table 2 7: Severe Storms in Huron County Since 1963JURISDICTIONAFFECTED
# OF EVENTS # OF INJURIES # OFFATALITIES
RECORDED PROPERTYDAMAGES
Huron County 202 16 1 $4,353,000
Reported severe storm events over the past 48 years provide an acceptable framework for determiningthe future occurrence in terms of frequency for such events. The probability of the County and itsmunicipalities experiencing a severe storm event can be difficult to quantify, but based on historicalrecord of 202 severe storms since 1963, it can reasonably be assumed that this type of event hasoccurred once every 0.26 years from 1950 through 2011.
[(Current Year) 2011] subtracted by [(Historical Year) 1963] = 48 Years on Record
[(Years on Record) 48] divided by [(Number of Historical Events) 202] = 0.24
Furthermore, the historic frequency calculates that there is a 100% chance of this type of eventoccurring each year.
[LIGHTNING]
In terms of lightning strikes as a result of a severe thunderstorm, according to past occurences, therehave been 6 notable events since 1994. The greatest impact due to a lightning strike in Huron Countyoccurred on June 29, 1997. On this date, $100k in property damages occurred when two barns werestruck by lightning resulting in a fire that destroyed them both.
Table 2 8: Lightning Strikes in Huron County since 1994JURISDICTIONAFFECTED
DATE # OF INJURIES # OFFATALITIES
RECORDED PROPERTYDAMAGES
Norwalk 06/20/1994 1 0 $5,000Bellevue 08/15/1995 1 0 $0Norwalk 06/29/1997 0 0 $100,000Wakeman 06/11/1999 0 1 $0Willard 06/16/2000 3 0 $0Wakeman 06/26/2008 1 1 $0
TOTALS 6 2 $105,000
Reported lightning strikes over the past 17 years provide an acceptable framework for determining thefuture occurrence in terms of frequency for such events. The probability of the County and itsmunicipalities experiencing a lightning strike associated with damages or injury can be difficult toquantify, but based on historical record of 6 lightning strikes since 1994, that have either causeddamages to buildings and infrastructure or resulted in an injury or death, it can reasonably be assumedthat this type of event has occurred once every 2.8 years from 1994 through 2011.
[(Current Year) 2011] subtracted by [(Historical Year) 1994] = 17 Years on Record

CHAPTER 2HAZARD IDENTIFICATION AND RISK ASSESSMENT(HIRA) 2011 2016
HURON COUNTY MULTI JURISDICTIONAL HAZARD MITIGATION PLAN 2011 2016 Page 26
[(Years on Record) 17] divided by [(Number of Historical Events) 6] = 2.8
Furthermore, the historic frequency calculates that there is a 35% chance of this type of event occurringeach year.
[HAIL]
Hail is a product of raindrops that are frozen in the upper atmosphere that fall to the earth due togravity. The size of individual hail stones vary, contingent upon their being repeatedly blown into higherelevations. Hailstorms are always associated with heavy rain, gusty winds, thunderstorms, andlightning. Depending upon the size of the hailstones and the severity of respective storm, damage canoccur to property (structures, vehicles, as well as crops). The figure on the next page shows the locationof previous hailstorm events for Huron County.

CHAP
TER2
HAZA
RDIDEN
TIFICA
TIONAN
DRISK
ASSESSMEN
T(HIRA)
2011
2016
HURO
NCO
UNTY
MULTIJURISD
ICTIONAL
HAZA
RDMITIGAT
IONPLAN
2011
2016
Page
27
Figure
22:
Hailstorm
Even
tHistory
andAssociated
HailSize,(NCD
C,20
11).

CHAPTER 2HAZARD IDENTIFICATION AND RISK ASSESSMENT(HIRA) 2011 2016
HURON COUNTY MULTI JURISDICTIONAL HAZARD MITIGATION PLAN 2011 2016 Page 28
The greatest impact as a result of hail occurred on April 17, 2004 when penny to quarter sized hail wasobserved six miles west of Monroeville. Several vehicles were damaged in the area and it was reportedthat hail completely covered the ground in some locations on the east side of town. Total damage wasestimated at $75,000.
Table 2 9: Hail Events in Huron County Since 1963NATURAL HAZARD # OF EVENTS # OF INJURIES RECORDED PROPERTY
DAMAGERECORDED CROP
DAMAGESHail Event 90 0 $109,000 $80,000
Reported hail events over the past 48 years provide an acceptable framework for determining the futureoccurrence in terms of frequency for such events. The probability of the County and its municipalitiesexperiencing a hail event can be difficult to quantify, but based on historical record of 90 hail eventssince 1948, it can reasonably be assumed that this type of event has occurred once every 0.53 yearsfrom 1963 through 2011.
[(Current Year) 2011] subtracted by [(Historical Year) 1963] = 48 Years on Record
[(Years on Record) 48] divided by [(Number of Historical Events) 90] = 0.53
Furthermore, the historic frequency calculates that there is a 100% chance of this type of eventoccurring each year.
INVENTORY ASSETS EXPOSED TO SEVERE STORMS AND LIGHTNING
All assets located in Huron County can be considered at risk from severe storms. This includes 59,487people, or 100 percent of the County’s population and all buildings and infrastructure within the County.Damages primarily occur as a result of high winds, lightning strikes, hail, and flooding. Most structures,including the county’s critical facilities, should be able to provide adequate protection from hail but thestructures could suffer broken windows and dented exteriors. Those facilities with back up generatorsare better equipped to handle a severe weather situation should the power go out.
POTENTIAL LOSSES FROM SEVERE STORMS AND LIGHTNING
A timely forecast may not be able to mitigate the property loss, but could reduce the casualties andassociated injury. It appears possible to forecast these extreme events with some skill, but furtherresearch needs to be done to test the existing hypothesis about the interaction between the convectivestorm and its environment that produces the extensive swath of high winds. Severe summer storms willremain a highly likely occurrence for Huron County. Lightning, hail and tornadoes may also beexperienced in the area due to such storms.

CHAPTER 2HAZARD IDENTIFICATION AND RISK ASSESSMENT(HIRA) 2011 2016
HURON COUNTY MULTI JURISDICTIONAL HAZARD MITIGATION PLAN 2011 2016 Page 29
LAND USE & DEVELOPMENT TRENDS RELATED TO SEVERE STORMS AND LIGHTNING
All future structures and infrastructure built in Huron County will likely be exposed to severe storms,lightning, and hail and may experience damage. Since the previous statement is assumed to be uniformcountywide, the location of development does not increase or reduce the risk necessarily. HuronCounty and its jurisdiction need to adhere to building codes, and therefore, new development can bebuilt to current standards for wind resistance. Additionally, as homes are built throughout the county,accessing the majority of residents may become difficult should sheltering or emergency services beneeded in an extreme event.
MULTI JURISDICTIONAL DIFFERENCES
In the case of lightning strikes, population and building density has a correlation with hazardvulnerability and loss. In particular, the urban and suburban areas around Norwalk have higherpopulation and structure density as well as taller buildings that can act as lightning rods; therefore, theynaturally have experienced greater vulnerability and loss during past lightning events. Theenvironmental impacts most often associated with lightning strikes include damage or death to treesand ignition of wildfires. Jurisdictions that are heavily forested and that have, in the past, experiencedwildfires that start because of a lightning strike are also vulnerable to losses due to lightning.Additionally older homes that are in deteriorating condition and those mobile homes composedaluminum clad are also more susceptible to severe storms that generate high winds.
SEVERE STORMS AND LIGHTNING HIRA SUMMARY
In summary, Huron County along with all its municipalities is subject to severe summer storms.Dangerous and damaging aspects of a severe storm, other than tornadoes, are hail, lightning strikes,flash flooding, and the winds associated with downbursts and microbursts. Compared with otheratmospheric hazards such as tropical cyclones and winter low pressure systems, individualthunderstorms affect relatively small geographic areas.

CHAPTER 2HAZARD IDENTIFICATION AND RISK ASSESSMENT(HIRA) 2011 2016
HURON COUNTY MULTI JURISDICTIONAL HAZARD MITIGATION PLAN 2011 2016 Page 30
TEMPERATURE EXTREMES _______________________________________
NATURAL HAZARD PROBABILITY IMPACT SPATIAL EXTENT WARNINGTIME
DURATION RF RATING(PRIORITY)
TemperatureExtremes
4 (1.2) 1 (.3) 4 (.8) 1 (.1) 3 (.3) 2.7
MODERATE RISK (2.0 – 2.9)
HAZARD IDENTIFICATION
Temperature extremes can occur at almost any time of the year, but are most prevalent in the summerand winter. Extreme temperatures can be dangerous due to the way that they affect individuals whoare exposed to them. Extreme heat is usually defined through a combination of temperature andhumidity. Extreme cold is based on the temperature with wind chill. The recorded extreme heat eventshave occurred from June through September. Recorded extreme cold events in Northern Ohio haveoccurred from December through April. Extreme temperatures can be dangerous to people, and crops.
Table 2 10: Extreme Heat Events Since 1983DATE # OF DEATHS # OF INJURIES RECORDED CROP
DAMAGERECORDED PROPERTY
DAMAGES09/01/1983 0 0 $568,181 $006/13/1994 0 0 $5,681 $007/12/1995 0 12 $0 $600,00008/03/1995 5 11 $0 $008/08/1995 13 52 $0 $500,00006/06/1999 0 0 $0 $007/01/1999 0 0 $0 $0
TOTALS 18 75 $573,862 $1,100,000
Table 2 11: Extreme Cold Events Since 1983DATE # OF DEATHS # OF INJURIES RECORDED CROP
DAMAGERECORDED PROPERTY
DAMAGES12/26/1993 1 0 $0 $500,00002/11/1995 4 0 $0 $100,00004/04/1995 0 0 $0 $012/09/1995 3 0 $0 $210,00002/02/1996 1 0 $0 $3,400,00001/10/1997 4 0 $0 $195,00001/15/2009 0 0 $0 $0
TOTALS 13 0 $0 $4,405,000
Extreme Heat is the number one weather related killer in the United States. It causes more fatalitieseach year than floods, lightning, tornadoes and hurricanes combined. In the Midwest, summers tend tocombine both high temperature and high humidity. Heat disorders generally have to do with areduction or collapse of the body’s ability to shed heat by circulatory changes and sweating or a
CHAPTER 2HAZARD IDENTIFICATION AND RISK ASSESSMENT(HIRA) 2011 2016
HURON COUNTY MULTI JURISDICTIONAL HAZARD MITIGATION PLAN 2011 2016 Page 31
chemical (salt) imbalance caused by too much sweating. When the body heats too quickly to cool itselfsafely, or when too much fluid is lost through dehydration or sweating, the body temperature rises, andheat related illnesses may develop.
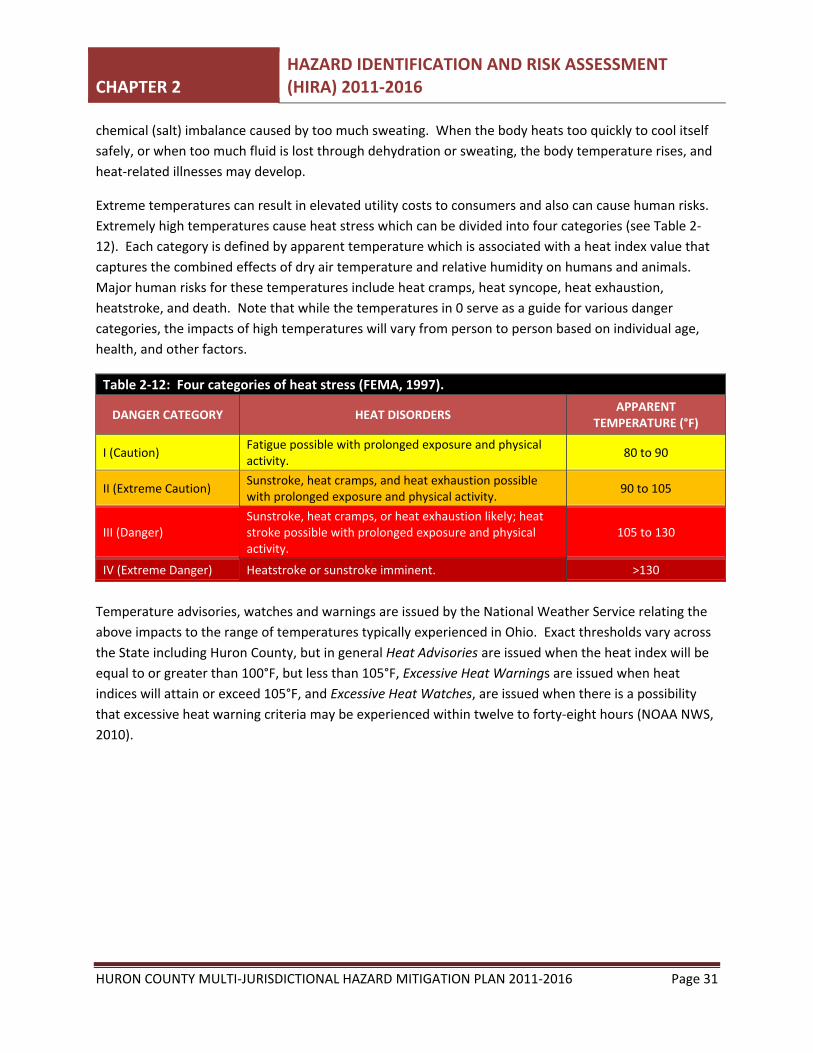
Extreme temperatures can result in elevated utility costs to consumers and also can cause human risks.Extremely high temperatures cause heat stress which can be divided into four categories (see Table 212). Each category is defined by apparent temperature which is associated with a heat index value thatcaptures the combined effects of dry air temperature and relative humidity on humans and animals.Major human risks for these temperatures include heat cramps, heat syncope, heat exhaustion,heatstroke, and death. Note that while the temperatures in 0 serve as a guide for various dangercategories, the impacts of high temperatures will vary from person to person based on individual age,health, and other factors.
Table 2 12: Four categories of heat stress (FEMA, 1997).
DANGER CATEGORY HEAT DISORDERS APPARENTTEMPERATURE (°F)
I (Caution) Fatigue possible with prolonged exposure and physicalactivity. 80 to 90
II (Extreme Caution) Sunstroke, heat cramps, and heat exhaustion possiblewith prolonged exposure and physical activity. 90 to 105
III (Danger)Sunstroke, heat cramps, or heat exhaustion likely; heatstroke possible with prolonged exposure and physicalactivity.
105 to 130
IV (Extreme Danger) Heatstroke or sunstroke imminent. >130
Temperature advisories, watches and warnings are issued by the National Weather Service relating theabove impacts to the range of temperatures typically experienced in Ohio. Exact thresholds vary acrossthe State including Huron County, but in general Heat Advisories are issued when the heat index will beequal to or greater than 100°F, but less than 105°F, Excessive Heat Warnings are issued when heatindices will attain or exceed 105°F, and Excessive Heat Watches, are issued when there is a possibilitythat excessive heat warning criteria may be experienced within twelve to forty eight hours (NOAA NWS,2010).

CHAPTER 2HAZARD IDENTIFICATION AND RISK ASSESSMENT(HIRA) 2011 2016
HURON COUNTY MULTI JURISDICTIONAL HAZARD MITIGATION PLAN 2011 2016 Page 32
Figure 2 3: NOAA’S National Weather Service Heat Index
Reported high heat events over the past 60 years provide an acceptable framework for determining thefuture occurrence in terms of frequency for such events. The probability of the County and itsmunicipalities experiencing a high heat event can be difficult to quantify, but based on historical recordof 7 heat events since 1950, it can reasonably be assumed that this type of event has occurred onceevery 8.7 years from 1983 through 2011.
[(Current Year) 2011] subtracted by [(Historical Year) 1950] = 61 Years on Record
[(Years on Record) 61] divided by [(Number of Historical Events) 7] = 8.71
Furthermore, the historic frequency calculates that there is an 11% chance of this type of eventoccurring each year.
According to the National Climatic Data Center, these extreme heat events include numbers reportedfrom multiple counties per each event. The most significant regional event occurred from August 8,1995 until August 22, 1995. During this time period, more than 13 fatalities and 52 injuries wererecorded in the affected zones, although almost all occurred within Cuyahoga County.

CHAPTER 2HAZARD IDENTIFICATION AND RISK ASSESSMENT(HIRA) 2011 2016
HURON COUNTY MULTI JURISDICTIONAL HAZARD MITIGATION PLAN 2011 2016 Page 33
Extreme Cold is also responsible for a number of fatalities each year. Threats, such as hypothermia andfrostbite, can lead to loss of fingers and toes or cause permanent kidney, pancreas and liver injury andeven death. Major winter storms can last for several days and be accompanied by high winds, freezingrain or sleet, heavy snowfall and cold temperatures. Fifty percent of cold related injuries happen topeople over sixty years of age. More than seventy five percent happen to males, and almost twentypercent occur within the home.
The dangers associated with extreme cold include frostbite and hypothermia. Frostbite is damage tobody tissue caused by that tissue being frozen. Frostbite causes a loss of feeling in extremities, such asfingers, toes, ear lobes, or the tip of the nose. Hypothermia, or low body temperature can lead touncontrollable shivering, memory loss, disorientation, slurred speech, drowsiness, and apparentexhaustion.
Table 2 13: Temperature and Associated Threat Level
Excessive Cold Threat Level Threat Level Descriptions
Extreme
"An Extreme Threat to Life and Property from Excessive Cold."
It is likely that wind chill values will drop to -35o F or below for 3 hours or more. Or, lowest air temperature less than or equal to -20o F.
High
"A High Threat to Life and Property from Excessive Cold."
It is likely that wind chill values will drop to -28o F to -35 o F for 3 hours or more. Or, lowest air temperature -15o to -20o F.
Moderate
"A Moderate Threat to Life and Property from Excessive Cold."
It is likely that wind chill values will drop to -20o F to -28 o F or below for 3 hours or more. Or, lowest air temperature -10o to -15o F.
Low
"A Low Threat to Life and Property from Excessive Cold."
It is likely that wind chill values will drop to -15o F to -20 o F or below for 3 hours or more. Or, lowest air temperature -5o to -10o F.
Very Low
"A Very Low Threat to Life and Property from Excessive Cold."
It is likely that that wind chill values will drop to -10o F to -15 o F or below for 3 hours or more. Or, lowest air temperature zero to -5o F.
Non-Threatening "No Discernable Threat to Life and Property from Excessive Cold."
Cold season weather conditions are non-threatening.

CHAPTER 2HAZARD IDENTIFICATION AND RISK ASSESSMENT(HIRA) 2011 2016
HURON COUNTY MULTI JURISDICTIONAL HAZARD MITIGATION PLAN 2011 2016 Page 34
Reported extreme cold events over the past 61 years provide an acceptable framework for determiningthe future occurrence in terms of frequency for such events. The probability of the County and itsmunicipalities experiencing an extreme cold event can be difficult to quantify, but based on historicalrecord of 7 extreme cold events since 1950, it can reasonably be assumed that this type of event hasoccurred once every 8.57 years from 1950 through 2011.
[(Current Year) 2011] subtracted by [(Historical Year) 1950] = 61 Years on Record
[(Years on Record) 61] divided by [(Number of Historical Events) 7] = 8.71
Furthermore, the historic frequency calculates that there is a 11% chance of this type of event occurringeach year.
According to the National Climatic Data Center, these extreme cold events include numbers reportedfrom multiple counties per each event. The most significant event occurred from February 2, 1996 untilFebruary 5, 1996. During this time frame, temperatures dipped as low as, 40 below zero. Theseextremely cold temperatures resulted in a fatality, and more than $3.4 million in property damage.
INVENTORY ASSETS EXPOSED TO TEMPERATURE EXTREMES
Vulnerability for extreme heat was classified as areas having a maximum average temperature over 85degrees, according to the United States Department of Agriculture (USDA) Natural ResourcesConservation Service (NRCS) study. This range falls within the upper limits of FEMA’s heat stress index,Caution Category 1 (see Table 2 13). Extreme heat does not generally impact buildings; instead, theyprimarily impact people. Nonetheless, facilities need to be maintained to ensure that they operate inappropriate conditions for people.
Additionally, vulnerability for extreme cold was classified as areas having a minimum averagetemperature less than 14 degrees, according to the USDA NRCS study. Extreme cold does not generallyimpact buildings; instead, they primarily impact people. Nonetheless, facilities need to be maintained toensure that they operate in appropriate conditions for people.
POTENTIAL LOSSES FROM TEMPERATURE EXTREMES
As stated in Table 2 12, since 1983, the NCDC reported over 7 extreme heat events in Huron Countyresulting in 18 deaths and 75 injuries, as well as experiencing $1,100,000 in property damage and$573,862 in crop damage. It is evident from past events that extreme heat is dangerous and can causehuman related illnesses and death. As temperature goes up so do the number of people hospitalized forheat related illnesses. Therefore it is important to understand how many people are exposed to suchconditions, and how many buildings exist, where potential problems could arise should power be lost.Additionally, extreme heat can cause damage to buildings or contents by overheating HVAC or airconditioning systems, contributing to jurisdictional losses. It is unlikely that an entire building would beimpacted in an extreme heat event, though.

CHAPTER 2HAZARD IDENTIFICATION AND RISK ASSESSMENT(HIRA) 2011 2016
HURON COUNTY MULTI JURISDICTIONAL HAZARD MITIGATION PLAN 2011 2016 Page 35
As stated in Table 2 13, since 1983, the NCDC reported 7 extreme cold events in Huron County resultingin 13 deaths and 0 injuries, as well as experiencing over $4 million dollars in property damage. It’sevident from this that extreme cold is dangerous and can cause death. Therefore it’s important tounderstand how many people are exposed to such conditions, and how many buildings exist, wherepotential problems could arise should power be lost. Additionally, extreme cold can cause damage tostructures; for example, burst pipes will damage buildings and will necessitate repairs. It is unlikely thatan entire building would be impacted in an extreme cold event.
LAND USE & DEVELOPMENT TRENDS TEMPERATURE EXTREMES
The Huron County 2007 Comprehensive Land Use Plan indicated that the population from 1990 2000had an increase in elderly populations. The elderly and small children are more susceptible totemperature extremes. Table 2 14 shows the age and population distribution from Huron County.
Table 2 14: Age and Population changes from 1990 2000 as shown in the Huron County 2007Comprehensive Plan
Additionally buildings of significant age may be more susceptible to temperature extremes. HuronCounty’s Comprehensive plan indicated that most buildings within in the County were built prior to 1939(See Table 2 15).

CHAPTER 2HAZARD IDENTIFICATION AND RISK ASSESSMENT(HIRA) 2011 2016
HURON COUNTY MULTI JURISDICTIONAL HAZARD MITIGATION PLAN 2011 2016 Page 36
Table 2 15: Huron County Housing Characteristics from 1990 2000
MULTI JURISDICTIONAL DIFFERENCES
Huron County is subject to temperature extremes. The affect temperature extremes will have on theCounty will vary due to population density, age of population, and the age of structures. Nonetheless,facilities need to be maintained to ensure that they operate in appropriate conditions for people. Those

CHAPTER 2HAZARD IDENTIFICATION AND RISK ASSESSMENT(HIRA) 2011 2016
HURON COUNTY MULTI JURISDICTIONAL HAZARD MITIGATION PLAN 2011 2016 Page 37
that are most prone to temperature extremes are jurisdictions with the highest populations, buildingsand building costs.
EXTREME TEMPERATURES HIRA SUMMARY
Huron County is subject to temperature extremes. The affect temperature extremes will have on theCounty will vary due to population density, age of population, and the age of structures. Nonetheless,facilities need to be maintained to ensure that they operate in appropriate conditions for people.Temporary periods of extreme hot or cold temperatures typically do not have significant environmentalimpact. However, prolonged periods of hot temperatures may be associated with drought conditionsand can damage or destroy vegetation, dry up rivers and streams, and reduce water quality. Prolongedexposure to extremely cold temperatures can kill wildlife and vegetation.

CHAPTER 2HAZARD IDENTIFICATION AND RISK ASSESSMENT(HIRA) 2011 2016
HURON COUNTY MULTI JURISDICTIONAL HAZARD MITIGATION PLAN 2011 2016 Page 38
SEVERE WINTER WEATHER ___________________________________ _______
NATURAL HAZARDS PROBABILITY IMPACT SPATIALEXTENT
WARNINGTIME
DURATION RFRATING
Winter Weather 3 (.9) 1 (.3) 4 (.8) 1 (.1) 3 (.3) 2.4MODERATE RISK (2.0 – 2.9)
HAZARD IDENTIFICATION
Huron County has been impacted by varyingdegrees of winter weather over the last century;however; the occurrence of severe winterweather in the county is relatively infrequent,even during winter months. Severe winterweather can cause hazardous driving conditions,communications and electrical power failure,community isolation and can adversely affectbusiness continuity. This type of severe weathermay include one or more of the following winterfactors:
Blizzards, as defined by the National WeatherService, are a combination of sustained winds or frequent gusts of 35 mph or greater and visibilities ofless than a quarter mile from falling or blowing snow for 3 hours or more. A blizzard, by definition, doesnot indicate heavy amounts of snow, although they can happen together. The falling or blowing snowusually creates large drifts from the strong winds. The reduced visibilities make travel, even on foot,particularly treacherous. The strong winds may also support dangerous wind chills. Ground blizzardscan develop when strong winds lift snow off the ground and severely reduce visibilities.
Heavy snow, in large quantities, may fall during winter storms. Six inches or more in 12 hours or eightinches or more in 24 hours constitutes conditions that may significantly hamper travel or createhazardous conditions. The National Weather Service issues warnings for such events. Smaller amountscan also make travel hazardous, but in most cases, only results in minor inconveniences. Heavy wetsnow before the leaves fall from the trees in the fall or after the trees have leafed out in the spring maycause problems with broken tree branches and power outages.
Ice storms develop when a layer of warm (above freezing), moist air aloft coincides with a shallow cold(below freezing) pool of air at the surface. As snow falls into the warm layer of air, it melts to rain, andthen freezes on contact when hitting the frozen ground or cold objects at the surface, creating a smoothlayer of ice. This phenomenon is called freezing rain. Similarly, sleet occurs when the rain in the warmlayer subsequently freezes into pellets while falling through a cold layer of air at or near the Earth’ssurface. Extended periods of freezing rain can lead to accumulations of ice on roadways, walkways,
Figure 2 4: Ice Build up on a Tree Limb

CHAPTER 2HAZARD IDENTIFICATION AND RISK ASSESSMENT(HIRA) 2011 2016
HURON COUNTY MULTI JURISDICTIONAL HAZARD MITIGATION PLAN 2011 2016 Page 39
power lines, trees, and buildings. Almost any accumulation can make driving and walking hazardous.Thick accumulations can bring down trees and power lines.
Extreme Cold, in extended periods, although infrequent, could occur throughout the winter months inHuron County. Heating systems compensate for the cold outside. Most people limit their time outsideduring extreme cold conditions, but common complaints usually include pipes freezing and cars refusingto start. When cold temperatures and wind combine, dangerous wind chills can develop.
Wind chill is how cold it “feels” and is based on the rate of heat loss on exposed skin from wind andcold. As the wind increases, it draws heat from the body, driving down skin temperature, andeventually, internal body temperature. Therefore, the wind makes it feel much colder than the actualtemperature. For example, if the temperature is 0°F and the wind is blowing at 15 mph, the wind chill is19°F. At this wind chill, exposed skin can freeze in 30 minutes. Wind chill does not affect inanimateobjects. (National Weather Service)
HAZARD PROFILE
The science of meteorology and records of severe weather are not quite sophisticated enough toidentify what areas of the county are at greater risk for damages. Therefore, all areas of the county areassumed to have the same winter weather risk countywide.
Severe winter weather can result in the closing of primary and secondary roads, particularly in rurallocations, loss of utility services, and depletion of oil heating supplies. Environmental impacts ofteninclude damage to shrubbery and trees due to heavy snow loading, ice build up, and/or high windswhich can break limbs or even bring down large trees. Gradual melting of snow and ice providesexcellent groundwater recharge; however, high temperatures following a heavy snowfall can causerapid surface water runoff and severe flash flooding.
The State of Ohio does have an extensive history of severe winter weather. In the winter of 2005, thestate was hit by a series of winter storms. These storms included ice storms, followed by unseasonablyhigh temperatures and high rainfall totals, all of which resulted in extensive flooding and mudslides.This series of storms resulted in Presidential Declaration FEMA DR 1580 OH. This declaration providedover one hundred and forty million dollars in recovery funds. These funds included Individualassistance, Public assistance, Hazard Mitigation Grant Funds, and a state match to the federal hazardmitigation funds. Huron County was again affected by a winter storm in 2008, which resulted in overeight million in public assistance funds, in FEMA DR 1805 OH.
More specifically, winter weather is a common occurrence in Ohio throughout the winter, and earlyspring months. According to the National Climatic Data Center, there have been 30 winter events inHuron County since 1950.

CHAPTER 2HAZARD IDENTIFICATION AND RISK ASSESSMENT(HIRA) 2011 2016
HURON COUNTY MULTI JURISDICTIONAL HAZARD MITIGATION PLAN 2011 2016 Page 40
Due to the nature of winter storms, it is extremely difficult to predict, but through identifying variousindicators of weather systems, and tracking these indicators, it provides us with a crucial means ofmonitoring winter weather. Understanding the historical frequency, duration, and spatial extent ofwinter weather assists in determining the likelihood and potential severity of future occurrences. Thecharacteristics of past severe winter events provide benchmarks for projecting similar conditions intothe future. The probability of Huron County and its municipality experiencing a severe winter stormevent can be difficult to quantify, but based on historical record of 30 events since 1950, it canreasonably be assumed that this type of event has occurred once every 2.00 years from 1950 through2010.
Heavy Snow Storms can immobilize a region and paralyze a city. These events can strand commuters,close airports, stop supplies from reaching their destinations and disrupt emergency and medicalservices. Accumulations of snow can cause roofs to collapse and knock down trees and power lines.Homes and farms may be isolated and unprotected livestock may be lost. The cost of snow removal,repairing damages, and the loss of business can have economic impacts on cities and towns.
Table 2 16: Severe Winter Storms Since 1961NATURAL HAZARD # OF EVENTS # OF INJURIES # OF FATALITIES RECORDED PROPERTY
DAMAGESWinter Storm/Heavy
Snow30 63 0 $79,216,000
TOTALS 30 63 0 $79,516,000
Reported heavy snow events over the past 50 years provide an acceptable framework for determiningthe future occurrence in terms of frequency for such events. The probability of the County and itsmunicipalities experiencing a flood event can be difficult to quantify, but based on historical record of 30winter storm events since 1961, it can reasonably be assumed that this type of event has occurred onceevery year from 1961 through 2011.
[(Current Year) 2011] subtracted by [(Historical Year) 1961] = 50 Years on Record
[(Years on Record) 50] divided by [(Number of Historical Events) 30] = 1.67
Furthermore, the historic frequency calculates that there is a 60% chance of this type of event occurringeach year.
Ice accumulations can lead to downed trees, utility poles and communication towers. Ice can disruptcommunications and power while utility companies repair significant damage. Even smallaccumulations of ice can be extremely dangerous to motorists and pedestrians. Bridges can overpassesare particularly dangerous because they freeze before other surfaces. An ice storm is a type of winterstorm characterized by freezing rain. The US National Weather Service defines an ice storm as a stormwhich results in the accumulation of at least .25 inch of ice on exposed surfaces.

CHAPTER 2HAZARD IDENTIFICATION AND RISK ASSESSMENT(HIRA) 2011 2016
HURON COUNTY MULTI JURISDICTIONAL HAZARD MITIGATION PLAN 2011 2016 Page 41
Table 2 17: Ice Storms Since 1950DATE # OF DEATHs # OF INJURIES RECORDED CROP
DAMAGERECORDED PROPERTY
DAMAGES02/08/1994 0 6 $500,000 $500,00004/10/1995 0 0 $0 $150,00012/18/1995 0 0 $0 $30,00001/13/1998 0 4 $0 $001/05/2005 0 0 $0 $124,900,000
TOTALS 0 10 $500,000 $125,580,000
Reported ice storm events over the past 61 years provide an acceptable framework for determining thefuture occurrence in terms of frequency for such events. The probability of the County and itsmunicipalities experiencing an ice event can be difficult to quantify, but based on historical record of 5substantial ice events since 1950, it can reasonably be assumed that this type of event has occurredonce every 12 years from 1950 through 2011.
[(Current Year) 2011] subtracted by [(Historical Year) 1950] = 61 Years on Record
[(Years on Record) 61] divided by [(Number of Historical Events) 5] = 12.2
Furthermore, the historic frequency calculates that there is an 8% chance of this type of event occurringeach year.
According to the National Climatic Data Center, the greatest impact resulting from an ice event occurredon January 5, 2005. The storm overall caused more than $124 million in damages across multiplecounties. In Huron County, the Southern half of the County experienced loss of electricity to almost 80%of customers. This outage lasted for up to ten days in some cases.
INVENTORY ASSETS EXPOSED TO SEVERE WINTER STORMS
All assets located in Huron County can be considered at risk from severe winter storms. This includes59,487 people, or 100 percent of the County’s population and all buildings and infrastructure within theCounty. Damages primarily occur as a result of cold temperatures, heavy snow or ice and sometimesstrong winds. Due to their regular occurrence, these storms are considered hazards only when theyresult in damage to specific structures or cause disruption to traffic, communications, electric power, orother utilities.
A winter storm can adversely affect roadways, utilities, business activities, and can cause loss of life,frostbite and freezing conditions. They can result in the closing of secondary roads, particularly in rurallocations, loss of utility services and depletion of oil heating supplies. Most structures, including thecounty’s critical facilities, should be able to provide adequate protection the structures could sufferdamage from snow load on rooftops and large deposits of ice. Those facilities with back up generatorsare better equipped to handle a severe weather situation should the power go out.

CHAPTER 2HAZARD IDENTIFICATION AND RISK ASSESSMENT(HIRA) 2011 2016
HURON COUNTY MULTI JURISDICTIONAL HAZARD MITIGATION PLAN 2011 2016 Page 42
POTENTIAL LOSSES FROM SEVERE WINTER STORMS
A timely forecast may not be able to mitigate the property loss, but could reduce the casualties andassociated injury. In severe winter storm events, buildings are vulnerable to widespread utilitydisruptions, including loss of heat and electricity, as well as building collapse or damage from downedtrees
LAND USE & DEVELOPMENT TRENDS RELATED TO SEVERE WINTER STORMS
As stated above, in severe winter storm events, buildings are vulnerable to widespread utilitydisruptions, including loss of heat and electricity, as well as building collapse or damage from downedtrees. Environmental impacts often include damage shrubbery and trees due to heavy snow loading, icebuild up and/or high winds which can break limbs or even bring down large trees. An indirect affect ofwinter storms is the treatment of roadway surfaces with salt, chemicals, and other de icing materialswhich can impair adjacent surface and ground waters. This is particularly a concern in highly urbanareas such as the City of Norwalk. Another important secondary impact for winter storms is building orstructure collapses; if there is a heavy snowfall or a significant accumulation over time, the weight of thesnow may cause building damage or even collapse.
Winter storms have a positive environmental impact as well; gradual melting of snow and ice providesexcellent groundwater recharge. However, abrupt high temperatures following a heavy snowfall cancause rapid surface water runoff and severe flooding.
MULTI JURISDICTIONAL DIFFERENCES
In the case of severe winter storms, population and building density has a correlation with hazardvulnerability and loss.
SEVERE WINTER STORMS HIRA SUMMARY
Huron County is subject to severe winter storms which have the potential to be hazard as a result ofcold temperatures, heavy snow or ice and sometimes strong winds. Severe winter storm hazards cancause a range of damage to structures that will depend on the magnitude and duration of storm events.Losses may be as small as lost productivity and wages when workers are unable to travel or as large assustained roof damage or building collapse. The severe winter storms profile is primarily concernedwith past and future damages from cold temperatures, heavy snow or ice and sometimes strong winds.
CHAPTER 2HAZARD IDENTIFICATION AND RISK ASSESSMENT(HIRA) 2011 2016
HURON COUNTY MULTI JURISDICTIONAL HAZARD MITIGATION PLAN 2011 2016 Page 43
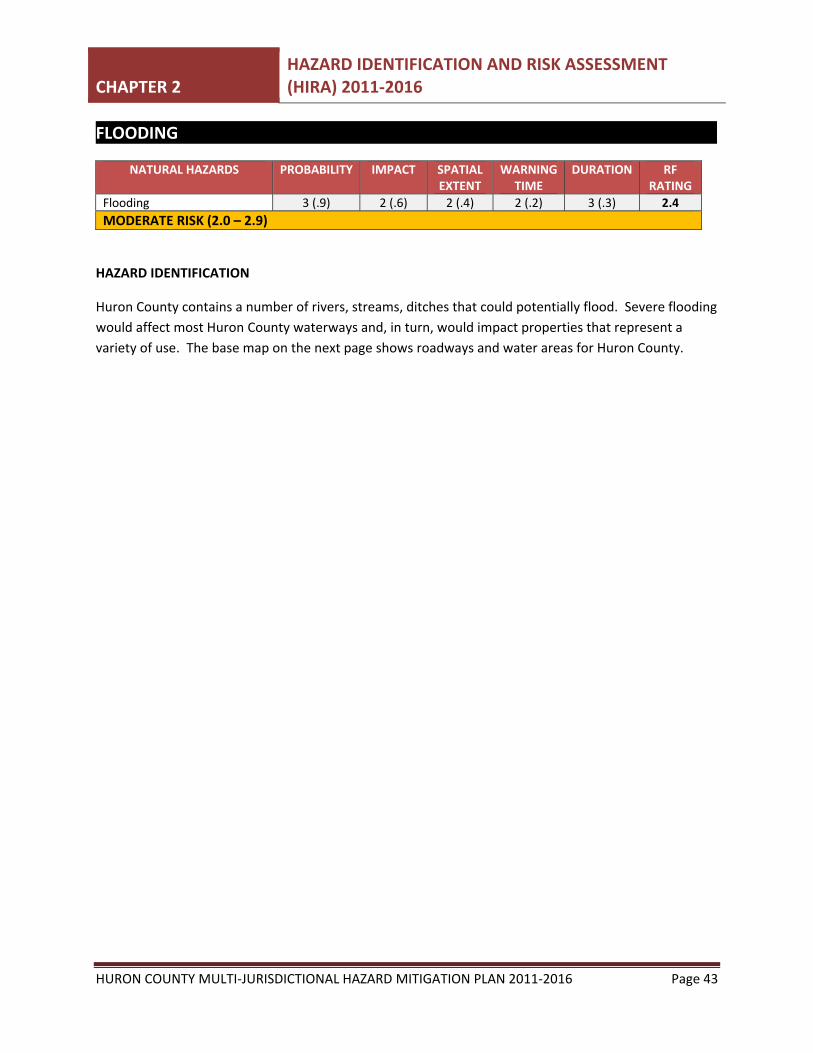
FLOODING _ ____
NATURAL HAZARDS PROBABILITY IMPACT SPATIALEXTENT
WARNINGTIME
DURATION RFRATING
Flooding 3 (.9) 2 (.6) 2 (.4) 2 (.2) 3 (.3) 2.4MODERATE RISK (2.0 – 2.9)
HAZARD IDENTIFICATION
Huron County contains a number of rivers, streams, ditches that could potentially flood. Severe floodingwould affect most Huron County waterways and, in turn, would impact properties that represent avariety of use. The base map on the next page shows roadways and water areas for Huron County.

CHAP
TER2
HAZA
RDIDEN
TIFICA
TIONAN
DRISK
ASSESSMEN
T(HIRA)
2011
2016
HURO
NCO
UNTY
MULTIJURISD
ICTIONAL
HAZA
RDMITIGAT
IONPLAN
2011
2016
Page
44
Figure
25:
Base
map
forH
uron
Coun
ty

CHAP
TER2
HAZA
RDIDEN
TIFICA
TIONAN
DRISK
ASSESSMEN
T(HIRA)
2011
2016
HURO
NCO
UNTY
MULTIJURISD
ICTIONAL
HAZA
RDMITIGAT
IONPLAN
2011
2016
Page
45
Figure
26:
Watershed
sofH
uron
Coun
ty.

CHAPTER 2HAZARD IDENTIFICATION AND RISK ASSESSMENT(HIRA) 2011 2016
HURON COUNTY MULTI JURISDICTIONAL HAZARD MITIGATION PLAN 2011 2016 Page 46
A flood is a natural event for rivers and streams and occurs when a normally dry area is inundated withwater. Excess water from snowmelt or rainfall accumulates and overflows onto the stream banks andadjacent floodplains. As illustrated in the figure below, floodplains are lowlands, adjacent to rivers,streams and creeks that are subject to recurring floods. Flash floods, usually resulting from heavy rainsor rapid snowmelt, can flood areas not typically subject to flooding, including urban areas. Extreme coldtemperatures can cause streams and rivers to freeze, causing ice jams and creating flood conditions.
The National Flood Insurance Program (NFIP), for which Flood Insurance Rate Maps (FIRM) arepublished, identifies the 1% annual chance flood. This 1% annual chance flood event is used to delineatethe Special Flood Hazard Area (SFHA) and identify Base Flood Elevations. Figure 4.3.2 2 illustrates theseterms. The SFHA serves as the primary regulatory boundary used by FEMA and Huron County.
Figure 2 7: Diagram identifying Special Flood Hazard Area, 1% annual chance (100 Year) floodplain,floodway and flood fringe, FEMA.
Floods are considered hazards when people and property are affected. Nationwide, hundreds of floodsoccur each year, making it one of the most common hazards in all 50 states and U.S. territories. In Ohio,flooding occurs commonly and can occur during any season of the year from a variety of sources. Mostinjuries and deaths from flooding happen when people are swept away by flood currents and mostproperty damage results from inundation by sediment filled water. Fast moving water can washbuildings off their foundations and sweep vehicles downstream. Pipelines, bridges, and otherinfrastructure can be damaged when high water combines with flood debris. Basement flooding cancause extensive damage. Flooding can cause extensive damage to crop lands and bring about the loss oflivestock. Several factors determine the severity of floods, including rainfall intensity and duration,topography and ground cover.
Riverine flooding originates from a body of water, typically a river, creek, or stream, as water levels riseonto normally dry land. Water from snowmelt, rainfall, freezing streams, ice flows, or a combination

CHAPTER 2HAZARD IDENTIFICATION AND RISK ASSESSMENT(HIRA) 2011 2016
HURON COUNTY MULTI JURISDICTIONAL HAZARD MITIGATION PLAN 2011 2016 Page 47
thereof, causes the river or stream to overflow its banks into adjacent floodplains. Winter floodingusually occurs when ice in the rivers creates dams or streams freeze from the bottom up during extremecold spells. Spring flooding is usually the direct result of melting winter snow packs, heavy spring rains,or a combination of the two.
Flash floods can occur anywhere when a large volume of water flows or melts over a short time period,usually from slow moving thunderstorms or rapid snowmelt. Because of the localized nature of flashfloods, clear definitions of hazard areas do not exist. These types of floods often occur rapidly withsignificant impacts. Rapidly moving water, only a few inches deep, can lift people off their feet, and onlya depth of a foot or two, is needed to sweep cars away. Most flood deaths result from flash floods.
Urban flooding is the result of development and the ground’s decreased ability to absorb excess waterwithout adequate drainage systems in place. Typically, this type of flooding occurs when land useschange from fields or woodlands to roads and parking lots. Urbanization can increase runoff two to sixtimes more than natural terrain. (National Oceanic and Atmospheric Administration, 1992) Theflooding of developed areas may occur when the amount of water generated from rainfall and runoffexceeds a storm water system's capability to remove it.
Ice Jams are stationary accumulations of ice that restrict flow. Ice jams can cause considerableincreases in upstream water levels, while at the same time, downstream water levels may drop. Typesof ice jams include freeze up jams, breakup jams, or combinations of both. When an ice jam releases,the effects downstream can be similar to that of a flash flood or dam failure. Ice jam flooding generallyoccurs in the late winter or spring.

CHAP
TER2
HAZA
RDIDEN
TIFICA
TIONAN
DRISK
ASSESSMEN
T(HIRA)
2011
2016
HURO
NCO
UNTY
MULTIJURISD
ICTIONAL
HAZA
RDMITIGAT
IONPLAN
2011
2016
Page
48
Thefigurebe
lowde
pictsthe
approxim
ate1pe
rcen
tannu
alchance
flood
plainandthede
tailed1pe
rcen
tannu
alchance
flood
plains
forH
uron
Coun
ty.
Figure
28:
Floo
dZo
nesa
ndWatercoursesfor
HuronCo
unty,H
uron
Coun
tyDF
IRM
databa
se.

CHAPTER 2HAZARD IDENTIFICATION AND RISK ASSESSMENT(HIRA)
HURON COUNTY MULTI JURISDICTIONAL HAZARD MITIGATION PLAN 2011 2016 Page 49
Huron County has FEMA effective Flood Insurance Rate Maps and a Countywide Flood Insurance Study.The maps can be obtained from the FEMA Map Service Center (http://www.msc.fema.gov). These mapscan be used to identify the expected spatial extent and elevation of flooding from a 1% and 0.2% annualchance event. Almost all of the municipalities in the County were determined to have special floodhazard areas (SFHA). An example of a Flood Insurance Rate Map can be seen onFigure2 10.
Figure 2 9: FIRM Panel 39077C0345D, effective January 19, 2011, showing flood hazard areas in theVillage of Greenwich, Huron County.
The table below indicates community participation in the National Flood Insurance Program.
Table 2 18: FEMA Community Status in the NFIPCID COMMUNITY NAME COUNTY INITIAL FIRM
IDENTIFIEDCURRENTEFFECTIVEMAP DATE
390770 HURON COUNTY* HURON COUNTY 8/1/1987 1/19/2011390283 MONROEVILLE, VILLAGE OF HURON COUNTY 8/1/1987 01/19/11390284 NEW LONDON, VILLAGE OF HURON COUNTY 5/1/1988 01/19/11390286 NORWALK, CITY OF HURON COUNTY 2/15/1979 1/19/2011390288 WAKEMAN, VILLAGE OF HURON COUNTY 9/1/1986 01/19/11390289 WILLARD, CITY OF HURON COUNTY 11/2/1984 01/19/11

CHAPTER 2HAZARD IDENTIFICATION AND RISK ASSESSMENT(HIRA)
HURON COUNTY MULTI JURISDICTIONAL HAZARD MITIGATION PLAN 2011 2016 Page 50
Table 2 18: FEMA Community Status in the NFIPCID COMMUNITY NAME COUNTY INITIAL FIRM
IDENTIFIEDCURRENTEFFECTIVEMAP DATE
390285 NORTH FAIRFIELD, VILLAGE OF HURON COUNTY 1/19/2011 1/19/2011390155 MILAN, VILLAGE OF HURON COUNTY/ERIE
COUNTY9/1/1978 08/28/08
390487 BELLEVUE, CITY OF ERIE COUNTY/HURONCOUNTY/SANDUSKYCOUNTY
10/17/1978 1/19/2011
HAZARD PROFILE
The severity of flooding in Huron County is determined by a number of local factors, including river basintopography , precipitation patterns, recent soil moisture conditions, and groundcover/vegetative state.Huron County and its municipalities have many streams and small tributaries that are highly susceptibleto flooding. The properties in and near the identified floodplains of Huron County are subject toflooding events on an almost annual basis. Floodplain management, flood control structures, hazardmitigation, and flood relief funds are strategies that have reduced Huron County’s annual flooddamages.
According to the National Climatic Data Center, Huron County has been impacted by 35 flood eventssince 1993.
Table 2 19: Flood Events affecting Huron CountyLocation Date Type Death Injury Property Damage Agricultural Damage
1 Milan 1/5/1993 Flood 0 0 $500,000 $02 Countywide 1/5/1993 Flash Flood 0 0 $500,000 $03 Countywide 4/12/1994 Flash Flood 0 0 $5,000 $04 Countywide 8/13/1994 Flash Flood 0 0 $500,000 $05 North Half 6/3/1995 Flash Flood 0 0 $10,000 $06 Bellevue 8/15/1995 Flash Flood 0 0 $10,000 $07 North Half 8/17/1995 Flash Flood 0 0 $3,000 $08 Countywide 4/23/1996 Flash Flood 0 0 $0 $09 Norwalk 6/19/1996 Flash Flood 0 0 $0 $010 Countywide 5/25/1997 Flash Flood 0 0 $0 $011 Countywide 5/25/1997 Flash Flood 0 0 $0 $012 Countywide 6/1/1997 Flood 0 0 $70,000 $10,00013 Countywide 6/1/1997 Flood 0 0 $25,000 $15,00014 Countywide 1/7/1998 Flood 0 0 $0 $015 Monroeville 1/9/1998 Flood 0 0 $0 $016 Fitchville 4/9/1998 Flood 0 0 $0 $017 Countywide 4/16/1998 Flood 0 0 $0 $018 Greenwich 5/3/1998 Flood 0 0 $0 $019 Countywide 6/30/1998 Flood 0 0 $15,000 $020 Countywide 6/30/1998 Flood 0 0 $50,000 $021 Countywide 8/25/1998 Flood 0 0 $1,000,000 $0

CHAPTER 2HAZARD IDENTIFICATION AND RISK ASSESSMENT(HIRA)
HURON COUNTY MULTI JURISDICTIONAL HAZARD MITIGATION PLAN 2011 2016 Page 51
Table 2 19: Flood Events affecting Huron CountyLocation Date Type Death Injury Property Damage Agricultural Damage
22 Monroeville 8/26/1998 Flood 0 0 $50,000 $023 Clarksfield 8/26/1998 Flood 0 0 $75,000 $024 Countywide 7/6/1999 Flood 0 0 $0 $025 Milan 2/23/2000 Flood 0 0 $20,000 $026 Norwalk 7/29/2000 Flash Flood 0 0 $500,000 $027 Willard 8/23/2000 Flash Flood 0 0 $0 $028 Countywide 7/8/2003 Flash Flood 0 0 $250,000 $029 Countywide 6/14/2004 Flood 0 0 $0 $030 Norwalk 1/1/2005 Flood 0 0 $1,700,000 $031 Countywide 6/21/2006 Flash Flood 0 0 $8,000,000 $032 Countywide 6/22/2006 Flood 0 0 $12,000,000 $7,000,00033 Milan 1/6/2007 Flood 0 0 $200,000 $034 Fitchville 6/26/2008 Flash Flood 0 0 $10,000 $10,00035 Fitchville 5/26/2009 Flash Flood 0 0 $400,000 $30,000
TOTAL: 0 0 $25,893,000 $7,065,000
Reported flood events over the past 18 years provide an acceptable framework for determining thefuture occurrence in terms of frequency for such events. The probability of the County and itsmunicipalities experiencing a flood event can be difficult to quantify, but based on historical record of 35flood events since 1993, it can reasonably be assumed that this type of event has occurred once everyfive months from 1993 through 2011.
[(Current Year) 2011] subtracted by [(Historical Year) 1993] = 18 Years on Record
[(Years on Record) 18] divided by [(Number of Historical Events) 35] = 0.51
Furthermore, the historic frequency calculates that there is a 100% chance of this type of eventoccurring each year.
According to the National Climatic Data Center, the greatest impact on Huron County as a result offlooding occurred on June 22, 2006. This event resulted in over a dozen homes in the County beingclassified as destroyed, and an additional 35 40 classified as having major damage. This event inflicted$12 million in property damage, and $7 million in crop damages.
INVENTORY ASSETS EXPOSED TO FLOODING
The method used in determining the types and numbers of potential assets exposed to flooding wasconducted using a loss estimation model called HAZUS MH. HAZUS MH is a regional multi hazard lossestimation model that was developed by the Federal Emergency Management Agency (FEMA) and theNational Institute of Buildings Sciences (NIBS). For this Plan update, a 100 year flood scenario wasmodeled and the results are presented below.

CHAPTER 2HAZARD IDENTIFICATION AND RISK ASSESSMENT(HIRA)
HURON COUNTY MULTI JURISDICTIONAL HAZARD MITIGATION PLAN 2011 2016 Page 52
HAZUS MH (MR4) 100 YEAR FLOOD SCENARIO
HAZUS estimates that approximately 173 buildings will be at least moderately damaged and 22 buildingsthat will be completely destroyed. The tables below summarize the expected damage by generaloccupancy for the buildings and the expected building damage by building type in the study region.
Table 2 20: Expected Building Damage by Occupancy (HAZUS Flood Scenario)
Table 2 21: Expected Building Damage by Building Type (HAZUS Flood Scenario)
The scenario reports that no critical facilities in the study region will be substantially damaged by a 100year flood event.
HAZUS estimates the amount of debris that will be generated by the 100 year flood. The model breaksthe debris into three general categories: a) Finishes (dry wall, insulation), b) Structural (wood, brick), andc) Foundations (concrete, slab, block, rebar). This distinction is made because of the different types ofmaterials handling equipment required to handle the debris.
The model estimates that a total of 5,439 tons of debris will be generated due to the flood. Of the totalamount, finishes comprises 75% of the total, structural comprises of 12% of the total, with theremainder being foundations. If the building tonnage is converted to an estimated number oftruckloads, it will require 218 truckloads (@25 tons/truck) to remove the debris generated by the flood.
HAZUS estimates the number of households that are expected to be displaced from their homes due tothe flood and the number of displaced people that will require accommodations in temporary public

CHAPTER 2HAZARD IDENTIFICATION AND RISK ASSESSMENT(HIRA)
HURON COUNTY MULTI JURISDICTIONAL HAZARD MITIGATION PLAN 2011 2016 Page 53
shelters. The model estimates 901 households to be displaced due to the flood. Of these, 1,190 (out ofa total population of 59,847) will seek temporary shelter in public shelters.
Critical facilities are essential to the health and welfare of the whole population and are especiallyimportant following hazard events. The following figure illustrates critical facilities located in the floodhazard areas followed by a table providing further data.

CHAP
TER2
HAZA
RDIDEN
TIFICA
TIONAN
DRISK
ASSESSMEN
T(HIRA)
HURO
NCO
UNTY
MULTIJURISD
ICTIONAL
HAZA
RDMITIGAT
IONPLAN
2011
2016
Page
54
Figure
210
:CriticalFacilitie
swith
inHu
ronCo
unty,H
uron
Coun
tyGIS20
11,and
ONDR
,200
9.

CHAPTER 2HAZARD IDENTIFICATION AND RISK ASSESSMENT(HIRA)
HURON COUNTY MULTI JURISDICTIONAL HAZARD MITIGATION PLAN 2011 2016 Page 55
According to the Huron County EMA, there is one critical facility located in the special flood hazard area.Details on this facility are provided in the table below. For a complete listing of critical facilities withinthe county, please see appendix V.
POTENTIAL LOSSES FROM FLOODING
All assets are considered at risk from flooding; however, losses may vary widely depending on the typeand factors contributing to the flood. To examine the potential losses from a flood, Huron Countymodeled a 100 year flood in Huron County using FEMA’s loss estimation tool: HAZUS MH.
HAZUS MH (MR4) 100 YEAR FLOOD SCENARIO
The total economic loss estimated for the flood is $165.99 million, which represents 8.18% of the totalreplacement value of the scenario buildings. The building related losses are broken into two categories:direct property damage losses and business interruption losses. The direct property damage losses arethe estimated costs to repair or replace the damage caused to the building and its contents. Thebusiness interruption losses are the losses associated with the inability to operate a business because ofthe damage sustained during the flood. Business interruption losses also include the temporary livingexpenses for those people displaced from their homes because of the flood.
The total building related losses were $54.99 million. Less than 1% of the estimated losses were relatedto the business interruption of the region. The residential occupancies made up 68.12% of the total loss.The table below provides a summary of the losses associated with the building damage.
Table 2 23: Building Related Economic Loss Estimates (HAZUS Flood Scenario)
Table 2 22: Existing Critical Facilities located in the Special Flood Hazard AreaFACILITY MUNICIPALITY TYPE OF FACILITY
Monroeville Water Treatment Plan Monroeville Sanitary Treatment Facility

CHAPTER 2HAZARD IDENTIFICATION AND RISK ASSESSMENT(HIRA)
HURON COUNTY MULTI JURISDICTIONAL HAZARD MITIGATION PLAN 2011 2016 Page 56
Repetitive loss properties are those for which two or more losses of at $1,000 each have been paidunder the National Flood Insurance Program (NFIP) within any 10 year period since 1978. A property isconsidered a severe repetitive loss property either when there are at least four losses each exceeding$5,000 or when there are two or more losses where the building payments exceed the property value.The following table details the known repetitive loss properties in Huron County by location, number oflosses, and structure type. As of 2010, there are eighteen (5) repetitive loss properties located in HuronCounty (1) in the Village of Monroeville and, (4) in the City of Norwalk. There are no severe repetitiveloss properties for Huron County.
Table 2 24: Repetitive Flood Loss Properties in Huron County
COMMUNITYNAME
COMMUNITYNO.
# RLPROPERTY
TOTALLOSSES
TOTALBUILDINGPAYMENT
TOTALCONTENTSPAYMENT
TOTALPAYMENT
SRLPROPERTY
MONROEVILLE, VILLAGE OF 390283
1 (SingleFamilyResidential) 2 $8,255.38 $0.00 $8,255.38 0
NORWALK,CITY OF 390286
4 (SingleFamilyResidential) 9 $142,379.55 $29,196.39 $171,575.94 0
TOTAL: 5
LAND USE & DEVELOPMENT TRENDS
Commercial
According to the 2007 Comprehensive Plan most commercial activity is located along major highwaycorridors particularly in the Norwalk and Willard area. Other similar types of establishments havelocated throughout the county but not to as great an extent.
This trend is expected to continue over the next 25 years. One reason is that the retail and servicemarket is far from being saturated in the Norwalk and Willard area. Another reason is that the hightransportation costs which are expected to continue to rise are keeping more and more travelers closerto home in their quests for goods and services. A third reason is that there will continue to beopportunities for commercial and service oriented real estate investment due to reason one. Themarket has yet to be saturated.
The commercial growth corridors include, in decreasing size and significance:
U.S. 250 in Norwalk, north from League Street to Milan. This area will continue to be developedas property is marketed for commercial use. The roadway has been upgraded on severaloccasions to accommodate additional traffic.
U.S. 224 through Willard. This route has also witnessed significant growth through the years.This corridor has emerged as the commercial center for the southwestern portion of the county.

CHAPTER 2HAZARD IDENTIFICATION AND RISK ASSESSMENT(HIRA)
HURON COUNTY MULTI JURISDICTIONAL HAZARD MITIGATION PLAN 2011 2016 Page 57
U.S. 20 between Bellevue and Monroeville. This corridor has not experienced the degree ofcommercial growth similar to the previously mentioned corridors but continues to offerpotential, and some commercial and service type of investment.
One of the reasons for this potential is the north south State Route 4 intersection with U.S. 20and the recently upgraded and developed interchange of the Ohio Turnpike just to the north.The seasonal traffic to the Lake Erie resort areas also adds to this potential.
The Village corridors which include: U.S. Route 224 through Greenwich, State Routes 162 and 60through New London, U.S. Route 20 through Monroeville and Wakeman and State Route 61through Plymouth.
Industrial
Huron County has been fortunate through the years to have most of its industrial development locatedwithin the municipalities that exist within the county. There is also the opportunity within thesemunicipalities for significant industrial expansion. This has been accomplished by local public officialsdesignating land for industrial parks and implementing industrial zoning regulations that apply to theseareas. There are currently 11 industrial parks located within the three cities and eight villages locatedwithin Huron County.
A number of these industrial parks are described below:
In Norwalk, the Firelands Industrial Park, with several remaining lots under control of a singledeveloper.Also in Norwalk, the Missler Gibson Industrial Park on the east side of the city, where severalnew facilities have been constructed during the past several years.In Willard, a new industrial park has been developed on the east side of the city, which wasspurred by a private development consortium.In Bellevue, industrial properties exist along State Route 269 on the southern end of the city,while a new industrial park was recently developed along Goodrich Road in the Northeastquadrant of the city.In Monroeville, the industrial park along U.S. 20 was recently expanded and access improvedinto the park.In New London, acreage remains in a north side industrial park along State Route 60 and in theWhite Industrial Park along S.R. 162 in the eastern portion of the village.The Village of Plymouth continues to pursue development in its two industrial parks in theNorthern part of the Village to the east and west of S.R. 61.The Village of Greenwich continues to pursue the development of an industrial park along U.S.Route 224 west of the center of town.

CHAPTER 2HAZARD IDENTIFICATION AND RISK ASSESSMENT(HIRA)
HURON COUNTY MULTI JURISDICTIONAL HAZARD MITIGATION PLAN 2011 2016 Page 58
According to the 2007 Comprehensive Plan most of the new industrial developments throughout HuronCounty over the next 25 years will more than likely take place within these industrial park areas alongwith other individual sites that are already designated for industrial development throughout thecounty. It’s important to note whether these sites for both future commercial and industrialdevelopment are located within designated floodplain areas so that development can be constructed ina way that mitigates the risk to being exposed to flooding.
MULTI JURISDICTIONAL DIFFERENCES
Jurisdiction difference in regard to flooding in Huron County are determined by a number of localfactors, including river basin topography , precipitation patterns, recent soil moisture conditions, andgroundcover/vegetative state. Huron County and its municipalities have many streams and smalltributaries that are highly susceptible to flooding. The properties in and near the identified floodplainsof Huron County are subject to flooding events on an almost annual basis. FEMA Flood Insurance RateMaps (FIRMs) are a good tool for each jurisdiction to use to identify the geographic extent for risk toflooding.
FLOODING HIRA SUMMARY
Severe flooding has the potential to inflict significant damage in Huron County. Assessing flood damagerequires the communities throughout Huron County to remain alert and notify County officials ofpotential flood prone areas near infrastructure such as roads, bridges, and buildings. While floodingremains a likely occurrence throughout the identified flood hazard areas of Huron County, smallerfloods caused by heavy rains and inadequate drainage capacity will be more frequent, but not as costlyas the large scale floods which may occur at much less frequent intervals. While the potential for floodis always present, Huron County does have policies and regulations for development that should helplessen potential damage due to floods.

CHAPTER 2HAZARD IDENTIFICATION AND RISK ASSESSMENT(HIRA)
HURON COUNTY MULTI JURISDICTIONAL HAZARD MITIGATION PLAN 2011 2016 Page 59
HIGH WIND EVENTS _ ____
NATURAL HAZARDS PROBABILITY IMPACT SPATIALEXTENT
WARNINGTIME
DURATION RFRATING
High Wind Events 3 (.9) 1 (.3) 3 (.6) 3 (.3) 2 (.2) 2.3MODERATE RISK (2.0 – 2.9)
HAZARD IDENTIFICATION
Wind is defined as the motion of air relative to theearth’s surface. Extreme windstorm events areassociated with extratropical tropical cyclones,winter cyclones, and severe thunderstorms andaccompanying mesoscale offspring such astornadoes and downbursts. In the mainlandUnited States, the mean annual wind speed isreported to be 8 12 mph, with frequent speeds of50 mph and occasional wind speeds of greaterthan 70 mph.
Individually and collectively, wind storms areamong the most devastating of all natural hazards. Currently there is no unified national program inplace to focus upon reducing the effects of extreme wind events through the development andimplementation of cost effective mitigation strategies.
Each year the United States suffers tremendous losses as a result of wind storms. The country hasexperienced unprecedented destruction from hurricanes in the past several years. The last decade hasseen devastating damages caused by severe tornado outbreaks in several states in the mid west andsoutheast destroying towns and cities. Windstorm losses are not restricted to the hurricane coast and"tornado alley" as demonstrated in 1999 when a F4 tornado touched down in Salt Lake City. Winddriven wildfires routinely exceed the ability of fire suppression activities and burn largely uncontrolledand consume thousands of properties until the environmental conditions change.
Tornadoes and other windstorms cause death and injury, business interruption, and high levels ofproperty damage in all 50 states and all U.S. territories. The death toll from Hurricane Katrina alone wasclose to 1,300. As urban growth continues and people move to coastal areas and wild land urbaninterface areas, the trend towards larger impacts and increasing costs will continue unless an effectivewind hazard reduction plan is implemented in the near future.
Figure 2 11: Destruction from High Wind Events.

CHAPTER 2HAZARD IDENTIFICATION AND RISK ASSESSMENT(HIRA)
HURON COUNTY MULTI JURISDICTIONAL HAZARD MITIGATION PLAN 2011 2016 Page 60
HAZARD PROFILE
The science of meteorology and records of severe weather are not quite sophisticated enough toidentify what areas of the county are at greater risk for damages. Therefore, all areas of the county areassumed to have the same high wind risk countywide.
High winds can be an issue year round. Tornadoes can spawn from thunderstorms in the spring andsummer, remnants from tropical storms often become extratropical as they move inland from the warmocean water, and winter storms can develop strong winds which can lead to snow drifts and blizzardconditions. The state of Ohio has an extensive history of high wind events.
More specifically, strong winds are a common occurrence in Ohio, and have occurred in every calendarmonth. According to the National Climatic Data Center, there have been 37 winter events in NorthernOhio since 1994.
Table 2 25: High Wind Events affecting Huron CountyLocation Date Type Wind
SpeedDeath Injury Property
DamageAgriculturalDamage
1 Northern Ohio 11/1/1994 HighWinds
0 kts. 0 1 $500,000 $0
2 Statewide 11/27/1994 HighWinds
0 kts. 0 1 $50,000 $0
3 Northeast Ohio 11/28/1994 HighWinds
0 kts. 0 0 $500,000 $0
4 Northeast Ohio 10/20/1995 HighWinds
0 kts. 0 0 $70,000 $0
5 Northern Ohio 11/11/1995 HighWinds
0 kts. 0 0 $360,000 $0
6 North CentralOhio
11/27/1995 HighWinds
0 kts. 0 0 $40,000$0
7 Northeast Ohio 1/27/1996 HighWind
68 kts. 0 0 $0 $0
8 Northern Ohio 2/10/1996 HighWind
50 kts. 0 0 $45,000 $0
9 Northern Ohio 3/25/1996 HighWind
55 kts. 0 0 $529,000 $0
10 Northern Ohio 4/25/1996 HighWind
52 kts. 0 0 $44,000 $0
11 Northern Ohio 9/7/1996 HighWind
50 kts. 0 0 $128,000 200K
12 Northern Ohio 10/30/1996 HighWind
69 kts. 1 2 $5,300,000 2.3M
13 Northern Ohio 2/21/1997 HighWind
58 kts. 0 0 $20,000 $0
14 North CentralOhio
2/27/1997 HighWind
57 kts. 0 0 $180,000 $0
15 Huron County 4/30/1997 High 50 kts. 0 0 $2,000 $0

CHAPTER 2HAZARD IDENTIFICATION AND RISK ASSESSMENT(HIRA)
HURON COUNTY MULTI JURISDICTIONAL HAZARD MITIGATION PLAN 2011 2016 Page 61
Table 2 25: High Wind Events affecting Huron CountyLocation Date Type Wind
SpeedDeath Injury Property
DamageAgriculturalDamage
Wind16 Northern Ohio 3/28/1998 High
Wind0 kts. 0 0 $305,000 $0
17 Northern Ohio 11/10/1998 HighWind
0 kts. 0 0 $535,000 $0
18 Huron County 4/6/1999 HighWind
0 kts. 0 0 $30,000 $0
19 Northern Ohio 5/6/1999 HighWind
52 kts. 0 0 $328,000 $50,000
20 Northern Ohio 12/11/2000 HighWind
0 kts. 0 0 $4,400,000 $0
21 Northern Ohio 2/9/2001 HighWind
0 kts. 0 0 $320,000 $0
22 Northern Ohio 2/25/2001 HighWind
0 kts. 0 0 $460,000 $0
23 Northern Ohio 4/12/2001 HighWind
0 kts. 1 0 $815,000 $0
24 Northern Ohio 10/25/2001 HighWind
0 kts. 0 4 $760,000 $0
25 Northern Ohio 2/1/2002 HighWind
0 kts. 0 0 $1,100,000 $0
26 Northern Ohio 3/9/2002 HighWind
55 kts. 2 8 $8,900,000 $0
27 Northern Ohio 11/12/2003 HighWind
52 kts. 0 0 $2,300,000 $0
28 Northern Ohio 3/5/2004 HighWind
52 kts. 0 1 $2,400,000 $0
29 Northern Ohio 12/7/2004 HighWind
57 kts. 0 0 $380,000 $0
30 Northern Ohio 11/6/2005 HighWind
50 kts. 0 0 $410,000 $0
31 Northern Ohio 2/17/2006 HighWind
58 kts. 0 0 $995,000 $0
32 North CentralOhio
12/1/2006 HighWind
50 kts. 0 0 $8,000 $0
33 Northern Ohio 12/23/2007 HighWind
50 kts. 0 0 $12,000 $0
34 Ashland, HuronCounties
1/30/2008 HighWind
55 kts. 0 0 $30,000 $0
35 Northern Ohio 9/14/2008 HighWind
52 kts. 0 0 $2,500,000 500K
36 Northern Ohio 2/11/2009 HighWind
56 kts. 0 0 $1,500,000 $0
37 Northern Ohio 12/9/2009 HighWind
52 kts. 0 0 $500,000 $0
Totals 4 17 $36,596,000 $3,000,000

CHAPTER 2HAZARD IDENTIFICATION AND RISK ASSESSMENT(HIRA)
HURON COUNTY MULTI JURISDICTIONAL HAZARD MITIGATION PLAN 2011 2016 Page 62
Figure 2 13 depicts the wind zone for Huron County. The wind zones were established by the AmericanSociety of Civil Engineers based on information which includes 40 years of tornado history and over 100years of hurricane history. Huron County falls into within Zone IV. Shelters and critical facilities shouldbe able to withstand a 3 second gust of up to 250 mph, regardless of whether the gust is the result of atornado, coastal storm, or windstorm event. Therefore, these structures should be able to withstandthe wind speeds experienced in an F5 tornado event.
Due to the nature of storms, it is extremely difficult to predict, but through identifying various indicatorsof weather systems, and tracking these indicators, it provides us with a crucial means of monitoringextreme weather. Understanding the historical frequency, duration, and spatial extent of high windevents assists in determining the likelihood and potential severity of future occurrences. Thecharacteristics of past severe wind events provide benchmarks for projecting similar conditions into thefuture. The probability of Huron County and its municipalities experiencing a severe wind events can bedifficult to quantify, but based on historical record of 37 events since 1994, it can reasonably beassumed that this type of event has occurred once every four months from 1994 through 2011.
[(Current Year) 2011] subtracted by [(Historical Year) 1994] = 17 Years on Record
[(Years on Record) 17] divided by [(Number of Historical Events) 37] = 0.46
Furthermore, the historic frequency calculates that there is a 100% chance of this type of eventoccurring each year.
A tornado is a violent windstorm characterized by a twisting,funnel shaped cloud extending to the ground. Tornadoesare most often generated by thunderstorm activity (butsometimes result from hurricanes or tropical storms) whencool, dry air intersects and overrides a layer of warm, moistair forcing the warm air to rise rapidly. The damage causedby a tornado is a result of high wind velocities and windblown debris. According to the National Weather Service,tornado wind speeds can range between 30 to more than300 miles per hour. They are more likely to occur during thespring and early summer months of March through June andare most likely to form in the late afternoon and earlyevening. Most tornadoes are a few dozen yards wide andtouchdown briefly, but even small, short lived tornadoes caninflict tremendous damage. Destruction ranges from minorto catastrophic depending on the intensity, size, andduration of the storm. Structures made of light materialssuch as mobile homes are most susceptible to damage. Each

CHAPTER 2HAZARD IDENTIFICATION AND RISK ASSESSMENT(HIRA)
HURON COUNTY MULTI JURISDICTIONAL HAZARD MITIGATION PLAN 2011 2016 Page 63
year, an average of over 800 tornadoes is reported nationwide, resulting in an average of 80 deaths and1,500 injuries (NOAA, 2002).
The Enhanced Fujita Scale, also known as the “EF Scale,” measures tornado strength and associateddamages. The EF Scale is an update to the earlier Fujita scale that was published in 1971. It classifiesUnited States tornadoes into six intensity categories, as shown in table below, based upon the estimatedmaximum winds occurring within the wind vortex. The EF Scale has become the definitive metric forestimating wind speeds within tornadoes based upon the damage done to buildings and structures sinceit was implemented through the National Weather Service in 2007.
Table 2 26: Enhanced Fujita Scale and Associated Damage
EF SCALENUMBER
WIND SPEED(MPH) TYPE OF DAMAGE POSSIBLE
EFO 65 85
Minor damage: Peels surface off some roofs; some damage to gutters or siding;branches broken off trees; shallow rooted trees pushed over. Confirmedtornadoes with no reported damage (i.e., those that remain in open fields) arealways ratedEF0.
EF1 86 110
Moderate damage: Roofs severely stripped; mobile homes overturned or badlydamaged; loss of exterior doors; windows and other glass broken.
EF2 111 135
Considerable damage: Roofs torn off well constructed houses; foundations offrame homes shifted; mobile homes completely destroyed; large trees snapped oruprooted; light object missiles generated; cars lifted off ground.
EF3 136 165
Severe damage: Entire stories of well constructed houses destroyed; severedamage to large buildings such as shopping malls; trains overturned; treesdebarked; heavy cars lifted off the ground and thrown; structures with weakfoundations blown away some distance.
EF4 166 200
Devastating damage: Well constructed houses and whole frame housescompletely leveled; cars thrown and small missiles generated.
EF5 >200
Extreme damage: Strong frame houses leveled off foundations and sweptaway; automobile sized missiles fly through the air in excess of 100 m (300 ft);steel reinforced concrete structure badly damaged; high rise buildings havesignificant structural deformation.
The Storm Prediction Center has developed damage indicators to be used with the Enhanced Fujita Scalefor different types of buildings but can be also be used to classify any high wind event. Some of theindicators for different building types are shown in tables below.
Table 2 27: Institutional BuildingsDAMAGE DESCRIPTION WIND SPEED RANGE (Expected in Parentheses)
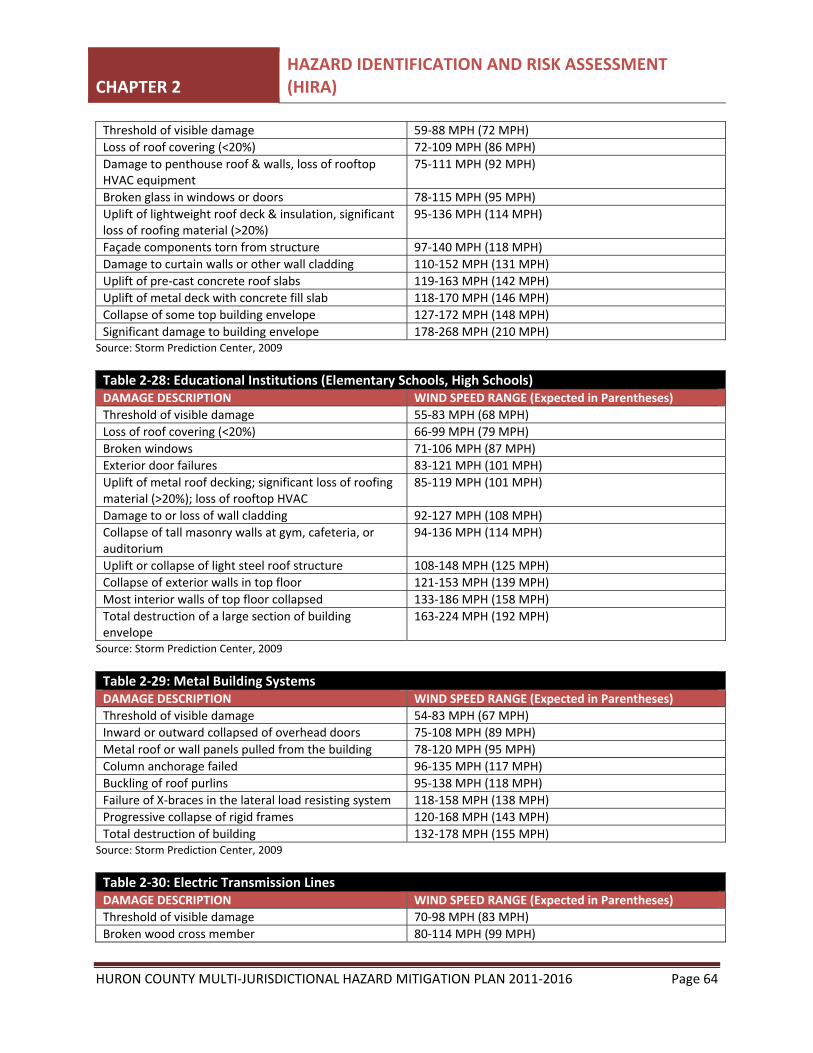
CHAPTER 2HAZARD IDENTIFICATION AND RISK ASSESSMENT(HIRA)
HURON COUNTY MULTI JURISDICTIONAL HAZARD MITIGATION PLAN 2011 2016 Page 64
Threshold of visible damage 59 88 MPH (72 MPH)Loss of roof covering (<20%) 72 109 MPH (86 MPH)Damage to penthouse roof & walls, loss of rooftopHVAC equipment
75 111 MPH (92 MPH)
Broken glass in windows or doors 78 115 MPH (95 MPH)Uplift of lightweight roof deck & insulation, significantloss of roofing material (>20%)
95 136 MPH (114 MPH)
Façade components torn from structure 97 140 MPH (118 MPH)Damage to curtain walls or other wall cladding 110 152 MPH (131 MPH)Uplift of pre cast concrete roof slabs 119 163 MPH (142 MPH)Uplift of metal deck with concrete fill slab 118 170 MPH (146 MPH)Collapse of some top building envelope 127 172 MPH (148 MPH)Significant damage to building envelope 178 268 MPH (210 MPH)
Source: Storm Prediction Center, 2009
Table 2 28: Educational Institutions (Elementary Schools, High Schools)DAMAGE DESCRIPTION WIND SPEED RANGE (Expected in Parentheses)Threshold of visible damage 55 83 MPH (68 MPH)Loss of roof covering (<20%) 66 99 MPH (79 MPH)Broken windows 71 106 MPH (87 MPH)Exterior door failures 83 121 MPH (101 MPH)Uplift of metal roof decking; significant loss of roofingmaterial (>20%); loss of rooftop HVAC
85 119 MPH (101 MPH)
Damage to or loss of wall cladding 92 127 MPH (108 MPH)Collapse of tall masonry walls at gym, cafeteria, orauditorium
94 136 MPH (114 MPH)
Uplift or collapse of light steel roof structure 108 148 MPH (125 MPH)Collapse of exterior walls in top floor 121 153 MPH (139 MPH)Most interior walls of top floor collapsed 133 186 MPH (158 MPH)Total destruction of a large section of buildingenvelope
163 224 MPH (192 MPH)
Source: Storm Prediction Center, 2009
Table 2 29: Metal Building SystemsDAMAGE DESCRIPTION WIND SPEED RANGE (Expected in Parentheses)Threshold of visible damage 54 83 MPH (67 MPH)Inward or outward collapsed of overhead doors 75 108 MPH (89 MPH)Metal roof or wall panels pulled from the building 78 120 MPH (95 MPH)Column anchorage failed 96 135 MPH (117 MPH)Buckling of roof purlins 95 138 MPH (118 MPH)Failure of X braces in the lateral load resisting system 118 158 MPH (138 MPH)Progressive collapse of rigid frames 120 168 MPH (143 MPH)Total destruction of building 132 178 MPH (155 MPH)
Source: Storm Prediction Center, 2009
Table 2 30: Electric Transmission LinesDAMAGE DESCRIPTION WIND SPEED RANGE (Expected in Parentheses)Threshold of visible damage 70 98 MPH (83 MPH)Broken wood cross member 80 114 MPH (99 MPH)

CHAPTER 2HAZARD IDENTIFICATION AND RISK ASSESSMENT(HIRA)
HURON COUNTY MULTI JURISDICTIONAL HAZARD MITIGATION PLAN 2011 2016 Page 65
Wood poles leaning 85 130 MPH (108 MPH)Broken wood poles 98 142 MPH (118 MPH)
Strong winds can also occur outside of tornadoes, severe thunderstorms, and winter storms. Thesewinds typically develop with strong pressure gradients and gusty frontal passages. The closer andstronger two systems (one high pressure, one low pressure) are, the stronger the pressure gradient, andtherefore, the stronger the winds are.
Downburst winds, which can cause more widespread damage than a tornado, occur when air is carriedinto a storm’s updraft, cools rapidly, and comes rushing to the ground. Cold air is denser than warm air,and therefore, wants to fall to the surface. On warm summer days, when the cold air can no longer besupported up by the storm’s updraft, or an exceptional downdraft develops, the air crashes to theground in the form of strong winds. These winds are forced horizontally when they reach the groundand can cause significant damage. These types of strong winds can also be referred to as straight linewinds. Downbursts with a diameter of less than 2.5 miles are called microbursts and those with adiameter of 2.5 miles or greater are called macrobursts. A derecho, or bow echo, is a series ofdownbursts associated with a line of thunderstorms. This type of phenomenon can extend for hundredsof miles and contain wind speeds in excess of 100 mph.
Table 2 31: Tornadoes in Huron CountyLocation Date Time Magnitude Deaths Injury Property
DamageAgriculturalDamage
1 HURON 8/17/1972 1111 F2 0 0 $250,000 $02 HURON 5/10/1973 1638 F3 5 100 $2,500,000 $03 HURON 6/26/1973 1740 F1 0 0 $0 $04 HURON 6/26/1973 1800 F0 0 0 $0 $05 HURON 9/5/1975 1635 F1 0 0 $25,000 $06 HURON 4/25/1976 1112 F0 0 0 $3,000 $07 HURON 6/30/1977 1740 F1 0 0 $250,000 $08 HURON 6/30/1977 1740 F2 0 0 $250,000 $09 HURON 6/26/1978 1113 F1 0 0 $25,000 $010 HURON 5/2/1983 1220 F2 0 2 $250,000 $011 HURON 3/10/1986 1703 F2 1 10 $2,500,000 $012 HURON 5/15/1986 1805 F0 0 0 $25,000 $013 HURON 11/27/1989 2235 F2 0 1 $2,500,000 $014 HURON 5/30/1991 1920 F1 0 0 $250,000 $015 HURON 7/12/1992 1900 F2 0 0 $25,000 $016 Norwalk 9/30/1994 2255 F1 0 0 $50,000 $017 Willard 7/21/1998 2140 F0 0 0 $100,000 $018 New London 7/9/1999 1700 F1 0 0 $100,000 $019 Monroeville 9/20/2000 1905 F2 0 1 $250,000 $15,00020 Hunts Corner 11/10/2002 1742 F1 0 0 $800,000 $021 Collins 7/10/2003 1030 F0 0 0 $10,000 $30,000Totals 4 17 $36,596,000 $3,000,000

CHAPTER 2HAZARD IDENTIFICATION AND RISK ASSESSMENT(HIRA)
HURON COUNTY MULTI JURISDICTIONAL HAZARD MITIGATION PLAN 2011 2016 Page 66
The probability of a tornado occurring in a specific region or area depends on certain atmosphericconditions. In an average year, eight hundred tornadoes are reported nationwide. A tornado is definedas a violently rotating column of air extending from a thunderstorm to the ground. The most violenttornadoes are capable of tremendous destruction with wind speeds of 250 mph or more.Thunderstorms develop in warm, moist air in advance of eastward moving cold fronts. Thesethunderstorms often produce large hail, strong winds, and tornadoes.
Reported tornadic events over the past 39 years provide an acceptable framework for determining thefuture occurrence in terms of frequency for such events. The probability of the County and itsmunicipalities experiencing a tornado event can be difficult to quantify, but based on historical record of21 severe storms since 1972, it can reasonably be assumed that this type of event has occurred onceevery 1.8 years from 1972 through 2011.
[(Current Year) 2011] subtracted by [(Historical Year) 1972] = 39 Years on Record
[(Years on Record) 39] divided by [(Number of Historical Events) 21] = 1.86
Furthermore, the historic frequency calculates that there is a 54% chance of this type of event occurringeach year. The figure on the next page shows Huron County’s tornado in history in relation to othercounties within the State of Ohio.

CHAP
TER2
HAZA
RDIDEN
TIFICA
TIONAN
DRISK
ASSESSMEN
T(HIRA)
HURO
NCO
UNTY
MULTIJURISD
ICTIONAL
HAZA
RDMITIGAT
IONPLAN
2011
2016
Page
67
Figure
213
:To
rnad
oAc
tivity
forH
uron
Coun
tyfrom
1950
1998

CHAP
TER2
HAZA
RDIDEN
TIFICA
TIONAN
DRISK
ASSESSMEN
T(HIRA)
HURO
NCO
UNTY
MULTIJURISD
ICTIONAL
HAZA
RDMITIGAT
IONPLAN
2011
2016
Page
68
Figure
214
:Torna
doEven
tsan
dAssociated
FujitaScaleforH
uron
Coun
ty

CHAPTER 2HAZARD IDENTIFICATION AND RISK ASSESSMENT(HIRA)
HURON COUNTY MULTI JURISDICTIONAL HAZARD MITIGATION PLAN 2011 2016 Page 69
INVENTORY ASSETS EXPOSED TO HIGH WINDS
Inventory assets vulnerable to high winds are dependent on the age of the building, type, constructionmaterial used, and condition of the structure. Structures are susceptible to lateral loads, as the windsimpact the flat surfaces of a building. In addition, uplift forces can impact structures, as the winds movenot just in straight lines, but at angles as well.
Probably the greatest issue for critical facilities during significant winds is the inaccessibility of suchfacilities due to debris covered roads, utility outages, or other debris related issues. During periods ofheavy winds, roads can become impassable, dues to downed trees or power lines. Power andcommunication lines are susceptible to damage from falling limbs, as trees are rocked by strong winds.Possible losses to critical infrastructure include:
Electric power disruptionCommunication disruptionRoad closures
Depending on the season, downed power and communication lines can become very hazardous. Thesethreats combined with extreme heat or cold can lead to significant threats to the population.
Additional information on construction type and building codes enforced at time of construction wouldallow a more thorough assessment of the vulnerability of structures to impacts such as severe winds.Based on the information available, all communities in Huron County are essentially equally vulnerableto the direct impacts of high wind events.
POTENTIAL LOSSES
Severe winds affect the entire planning area of Huron County, including all above ground structures andinfrastructure. Although losses to structures are typically minimal and covered by insurance, there canbe impacts with lost time, maintenance costs, and contents within structures. Estimated costs forindividual high wind events are not readily available specifically for Huron County; however theNorthern Ohio area sustained $36,596,000 in damages from wind storms since 1950.
LAND USE & DEVELOPMENT TRENDS
All future structures built in Huron County will likely be exposed to high winds. Since the previousstatement is assumed to be uniform countywide, the location of development does not increase orreduce the risk necessarily. Huron County and its jurisdictions need to adhere to building codes, andtherefore, new development can be built to current standards to account for heavy snow loads.Additionally, as homes go up in more remote parts of the county, accessing those rural residents maybecome impossible should sheltering or emergency services be needed in an extreme event.

CHAPTER 2HAZARD IDENTIFICATION AND RISK ASSESSMENT(HIRA)
HURON COUNTY MULTI JURISDICTIONAL HAZARD MITIGATION PLAN 2011 2016 Page 70
MULTI JURISDICTIONAL DIFFERENCES
Due to the nature of high winds, all jurisdictions within Huron County are expected to be impactedequally.
HIGH WINDS HIRA SUMMARY
High winds are often a byproduct of some other weather phenomena. They can be a by product ofthunderstorms, winter storms, or extratropical storms, and can occur year round. As such, high windsare often accompanied by hazards from these other hazards. These events can disrupt transportation,power transmission and even communications. Mitigation measures may include enhanced buildingcodes, planned deployment of resources, underground utility lines for critical facilities, and increasedtree trimming along utilities. Weather data is limited by the observations reported; many events arenever reported or recorded with the National Weather Service or other archiving agencies.

CHAPTER 2HAZARD IDENTIFICATION AND RISK ASSESSMENT(HIRA)
HURON COUNTY MULTI JURISDICTIONAL HAZARD MITIGATION PLAN 2011 2016 Page 71
DROUGHT _ ____
NATURAL HAZARDS PROBABILITY IMPACT SPATIALEXTENT
WARNINGTIME
DURATION RFRATING
Drought 2 (.6) 1 (.3) 4 (.8) 1 (.1) 4 (.4) 2.2MODERATE RISK (2.0 – 2.9)
HAZARD IDENTIFICATION
Drought is a normal part of virtually all climates, including areas with high and low average rainfall. It iscaused by a deficiency of precipitation and can be aggravated by other factors such as hightemperatures, high winds, and low relative humidity.
Droughts can be grouped as meteorological, hydrologic, agricultural, and socioeconomic.Representative definitions commonly used to describe the types of drought are summarized below.
Meteorological drought is defined solely on the degrees of dryness, expressed as a departure of actualprecipitation from an expected average or normal amount based on monthly, seasonal, or annual timescales.
Hydrologic drought is related to the effects of precipitation shortfalls on streamflows and reservoir,lake, and groundwater levels.
Agricultural drought is defined principally in terms of soil moisture deficiencies relative to waterdemands of plant life, usually crops.
Socioeconomic drought associates the supply and demand of economic goods or services with elementsof meteorological, hydrologic, and agricultural drought. Socioeconomic drought occurs when thedemand for water exceeds the supply as a result of a weather related supply shortfall. The incidence ofthis type of drought can increase because of a change in the amount of rainfall, a change in societaldemands for water (or vulnerability to water shortages), or both.
The Standardized Precipitation Index (SPI) is a drought index based on the probability of an observedprecipitation deficit occurring over a given prior time period. The assessment periods considered rangefrom 1 to 36 months. The variable time scale allows the SPI to describe drought conditions importantfor a range of meteorological, agricultural, and hydrological applications. For example, soil moistureconditions respond to precipitation deficits occurring on a relatively short time scale, whereasgroundwater, streamflow, and reservoir storage respond to precipitation deficits arising over manymonths.
The Palmer Drought Severity Index (PDSI) was developed by Wayne Palmer in the 1960s and usestemperature and rainfall information in a formula to determine dryness. It has become the semi officialdrought index. The Palmer Index is most effective in determining long term drought—a matter of

CHAPTER 2HAZARD IDENTIFICATION AND RISK ASSESSMENT(HIRA)
HURON COUNTY MULTI JURISDICTIONAL HAZARD MITIGATION PLAN 2011 2016 Page 72
several months—and is not as good with short term forecasts (a matter of weeks). It uses a 0 as normal,and drought is shown in terms of minus numbers; for example, minus 2 is moderate drought, minus 3 issevere drought, and minus 4 is extreme drought.
Table 2 32: Drought Severity Classification
DROUGHTSEVERITY
RETURNPERIOD(YEARS)
DESCRIPTION OF POSSIBLE IMPACTS
DROUGHT MONITORING INDICESStandardizedPrecipitationIndex (SPI)
NDMC*DroughtCategory
PalmerDroughtIndex
MinorDrought 3 to 4
Going into drought; short term drynessslowing growth of crops or pastures; fire riskabove average. Coming out of drought; somelingering water deficits; pastures or crops notfully recovered.
0.5 to 0.7 D0 1.0 to 1.9
ModerateDrought 5 to 9
Some damage to crops or pastures; fire riskhigh; streams, reservoirs, or wells low, somewater shortages developing or imminent,voluntary water use restrictions requested.
0.8 to 1.2 D1 2.0 to 2.9
SevereDrought 10 to 17
Crop or pasture losses likely; fire risk veryhigh; water shortages common; waterrestrictions imposed
1.3 to 1.5 D2 3.0 to 3.9
ExtremeDrought 18 to 43
Major crop and pasture losses; extreme firedanger; widespread water shortages orrestrictions
1.6 to 1.9 D3 4.0 to 4.9
ExceptionalDrought 44 +
Exceptional and widespread crop and pasturelosses; exceptional fire risk; shortages ofwater in reservoirs, streams, and wellscreating water emergencies
Less than 2 D4 5.0 or less
Source: National Drought Mitigation Center
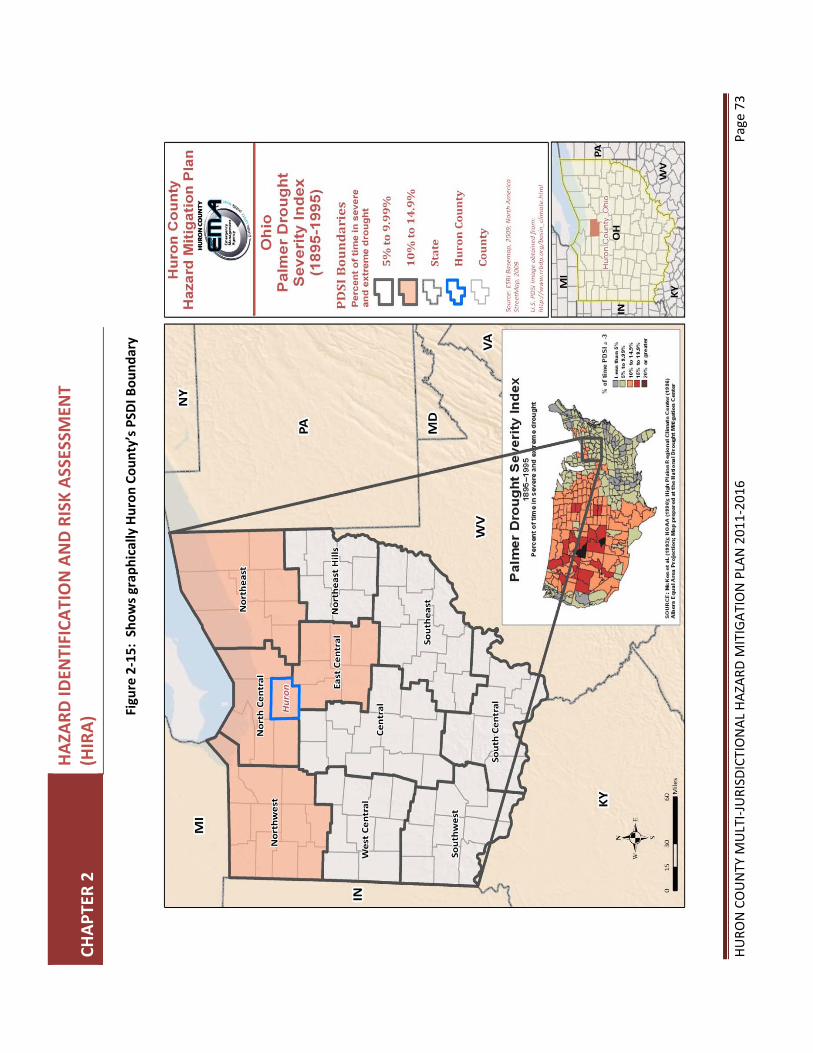
CHAP
TER2
HAZA
RDIDEN
TIFICA
TIONAN
DRISK
ASSESSMEN
T(HIRA)
HURO
NCO
UNTY
MULTIJURISD
ICTIONAL
HAZA
RDMITIGAT
IONPLAN
2011
2016
Page
73
Figure
215
:Show
sgraph
icallyHu
ronCo
unty’sPSDI
Boun
dary

CHAPTER 2HAZARD IDENTIFICATION AND RISK ASSESSMENT(HIRA)
HURON COUNTY MULTI JURISDICTIONAL HAZARD MITIGATION PLAN 2011 2016 Page 74
HAZARD PROFILE
There is no commonly accepted approach for assessing risk associated with droughts given the varyingtypes and indices. Drought risk is based on a combination of the frequency, severity, and spatial extent(the physical nature of drought) and the degree to which a population or activity is vulnerable to theeffects of drought. The degree of Huron County’s vulnerability to drought depends on theenvironmental and social characteristics of the region and is measured by its ability to anticipate, copewith, resist, and recover from drought.
Because drought is usually considered a regional hazard, it is not enhanced or analyzed by County levelmapping. All jurisdictions are assumed to have the same risk level within Huron County. Mapping of thecurrent drought status is published by the National Integrated Drought Information System (NIDIS): U.S.Drought Portal which can be found online at: www.drought.gov
According to the National Climatic Data Center, drought has no significant property damage loss since1995, however, significant damages to agricultural has occurred. The most notable event occurred in1999 when extremely dry conditions pushed into the month of September. These same dry conditionshad persisted for most of the month resulting in significant crop losses throughout the northern portionof Ohio. Summarized in the table below are drought events that have occurred since 1995 in HuronCounty.
Table 2 33: Drought Events in Huron County since 1995# LOCATION DATE TYPE DEATH INJURY AGRICULTURAL DAMAGE
1 Northern Ohio 9/1/1995 Drought N/A 0 $0
2 Northern Ohio 8/1/1996 Drought N/A 0 $0
3 North Central Ohio 6/1/1999 Drought N/A 0 $0
4 Northern Ohio 7/1/1999 Drought N/A 0 $0
5 Northern Ohio 8/1/1999 Drought N/A 0 $0
6 Northern Ohio 9/1/1999 Drought N/A 0 $200,000,000
TOTAL 0 0 $200,000,000
Due to the nature of drought, it is extremely difficult to predict, but through identifying variousindicators of drought, and tracking these indicators, it provides us with a crucial means of monitoringdrought. Understanding the historical frequency, duration, and spatial extent of drought assists indetermining the likelihood and potential severity of future droughts. The characteristics of pastdroughts provide benchmarks for projecting similar conditions into the future. The probability of theHuron County and its municipality experiencing a drought event can be difficult to quantify, but based

CHAPTER 2HAZARD IDENTIFICATION AND RISK ASSESSMENT(HIRA)
HURON COUNTY MULTI JURISDICTIONAL HAZARD MITIGATION PLAN 2011 2016 Page 75
on historical record of 6 droughts since 1995, it can reasonably be assumed that this type of event hasoccurred once every 2.67 years from 1995 through 2011.
[(Current Year) 2011] subtracted by [(Historical Year) 1995] = 16 Years on Record
[(Years on Record) 16] divided by [(Number of Historical Events) 6] = 2.67
Furthermore, the historic frequency calculates that there is a 38% chance of this type of event occurringeach year.
The National Oceanic and Atmospheric Administration Paleoclimatology Program studies drought byanalyzing records from tree rings, lake and dune sediments, archaeological remains, historicaldocuments, and other environmental indicators to obtain a broader picture of the frequency ofdroughts in the United States. According to their research, “…paleoclimatic data suggest that droughtsas severe as the 1950’s drought have occurred in central North America several times a century over thepast 300 400 years, and thus we should expect (and plan for) similar droughts in the future. Thepaleoclimatic record also indicates that droughts of a much greater duration than any in the 20thcentury have occurred in parts of North America as recently as 500 years ago.” Based on this research,the 1950’s drought situation could be expected approximately once every 50 years or a 20% chanceevery ten years. An extreme drought, worse than the 1930’s “Dust Bowl,” has an approximateprobability of occurring once every 500 years or a 2% chance of occurring each decade. (NOAA, 2003). A500 year drought with a magnitude similar to that of the 1930’s that destroys the agricultural economyand leads to wildfires is an example of a high magnitude event.
Impacts to vegetation and wildlife can include death from dehydration and spread of invasive species ordisease because of stressed conditions. However, drought is a natural part of the environment in Ohioand native species are likely to be adapted to surviving periodic drought conditions. It is unlikely thatdrought would jeopardize the existence of rare species or vegetative communities.
Environmental impacts are more likely at the interface of the human and natural world. The loss ofcrops or livestock due to drought can have far reaching economic effects. Wind and water erosion canalter the visual landscape and dust can damage property. Water based recreational resources areaffected by drought conditions. Indirect impacts from drought arise from wildfire, which may haveadditional effects on the landscape and sensitive resources such as historic or archeological sites.
INVENTORY ASSETS EXPOSED AND POTENTIAL LOSSES DUE TO DROUGHT
Drought typically does not have a direct impact on critical facilities or structures. However, possiblelosses/impacts to critical facilities include the loss of critical function due to low water supplies. Severedroughts can negatively affect drinking water supplies. Should a public water system be affected, thelosses could total into the millions of dollars if outside water is shipped in. Private springs/wells couldalso dry up. Possible losses to infrastructure include the loss of potable water.

CHAPTER 2HAZARD IDENTIFICATION AND RISK ASSESSMENT(HIRA)
HURON COUNTY MULTI JURISDICTIONAL HAZARD MITIGATION PLAN 2011 2016 Page 76
But a drought evolves slowly over time and the population typically has ample time to prepare for itseffects. Should a drought affect the water available for public water systems or individual wells, theavailability of clean drinking water could be compromised. This situation would require emergencyactions and could possibly overwhelm the local government and financial resources.
LAND USE & DEVELOPMENT TRENDS
Society’s vulnerability to drought is affected by (among other things) population growth and shifts,urbanization, demographic characteristics, technology, water use trends, government policy, socialbehavior, and environmental awareness. These factors are continually changing, and society’svulnerability to drought may rise or fall in response to these changes. For example, increasing andshifting populations put increasing pressure on water and other natural resources—more people needmore water.
Future development’s greatest impact on the drought hazard would possibly be to ground waterresources. New water and sewer systems or significant well and septic sites could use up more of thewater available, particularly during periods of drought. Public water systems are monitored, butindividual wells and septic systems are not as strictly regulated. Therefore, future development couldhave an impact on the drought vulnerabilities.
MULTI JURISDICTIONAL DIFFERENCES
Due to the nature of drought, all jurisdictions within Huron County are expected to be impacted equallydue to drought conditions. Land use codes do require that firebreaks be utilized in areas susceptible towildfire.
DROUGHT HIRA SUMMARY
As stated prior, due to the nature of drought, it is extremely difficult to predict, but through identifyingvarious indicators of drought, and tracking these indicators, it provides us with a crucial means ofmonitoring drought. Several mitigation measures will be reviewed and considered by Huron County forincorporation into future Plan updates.
Assessment programsWater supply augmentation and development of new suppliesPublic awareness and education programsTechnical assistance on water conservationReduction and water conservation programsEmergency response programsDrought contingency plans

CHAPTER 2HAZARD IDENTIFICATION AND RISK ASSESSMENT(HIRA)
HURON COUNTY MULTI JURISDICTIONAL HAZARD MITIGATION PLAN 2011 2016 Page 77
Some of these actions can have long term impacts, such as contingency plan development, and thedevelopment of water conservation and public awareness programs. As Huron County gains moreexperience assessing and responding to drought, future actions will undoubtedly become more timely,effective, and less reactive.

CHAPTER 2HAZARD IDENTIFICATION AND RISK ASSESSMENT(HIRA)
HURON COUNTY MULTI JURISDICTIONAL HAZARD MITIGATION PLAN 2011 2016 Page 78
EARTHQUAKE ______________________________________________
NATURAL HAZARDS PROBABILITY IMPACT SPATIALEXTENT
WARNINGTIME
DURATION RFRATING
Earthquake 1 (.3) 1 (.3) 2 (.4) 4 (.4) 1 (.1) 1.5LOW RISK (0.1 – 1.9)
HAZARD IDENTIFICATION
Although earthquakes have caused much less economic loss anually in the United States than otherhazards, such as floods, they have the potential for causing great and sudden loss. Within 1 to 2minutes, an earthquake cand devastate part of an area through ground shaking, surface fault ruptures,and ground failures.
An earthquake is a sudden motion or trembling caused by an abrupt release of accumulated strain onthe tectonic plates that comprise the Earth’s crust. These tectonic plates move slowly and continuouslyover the interior of the Earth, meeting in some areas, and separating in others. As the plates movetogether, they bump, slide, catch and hold. Eventually, faults along or near plate boundaries slipabruptly when the stress exceeds the limit of the rock, and an earthquake occurs. The figure on the nextpage shows where earthquakes have occurred in relation to Huron County.

CHAP
TER2
HAZA
RDIDEN
TIFICA
TIONAN
DRISK
ASSESSMEN
T(HIRA)
HURO
NCO
UNTY
MULTIJURISD
ICTIONAL
HAZA
RDMITIGAT
IONPLAN
2011
2016
Page
79
Figure
216
:Earthq
uake
Historyfrom
1776
2011
forH
uron
Coun
ty

CHAPTER 2HAZARD IDENTIFICATION AND RISK ASSESSMENT(HIRA)
HURON COUNTY MULTI JURISDICTIONAL HAZARD MITIGATION PLAN 2011 2016 Page 80
Earthquake Mechanics
Regardless of the source of the earthquake, the associated energy travels in waves radiating outwardfrom the point of release. When these waves travel along the surface, the ground shakes and rolls,fractures form, and water waves may be generated. Earthquakes generally last a matter of seconds butthe waves may travel for long distances and cause damage well after the initial shaking at the point oforigin has subsided.
Breaks in the crust associated with seismic activity are known as “faults” and are classified as eitheractive or inactive. Faults may be expressed on the surface by sharp cliffs or scarps or may be buriedbelow surface deposits.
“Foreshocks,” minor releases of pressure or slippage, may occur months or minutes before the actualonset of the earthquake. “Aftershocks,” which range from minor to major, may occur for months afterthe main earthquake. In some cases, strong aftershocks may cause significant additional damage,especially if the initial earthquake impacted emergency management and response functions orweakened structures.
Factors Contributing to Damage
The damage associated with each earthquake is subject to four primary variables:
The nature of the seismic activity
The composition of the underlying geology and soils
The level and quality of development of the area struck by the earthquake
The time of day
Seismic Activity: The properties of earthquakes vary greatly from event to event. Some seismic activityis localized (a small point of energy release), while other activity is widespread (e.g., a major fault lettingloose all at once). Earthquakes can be very brief (only a few seconds) or last for a minute or more. Thedepth of release and type of seismic waves generated also play roles in the nature and location ofdamage; shallow quakes will hit the area close to the epicenter harder, but tend to be felt across asmaller region than deep earthquakes.
Geology and Soils: The surface geology and soils of an area influence the propagation (conduction) ofseismic waves and how strongly the energy is felt. Generally, stable areas (e.g., solid bedrock)experience less destructive shaking than unstable areas (e.g., fill soils). The siting of a community oreven individual buildings plays a strong role in the nature and extent of damage from an event.
Development: A small earthquake in the center of a major city can have far greater consequences thana major event in a thinly populated place. The two major Idaho earthquakes, Hebgen Lake (1959) and

CHAPTER 2HAZARD IDENTIFICATION AND RISK ASSESSMENT(HIRA)
HURON COUNTY MULTI JURISDICTIONAL HAZARD MITIGATION PLAN 2011 2016 Page 81
Borah Peak (1983) were very strong, but occurred in isolated areas with small populations. Damage,compared to other earthquakes of similar magnitude in heavily populated areas, was relatively light.
Time of Day: The time of day of an event controls the distribution of the population of an affected area.On work days, the majority of the community will transition between work or school, home, and thecommute between the two. The relative seismic vulnerability of each location can strongly influence theloss of life and injury resulting from an event.
Types of Damage
While damage can occur by movement at the fault, most damage from earthquake events is the resultof shaking. Shaking also produces a number of phenomena that can generate additional damage:
Ground displacement
Landslides and avalanches
Liquefaction and subsidence
Seiches
Shaking: In minor events, objects fall from shelves and dishes are rattled. In major events, largestructures may be torn apart by the forces of the seismic waves. Structural damage is generally limitedto older structures that are poorly maintained, constructed, or designed in all but the largest quakes.Un reinforced masonry buildings and wood frame homes not anchored to their foundations are typicalvictims.
Loose or poorly secured objects also pose a significant hazard when they are loosened or dropped byshaking. These “non structural falling hazard” objects include bookcases, heavy wall hangings, andbuilding facades. Home water heaters pose a special risk due to their tendency to start fires when theytopple over and rupture gas lines. Crumbling chimneys may also be responsible for injuries and propertydamage.
Dam and bridge failures are significant risks during stronger earthquake events, and due to theconsequences of such failures, may result in considerable property damage and loss of life. In areas ofsevere seismic shaking hazard, Intensity VII or higher can be experienced even on solid bedrock. In theseareas, older buildings especially are at significant risk.
Ground Displacement: Often, the most dramatic evidence of an earthquake results from displacementof the ground along a fault line (Maps 3 10 and 3 11 below). The Borah Peak event created a surfacefault nearly 22 miles long and generated a scarp face up to nine feet in height in certain locations.Utility lines and roads may be disrupted but damage directly attributable to ground displacement is

CHAPTER 2HAZARD IDENTIFICATION AND RISK ASSESSMENT(HIRA)
HURON COUNTY MULTI JURISDICTIONAL HAZARD MITIGATION PLAN 2011 2016 Page 82
generally limited. In rare instances, structure located directly on the fault line may be destroyed by thedisplacement.
Landslides and Avalanches: Even small earthquake events can cause landslides. Rockfalls are commonas unstable material on steep slopes is shaken loose, but significant landslides or even debris flows canbe generated if conditions are ripe. Roads may be blocked by landslide activity, hampering response andrecovery operations. Avalanches are possible when the snowpack is sufficient.
Liquefaction and Subsidence: Soils may liquefy and/or subside when impacted by the seismic waves.Fill and previously saturated soils are especially at risk. The failure of the soils can lead to possiblywidespread structural damage. The oscillation and failure of the soils may result in increased water flowand/or failure of wells as the subsurface flows are disrupted and sometimes permanently altered.Increased flows may be dramatic, resulting in geyser like water spouts and/or flash floods. Similarly,septic systems may be damaged creating both inconvenience and health concerns.
Seiches: Seismic waves may rock an enclosed body of water (e.g., lake or reservoir), creating anoscillating wave referred to as a “seiche.” Although not a common cause of damage in past Idahoearthquakes, there is a potential for large, forceful waves similar to tsunami (“tidal waves”) to begenerated on the large lakes of the state. Such a wave would be a hazard to shoreline development andpose a significant risk on dam created reservoirs. A seiche could either overtop or damage a damleading to downstream flash flooding.
Location, Extent, and Magnitude
As indicated earlier, just as there are multiple sources of seismic activity in Ohio, the location of seismicactivity varies as well. Many earthquakes do occur along faults. Information about faults can beobtained from the Ohio Seismic Network at:http://www.dnr.state.oh.us/geosurvey/default/tabid/8144/Default.aspx.

CHAPTER 2HAZARD IDENTIFICATION AND RISK ASSESSMENT(HIRA)
HURON COUNTY MULTI JURISDICTIONAL HAZARD MITIGATION PLAN 2011 2016 Page 83
Figure 2 17: Location of Faults within the State of Ohio, USGS
The extent and magnitude of earthquakes are measured in two ways:
Magnitude (as measured by the Richter Scale) – measures energy released.
Intensity (as measured by the Modified Mercalli Intensity Scale) – measures physical effects.

CHAPTER 2HAZARD IDENTIFICATION AND RISK ASSESSMENT(HIRA)
HURON COUNTY MULTI JURISDICTIONAL HAZARD MITIGATION PLAN 2011 2016 Page 84
Magnitude is calculated by seismologists from seismograph readings and is most useful to scientistscomparing the power of earthquakes. Magnitude is often described using the Richter Scale. Anearthquake of Magnitude 2.5 or less is usually not felt. Dishes rattling and china shaking occur atMagnitude 3.0 and Magnitudes greater than 6.5 are devastating events when the earthquake strikes inor near a populated area.
The Modified Mercalli Intensity Scale is a subjective description of the physical effects of the shakingbased on observation at the event site. The damage from earthquake shaking is due to several factorslike distance from the epicenter and local geology and soils. On the Modified Mercalli Intensity Scale, avalue of I is the least intense motion and XII is the greatest ground shaking. Unlike magnitude, intensitycan vary from place to place and is evaluated from people's reactions to events and the visible damageto man made structures.
The following is a brief explanation of the Modified Mercalli Scale:
I. Not felt except by a very few under especially favorable conditions.II. Felt only by a few persons at rest, especially on upper floors of buildings.III. Felt quite noticeably by persons indoors, especially on upper floors of buildings. Many people do
not recognize it as an earthquake. Standing motor cars may rock slightly. Vibrations similar tothe passing of a truck. Duration estimated.
IV. Felt indoors by many, outdoors by few during the day. At night, some awakened. Dishes,windows, doors disturbed; walls make cracking sound. Sensation like heavy truck strikingbuilding. Standing motor cars rocked noticeably.
V. Felt by nearly everyone; many awakened. Some dishes, windows broken. Unstable objectsoverturned. Pendulum clocks may stop.
VI. Felt by all, many frightened. Some heavy furniture moved; a few instances of fallen plaster.Damage slight.
VII. Damage negligible in buildings of good design and construction; slight to moderate in well builtordinary structures; considerable damage in poorly built or badly designed structures; somechimneys broken.
VIII. Damage slight in specially designed structures; considerable damage in ordinary substantialbuildings with partial collapse. Damage great in poorly built structures. Fall of chimneys, factorystacks, columns, monuments, walls. Heavy furniture overturned.
IX. Damage considerable in specially designed structures; well designed frame structures thrownout of plumb. Damage great in substantial buildings, with partial collapse. Buildings shifted offfoundations.
X. Some well built wooden structures destroyed; most masonry and frame structures destroyedwith foundations. Rails bent.
XI. Few, if any (masonry) structures remain standing. Bridges destroyed. Rails bent greatly.XII. Damage total. Lines of sight and level are distorted. Objects thrown into the air.

CHAPTER 2HAZARD IDENTIFICATION AND RISK ASSESSMENT(HIRA)
HURON COUNTY MULTI JURISDICTIONAL HAZARD MITIGATION PLAN 2011 2016 Page 85
Figure 2 19: Correlation between Ground Acceleration and Intensity / Source: United States Geological Survey
Another way to measure intensity is through ground acceleration. This is expressed as either “peakground acceleration” (PGA) and “spectral acceleration” (SA) expressed relative to the acceleration ofgravity (g) and determined by seismographic instruments. While Mercalli and PGA intensities arearrived at differently, they correlate reasonably well.
Figure 2 18 below correlates peak acceleration and the Modified Mercalli Intensity Scale.
Additional information can be found from the USGS at:http://earthquake.usgs.gov/earthquakes/shakemap/background.php
Geologic evidence shows that movement on the faults in and around Idaho can cause earthquakes ofmagnitude 6.5 to 7.5, with potentially catastrophic effects.
Past Occurrence
Earthquakes in Ohio are common as shown previously on Figure 2 18. The map indicates that HuronCounty has been affected by earthquakes. Two previous events one on November 25, 1998 and anotheron July 26, 2001 registered on the Ohio Seismic Network and were felt in parts of Huron County.Additionally, it should be mentioned that in August 2011, an earthquake centered in Northern Virginiawas felt throughout the Midwest. The Huron County EMA reports that as a result of this 2011 quake, asalon located in downtown Norwalk reported shaking and the movement of a table across the floor.
EARTHQUAKE HIRA SUMMARY
Earthquakes give little to no warning. They are capable of having a large impact on an area. Theimpacts of an earthquake can be similar to that of a tornado. After effects from an earthquake caninclude impacted roadways, downed power and communication lines, and damages to structures(especially poorly built, or those already in disrepair). Earthquakes are not a seasonal hazard, and thuscan be experienced year round. This can present its own set of issues.