haze and el niño in indonesia - gofc...
TRANSCRIPT

Haze and El Niño in Indonesia
International Workshop on Land Use/Cover Changes and Air Pollution in Asia, Bogor, Indonesia, 2015.8.4-7
Hiroshi HayasakaFire Science DivisionNPO Hokkaido Institute of Hydro-climateSapporo, JAPAN
Thanks to NIES’ support.

Haze and El Niño in Indonesia
Haze caused by burning peat forests in Indonesia kills an average of110,000 people per year and up to 300,000 during el Niño events,while releasing hundreds of millions of tons of greenhouse gasesinto the atmosphere, warns a new report from Greenpeace.
In Riau’s case, there is a lot of carbon that could be lost into theatmosphere: by one estimate, its peat soils store nearly 60 billiontons of carbon, or 40 percent of the total stored across Indonesia’speatlands. That represents more than a year of current globalgreenhouse gas emissions.
28th May 2014 / Rhett A. Butler
To protect peatlands in Indonesia, it is important to undrstand sverepeat fire weather conditions.
http://news.mongabay.com/2014/05/indonesias-haze-from-forest-fires-kills-110000-people-per-year/

Recent Large Scale Wildland Firesin Kalimantan, Indonesia
2002 2004 2006 2009
Air Pollution in Palangkaraya
Repeated severe fires every two years
MRP+MRP+
MRP+

Dense Haze (Smoke) Near Tarunain Kalimantan, Indonesia
Sept.20, 2009
Dangerous condition in highway due to dense smoke (low visibility).
Basic Knowledge

2002
PM10, SO2, CO, O3, and NO2 in 2002
O3≒1,000g/m3
Photochemical smog

El Niño Southern Oscillation (ENSO)
• It is a quasi‐periodic climate pattern that occurs across the tropical Pacific Ocean almost every 6 years.(Range is 3‐8 years)
• “Oscillation” refers to the variations in the temperature of the tropical eastern Pacific Ocean (the phenomenon of warming and cooling are “El Niño” and “La Niña”) and in air pressure in the tropical Western Pacific.
• “El Niño” term is used because the effects of the warming are noticed usually around Christmas in South America (“El Niño” means “the little boy”, referring to Jesus Christ birth).
Reasons are still not clear.
SST (Sea Surface Temp.)
SOI (Southern Oscillation Index: Sea Level Pressure )
NINO.3.4

Global Impacts of El NiñoNormal
El Niño
Indonesia
Dry

1997
2002
20042006
2009
ー: SST Nino 3.4
△2001
1998
1998 East Kali.
2005 Dumai, Riau
X 2012△2003
X 1999
X 2011
ー: Hotspots in Kalimantan
Fire Occurrence and El Nino (SST Anomalies : Nino 3.4)
SS
T

Fire Occurrence and SOISOI (Southern Oscillation Index: Sea Level Pressure )
ー: Hotspots in Kalimantan1997
20022004
20062009
ー: SOI
2001
1998
1998 East Kali.
○2005 Dumai, Riau
ー: Hotspots in Kalimantan
X 2013 Dumai

Monsoon, ITCZ, Precipitation Pattern
Winter
SummerITCZ
ITCZ
Winter Fire Zone
Summer Fire Zone
MRP+
Dumai+
Palembang+
Sampit+
East Kali.West Kali.-N
West Kali.-S
MRP+:SD3.5
8mm
EquatorDry
SD1WD2 (S: Sumer fire, W: Winter fire, D: Dry season,1,2:Month)
ITCZ: The Inter-Tropical Convergence Zone

Winter Fire Areas in the Northern Hemisphere
Equator
SumatraKalimantan(Borneo)
MRP+
Dumai+, Riau
Palembang+ Sampit+
East Kali.West Kali.-N+Interior
West Kali.-SPontianak: WDsSD0.6 Samarinda: WDsSD2
MRP:8mm
P. Baru: SDs
Medan: WD1.5SDs
Winter Monsoon

Summer Fire Areas in the Southern Hemisphere
Equator
Sumatra
MRP+Sampit+
West Kali.-S
Sampit: SD2 MRP: SD3.5
8mm
Palembang+: SD3.5
Palembang+
Summer Monsoon

High Hotspot Areas in IndonesiaRecent Ten Years (2002-2011)
Result : Hotspot Distribution (1 x 1 Deg. Grid)
J/J Pro. Haya110917
Highest number of hotspots: 2,223/yr.Hotspot density:0.182 fires/(km2・yr.)Grid center: S -3, E 114
6 regions:Sumatra+, Kalimantan+Java+, Sumba+ & Timor+Sulawesi+, Papua+
MRP*

Hotspot Distribution and 5 Highest Hotspot Areas in Kalimantan
Result : Hotspot Distribution in Kalimantan (1 x 1 Deg. Grid)
H1: Highest Hotspot Density Area
5 regions:S. Kalimantan12West & East Kali.Central 5South 5
H2
Number of hotspots: 3,707 in 2009Highest number of hotspots: 5,382
in 2006
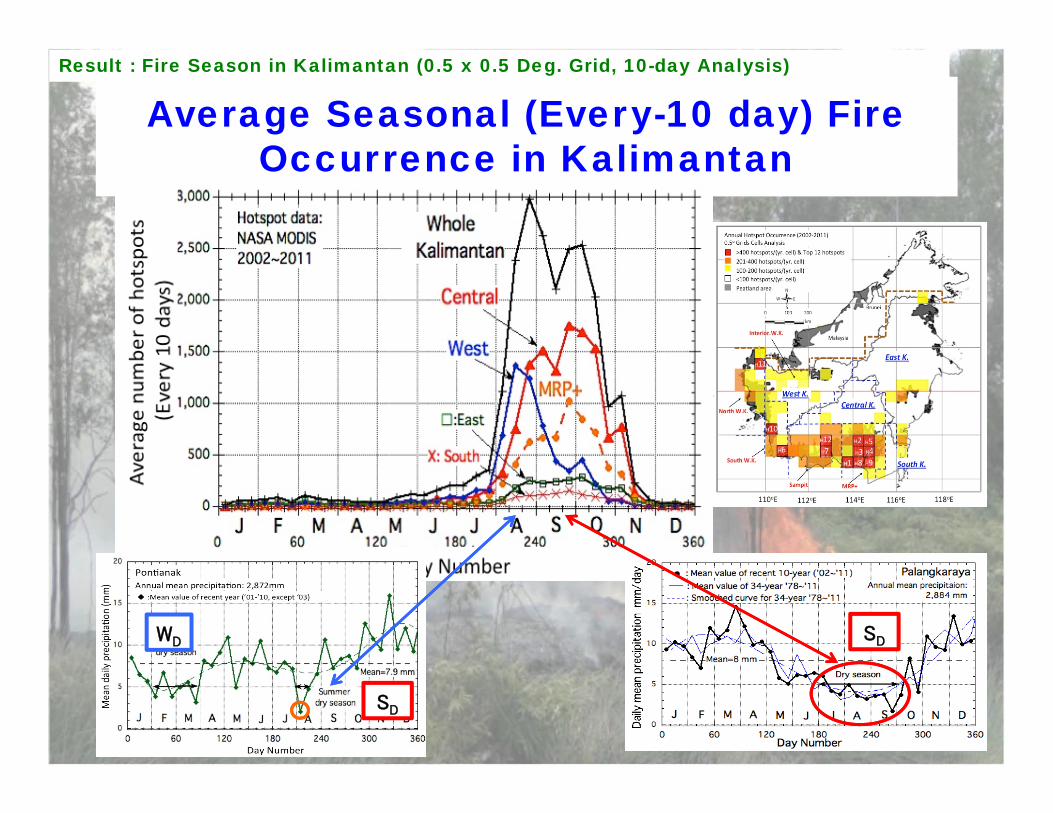
Average Seasonal (Every-10 day) Fire Occurrence in Kalimantan
Result : Fire Season in Kalimantan (0.5 x 0.5 Deg. Grid, 10-day Analysis)
SDWD
SD

Fire Starts from North W.K.
4oS
EQ
4oN
110oE 114oE 118oE
Samarinda
Tarakan
Banjarmasin
Pon anak
Palangkaraya
Sampit
Singkawang
2oN
2oS
112oE 116oE
Ketapang
(c)
4oS
EQ
4oN
110oE 114oE 118oE
Samarinda
Tarakan
Banjarmasin
Pon anak
Palangkaraya
Sampit
Singkawang
2oN
2oS
112oE 116oE
Ketapang
(b)
4oS
EQ
4oN
110oE 114oE 118oE
Samarinda
Tarakan
Banjarmasin
Pon anak
Palangkaraya
Sampit
Singkawang
2oN
2oS
112oE 116oE
Ketapang
(a)
Severe fire distribution in mid October (2006)
Kalimantan fire belt located in the southern coastal peatlands from West to Central Kalimantan
Result 8 : Fire Occurrence in Kalimantan (0.5 x 0.5 Deg. Grid, 10-day Analysis)
Pre-dry season (warning) fire distribution in late July (2009)
West Kalimantan fire distribution in early August (2009)

2009 Seasonal (Every-10 day) Fire Occurrence in Kalimantan

Effective Firebreak–Ditch & Clear-Cut Saved Dr. Aswin’s Camp
Fire line with a deep ditch Deep ditch was proven effective for fire.
Strong surface fire occurred due to Pyrophyte vegetation?
Purun, Hawuk, Karakai, Gakugan, Tsumi, Fern and etc.
2009 Severe Surface Fires
Deep and wide!
Basic Knowledge
MRP+

ConclusionsMODIS hotspot data of recent years showed recent most fire prone areas in Indonesia and their relation with weather conditions (dry seasons). 1. Two areas in both Kalimantan and Sumatra. 2. They were: MRP and Sampit area in Central Kalimantan, Dumai, Riau area in N. Sumatra, and Palembang area in S. Sumatra3. Worst place was MRP area due to dried peat made during its longer summer dry season (SD3). 4. SOI is useful index to forecast sever dry season under El Nino conditions. 5. Precaution or warning fires in West Kalimantan should be used smartly to reduce fires or haze in MRP area of Central Kalimantan.
Thanks to NIES’ support.