health care for children and youth in the united states: 2002 report on trends in access,...
TRANSCRIPT
AMBULATORY PEDIATRICS Volume 4, Number 2131Copyright q 2004 by Ambulatory Pediatric Association March–April 2004
Health Care for Children and Youth in the United States: 2002 Reporton Trends in Access, Utilization, Quality, and Expenditures
Lisa Simpson, MB, BCh, MPH; Marc W. Zodet, MS; Frances M. Chevarley, PhD;Pamela L. Owens, PhD; Denise Dougherty, PhD; Marie McCormick, MD,ScD
Objective.—To examine changes in insurance coverage, health care utilization, perceived quality of care, and expen-ditures for children and youth in the United States using data from 1987–2001.
Methods.—Three national health care databases serve as the sources of data for this report. The Medical ExpenditurePanel Survey (1996–2001) provides data on insurance coverage, utilization, expenditures, and perceived quality of care.The National Medical Expenditure Survey (1987) provides additional data on utilization and expenditures. The Nation-wide Inpatient Sample (1995–2000) from the Healthcare Cost and Utilization Project provides information on hospital-izations.
Results.—The percent of children uninsured for an entire year declined from 10.4% in 1996 to 7.7% in 1999. Mostchanges in children’s health care occurred between 1987 and the late 1990s. Overall utilization of hospital-based serviceshas declined significantly since 1987, especially for inpatient hospitalization. Several of the observed changes from 1987varied significantly by type of health insurance coverage, poverty status, and geographic region. Quality of care dataindicate some improvement between 2000 and 2001, which varies by insurance coverage. Overall, mean length of stayof hospitalizations did not change significantly from 1995 to 2000, but changes in the prevalence of hospitalizationsand the length of stay associated with age-specific diagnoses were evident during this time period.
Conclusions.—Health care for children and youth has changed significantly since 1987, with most of the changesoccurring between 1987 and 1996. Insurance coverage has improved, the site of care has shifted toward ambulatorysites, hospital utilization has declined, and expenditures on children as a proportion of total expenditures have decreased.Variation in these changes is evident by insurance status, poverty, and region.
KEY WORDS: health care utilization; hospitalization; insurance; quality; trends
Ambulatory Pediatrics 2004;4:131 153
Children and youth in the United States continue toexperience wide variation in the amount, quality,and costs of care they receive. While recent re-
ports have documented the steady decrease in the rate ofuninsurance among children and youth in the late 1990s,1
less is known about trends in the health care utilizationfor children. Numerous market-based strategies have beenimplemented in the last decade to shift care toward am-bulatory settings and away from hospital-based care, withsome documented success.2–4 In addition, advances inclinical practice, such as the introduction of the Hemophil-us influenzae B vaccine, have also supported a move to-ward ambulatory care. Finally, results are mixed in thegeneral population as to whether one factor, Health Main-tenance Organization (HMO) participation, is associatedwith a decrease in length of stay.5
From the Department of Pediatrics (Dr Simpson), University ofSouth Florida, St Petersburg, Fla; the Agency for Healthcare Re-search and Quality (Mr Zodet, Drs Chevarley, Owens, and Dough-erty), Rockville, Md; and the Department of Maternal and ChildHealth (Dr McCormick), Harvard School of Public Health, Boston,Mass.
Address correspondence to Lisa Simpson, MB, BCh, MPH, Pro-fessor of Pediatrics, ACH Guild Endowed Chair in Child HealthPolicy, University of South Florida, 601 4th St South, CRI 1008, StPetersburg, FL 33701 (e-mail: [email protected]).
Received for publication July 9, 2003; accepted September 27,2003.
As the country’s policy agenda focuses elsewhere, re-trenchments in the scope of public insurance programs forchildren are being discussed and implemented.6 However,numerous challenges remain in assuring access to high-quality care for children. Timely and in-depth informationis critical to ensuring that the policy debates at the Federaland state levels are based on the realities of health carefor children and adolescents in the United States. In ad-dition to providing the latest data available on health carefor children and youth, this report, the fourth in an annualseries, explicitly examines changes in key dimensions ofhealth care over time. The graphics and tables in thisprinted report are only a subset of the extensive data in-cluded in the electronic appendix pages of this journal.Given the important public policy changes since 1987,notably efforts to improve health insurance coverage oflow-income children through state insurance expansionsand the passage of the State Child Health Insurance Pro-gram (SCHIP), we have focused this report on results thatexamine patterns by health insurance, poverty level, andregion. Data illustrating changes from one point in timeto another for the other policy-relevant subgroups (eg,race/ethnicity, age, and health status) are included in theelectronic appendix material and not discussed in this re-port.
METHODSAs in previous years, the majority of the data for this
report are taken from two data sources maintained by the

AMBULATORY PEDIATRICS132 Simpson et al
Table 1. Summary of Data Sources, Time Periods, and Variables*
MeasureData
Source Time Period Components
Insurance MEPS 1987, 1996–99 (subpopulations) Full-year time reference: any private, public only, uninsured2001 (most recent data available) First half of year time reference: any private, public only, uninsured1996–99 (annual changes in insur-
ance coverage)Full-year time reference: private coverage entire year, public-only cov-
erage entire year, uninsured entire year
Utilization MEPSNMES
1996–991987
Office-based visits, hospital outpatient visits, hospital inpatient dis-charges, Emergency Department visits, dental visits, and prescriptionmedicines
HCUP 1995–00 Discharges, LOS, age groups, payer, hospital characteristics, diagnoses
Expenditures MEPS 1996–99 Office-based visits, hospital outpatient visits, hospital inpatient dis-charges, Emergency Department visits, dental visits, prescriptionmedicines, and source of payment
NMES 1987
Quality MEPS 2000–01 Second half of year time reference for CAHPS by first half of yeartime reference insurance coverage status (any private, public only,uninsured)
*MEPS indicates Medical Expenditure Panel Survey; NMES, National Medical Expenditure Survey; HCUP, Healthcare Cost and UtilizationProject; and LOS, length of stay.
Agency for Healthcare Research and Quality (AHRQ),Department of Health and Human Services (DHHS): theMedical Expenditure Panel Survey (MEPS) and theHealthcare Costs and Utilization Project (HCUP). Thesedata, their sampling strategies and components, and theanalytic methods used to produce the estimates have beenpreviously described in detail in earlier reports.7–9 In ad-dition, because significant changes in health care experi-ences are not typically detected over short time periods(ie, 1–4 years), data from the 1987 National Medical Ex-penditure Survey (NMES) were used to supplement theMEPS data and to establish a longer reference period (ie,9–12 years). This predecessor survey to the MEPS hasbeen documented in previous AHRQ and DHHS publi-cations.10,11 Insomuch as policy changes that affect publichealth insurance programs can have a more immediateimpact from one year to another (ie, expanding/restrictingpublic programs), we focus on insurance coverage from1996 to 2000; coverage estimates from 1987 are not in-cluded. Given the number of data sets used in this reportand the variation in the years available for each analysis,we have summarized these in Table 1.
Medical Expenditure Panel Survey
MEPS is an ongoing nationally representative family ofsurveys of medical care use and expenditures. MEPS pro-vides estimates of the health care utilization, expenditures,sources of payment, quality, and insurance coverage ofthe US civilian noninstitutionalized population from datacollected via multiple contacts over a 2½-year period. Thelatest data on utilization and expenditures presented in thisreport come from the 1999 MEPS Full Year ConsolidatedFile (HC-038), which includes data from the MEPSHousehold Component (MEPS-HC) and Medical ProviderComponent (MEPS-MPC) and are based on full-year re-sponses for children less than 18 years of age (n 5 6879).The most recent insurance coverage data presented in thisreport are based on part-year responses for children youn-
ger than 18 years (n 5 9973) and come from the 2001MEPS-HC Point-in-Time File (HC-034), which providesinformation on the nationally representative sample of thecivilian, noninstitutionalized population during the earlypart of 2001. Data on quality measures in this report arealso based on part-year responses for children youngerthan 18 years of age. They generally represent experiencesduring 2000 and 2001 and are based on responses to aParent Administered Questionnaire (PAQ) in 2000 (n 56577) and to the Child Supplement in 2001 (n 5 9000).Although the estimates we present are derived from pre-liminary files for both years, final data are available for2000 and will be available for 2001 in the respectiveMEPS-HC Full Year Population Characteristics files. Ad-ditional information on MEPS content and survey designare available, and the data can be obtained at http://www.meps.ahrq.gov.
For the purpose of looking at changes in utilization andexpenditures over time, data from the 1987 NMES arealso included in this report. Utilization and expenditureestimates were derived from the Household Survey com-ponent of NMES, which, like the MEPS-HC, is based ona national probability sample of the civilian noninstitu-tionalized population of the United States. Reported esti-mates are for the 1987 calendar year and are based onfull-year responses for children less than 18 years of age(n 5 9486).
Measures
Insurance. Estimates of insurance coverage are derivedfor two different reference periods. First, consistent withprevious efforts to report the most current data available,insurance coverage data are presented for approximatelythe first half of 2001; these data represent the most recentdata available during the production of this report. Sec-ond, for the purpose of observing changes in insurancecoverage over time (ie, 1996 to 2000) and for showinginsurance coverage in conjunction with the most recent
AMBULATORY PEDIATRICS Health Care for Children and Youth in the USA 133
utilization and expenditure data (1999), the full-yearMEPS-HC files were utilized.
Classification of insurance coverage status is defined intwo different ways for this article. First, as in previousreports, children are classified as having private insuranceif they were privately insured (including coverage throughthe Civilian Health and Medical Program of the Uni-formed Services (CHAMPUS/CHAMPVA/TRICARE) atany time during the reference period (ie, first half of theyear or entire year). Children with no private coverage butwho had any coverage through Medicaid, SCHIP (specif-ically probed beginning in 1999 MEPS), Medicare, or anyother type of government program providing coverage forboth hospital and medical care are classified as publiclyinsured. Children not covered by any comprehensive hos-pital and physician insurance program at any time duringthe reference period (ie, first half of the year or entireyear) are classified as uninsured. This classificationscheme is used when presenting the most recent insurancecoverage estimates (ie, 2001 Point-in-Time estimates) andwhen using insurance coverage as a population character-istic for subpopulation estimates of utilization, expendi-tures, and quality. Some children classified as having in-surance coverage (private or public) in 1999 or subsequentyears may have had utilization or expenditures during pe-riods in which they were uninsured or had a different typeof coverage. Second, for the purpose of examining insur-ance coverage over time (ie, 1999 to 2000), an alternativeclassification scheme is used to classify children as havingbeen insured through private coverage for the entire year,through public coverage for the entire year, or uninsuredfor the entire year. The estimated proportions of childrenwith mixed coverage (ie, some months uninsured and theother months with private/public coverage) for each re-spective year are not directly reported but are easily de-termined by subtracting the sum of the reported estimatesfrom 100.
Utilization. Utilization data include all office visits,hospital outpatient visits, inpatient hospital stays, emer-gency department (ED) visits, dental visits, and prescrip-tion medicines obtained for calendar years 1987 and 1996through 1999. In-person visits to both physician and non-physician providers are included. In MEPS, utilization andexpenditures for newborns are rolled into those categoriesfor the mother unless the newborn experienced a compli-cation resulting in an extended hospital stay (ie, beyondthe mother’s discharge). The NMES provides for two al-locations of inpatient birth events. The first considersstays for deliveries as two events: one for the mother andone for the infant. The second assigns the hospital utili-zation and expenditures for the infant to the mother unlessthe delivery was abnormal or unless the infant remainedin the hospital longer than the mother. Inpatient utilizationestimates were derived from NMES using the second al-location so as to be comparable to the MEPS data.
Expenditures. MEPS expenditures include all amountspaid for health care services from any source for all ser-vices provided for calendar years 1996 through 1999.Data for 1996 through 1999 were drawn from both the
household interviews in the MEPS-HC and from the sam-ple of health care providers included in the MEPS-MPC;data from the MEPS-MPC were used to edit household-reported data and impute for missing data. A more de-tailed description of the expenditure data, as well as theediting and imputation methodologies employed, is avail-able.12
Whereas MEPS uses actual payments as its expendituremeasure, the 1987 NMES uses charges as its expendituremeasure. Therefore, adjusted NMES expenditure mea-sures were used to improve the comparability to theMEPS. The adjustment method was based on an analysisof provider-reported payment data collected in NMES. In-formation on the development and implementation of thisadjustment method can be found in Zuvekas and Cohen.13
All further discussions involving expenditure estimatesfrom the NMES presented in this article refer to theseadjusted figures.
Inpatient hospital, outpatient department, and ED ex-penditures from NMES and MEPS include both hospitalfacility charges and doctors’ charges. Sources of paymentestimated from MEPS are grouped into private insurance(including payments made by any private health insuranceplan or CHAMPUS/CHAMPVA/TRICARE), Medicaid,out-of-pocket (including payments made by self or fami-ly), and other (includes Medicare and other insurance).Source of payment is not presented for 1987 becauseNMES categorizes the CHAMPUS/CHAMPVA sourceinto ‘‘Other Federal’’ sources, which also includes the In-dian Health Service and the Alaska Native Corporation,among others. It was not possible to reallocate theCHAMPUS/CHAMPVA payment dollars into the ‘‘Pri-vate’’ source category, as has become standard with theMEPS data in this series of reports. All expenditure esti-mates were adjusted to 1999 dollars using the ConsumerPrice Index.14
Quality of Care. Data on experiences with the medicalcare system were based on items added to the MEPS start-ing in 2000. These items were based on a subset of ques-tions from the health plan version of CAHPS, an AHRQ-sponsored family of survey instruments designed to mea-sure quality of care from the consumer’s perspective.15
Since 2000, parents have been asked in MEPS to reporton the following two dimensions of care: the extent ofproblems experienced in accessing care for their children(data in the top portion of Table A-10); as well as theirexperiences with the actual care provided (data in the bot-tom portion of Table A-10). Parents’ reports on the firstdimension were based on questions about the extent ofthe problem in receiving care for their children that theparent or doctor believed necessary, and the extent of theproblem in obtaining a referral to a specialist. Only par-ents of children who had doctor’s office or clinic visits inthe last 12 months were asked about care that the parentand/or doctor believed necessary; only parents of childrenwho the parents or a doctor thought needed to see a spe-cialist in the last 12 months were asked about obtaininga referral to a specialist. Parents’ reports on the seconddimension, experiences with the actual care, were based

AMBULATORY PEDIATRICS134 Simpson et al
on three items (data in the bottom of Table A-10) regard-ing the quality of care provided to their children duringthe past 12 months: how often providers listened carefullyto them, explained things clearly to them, and showedrespect for what they said. Only parents of children whomade one or more visits to a physician’s office or clinicin the last 12 months were asked to respond to these threeitems.
In 2000, these items were contained in the MEPS PAQ,and starting in 2001, they are contained in the ChildHealth and Preventive Care section of MEPS. There area number of differences in the administration of the PAQin 2000 and the Child Supplement in 2001. For instance,in 2000, parents were asked to complete a PAQ for eachof their children, whereas in 2001, an interviewer admin-istered the MEPS interview, including the Child Supple-ment, to a knowledgeable adult who was reporting forhimself and for other family members, including childrenyounger than 18 years of age. As a result, a larger per-centage of parents reported the information in 2000, whenthe questions were in the PAQ, than in 2001, when thequestions were in the MEPS core.
Consistent with efforts to report the most current dataavailable for examining variation in selected CAHPSmeasures by insurance coverage, insurance coverage dataare presented for approximately the first half of 2000 and2001, the most recent data available during the productionof the report (see Insurance section for more details).
Analysis
MEPS estimates of entire-year insurance coverage for1996 through 2000 were compared to evaluate changes inchildren’s health care coverage. In addition, estimates ofutilization and expenditures from the 1987 NMES, as wellas MEPS estimates from previous years’ reports (1996–98 data) and the most recent MEPS estimates (1999), werecompared to evaluate changes in these measures overtime. All MEPS and NMES estimates for all years andreference periods (first half of the year, full year) havebeen weighted to be nationally representative, and thestandard errors have been estimated, accounting for thecomplex design of the respective surveys, using the SU-DAAN software package (www.rti.org).16 In addition tothe survey point estimates, 95% confidence intervals forthe estimates are shown in the tables. These intervals re-flect the statistical precision of the corresponding estimate,with especially wide intervals indicating a large degree ofsampling error associated with the estimate. All differenc-es discussed in the text are statistically significant at the.05 level or better. No adjustments (eg, Bonferroni, Ben-jamini-Hochberg, etc) are made to compensate for thelarge number of comparisons presented in the report, be-cause the primary purpose of the report is to provide de-scriptive statistical estimates and to motivate further hy-potheses-driven research.
Formal tests for linear trends were not performed be-cause most observed differences in the measures occurredbetween 1987 and the late 1990s and were relatively sta-ble during the 4-year span in the 1990s. Also, there were
no data between 1987 and 1996 to examine the trend be-havior in our measures during this time.
Healthcare Cost and Utilization Project
In addition to data from MEPS, this study uses datafrom HCUP, an AHRQ-sponsored Federal-State-Industrypartnership established in 1988. HCUP databases bringtogether data collection efforts of state data organizations,hospital associations, private data organizations, and theFederal government to create a national information re-source of discharge-level administrative health care data(see ‘‘Acknowledgments’’). HCUP administrative dataprovide longitudinal estimates of all-payer state-, regional-, and national-level discharge information found in a typ-ical hospital discharge or billing record. Hospitals thatprovided discharge records were limited to those definedas community hospitals by the American Hospital Asso-ciation and included all non-Federal, short-term, general,and specialty hospitals, such as pediatric and oncologyhospitals, but excluded long-term care and psychiatrichospitals. In addition, prior to 1998, short-term rehabili-tation hospitals were included.
The 1995–2000 Nationwide Inpatient Sample (NIS)was used to examine trends in children’s hospitalizations.The discharge or hospital stay is the unit of analysis. Al-though the sampling and weighting strategy changed in1998,17 the NIS is designed to approximate a 20% strati-fied probability sample of US community hospitals, re-gardless of the year. The number of participating states inthe NIS grew from 19 states in 1995 to 28 states in 2000(The 28 states in the 2000 NIS were Arizona, California,Colorado, Connecticut, Florida, Georgia, Hawaii, Illinois,Iowa, Kansas, Kentucky, Maine, Maryland, Massachu-setts, Missouri, New Jersey, North Carolina, New York,Oregon, Pennsylvania, South Carolina, Tennessee, Texas,Utah, Virginia, Washington, West Virginia, and Wiscon-sin.) In 2000, the NIS sampling frame comprised morethan 80% of all US hospital discharges. This NIS providesdischarge estimates from approximately 1000 hospitalsand 7 million hospital stays each year. When using hos-pital discharge weights to calculate national estimates thatare representative of all hospital inpatient stays in theUnited States, the total number of hospital stays in theUnited States is 36.4 million, of which approximately 6million are for children under the age of 18 years. Becauseof the large sample size, the NIS is uniquely suited tostudying detailed information about children’s hospitaliza-tions throughout the United States, including length ofstay (LOS) and reasons for hospitalization. Informationon HCUP databases is provided on the AHRQ Web site(www.ahrq.gov).
Measures
Trend data on hospitalizations focused on LOS, reasonfor admission, and expected payer. The LOS was calcu-lated by subtracting the admission date from the dischargedate. In addition, reason for admission, based on principaldiagnosis, was examined. Diagnoses were grouped ac-cording to the body system or major condition using the

AMBULATORY PEDIATRICS Health Care for Children and Youth in the USA 135
Figure 1. Health insurance for children 17 years of age and youn-ger, 1996–00. A) Percent of children by all-year insurance status;B) Number of children by all-year insurance status. Source: 1996–2000 Medical Expenditure Panel Survey (MEPS). Agency forHealthcare Research and Quality.
Clinical Classification Software (CCS),18 a clinical grou-per that categorizes the International Classification of Dis-eases (ICD-9-CM) codes19 into a limited number of mu-tually exclusive categories. Expected payer was definedhierarchically. If the primary or secondary payer was aprivate (commercial) insurer, the payer was designated as‘‘private.’’ If neither payer was private, but Medicaid ap-peared on the record, the payer was designated as ‘‘Med-icaid.’’ All other types of insurance (eg, Medicare,CHAMPUS/TRICARE) were designated as ‘‘other.’’ Rec-ords with no third-party coverage of any kind were des-ignated as ‘‘uninsured.’’ Since hospital discharge abstractdata are generally compiled for billing purposes and theinternal code for SCHIP is dependent on the structure ofthe state program (ie, some programs are part of Medicaid,some programs are state-run non-Medicaid, and others aremanaged by private insurers), it was difficult to determinehow these discharges are categorized in the database (ie,Medicaid, other, or private insurance).
Analysis
Analyses for changes in inpatient stays between 1995and 2000 were conducted. Population ratios (number ofdischarges per number of children in the population) wereused to examine changes in the rate of hospitalizations byage, expected payer, and region. Age-specific, payer-spe-cific, and region-specific population estimates for 1995–2000 were obtained from the US Bureau of the Census(http://eire.census.gov/popest). In addition, analyses fo-cused on the mean LOS by age, expected payer, and re-gion; proportion of age-specific principal diagnoses; andmean LOS for selected age-specific principal diagnoses inchildren and youth.
All regional and national estimates were weighted byhospital-specific discharge weights to be nationally rep-resentative, and standard errors for all estimates were cal-culated using SUDAAN to account for the complex sam-pling design.16 In addition to point estimates, 95% confi-dence intervals are shown in the tables. All differencesdiscussed in the text are statistically significant at the .05level or better. Formal trend analyses were not completed,because sample sizes within age-specific conditions weretoo small to provide reliable linear trend test results, oncethe sampling frame of the NIS was taken into account.
Electronic Appendix Material
In order to provide a continuous time series of descrip-tive statistics, updated tables for the latest year availableare presented in the electronic appendices. MEPS datapresenting the details of changes over time and the mostrecent year available are shown in Appendix A. HCUPdata presenting trends and the most recent year availableare shown in Appendix B.
RESULTS
Use and Expenditures for Health Care Services
Insurance Coverage
The percent of children uninsured for an entire yeardeclined from 10.4% in 1996 to 7.7% in 1999 (Figure
1A). This translates into 7.0 million and 5.3 million un-insured children in 1996 and 1999, respectively (Figure1B). Most of the decline in full-year uninsurance was at-tributable to an observed 2.4 percentage point increase inthe proportion of children covered by private insurancefor an entire year, with the remainder of the differenceattributable to an increase in the percent of children withmixed coverage for the year (eg, some months uninsuredand the other months with private/public coverage) (datanot shown). The observed increase in private coveragewas not statistically significant. The percentages of chil-dren with private coverage and with public-only coveragefor an entire year remained relatively stable from 1996 to1999.
Health Care Use
Significant changes in utilization were observed be-tween 1987 and 1999 for a subset of health care services(Table 2). In addition, differing patterns emerged for somesubpopulations. While additional subpopulation data areprovided in the appendix tables (Appendix Tables A-1through A-6), details are provided here focusing on ratesby type of insurance, poverty level, and geographic re-gion. Overall, the proportion of children with at least oneoffice-based health care visit in a given year remainedunchanged from 1987 to 1999 (about 70%). However, sta-tistically significant changes were observed for a few sub-populations (Table A-1). For example, the proportion ofuninsured children with at least one office-based visit wassignificantly smaller in 1999 (43.0%) compared to both1987 (52.3%) and 1997 (54.7%) (Figure 2). Note, the

AMBULATORY PEDIATRICS136 Simpson et al
Tab
le2.
Hea
lthC
are
Use
for
Chi
ldre
n17
Yea
rsof
Age
and
You
nger
byY
ear
and
Typ
eof
Serv
ice*
Yea
r
Offi
ce-B
ased
Perc
ent
With
Any
Vis
its95
%C
I
Hos
pita
lO
utpa
tient
Perc
ent
With
Any
Vis
its95
%C
I
Hos
pita
lIn
patie
nt
Perc
ent
With
Any
Dis
char
ges
95%
CI
Em
erge
ncy
Dep
artm
ent
Perc
ent
With
Any
Vis
its95
%C
I
Den
tal
Perc
ent
With
Any
Vis
its95
%C
I
Pres
crip
tion
Med
icin
e
Perc
ent
With
Any
Scri
pts
95%
CI
1987
1996
1997
1998
1999
70.2
71.5
69.9
68.9
70.1
(68.
7,71
.7)
(70.
0,73
.1)
(68.
5,71
.4)
(67.
3,70
.5)
(68.
3,71
.9)
11.8 7.3
6.8
6.5
6.1
(10.
5,13
.0)
(6.3
,8.
2)(6
.0,
7.5)
(5.6
,7.
3)(5
.4,
6.9)
4.7
2.9
2.7
2.9
2.6
(4.1
,5.
3)(2
.4,
3.5)
(2.3
,3.
2)(2
.5,
3.4)
(2.1
,3.
1)
17.1
12.9
11.9
11.8
11.1
(16.
0,18
.2)
(11.
9,14
.0)
(11.
1,12
.8)
(10.
9,12
.8)
(10.
3,12
.0)
40.1
42.5
41.3
42.1
42.1
(38.
3,41
.9)
(40.
5,44
.5)
(39.
5,43
.2)
(40.
1,44
.1)
(40.
2,44
.1)
50.9
55.6
52.5
50.5
50.3
(49.
3,52
.5)
(54.
1,57
.1)
(51.
1,54
.0)
(48.
9,52
.1)
(48.
5,52
.0)
*Sou
rce:
1987
Nat
iona
lM
edic
alE
xpen
ditu
reSu
rvey
(NM
ES)
;19
96–1
999
Med
ical
Exp
endi
ture
Pane
lSu
rvey
(ME
PS).
Age
ncy
for
Hea
lthca
reR
esea
rch
and
Qua
lity.
CI
indi
cate
sco
nfide
nce
inte
rval
. rates observed for 1987 and 1997 were not significantlydifferent from one another.
Overall, use of hospital-based outpatient services de-creased significantly between 1987 and 1999, with thepercent of children with at least one hospital outpatientvisit dropping significantly in the late 1990s compared to1987 (Table 2). Only 6.1% of children had at least onehospital outpatient visit in 1999, compared to 11.8% ofchildren in 1987, a 48% decrease. Throughout the late1990s, rates are observed to have continued a generaldownward trend, but differences between these annual es-timates were not significant. The drop-off from 1987 tothe late 1990s was significant for almost every subpopu-lation examined but was especially marked for publiclyinsured children (Figure 3), children 0–4 years of age,non-Hispanic other children, and children in the West (Ta-ble A-2).
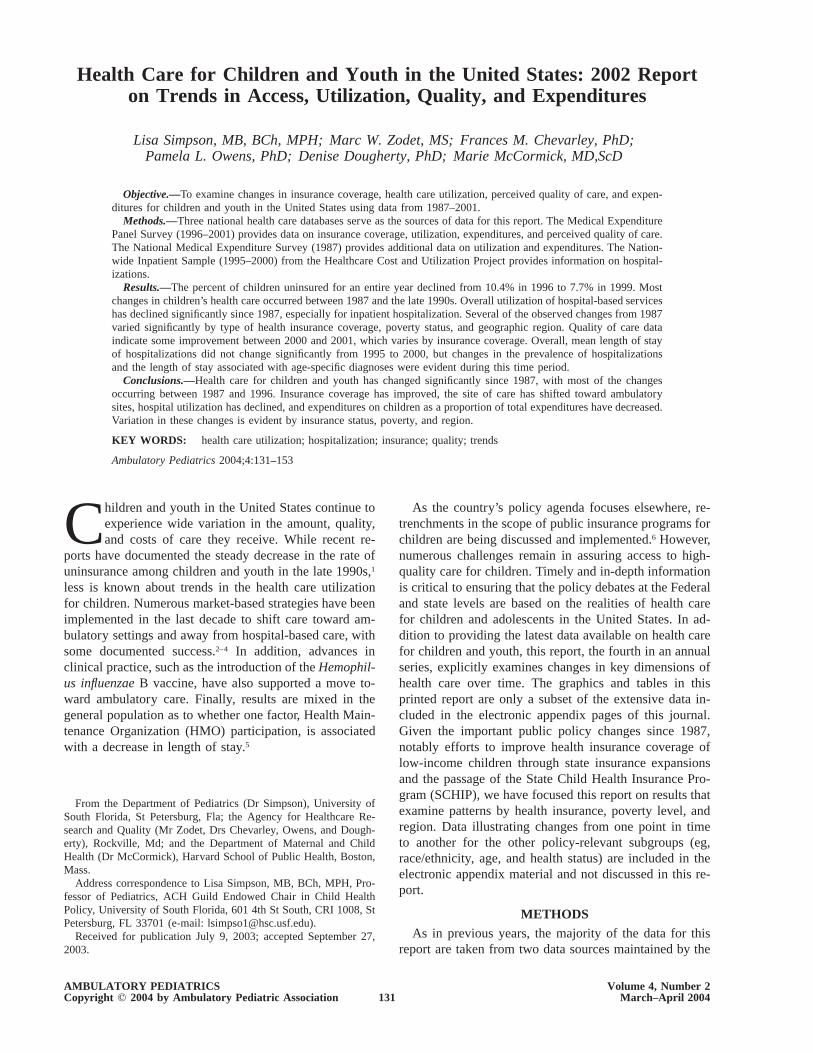
Compared to 1987, the estimated proportion of childrenwith at least one inpatient stay was lower for each yearfrom 1996 through 1999 (Table 2). Overall, the percentof children with at least one hospital inpatient stay de-creased from 4.7% in 1987 to 2.6% in 1999, a decreaseof 45%. This drop-off was not consistent across all cate-gories of children (Figure 4). Significant reductions in theproportion of children with at least one inpatient stay wereobserved for privately insured children (from 4.6% to2.3%, a 50% decline), children living in families withfamily incomes $200% of poverty level (from 4.5% to2.0%, a 56% decline), and children in the Midwest (from6.0% to 1.8%, a 70% decline). The proportion of childrenwith a hospital inpatient discharge in the Midwest in 1987went from being somewhat higher than the values for allother regions to being somewhat lower than the values forall other regions in 1999. From 1996 to 1999, the percentof children with at least one inpatient discharge remainedstable.
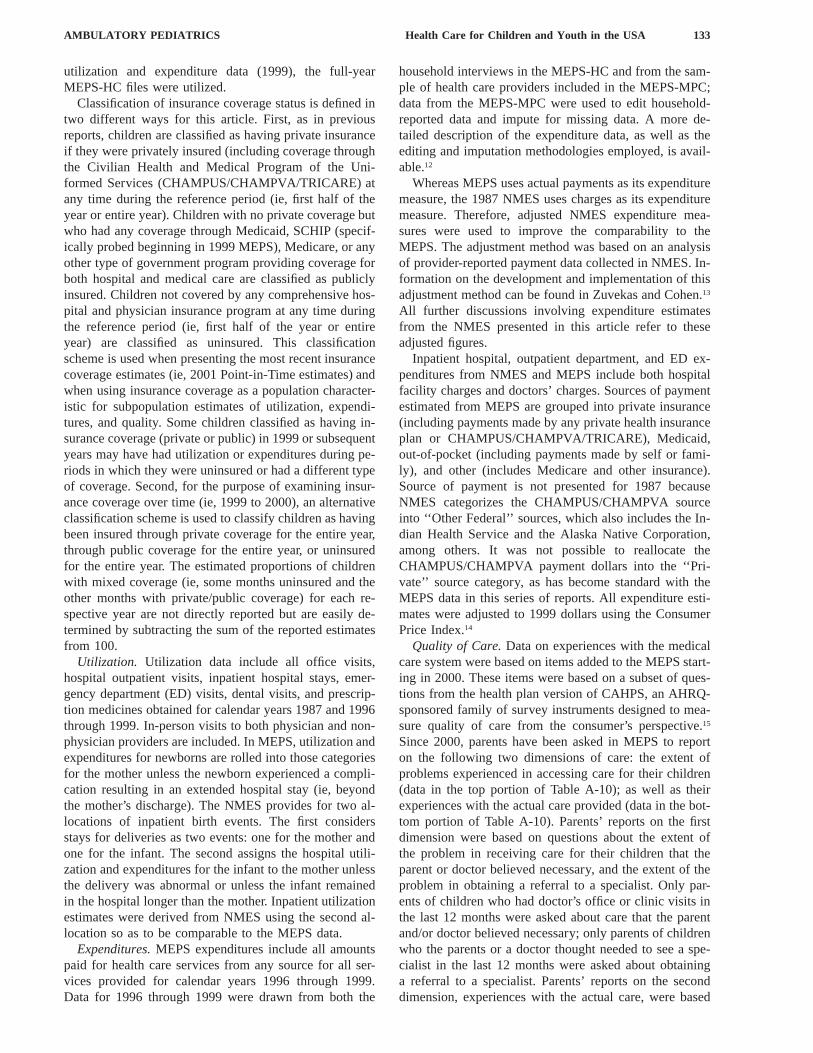
As with hospital inpatient stays, compared to 1987, theestimated proportion of children with at least one ED visitwas lower for each year from 1996 through 1999 (Table2). Overall, the proportion of children with at least oneED visit declined from 17.1% in 1987 to 11.1% in 1999.Large declines in rates of ED use were found among pub-licly insured children (from 21.9% to 12.7%, a 42% de-crease), children below 200% of poverty level (from19.3% to 12.7%, a 34% decrease), and children in theNortheast (from 19.8% to 11.1%, a 44% decrease) (Figure5). Between 1996 and 1999, the proportion of childrenwith at least one ED visit dropped from 12.9% to 11.1%.Significant drops occurred for a number of subpopula-tions, including children aged 10 to 14 years, girls, whites,non-Hispanics, children not in poor health, children in ur-ban areas, and children 200% or more above the povertyline (Table A-4).
Overall, dental care use by children appears to haveincreased by a nonsignificant amount from 1987 to thelate 1990s (Table 2). In 1987, 40.1% of children had adental visit, compared to 42.1% in 1999.
Overall, the proportion of children with at least oneprescription did not change significantly between 1987

AMBULATORY PEDIATRICS Health Care for Children and Youth in the USA 137
Figure 2. Office-based use for children 17 years of age and younger, by select population characteristics and year. Source: 1987 NationalMedical Expenditure Survey (NMES); 1996–1999 Medical Expenditure Panel Survey (MEPS). Agency for Healthcare Research and Quality.
Figure 3. Hospital outpatient use for children 17 years of age and younger, by select population characteristics and year. Source: 1987National Medical Expenditure Survey (NMES); 1996–1999 Medical Expenditure Panel Survey (MEPS). Agency for Healthcare Researchand Quality.
AMBULATORY PEDIATRICS138 Simpson et al
Figure 4. Hospital inpatient use for children 17 years of age and younger, by select population characteristics and year. Source: 1987National Medical Expenditure Survey (NMES); 1996–1999 Medical Expenditure Panel Survey (MEPS). Agency for Healthcare Researchand Quality.
Figure 5. Emergency Department use for children 17 years of age and younger, by selected population characteristics and year. Source:1987 National Medical Expenditure Survey (NMES); 1996–1999 Medical Expenditure Panel Survey (MEPS). Agency for Healthcare Researchand Quality.

AMBULATORY PEDIATRICS Health Care for Children and Youth in the USA 139
and 1999 (Table 2). The proportion of children in fair orpoor health who received at least one prescription in-creased from 65.8% in 1987 to 85.2% in 1999, while theproportion for non-poor children decreased from 56.5%in 1987 to 52.2% in 1999. Significant changes were alsoobserved for other subpopulations (eg, children in theWest and children above and below 200% of the povertyline (Table A-6).
From 1987 to the late 1990s, the site of ambulatorycare shifted significantly toward office-based points ofservice and away from outpatient and ED points of ser-vice (Table 3a). The contribution of office-based visits tooverall ambulatory care utilization increased from 86.4%in 1987 to 92.0% in 1999. Most of this increase could beattributable to a decline in hospital outpatient utilization,from 7.3% to 3.7%.
Health Care Expenditures
The percent of total expenditures attributable to chil-dren decreased significantly from about 14% in 1987 toabout 10% in late 1990s (Figure 6). Estimates for chil-dren’s health care expenditures are presented below.
After adjusting for inflation, there were several note-worthy increases in expenditures by type of service be-tween 1987 and 1999 (Figure 7). For office-based servic-es, average annual expenditures per child (with expendi-tures) were significantly higher in the late 1990s (range,$272 to $295) compared to 1987 ($228). Average expen-ditures for hospital outpatient services were significantlyhigher in 1997 ($1087), 1998 ($1086), and 1999 ($1230)compared to 1987 ($840). In contrast, average expendi-tures for hospital inpatient services were similar in 1987compared to 1997, 1998, and 1999 ($7822 vs $8547,$6053, and $7590, respectively) (Table A-8). For ED ser-vices, average expenditures were significantly higher dur-ing the late 1990s (range from $395 to $530) comparedto 1987 ($277).
Between 1987 and the late 1990s, the proportion oftotal ambulatory care expenditures for children shiftedaway from hospital outpatient services and toward office-based services (Table 3b). In 1999, outpatient departmentservice expenditures accounted for 22.1% of all ambula-tory services expenditures for children, compared to33.0% in 1987, while it rose from 51.8% to 61.1% foroffice-based services. During the late 1990s, the distri-bution of expenditures to these ambulatory points of ser-vice remained relatively stable. There was no significanttrend in the distribution of sources of payment for totalhealth care expenditures during the late 1990s (Table A-9). Distributions of payment sources for the late 1990scould not be compared to the distribution for 1987 be-cause payment sources were not able to be defined in asimilar way.
Parent Reports of Children’s Quality of Care
Overall, parents’ reports of their experiences in access-ing care and with the actual care provided in 2001 showedeither improvement or no change compared to 2000. Par-ents’ reports on the first dimension, extent of problems in
accessing care, were largely similar in 2001 to 2000, withsome improvement for children with public-only insur-ance in receiving necessary care. In 2001, three quartersof children younger than 18 years of age were reported tohave had one or more visits to a doctor’s office or clinicduring the last 12 months (Table A-10). Among these chil-dren with one or more visits, 91.9% were reported to haveno problems receiving care that their parents or their doc-tors believed was necessary, a significant improvementfrom their experiences in 2000 (88.6% reporting not aproblem) (Figure 8). The gap in 2001 between privatelyinsured and publicly insured children who did not have aproblem in obtaining needed care (3.7 percentage pointdifference) narrowed from the 12.5 percentage point dif-ference in 2000 as a result of a significant increase (be-tween 2000 and 2001) in the percentage of reports of nothaving a problem in getting needed care for children withpublic-only coverage (9.9 percentage point increase).
Of those children needing to see a specialist (17.4% ofchildren younger than 18 years of age in 2001), getting areferral was reported as not a problem for more than 80%of these children (Figure 8; Table A-10). Getting a referralwas more likely to present a problem for children withpublic-only coverage, compared to uninsured children andchildren with private coverage (percent reporting not aproblem: 74.7% of children with public-only coverage;87.0% of uninsured children; and 85.5% of children withprivate coverage). None of these 2001 data were signifi-cantly different from the data reported in 2000.
Several differences were noted between 2000 and 2001in parents’ reports on the second dimension, quality of thecare provided. Overall results showed an increase in theproportion of children whose parents reported more pos-itive experiences in 2001 compared to 2000 (in 2001,71.1% said providers always listened carefully, 74.2%said providers always explained things clearly, and 73.6%said providers always showed respect) (Figure 9; Table A-10). The overall increase between 2000 and 2001 in healthproviders always listening carefully was largely attribut-able to increases in positive reports for children with pri-vate coverage and for uninsured children, in whom theincreases were larger for uninsured children than for chil-dren with private coverage. The larger improvement from2000 to 2001 for uninsured children and children withpublic-only coverage than for children with private insur-ance in health providers always explaining things clearlyand always showing respect contributed to the eliminationof any significant differences by insurance type in the pro-portion of children whose parents responded ‘‘always’’ forthese two items in 2001. Significant differences by insur-ance remained in 2001 in the proportion of children whoseparents reported negative experiences for all three items.Children with public-only coverage or uninsured childrenwere at least twice as likely as children with private in-surance to have parents report that providers never orsometimes listened carefully to them, explained thingscarefully, or showed them respect. For example, childrenwith public-only coverage (10.2%) or uninsured children(8.5%) were more than twice as likely to be reported to

AMBULATORY PEDIATRICS140 Simpson et al
Table 3a. Percent Distribution of Ambulatory Visits for Children 17 Years of Age and Younger by Year*
YearTotal Visits(in millions)
Percent Distribution of Ambulatory Visits (95% CI)
Office-Based Outpatient Department Emergency Department
19871996199719981999
241.6222.3217.5226.6238.0
86.4 (84.9, 87.9)90.1 (89.1, 91.1)90.2 (89.4, 91.1)90.8 (89.8, 91.8)92.0 (91.0, 93.1)
7.3 (6.1, 8.5)4.6 (3.7, 5.4)4.6 (3.8, 5.4)4.3 (3.4, 5.2)3.7 (2.9, 4.6)
6.3 (5.8, 6.8)5.3 (4.9, 5.8)5.2 (4.7, 5.6)4.9 (4.5, 5.4)4.2 (3.7, 4.7)
*Source: 1987 National Medical Expenditure Survey (NMES); 1996–1999 Medical Expenditure Panel Survey (MEPS). Agency for Health-care Research and Quality. CI indicates confidence interval.
Figure 6. Percent of total expenditures attributable to children 17 years of age and younger, by selected population characteristics andyear. Source: 1987 National Medical Expenditure Survey (NMES); 1996–1999 Medical Expenditure Panel Survey (MEPS). Agency forHealthcare Research and Quality.
have providers who never or sometimes explained thingsclearly to them, compared to children with private cov-erage (3.8%).
Utilization of Hospital Inpatient Services
Consistent with MEPS results that showed relativelystable estimates in overall inpatient services between 1996and 1999, analysis of overall changes in the prevalenceof hospital stays did not reveal any significant shifts overtime. The population ratio for children’s hospitalizationswas 93.4 hospitalizations per 1000 children in 1995, com-pared to 88.0 hospitalizations per 1000 children in 2000(Figure 10; Table B-1). One notable shift, however, oc-curred in the prevalence of hospitalizations among the 15–17-year-olds, with a decline from 50.4 hospitalizations per1000 adolescents in 1995 to 41.9 hospitalizations per 1000adolescents in 2000. This finding may be related to the
decline in hospitalizations as a result of pregnancy andchildbirth in this group. As with children’s hospitaliza-tions, the aggregate measures for adult hospitalizations didnot reveal any significant shifts over time.
As shown in Figure 11 and Table B-2, the overall LOSfor children from 1995 to 2000 did not change signifi-cantly (3.4 days in 1995 to 3.3 days in 2000). Subpopu-lation comparisons, however, revealed some changes inthe LOS for children’s hospitalizations. The length of hos-pital stays for children aged 1–4 years, 5–9 years, and10–14 years decreased between 1995 and 2000 (1–4years: 3.3 to 2.9 days; 5–9 years: 4.0 to 3.4 days; and 10–14 years: 4.8 to 4.2 days, respectively). Interestingly, themean LOS for 10–14-year-olds consistently is longer thanany other age group across time. Patterns in mean LOSover time also varied by expected payer and region. Themean LOS for hospitalizations billed to private insurance

AMBULATORY PEDIATRICS Health Care for Children and Youth in the USA 141
Table 3b. Percent Distribution of Ambulatory Service Expenditures for Children 17 Years of Age and Younger by Year*
Year
TotalExpenditures(in millions)
Percent Distribution of Ambulatory Services Expenditures (95% CI)
Office-Based Outpatient Department Emergency Department
19871996199719981999
$18 795$22 683$22 884$21 983$24 096
51.8 (48.3, 55.2)60.1 (54.7, 65.6)62.3 (57.6, 67.0)64.1 (60.1, 68.1)61.1 (56.8, 65.5)
33.0 (29.2, 36.8)19.9 (15.7, 24.1)21.6 (17.4, 25.7)21.4 (17.6, 25.3)22.1 (17.9, 26.4)
15.2 (13.8, 16.6)20.0 (14.4, 25.6)16.1 (13.5, 18.7)14.5 (12.6, 16.4)16.7 (13.4, 20.0)
*Source: 1987 National Medical Expenditure Survey (NMES); 1996–1999 Medical Expenditure Panel Survey (MEPS). Agency for Health-care Research and Quality. Expenditures are CPI-adjusted to 1999 dollars. CI indicates confidence interval.
Figure 7. Average expenditures per child 17 years of age and youn-ger, with expenditures for each type of health care service by year.Source: 1987 National Medical Expenditure Survey (NMES); 1996–1999 Medical Expenditure Panel Survey (MEPS). Agency forHealthcare Research and Quality.
increased from 1995 to 2000 (3.0 days to 3.1 days).Changes in the mean LOS for hospitalizations billed toMedicaid or categorized as uninsured did not have a sim-ilar trend. In addition, mean LOS for children’s hospital-izations increased in the West (2.7 days to 3.1 days from1996 to 2000).
The four most common reasons for hospitalizations byage group did not change over the time period examined.However, by delving deeper into the details of hospital-izations, some significant shifts over time were identifiedwithin each age group in the contribution each of thesemade to hospital utilization (Figure 12; Table B-3). Notsurprisingly, among infants younger than 1 year, birth wasthe most frequent reason for admission across all years(85.4% to 87.6% of all hospital stays). Respiratory con-ditions were consistently the second most prevalent set ofconditions, accounting for 4%–5% of all stays (data notshown). There was a decrease, however, in hospitaliza-tions due to pneumonia in this age group, with a high of1.5% in 1995 to a low of 0.9% in 2000.
In contrast to infants, approximately 40% of all hospitalstays for 1–4-year-olds were for respiratory conditionsthroughout this period (data not shown). Asthma, an am-bulatory care–sensitive (ACS) condition (ie, condition forwhich most hospital admissions could be avoided by ap-propriate outpatient care), became a more prevalent reasonfor admission between 1995 and 2000 (11.2% to 12.6%,respectively). However, the percentage of hospital stays
for pneumonia, another ACS condition, decreased duringthis time period (16.1% in 1995 and 14.0% in 2000).
Similar to 1–4-year-olds, hospitalizations due to respi-ratory conditions, including asthma and pneumonia, wereprominent among children 5–9 years of age, accountingfor 25%–30% of all admissions (data not shown). Asthma,the most common respiratory condition, accounted for10.3% of hospital stays in 1998, which was a decline fromthe previous year (13.4%). Since 1998, hospitalizationsdue to asthma have increased to 12.0% of all stays in2000. Hospitalizations due to pneumonia among 5–9-year-olds have declined since 1995. In 2000, 7.6% of all hos-pital stays were a result of pneumonia, down from 10.1%in 1995. In contrast, appendicitis, a nondiscretionary con-dition, became a more frequent principal diagnosis, ac-counting for 6.1% of hospital stays in 2000, up from 4.6%in 1995.
In addition to specific respiratory conditions, appendi-citis and affective disorders were frequent reasons for hos-pital admission throughout this time period among 10–14-year-olds. Similar to hospital stays for appendicitisamong 5–9-year-olds, the prevalence of hospital stays forappendicitis among 10–14-year-olds increased from 8.0%in 1995 to 9.1% in 2000. Exhibiting a more markedchange over time, affective disorders accounted for an in-creasing number of hospitalizations, rising from 5.3% in1995 to 8.3% in 2000. Hospitalizations due to pneumonia,in contrast, declined during this time period from 4.1% in1995 to 2.9% in 2000.
Among 15–17-year-olds, pregnancy was a common rea-son for admission to hospitals throughout the time period,accounting for 4%–6% of all hospital stays. A notablechange, however, occurred between 1995 and 2000. Preg-nancy was the most frequent reason for hospital admission(6.2% of all hospital stays) in this age group in 1995, butby 2000, pregnancy was only the third most frequent rea-son for admission (4.7% of hospital stays). This findingis in contrast to affective disorders, which was the thirdmost frequent reason for admission (5.0% of hospitalstays) in 1995 and the most frequent reason for admission(8.2% of hospital stays) in 2000.
In addition to changes in the relative frequency of age-specific conditions over time, the data from 1995 to 2000reveal that there were significant changes in the meanLOS for these conditions (Figure 13; Table B-4). Not sur-prisingly, among infants under 1 year of age, the longest

AMBULATORY PEDIATRICS142 Simpson et al
Figure 8. Problems for children 17 years of age and younger in receiving necessary care and in getting a referral to a specialist, 2000–01. Source: 2000–2001 Medical Expenditure Panel Survey (MEPS). Agency for Healthcare Research and Quality.
Figure 9. Experiences during care for children 17 years of age and younger, 2000–01. Source: 2000–2001 Medical Expenditure PanelSurvey (MEPS). Agency for Healthcare Research and Quality.

AMBULATORY PEDIATRICS Health Care for Children and Youth in the USA 143
Figure 10. Trends in children and adolescent hospital discharges, by select population characteristics and year. Source: 1995–2000 Na-tionwide Inpatient Sample (NIS), Healthcare Cost and Utilization Project (HCUP). Agency for Healthcare Research and Quality.
Figure 11. Trends in mean length of stay (LOS) in days for children and adolescent hospital discharges, by selected population characteristicsand year. Source: 1995–2000 Nationwide Inpatient Sample (NIS), Healthcare Cost and Utilization Project (HCUP). Agency for HealthcareResearch and Quality.

AMBULATORY PEDIATRICS144 Simpson et al
Figure 12. Trends in four most frequent age-specific principal diagnoses, 1995–00. Source: 1995–2000 Nationwide Inpatient Sample (NIS),Healthcare Cost and Utilization Project (HCUP). Agency for Healthcare Research and Quality.
mean LOS was for other perinatal conditions (6.6 to 7.3days). No significant changes in LOS for any of theseconditions were noted across the 6 years. However, themean LOS for newborns increased from 2.8 days in 1995to 3.0 days in 2000. In contrast, the mean LOS for respi-ratory conditions declined between 1995 and 2000 (acutebronchitis: 3.3 to 3.0 days, respectively; pneumonia: 4.2to 3.6 days, respectively).
Similarly, among 1–4-year-olds, 5–9-year-olds, and10–14-year-olds, the mean LOS for respiratory conditionsdecreased between 1995 and 2000. The mean LOS forasthma declined by 0.3 days, and the mean LOS for pneu-monia declined by 0.5 days in all age groups. Althoughthe magnitude of change in the mean LOS is relativelysmall, the trend is consistent and linear. In addition, themean LOS for other frequent conditions in each age groupdecreased between 1995 and 2000. The most dramatic de-crease in mean LOS occurred for hospitalizations for chil-dren and youth 10–14 years of age with affective disor-ders. The mean LOS was 11.7 days in 1995, comparedwith 7.4 days in 2000, a decline of 4.3 days over a 6-yearperiod.
In contrast to the LOS among younger children andyouth, the mean length of hospital stays for three principalconditions among 15–17-year-olds increased significantly.The mean LOS for pregnancy, trauma to the perineum andvulva, and complications of pregnancy increased 0.2 to0.4 days over the 6-year time period. Although the mean
LOS for conditions related to pregnancy and the perineumsignificantly increased, the mean LOS for affective dis-orders significantly decreased from 9.4 days in 1995 to6.3 days in 2000.
DISCUSSION
For the first time, this report documents a number ofimportant changes in children’s health care for childrensince 1987. Utilization and expenditure trends encompassthe period from 1987 to 1999, whereas insurance andquality data are limited to trends during the mid- to late1990s. The last 15 years has been a time of numerouspolicy interventions at the state and Federal levels intend-ed to increase health insurance coverage for many ofAmerica’s low-income children20; it has also been a periodof change in the organization of health care, bringing anew focus on quality of care, substantial fluctuations inthe US economy, and a demographic trend toward an ag-ing society. Untangling the different effects of thesechanges on trends in children’s health care is challenging,but the data in this report can help point future analysesin some fruitful directions. This exploratory study is in-tended to inform both policymakers and researchers. Likeprevious reports, it provides a baseline from which tomeasure how future policy changes, alterations in theeconomy, and the health care delivery environment areaffecting children and their health care. In addition, thereport is meant to encourage future multivariate analyses

AMBULATORY PEDIATRICS Health Care for Children and Youth in the USA 145
Figure 12. Continued.
of the data, with more detailed attention to specific causalfactors in the policy and delivery environments. Althoughdata on multiple dimensions of children’s health care areincluded in this report, our focus this year is on thosehealth care service changes over time, with particular em-phasis on insurance coverage, income, and geographic re-gion.
Health Insurance Coverage
This study adds to the growing body of evidence thatshows a decrease in the rate of uninsurance among chil-dren and youth.1,21 We restricted our analysis to the period1996–99 to focus attention on the impact of the passageof SCHIP. Other studies have reported on the trends be-tween 1987 and 1996, the time period during whichMEPS was not fielded, and found decreases in the pro-portion of uninsured children following earlier expansionsin the Medicaid program.20
Several complex issues, however, are hidden by thissimple conclusion of decreasing uninsurance rates. Firstis the issue of why uninsurance decreased and the relativecontributions of at least three factors to the decrease: im-plementation of SCHIP, welfare reform, and a strongeconomy. Consistent with other studies, our results indi-cate that most of the decrease in full-year uninsurance forchildren is accounted for by increases in private cover-age.22 In addition, in 2000, 17.5% of children were cov-ered for the entire year by public coverage, compared to15.4% in 1996 (before the introduction of SCHIP), a re-sult that is not significantly different. However, other in-vestigators’ findings show significant increases in partic-ipation in public programs.21,23,24 These increases in publicprogram participation appear to be more due to state ef-forts to increase enrollment rather than to eligibility ex-pansions for programs such as Medicaid and SCHIP, in-cluding reducing administrative barriers and expandingoutreach activities.
Second, these overall trends in uninsurance rates do notgive any insights into what might have happened hadthese state outreach and enrollment efforts and the passageof SCHIP not occurred. In fact, a recent study by Banthinand Selden20 estimates that in the absence of the Medicaid
expansions of the late 1980s and early 1990s, the percentof children uninsured for a full year would have increasedfrom 26% in 1987 to 32% in 1996. Our descriptive datacannot disentangle these disparate forces.
Third, our analysis does not examine the degree towhich the availability of public coverage may have sub-stituted or ‘‘crowded out’’ even greater increases in pri-vate coverage. A number of studies have examined thisissue, and while most reports point to some degree ofcrowd out, the exact size of this effect varies with the datasource and approach used, especially the choice of targetand control population.23,25 Indeed, the range of estimateson crowd-out range from 5% to 50%, with each estimatecapturing only a piece of this complex puzzle.6,23,26–28 Per-haps the current state of the literature on crowd-out is bestsummed up by a recent report as part of the Congressio-nally mandated evaluation of SCHIP, which concludedthat the ‘‘empirical evidence to inform the debate about‘crowd-out’ [. . . ] remains limited and equivocal.’’21
Finally, there continues to be ample evidence that amajority (at least 65%) of uninsured children are eligiblebut still not participating in public programs.22 Reasonsfor this include both system factors (such as programcharacteristics, connections to welfare, and geographic lo-cations; family factors, such as lack of information aboutthe availability of coverage, problems in the enrollmentprocess, not wanting public coverage or perceiving a needfor it, or problems maintaining coverage) and child char-acteristics (such as age, the presence of activity limita-tions, and whether they were born in the United States).22
A limitation of our analysis is that our data do not shedany light on the period from 1987 to 1996. However, trendsfor children’s insurance coverage during the period whenMEPS was not fielded are available from the US Census’sCurrent Population Survey (CPS) (www.census.gov/hhes/hlthins/historic/hihistt5.html). These data are not directlycomparable to MEPS or other sources of information be-cause of the different ways insurance questions are askedacross data collection efforts, even those in the Federal gov-ernment. In addition, comparing across years is difficult, assurvey items on insurance coverage change, often in ef-forts to improve accuracy of estimates (www.cbpp.org/9-21-01health.htm; www.census.gov/hhes/hlthins/historic/hihistt5.html). However, both MEPS20 and the CPS foundthat the percentage of uninsured children was higher in1996 than in 1987. From 1987 through 1992, CPS showedthe uninsurance rate for children was 12.7%–13.3%, de-pending on the year. Between 1992 and 1995, it hoveredbetween 13.7% and 14.2%, and in 1996 it rose to 14.8%.CPS shows steady declines in private health insurance cov-erage between 1987 and 1996, compensated by increasesin Medicaid coverage from 1987 through 1995, followedby a decline in Medicaid coverage beginning in 1996.
The challenge for the years ahead will be to preventthe deterioration in coverage as the gains that have beenmade are threatened by economic downturns.6 In 2003,states reduced eligibility (eg, Oklahoma reduced eligibilityfor 0–5-year-olds from 185% poverty level to 133% pov-erty level), reinstated monthly reporting of eligibility, and

AMBULATORY PEDIATRICS146 Simpson et al
Figure 13. Trends in mean length of stay (LOS) for age-specific principal diagnoses for children and adolescent hospital discharges, 1995–00. Source: 1995–2000 Nationwide Inpatient Sample (NIS), Healthcare Cost and Utilization Project (HCUP). Agency for Healthcare Re-search and Quality.
eliminated media outreach. In other words, the very strat-egies that brought children into these programs are beingreversed.
Health Care Utilization
This study can also shed some light on whether the goalof recent policy interventions has been achieved. That is,are children, particularly poor and publicly insured chil-dren, receiving more higher quality health care services?We first discuss the implications of these data for all chil-dren, then we examine the differences that emerge forpoor and publicly insured children.
In the area of use, the data actually show few overallincreases in utilization, while demonstrating that utiliza-tion has moved away from hospital outpatient and otherhospital-based services (inpatient and ED). The reductionsin inpatient and ED use are not surprising given the nu-merous policies and incentives that have been put in placeto reduce utilization in these settings. The changes mayeven point to more appropriate care for children (ie, anemphasis on primary care as a strategy to reduce pre-ventable hospitalizations and the development of medicalhomes for children).29
While the trend of decreasing hospital inpatient use isconsistent with most other studies, our results indicate thatthe magnitude of the decrease may be greater for childrenthan for adults.2–4 Our data show that hospital inpatient
use for children declined approximately 45% between1987 and 1999. In contrast, using the National HospitalDischarge Survey, Bernstein et al4 found that the rate ofhospital use decreased by only about 30% between 1985and 1998 for the population as a whole. Several clinicaland system factors may be contributing to this steep de-cline.30 For example, certain serious conditions of child-hood that often required hospitalization have been virtu-ally eliminated thanks to vaccines and ambulatory man-agement approaches that have emerged since 1987, in-cluding Haemophilus influenza B and oral rehydration forthe treatment of gastroenteritis.31 At the system level, it isnot clear to what extent children’s disproportionate partic-ipation in managed care may be contributing to this de-cline.3,32 Several studies have examined the impact ofmanaged care on hospitalizations, and a subset of thesehave focused on, or at least included, children.33–35 Ini-tially, these studies tended to show that HMOs decreasedhospital utilization in terms of both admission and LOS.35
The most recent review of this literature, however, con-cludes that ‘‘there was little evidence of differences inhospital admission rates for HMOs compared to non-HMOs.’’33 Studies limited to children have always pre-sented a mixed picture, depending on type of insurance.3
Indeed, a recent study by Weinick and Cohen36 usingMEPS found that while overall hospitalization rates diddecrease between 1987 and 1996, the difference in rates

AMBULATORY PEDIATRICS Health Care for Children and Youth in the USA 147
Figure 13. Continued.
that existed in 1987 between Managed Care Organization(MCO) and non-MCO enrollees was eliminated in 1996,primarily as a result of reduction in hospitalizationsamong non-MCO enrollees. This finding was consistentacross demographic categories, including among 1–5-year-olds and 6–17-year-olds. Finally, other factors thatmay have contributed to the sharp decline in hospitaliza-tion rates include increasing cost sharing, utilization re-view, the use of alternative care settings, and the increas-ing use of same-day surgery.4 A number of recent studiesof hospital utilization for children have been conducted inindividual states37 or outside the United States and con-tinue to show a mixed picture of trends in hospital utili-zation, primarily depending on the age group exam-ined.31,36–40
Turning from hospitalization rates to LOS, the HCUPdata presented here revealed no overall trend toward areduction in LOS for children. In the aggregate, significantchanges in LOS were only evident for youths 1–4, 5–9,and 10–14 years of age, privately insured children, andchildren in the West. However, when the LOS was ex-amined for the four most frequent age-specific conditions,reductions in LOS were evident for specific respiratoryconditions (acute bronchitis, asthma, pneumonia), appen-dicitis, fluid and electrolyte disorders and, most notably,affective disorders. Indeed, hospitalizations for affectivedisorders showed a nearly 35% decline in LOS over a 6-year period, a finding consistent with other studies.41 In-creases in mean LOS were evident for newborns and thosewith conditions related to pregnancy and the perineumamong youths 15–17 years of age. Again, given that ourdata do not explicitly examine managed care practices, itis not clear what impact, if any, MCOs and their cost-containment strategies might be having on LOS for chil-dren, although the consistency in the results indicates thatsome policies are influencing the LOS for children in spe-cific areas. This remains a question for the population asa whole: results from 10 studies in one review were even-ly split as to whether they detected a significant reductionin LOS associated with HMO participation.33 At least one
of the studies included in this conclusion was focused onchildren.30
We also found that contributions that individual con-ditions made to overall inpatient hospital utilizationchanged over time. Although hospitalization rates by spe-cific conditions cannot be derived because population es-timates of children with these conditions are not available,the relative contributions that different diagnoses make tooverall hospital utilization can hint at the possibility thatsome changes in hospitalization rates by condition haveoccurred since 1995. For example, pneumonia accountedfor a smaller proportion of all hospitalizations in 2000 forchildren less than 15 years of age, and affective disordersaccounted for a larger proportion of all hospitalizations in2000 for youths 15–17 years of age. Further, relative to1998, asthma accounted for a larger proportion of hospi-talizations in 2000 for children under 10 years, a findingconsistent with numerous studies that have documentedincreasing rates of pediatric hospitalizations for asthmaduring earlier time periods.42,43 Clearly, the trends shownby the HCUP data could be due to either a real decreasein hospitalizations for respiratory conditions or to a rela-tive increase in hospitalizations for other conditions.
Our finding of significant reductions in ED use overalland for some subgroups contributes to the mixed picturepresented by much of the literature on ED utilizationtrends. Bernstein et al4 found that ED utilization remainedstable overall between 1990 and 1998 and suggested thatmanaged care requirements for preauthorization had failedto lower ED utilization. Szilagyi, in his 1998 review,found that there were no data examining the impact ofmanaged care on ED utilization for privately insured chil-dren, whereas there appeared to be fairly consistent find-ings of continued trends toward lower ED utilizationamong publicly insured children.3 In that Szilagyi’s morerecent work on the impact of New York’s SCHIP program(CHPlus), he and his collaborators found that implemen-tation of CHPlus was not associated with any measurablechange in ED utilization by young children.37 In our study,ED utilization dropped for both publicly and privately in-sured children, but the magnitude of the decrease ap-peared greater for children with public coverage. Manyfactors that affect ED utilization are not included in ouranalysis but could be examined using MEPS, includingMCO membership, maternal health status,44 child partic-ipation in center-based child care,45 the quality and capac-ity of primary care services, including the type of medicalhome or the degree of continuity of the care,46–48 andchanges in the organization of care from ED sites to hold-ing sites or urgent care units. Finally, we should note thatcounts of ED services are significantly lower (by as muchas 40%) in MEPS than those in other national surveys(eg, the National Hospital Ambulatory Medical Care Sur-vey, NHAMCS) but are similar to estimates from anothernational household survey (eg, the National Health Inter-view Survey, NHIS). The large difference betweenMEPS/NHIS and NHAMCS is difficult to completely ex-plain, and further research on this is needed.49
Our results on the absence of any trends in utilization

AMBULATORY PEDIATRICS148 Simpson et al
of dental visits deserve some mention. First, the fact thatdental care use by children has been and remains low isno surprise to child health services researchers. This isparticularly the case for children with public-only cover-age and those children at ,200% poverty level, in whomthe proportion with a visit hovered between 25.7% and28.9% over the time period examined. However, to theextent that children are becoming insured thanks to publicinsurance programs, their dental care utilization patternsshould improve somewhat, since uninsured children havefared even worse over the same time period: the propor-tion with a visit has been between 18.7% and 22.0%. In-deed, most evaluations of the impact of the implementa-tion of SCHIP-like programs on dental care show sub-stantial increases in access to dental care.50–52
Finally, it would be interesting to tease out what, if any,difference in service mix utilization might have occurredsince the establishment of SCHIP, given that the benefitpackages and service provider networks established understand-alone SCHIP programs varied from traditional Med-icaid. A recent assessment of these arrangements revealedsurprisingly little difference between Medicaid and stand-alone SCHIP programs.53 Although our analysis combinedchildren covered under both Medicaid and SCHIP, suchan analysis would only be possible in future years, sinceSCHIP coverage was specifically probed for beginning in1999.
Expenditures
There were a number of significant trends in expendi-ture patterns for children since 1987. Health care expen-ditures for children as a proportion of overall US healthcare expenditures have remained relatively small since1987, exhibiting a drop from 13.6% in 1987 to 9.6% in1998. The actual total amount of expenditures on childrendid not increase significantly between 1996 and 1999.However, average expenditures per child (with expendi-tures and adjusted for inflation) increased significantly inthe late 1990s compared to 1987 for office-based services,hospital outpatient services, and ED services. Given thesignificant expansion of gatekeeping arrangements duringthis time period, it would be interesting to delve furtherinto whether children in these types of arrangements haddifferent expenditure patterns over time. Using the 1996MEPS, Pati et al54 concluded that for the 40 million chil-dren enrolled in gatekeeping plans, annual total per capitahealth expenditures differed by less than 1% for childrenin gatekeeping plans compared with those in indemnityplans.
Parent Reports of Children’s Quality of Care
Our data for quality of care are limited but suggestsome improvement between 2000 and 2001, particularlyfor children with public-only insurance, in always receiv-ing necessary care, and for uninsured, publicly insured,and privately insured children in the second dimension ofexperiences with having health providers who always ex-plain things clearly to their parents and who alwaysshowed respect for what their parents had to say. Indeed,
the larger improvement for uninsured and publicly insuredchildren than for children with private insurance in havinghealth providers who always explained things clearly andalways showed respect contributed to the elimination ofany significant differences in 2001 by insurance type inthe proportion of children with parents responding thathealth providers always explain things carefully and showrespect. Overall, about 30% of children had parents whoreported that their providers did not always listen carefullyto them, explain things well, or show them respect.
Focus on Low-Income and Publicly Insured Children
This country has made a concerted effort over the last15 years to improve health insurance coverage and accessto health care for low-income children. What can the datain this report tell us about how successful we have been?Given the descriptive nature of our analyses, we focushere on both low-income and publicly insured children.Overall, we conclude that low-income and publicly in-sured children are still less likely than their more well-offcounterparts to receive needed health care services,whether those are office visits, hospital outpatient visits,dental visits, or prescription medications in 2000. How-ever, the size of that gap may have narrowed over time.Access to dental care is one area where the gap betweenprivately and publicly insured children did not narrowover time. Fewer than 30% of either publicly insured orlow-income children had at least one dental visit in 1999.In contrast, in 1999, low-income children were both morelikely to have at least one hospital inpatient admission oran ED visit, and publicly insured children were more like-ly than privately insured children to have at least one hos-pital inpatient admission.
Turning from utilization to expenditures, it is interestingto note that the proportion of total expenditures attribut-able to publicly insured children has shifted downwardfrom 11.0% in 1987, reaching as low as 5.8% in 1998,and rebounding in 1999 to 7.1%. This change is comple-mented by the fact that despite expansions in public in-surance program eligibility and participation, the percentof expenditures paid for by Medicaid (including SCHIP)has remained relatively unchanged since 1996 (range:13.9% to 19.5%). Prior studies of health insurance expan-sions have documented some increases in costs, at leastin the short term, as newly enrolled children consumemore services initially, an indication of pent-up de-mand.50,55–57 However, the study by Gordon and Selden56
on the Medicaid eligibility expansions between 1984 and1994 found that the relatively low incremental cost perenrollee was substantially below the average Medicaid ex-penditure for children. This was attributed to the fact thatexpansion children tended to be older and have fewer dis-abilities.
Although not all uninsured children are low income, itis interesting to note that children who remained withoutcoverage in the late 1990s appeared to experience wors-ening access to care, as measured by a statistically sig-nificant decline in having at least one office visit. Unin-sured children continued to have lowest expenditures

AMBULATORY PEDIATRICS Health Care for Children and Youth in the USA 149
($2.7 billion, or 4.5% of all expenditures for children in1999) and paid the greatest proportion of their health careexpenditures out of pocket (35.7% in 1999).
The minimal improvements in health care for publiclyinsured children are also reflected in our data on parentalreports of their children’s quality of care. About 25% ofpublicly insured children had parents who reported thatgetting a referral was likely to present a small or big prob-lem, significantly more than uninsured and privately in-sured children. Publicly insured children were also stillless likely than privately insured children to have parentsreport that their children’s health providers always listenedcarefully, and together with uninsured children, they weretwice as likely as privately insured children to have par-ents report that providers never/sometimes showed respectfor what they had to say (9.8%, 8.7%, and 4.2%, respec-tively).
Future Years
Future years’ worth of these data should provide a ful-ler picture of the impact of very recent changes in healthcare financing and delivery, US demographics, and theever-changing economy. Continuing to track trends incoverage, use, expenditures, and quality is important asvarious policy changes are implemented, including Fed-eral waivers for states to provide coverage to adults,whether or not they have covered children.6 MEPS andHCUP, perhaps combined with other data on relevant pol-icy and economic changes, are both ripe for further de-tailed, hypothesis-driven analyses of questions raised bythe descriptive data in this article. For example, do im-provements in preventive care or some other factor, suchas increased per–hospital-event costs account for the de-clining use of hospital-based services, including ED vis-its? Why was the drop in hospital outpatient visits moremarked for publicly insured children? What accounts forthe regional differences in trends in hospital inpatientstays? Why haven’t dental visits increased, and if theyhave increased in certain places, what accounts for thechanges? How can the lack of overall change in prescrip-tion drug use be explained? What accounts for the in-creased use over time between children in fair or poorversus good to excellent health? On the expenditure side,why do children’s personal health expenditures accountfor a lower percentage of total health expenditures in thelate 1990s than in the late 1980s? Can this change beexplained by less use of inpatient services among childrenalone, or did other factors contribute? On the hospital in-patient side, what accounts for the increases in asthma,appendicitis, and affective disorders hospitalizations andthe decreases in childhood pneumonia and teen pregnancyhospitalizations? What affects might various trends haveon children’s health status? Beginning in 2001, data fromthe revised MEPS child health supplement (www.meps.ahrq.gov/DatapPub/questionnaires) can help shed furtherlight on the relationships between trends in access, cov-erage, utilization, expenditures, and aspects of children’shealth status. On the quality front—measures of parent-reported patient experiences of care—more needs to be
understood about the impact of having parents report onolder children’s care and the underlying issues reflectedin parents’ (or children’s) reporting.
In future iterations of this report, we will focus on racialand ethnic disparities among children, although interestedreaders can glean some data on disparities from the elec-tronic pages of this journal. Beginning at the end of 2003,the AHRQ began two new annual reports on the qualityof health care and on prevailing disparities in health caredelivery. Even with these reports, data gaps will likelyremain in our ability to characterize and understand carefor children and youth. In future years, this report willexplore different policy-relevant issues in health care forchildren.
ACKNOWLEDGMENTS
The views expressed in this article are those of the authors anddo not necessarily represent those of the AHRQ or the US Depart-ment of Health and Human Services. The authors gratefully ac-knowledge the programming support provided by Suzanne Worthand her colleagues at Social and Scientific Systems and Sean Sextonfor his expert graphics and editorial assistance. The authors alsowould like to thank the individual state data collection projects thatare partners in the Healthcare Cost and Utilization Project (HCUP)and without which HCUP would not be possible: Arizona Depart-ment of Health Services, Phoenix, Ariz; California Office of State-wide Health Planning and Development, Sacramento, Calif; Colo-rado Health and Hospital Association, Greenwood Village, Colo;Connecticut Integrated Health Information (Chime Inc), Walling-ford, Conn; Florida Agency for Health Care Administration, Talla-hassee, Fla; Georgia: An Association of Hospitals & Health Systems(GHA), Marietta, Ga; Hawaii Health Information Corporation, Hon-olulu, Hawaii; Illinois Health Care Cost Containment Council,Springfield, Ill; Iowa Hospital Association, Des Moines, Iowa; Kan-sas Hospital Association, Topeka, Kans; Kentucky Department forPublic Health, Frankfort, Ky; Maine Health Data Organization, Au-gusta, Maine; Maryland Health Services Cost Review Commission,Baltimore, Md; Health Data Policy Group, Boston, Mass; MichiganHealth & Hospital Association, Lansing, Mich; Missouri HospitalIndustry Data Institute, Jefferson City, Mo; New Jersey Departmentof Health and Senior Services, Trenton, NJ; New York State De-partment of Health, Albany, NY; North Carolina Department ofHealth and Human Services, Chapel Hill, NC; Oregon Associationof Hospitals and Health Systems, Lake Oswego, Ore; Office ofOregon Health Policy and Research, Salem, Ore; PennsylvaniaHealth Care Cost Containment Council, Harrisburg, Pa; South Car-olina State Budget and Control Board, Columbia, SC; TennesseeHospital Association, Nashville, Tenn; Texas Health Care Informa-tion Council, Austin, Tex; and the Utah Department of Health, SaltLake City, Utah; Virginia Health Information, Richmond, Va; Wash-ington State Department of Health, Olympia, Wash; West VirginiaHealth Care Authority, Charleston, WV; and the Wisconsin Depart-ment of Health and Family Services, Madison, Wisc.
REFERENCES
1. Rhoades JA, Vistnes JP, Cohen JW. The Uninsured in America:1996–2000. Rockville, Md: Agency for Healthcare Researchand Quality; 2002.
2. Weinick RM, Cohen JW. Leveling the playing field: managedcare enrollment and hospital use, 1987–1996. Health Aff (Mill-wood). 2000;19:178–184.
3. Szilagyi PG. Managed care for children: effect on access to careand utilization of health services. Future Child. 1998;8:39–59.
4. Bernstein AB, Hing E, Burt CW, Hall MJ. Trend data on med-ical encounters: tracking a moving target. Health Aff (Mill-wood). 2001;20:58–72.
5. Miller RH, Luft HS. HMO plan performance update: an analysis

AMBULATORY PEDIATRICS150 Simpson et al
of the literature, 1997–2001. Health Aff (Millwood). 2002;21:63–86.
6. Folz C, Friedenzohn I, DeFrancesco L, et al. State of the States:Bridging the Health Coverage Gap. State Coverage Initiatives.Washington, DC: AcademyHealth; 2003.
7. Elixhauser A, Machlin SR, Zodet MW, et al. Health care forchildren and youth in the United States: 2001 annual report onaccess, utilization, quality, and expenditures. Ambul Pediatr.2002;2:419–437.
8. McCormick MC, Weinick RM, Elixhauser A, et al. Annual re-port on access to and utilization of health care for children andyouth in the United States—2000. Ambul Pediatr. 2001;1:3–15.
9. McCormick MC, Kass B, Elixhauser A, et al. Annual report onaccess to and utilization of health care for children and youthin the United States—1999. Pediatrics (J Ambul Pediatr Assoc).2000;105:219–230.
10. Kirby JB, Machlin SR, Thorpe JM. Patterns of AmbulatoryCare Use: Changes From 1987 to 1996. Rockville, Md: Agencyfor Healthcare Research and Quality; 2001. MEPS ResearchFindings No. 16. AHRQ publication 01-0026.
11. Edwards WS, Berlin M. Questionnaires and Data CollectionMethods for the Household Survey and the Survey of AmericanIndians and Alaskan Natives. Rockville, Md: National Centerfor Health Services Research and Health Care Technology As-sessment; 1989. National Medical Expenditure Survey Methods2. DHHS publication 89-3450.
12. Cohen JW, Machlin SR, Zuvekas SH, et al. Health Care Ex-penditures in the United States, 1996. Rockville, Md: Agencyfor Healthcare Research and Quality; 2000. AHRQ publication01-0009.
13. Zuvekas SH, Cohen JW. A guide to comparing health care ex-penditures in the 1996 MEPS to the 1987 NMES. Inquiry. 2002;39:76–86.
14. Bureau of Labor Statistics, Monthly Labor Review and Hand-book of Labor Statistics. Available at: http://www.bls.gov/data/. Accessed December 12, 2003.
15. Crofton C, Lubalin JS, Darby C. Consumer Assessment ofHealth Plans Study (CAHPS). Foreword. Med Care. 1999;37(suppl 3):MS1–MS9.
16. Shaw BV, Barnwell BG, Bieler GS. SUDAAN User’s Manual,Release 7.5. Research Triangle Park, NC: Research Triangle In-stitute; 1997.
17. Changes in the NIS Sampling and Weighting Strategy for 1998,January 18, 2002. Rockville, Md: Healthcare Cost and Utili-zation Project, Agency for Healthcare Research and Quality;2002.
18. Elixhauser A, Steiner C, Whittington C, McCarthy E. ClinicalClassifications for Health Policy Research. Hospital InpatientStatistics, HCUP-3 Research Note. 177. Rockville, Md:AHCPR; 1995.
19. Public Health Service and Health Care Financing Administra-tion (PHS, HCFA). International Classification of Disease,Ninth Revision, Clinical Modification. Vols I–III, 5th ed. Wash-ington, DC: Public Health Service; 1994. DHHS publication 94-1260.
20. Banthin JS, Selden TM. The ABCs of children’s health care:how the Medicaid expansions affected access, burdens and cov-erage between 1987 and 1996. Inquiry. 2003;40:133–145.
21. Wooldridge J, Hill I, Harrington M, et al. Interim EvaluationReport: Congressionally Mandated Evaluation of the State Chil-dren’s Health Insurance Program. Princeton, NJ: MathematicsPolicy Research; February 26, 2003.
22. Holahan J, Dubay L, Kenney G. Which children are still un-insured and why. Future Children. 2003;13.
23. Marquis MS, Long SH. Public insurance expansions and crowdout of private coverage. Med Care. 2003;41:344–356.
24. Cunningham PJ. SCHIP making progress: increased take-upcontributes to coverage gains. Health Aff (Millwood). 2003;22:163–172.
25. Kenney G, Holohan J. Public insurance expansions and crowdout of private coverage. Med Care. 2003;41:337–340.
26. Shenkman E, Wegener DH, Naff R, Freedman S. Crowd out:evidence from the Florida Healthy Kids Program. Pediatrics.1999;104:507–513.
27. Cunningham PJ, Hadley J, Reschovsky JD. The Effects ofSCHIP on Children’s Health Insurance Coverage: An UpdateBased on Three Rounds of the Community Tracking Study,1996–97 to 2000–01. Washington, DC: Center for StudyingHealth System Change; December 2002.
28. Dubay L. The effects of Medicaid expansions on insurance cov-erage of children. Future Children. 1996;6:152–161.
29. Ferris TG, Saglam D, Stafford RS, et al. Changes in the dailypractice of primary care for children. Arch Pediatr AdolescMed. 1998;152.
30. Newacheck PW, Hung YY, Marchi KS, et al. The impact ofmanaged care on children’s access, satisfaction, use, and qualityof care. Health Serv Res. 2001;36:315–334.
31. Wadsworth ME, Mann SL, Jones E. Generation differences inhospital inpatient care of children aged 1 to 5 years. J EpidemiolCommun Health. 1993;47:149–152.
32. Simpson L, Fraser I. Children and managed care: what researchcan, can’t, and should tell us about impact. Med Care Res Rev.1999;56(suppl 2):13–36.
33. Miller RH, Luft HS. HMO plan performance update: an analysisof the literature, 1997–2001. Health Aff (Millwood). 2002;21:63–86.
34. Miller RH, Luft HS. Does managed care lead to better or worsequality of care? Health Aff (Millwood). 1997;16:7–25.
35. Miller RH, Luft HS. Managed care plans: characteristics,growth, and premium performance. Annu Rev Public Health.1994;15:437–459.
36. Weinick RM, Cohen JW. Leveling the playing field: managedcare enrollment and hospital use, 1987–1996. Health Aff (Mill-wood). 2000;19:178–184.
37. Holl JL, Szilagyi PG, Rodewald LE, et al. Evaluation of NewYork State’s Child Health Plus: access, utilization, quality ofhealth care, and health status. Pediatrics. 2000;105(suppl 3E):711–718.
38. MacFaul R, Werneke U. Recent trends in hospital use by chil-dren in England. Arch Dis Child. 2001;85:203–207.
39. Esmail A, Quayle JA, Roberts C. Assessing the appropriatenessof paediatric hospital admissions in the United Kingdom. J Pub-lic Health Med. 2000;22:231–238.
40. Connors C, Millar WJ. Changes in children’s hospital use.Health Rep. 1999;11:9–19;19–21.
41. Martin A, Leslie D. Psychiatric inpatient, outpatient, and med-ication utilization and costs among privately insured youths,1997–2000. Am J Psychiatr. 2003;160:757–764.
42. Akinbami LJ, Schoendorf KC. Trends in childhood asthma:prevalence, health care utilization, and mortality. Pediatrics.2002;110:315–322.
43. Mannino DM, Homa DM, Akinbami LJ, et al. Surveillance forasthma—United States, 1980–1999. Morbid Mortal Wkly RepSurveill Summ. 2002;51:1–13.
44. Minkovitz CS, O’Campo PJ, Chen YH, Grason HA. Associa-tions between maternal and child health status and patterns ofmedical care use. Ambul Pediatr. 2002;2:85–92.
45. Silverstein M, Sales AE, Koepsell TD. Health care utilizationand expenditures associated with child care attendance: a na-tionally representative sample. Pediatrics. 2003;111:e371–e375.
46. Piehl MD, Clemens CJ, Joines JD. Narrowing the gap: decreas-ing emergency department use by children enrolled in the Med-icaid program by improving access to primary care. Arch Pe-diatr Adolesc Med. 2000;154:791–795.
47. Christakis DA, Mell L, Koepsell TD, et al. Association of lowercontinuity of care with greater risk of emergency departmentuse and hospitalization in children. Pediatrics. 2001;107:524–529.
48. Brousseau DC, Dansereau LM, Linakis JG, et al. Pediatric

AMBULATORY PEDIATRICS Health Care for Children and Youth in the USA 151
emergency department utilization within a statewide Medicaidmanaged care system. Acad Emerg Med. 2002;9:296–299.
49. Machlin SR, Valluzzi JL, Chevarley FC, Thorpe JM. Measuringambulatory health care use in the United States: a comparisonof 1996 estimates across four Federal surveys. J Econ Soc Mea-sure. 2001;27:57–69.
50. Lave JR, Keane CR, Lin CJ, et al. Impact of a children’s healthinsurance program on newly-enrolled children. JAMA. 1998;279:1820–1825.
51. Lave JR, Keane CR, Lin CJ, Ricci EM. The impact of dentalbenefits on the utilization of dental services by low-income chil-dren in western Pennsylvania. Pediatric Dent. 2002;24:234–240.
52. Mofidi M, Sifkin R, Freeman V, Silberman P. The impact of astate children’s health insurance program on access to dentalcare. J Am Dent Assoc. 2002;133:707–714; quiz 767–768.
53. Hill I, Lutzky AW. Are Children Accessing the Care They Need?An Assessment of Benefits and Service Delivery ArrangementsUnder SCHIP. 2001 Annual Research Meeting Abstract. Wash-ington, DC: Health Policy Center, The Urban Institute; 2001.
54. Pati S, Shea S, Rabinowitz D, Carrasquillo O. Does gatekeepingcontrol costs for privately insured children? Findings from the1996 medical expenditure panel survey. Pediatrics. 2003;111:456–460.
55. Zwanziger J, Mukamel DB, Szilagyi PG, et al. Evaluating ChildHealth Plus in upstate New York: how much does providinghealth insurance to uninsured children increase health carecosts? Pediatrics. 2000;105(suppl 3E):728–732.
56. Gordon LV, Selden TM. How much did the Medicaid expan-sions for children cost? An analysis of state Medicaid spending,1984–1994. Med Care Res Rev. 2001;58:482–495.
57. Manning WG, Newhouse JP, Duan N, et al. Health insuranceand the demand for medical care. Am Econ Rev. 1987;77:251–277.
APPENDIX A
Appendix A provides additional information on theMedical Expenditure Panel Survey (MEPS) analyses, in-cluding the detailed tables on the changes over time ininsurance coverage, utilization, expenditures, and qualityof care (Tables A-1 to A-10) and narrative and updatedtables for the most recent year available (Tables A-11 toA-16). All methods for MEPS analyses and narrative re-sults on changes over time are described in the main bodyof the article.
Results on Most Recent Year Available
Insurance Coverage
In the first half of 2001, 63.1% of children were cov-ered by private insurance, 22.3% through public sources,and 14.6% were uninsured (Table A-11). As in previousyears, the highest rates of uninsurance were among ado-lescents (18.0%), Hispanic children (29.0%), and childrenin the South and West (18.4% and 17.0%, respectively).
Utilization
The patterns of health care use by children and adoles-cents in 1999 were similar to those from 1998, and there-fore, these data are included in the electronic appendix(Tables A-12 and A-13). Seventy percent of children hadat least one office visit in 1999, and for those with anyvisit, the average number was 4.3 visits per year. Only asmall percent had a hospital outpatient visit (6.1%), with
an average of 2.0 visits per child with any visits. Only2.6% of children and youth experienced a hospital stay(excluding stays for normal births), with an average of 1.2discharges for those with any hospital stays. A higher pro-portion experienced an emergency department (ED) visit(11.1%), with an average of 1.2 visits for those with anyED visit. Less than half (42.1%) of all children and youthhad a dental visit, with an average of 2.7 visits for thosewho visited a dentist at least once during the year. Finally,about half (50.3%) of all children obtained prescriptionmedicines, with an average of 4.2 prescriptions for thosewith any prescription use. Fewer uninsured children hadat least one office visit (43%) than did children with pub-lic (68.6%) or private coverage (73.6%), and for thosewith a visit, the average (2.7) was also less than for chil-dren with public (4.0) or private coverage (4.5). A similarpattern was evident in the proportion of children with adental visit. Less than 20% of uninsured children had atleast one dental visit, compared to 27.5% for publicly in-sured children and 48.8% for privately insured children.
Poor children (,200% poverty level) were less likelythan non-poor children to have at least one office visit(63.9% vs 74.2%), a hospital outpatient visit (5.0% vs6.9%), a dental visit (26.9% vs 52.2%), or a prescription(47.3% vs 52.2%) but were more likely to have at leastone hospital inpatient admission (3.6% vs 2.0%) or an EDvisit (12.7% vs 10.1%). Some regional differences in theproportion of children with at least one visit were evident.In general, children in the West tended to have the lowestrates of utilization, but this value reached significanceonly for certain types of visits. For example, the propor-tions of children with at least one office visit, one hospitaloutpatient visit, or one prescription were all significantlylower in the West than the Northeast, and the proportionof children with at least one ED visit was significantlylower in the West than either the Midwest or South.
Expenditures and Source of Payment
The data on expenditures for children’s health care in1999 were similar to those for 1998 (Table A-14). Themajority (83.6%) of American children had expendituresfor medical care during 1999, and average total expendi-ture for a child with any medical expenditure was $1013.The percent of children with any expenditure decreasedwith age from 87.4% for children 0–4 years of age to79.5% for children aged 15–17 years. Fewer African-American, non-Hispanic, and Hispanic children had anyexpenditures (71.6% and 71.9%) compared to White, non-Hispanic children. The highest average total expenditureper child was among children in fair or poor health($4456). Average expenditures for each type of healthcare service were $295 for office visits, $1230 for hospitaloutpatient visits, $7590 for hospital inpatient admission,$520 for an ED visit, $467 for a dental visit, and $153for prescribed medicines (Table A-15). Average expen-ditures for office visits were significantly lower for public-only ($216) and uninsured ($199) children than privatelyinsured children ($322).
Overall medical expenditures for children under 17

AMBULATORY PEDIATRICS152 Simpson et al
years of age totaled $61.5 billion in 1999. About 78% ofexpenditures were for privately insured children ($47.6billion), 18.1% for publicly insured children ($11.2 bil-lion), and 4.5% for uninsured children ($2.7 billion) (Ta-ble A-16). As in previous years, slightly more than half(50.9%) of these expenditures were paid for by privateinsurance, 17.1% by Medicaid, and 22.7% were paid outof pocket. Thus, the total dollar amount paid out of pocketfor children’s health care was about $14 billion. The av-erage out-of-pocket expenditures per child with any ex-penditure was about $230.
A higher proportion of health care expenditures againwere paid out of pocket for uninsured children (35.7%)than for those children who were either privately insured(25.4%) or publicly insured (7.8%).
APPENDIX B
Appendix B provides additional information on Health-care Cost and Utilization Project (HCUP) analyses, in-cluding detailed tables on trends in children’s hospitaliza-tions (Tables B-1 to B-4) and the narrative results andupdated tables for the year 2000 (Tables B-5 to B-10).Methods for the HCUP trend analyses and narrative re-sults are described in the main body of the article.
Methods for Most Recent Year Available
Data for the most recent year available come from the2000 State Inpatient Databases (SID) and the 2000 Na-tionwide Inpatient Sample (NIS). (Participating states inthe 2000 SID included Arizona, California, Colorado,Connecticut, Florida, Georgia, Hawaii, Illinois, Iowa,Kansas, Kentucky, Maine, Maryland, Massachusetts,Michigan, Missouri, New Jersey, New York, North Car-olina, Oregon, Pennsylvania, South Carolina, Tennessee,Texas, Utah, Virginia, Washington, West Virginia, andWisconsin.) The unit of analysis for these databases is thedischarge or hospital stay, rather than the patient. TheSID, which generally covers all inpatient stays in com-munity hospitals in participating states (the 28 states inthe 2000 NIS were Arizona, California, Colorado, Con-necticut, Florida, Georgia, Hawaii, Illinois, Iowa, Kansas,Kentucky, Maine, Maryland, Massachusetts, Missouri,New Jersey, North Carolina, New York, Oregon, Penn-sylvania, South Carolina, Tennessee, Texas, Utah, Virgin-ia, Washington, West Virginia, and Wisconsin) was usedto complete updated state descriptive statistics. The NIS,which has a sampling frame of more than 80% of all UShospital discharges, was used to complete regional andnational descriptive statistics.
Measures
In addition to information about length of stay, diag-noses, and expected payer described in the main body ofthe text, analyses for the most recent year available in-cluded information about the emergency department (ED)as the admission source and details about hospital char-acteristics.
Hospital Characteristics
Four variables on hospital characteristics, including lo-cation, teaching status, bed size, and ownership, were ob-tained form the American Hospital Association AnnualSurvey of Hospitals. Because the definitions of teachingstatus, bed size, and ownership have changed over thecourse of the years, we used the definitions prior to 1998for the purpose of examining trends in hospital character-istics in the future.
The location of the hospital was self-reported by thehospital as either urban (metropolitan) or rural (nonmet-ropolitan). A hospital was classified as a teaching insti-tution if the hospital has an intern-to-bed ratio of greaterthan zero and if the hospital is either a member of theCouncil of Teaching Hospitals or has an American Med-ical Association–approved residency program.
The size of the hospital was based on the number ofhospital beds, hospital location, and teaching status. Ahospital was considered small if it had 1–49 beds and waslocated in a rural area; 1–99 beds and was an urban, non-teaching hospital; or 1–299 beds and was an urban, teach-ing hospital. A hospital was considered medium if it had5–99 beds and was located in a rural area; 100–199 bedsand was an urban, non-teaching hospital; or 300–499 bedsand was an urban, teaching hospital. A hospital was con-sidered large if it had 1001 beds and was located in arural area; 2001 beds and was an urban, non-teachinghospital; or 5001 beds and was an urban, teaching hos-pital.
Ownership was based on the hospital’s response to thequestion of the type of organization that is responsible forestablishing policy for overall operation of the hospital:private, not-for-profit; private, for-profit; or government,non-Federal.
Analysis
The number of cases in the NIS was multiplied by hos-pital-specific discharge weights to derive regional and na-tional estimates of the number of discharges in 2000. Thenumber of cases from the SID remained unweighted. Chi-square tests and analysis of variance tests were used toassess statistically significant differences for categoricaland continuous data, respectively. All differences dis-cussed in the appendix for results based on the NIS arestatistically significant a the .05 level or better.
Results of Most Recent Year Available
Number, Length of Stay, and Admission Sourceof Hospitalizations
Hospitalizations of children and adolescents under 18years of age accounted for 17.5% of all hospitalizationsin the United States, or about 6.3 million discharges in2000 (Table B-5), similar to results obtained for previousyears. Because of the large number of in-hospital births,the majority of hospital stays for children and adolescentswere for infants younger than 1 year of age (73.6%).Mean length of stay (LOS) was 3.3 days for children andadolescents in US community hospitals, compared to 4.9

AMBULATORY PEDIATRICS Health Care for Children and Youth in the USA 153
days for adults. As in prior years, significant variation inmean LOS was evident by age group (range: 2.9 to 4.2days) (Table B-5) and region (range: 3.1 to 3.5 days) (Ta-ble B-6). Overall, 14.6% of all pediatric hospital admis-sions were through the ED, although this also varied sig-nificantly by age (4.7% for ,1-year-olds to 46.1% for 5–9-year-olds) (Table B-5) and region (13.6% in the Southto 17.6% in the Northeast) (Table B-6).
Expected Payer
As was the case in previous years, more than half(54.5%) of hospitalizations for children and adolescentswere billed to private insurers, 37.8% to Medicaid, and5.1% were uninsured (Table B-5). The proportion of hos-pitalizations billed to Medicaid or labeled as uninsuredvaried significantly by age of the children and adolescent(Table B-5) and region of the country (Table B-6). Forexample, Medicaid was billed for 31.8% of hospital staysin the Midwest, compared with 43.0% in the South. Un-insured hospitalizations ranged from 3.9% in the North-east to 6.8% in the South.
Table B-7 provides additional information on expectedpayers. The mean LOS was significantly shorter for un-insured child hospitalizations (2.7 days) compared withprivately insured child hospitalizations (3.1 days) and hos-pitalizations of children covered by Medicaid (3.7 days).A significantly larger proportion of uninsured children’shospitalizations listed the ED as the source of admission(19.4%), compared with hospitalizations of children cov-ered by Medicaid (17.0%) and private insurance (12.4%).
Types of Hospitals
For the entire nation, 54.9% of hospital admissions oc-curred in large hospitals, 28.9% in medium hospitals, and16.3% in small hospitals (Table B-8). The percentage ofhospital stays in large hospitals varied significantly by re-gion. The South relied primarily on large hospitals(65.0%) for children’s inpatient care, whereas the North-east treated children in large hospitals less than half thetime (43.9%). More child hospitalizations were managedby private, not-for-profit hospitals than by any other hos-pital type, but there was significant regional variation. Forexample, in the Northeast, very few hospitalizations oc-curred in private, for-profit (2.3%) or government, non-Federal (3.2%) hospitals, whereas hospital stays in theSouth and West occurred in private, for-profit and gov-ernment, non-Federal hospitals over one third of the time(South: 18.6% and 19.1%, respectively; West: 13.4% and20.6%, respectively). Less than half of all children andyouth hospital stays occurred in teaching hospitals(35.2%). As reported previously, more hospital stays for1–4-, 5–9-, and 10–14-year-olds (range: 40.2% to 43.4%)were in teaching hospitals, compared with infants and 15–17-year-olds (33.7% and 34.4%, respectively) (TableB-5).
Reason for Admission
Table B-9 provides the most frequent principal condi-tions treated in the United States, organized by body sys-tem or general condition, and Table B-10 provides break-downs on the top 10 conditions by age group. As in pre-vious years, nearly all infants younger than 1 year of agewere in the hospital for conditions related to the perinatalperiod, including diagnoses pertaining to newborns(90.1%). Respiratory conditions were the only other cat-egory of conditions that accounted for a sizeable percent-age of infant hospital stays (4.3%) (Table B-9), generallyfor acute bronchitis, asthma, and pneumonia (3.6% com-bined; Table B-10).
In contrast, approximately 40% of all hospital stays for1–4-year-olds were for respiratory conditions (Table B-9),including pneumonia (14.0%), asthma (12.6%), and acutebronchitis (5.5%) (Table B-10). Diseases of the digestivesystem also accounted for many hospital stays in this agegroup (10.8% of all hospital stays), primarily consistingof intestinal infections (4.0%) and noninfectious gastro-enteritis (3.2%). Other groups of conditions that account-ed for nearly 10% of all hospital stays among 1–4-year-olds included endocrine, nutritional, metabolic, and im-munity disorders (9.8% of stays) and injury and poisoning(9.5% of stays).
As was the case for hospital stays for 1–4-year-olds,respiratory conditions were the principal reason for ad-mission (25.4% of all hospital stays) among 5–9-year-olds. This group of conditions consists primarily of asth-ma (12.0%) and pneumonia (7.6%). More prevalent thanin younger child hospital stays, injury and poisoning, in-cluding fracture of the upper limb (3.2%), accounted for14.7% of hospital stays among 5–9-year-olds. In addition,diseases of the digestive system (14.0%) were a prevalentreason for admission in this age group. Appendicitis(6.1% of hospital stays) and noninfectious gastroenteritis(2.1%) were the largest contributors to this group.
Almost half of all hospital stays among 10–14-year-olds were attributable to one of three conditions: injuryand poisoning (16.8%), mental disorders (15.5%), and thedigestive system problems (15.2%). Limb fractures, spe-cifically of the upper limb (2.3%) and lower limb (3.0%),were the most common specific conditions under the cat-egory of injury and poisoning. Affective disorders (8.3%),the second most prevalent specific reason for admission,were the largest contributors to hospital mental disorders.Appendicitis (9.1%), the most prevalent specific reasonfor admission, contributed to diseases of the digestive sys-tem.
As in previous years, pregnancy, childbirth, and the pu-erperium accounted for over one third of hospital staysamong 15–17-year-olds (37.2%). Mental disorders(14.5%), primarily affective disorders (8.2%), and injuryand poisoning (13.8%) remained prevalent reasons for ad-mission.

Tab
leA
-1.
Offi
ce-B
ased
Use
for
Chi
ldre
n17
Yea
rsof
Age
and
You
nger
byY
ear*
Cha
ract
eris
tic
1987
Perc
ent
With
Any
Vis
its95
%C
I
1996
Perc
ent
With
Any
Vis
its95
%C
I
1997
Perc
ent
With
Any
Vis
its95
%C
I
1998
Perc
ent
With
Any
Vis
its95
%C
I
1999
Perc
ent
With
Any
Vis
its95
%C
I
Tota
l70
.2(6
8.7,
71.7
)71
.5(7
0.0,
73.1
)68
.9(6
8.5,
71.4
)69
.9(6
7.3,
70.5
)70
.1(6
8.3,
71.9
)
Hea
lthin
sura
nce
cove
rage
Any
priv
ate
Publ
icon
lyU
nins
ured
74.0
63.5
52.3
(72.
5,75
.5)
(59.
8,67
.3)
(48.
1,56
.5)
76.2
66.8
50.7
(74.
4,78
.0)
(63.
9,69
.7)
(45.
6,55
.8)
73.5
65.9
54.7
(71.
6,75
.5)
(63.
0,68
.9)
(50.
8,58
.7)
72.6
66.3
48.8
(70.
7,74
.5)
(63.
1,69
.5)
(43.
9,53
.7)
73.6
68.6
43.0
(71.
5,75
.7)
(64.
9,72
.3)
(38.
2,47
.8)
Age
0–
4y
5–9
y10
–14
y15
–17
y
81.1
67.5
63.2
66.7
(79.
2,83
.1)
(65.
1,69
.8)
(60.
8,65
.6)
(64.
1,69
.2)
83.0
72.2
64.2
63.7
(80.
6,85
.3)
(69.
7,74
.7)
(61.
0,67
.3)
(60.
2,67
.3)
83.9
69.0
62.1
61.5
(82.
1,85
.7)
(66.
7,71
.4)
(59.
6,64
.6)
(58.
5,64
.5)
82.4
67.4
62.6
60.6
(79.
8,84
.9)
(64.
6,70
.2)
(59.
9,65
.3)
(57.
3,63
.9)
82.4
66.6
65.7
63.3
(80.
1,84
.6)
(63.
5,69
.7)
(62.
8,68
.5)
(60.
0,66
.7)
Sex M
ale
Fem
ale
69.8
70.5
(68.
2,71
.5)
(68.
7,72
.4)
71.8
71.2
(69.
7,73
.9)
(69.
3,73
.2)
69.2
70.7
(67.
3,71
.1)
(68.
8,72
.6)
68.4
69.4
(66.
4,70
.5)
(67.
3,71
.5)
70.4
69.8
(68.
3,72
.5)
(67.
4,72
.1)
Rac
e/E
thni
city
Whi
te,
non-
His
pani
cA
fric
anA
mer
ican
,no
n-H
ispa
nic
His
pani
cO
ther
,no
n-H
ispa
nic
76.1
53.1
61.3
55.4
(74.
5,77
.7)
(50.
0,56
.2)
(58.
0,64
.7)
(47.
7,63
.2)
77.3
59.0
62.6
61.5
(75.
5,79
.0)
(55.
1,63
.0)
(59.
3,65
.9)
(53.
9,69
.1)
76.4
54.7
61.5
59.8
(74.
6,78
.2)
(51.
7,57
.6)
(58.
6,64
.3)
(51.
8,67
.8)
75.9
53.5
58.6
58.5
(74.
1,77
.6)
(49.
2,57
.7)
(55.
8,61
.5)
(49.
9,67
.0)
76.1
57.0
60.1
65.3
(74.
1,78
.1)
(51.
9,62
.1)
(56.
8,63
.4)
(57.
4,73
.2)
Perc
eive
dhe
alth
stat
us
Exc
elle
nt,
very
good
,go
odFa
iror
poor
69.6
76.7
(67.
9,71
.2)
(71.
9,81
.5)
71.8
77.0
(70.
2,73
.3)
(69.
7,84
.3)
69.7
83.6
(68.
1,71
.2)
(78.
7,88
.4)
68.7
85.5
(67.
0,70
.3)
(79.
3,91
.7)
69.7
90.1
(67.
8,71
.5)
(85.
4,94
.8)
Reg
ion
Nor
thea
stM
idw
est
Sout
hW
est
75.4
76.2
62.5
71.4
(72.
4,78
.4)
(73.
7,78
.6)
(59.
7,65
.4)
(68.
5,74
.2)
76.7
76.0
68.9
66.9
(73.
9,79
.5)
(73.
5,78
.4)
(66.
2,71
.7)
(63.
3,70
.5)
72.2
74.8
67.3
67.2
(67.
9,76
.4)
(72.
4,77
.2)
(64.
7,69
.9)
(64.
0,70
.4)
72.4
73.5
64.9
67.3
(68.
1,76
.6)
(70.
3,76
.6)
(62.
2,67
.6)
(64.
4,70
.1)
78.5
71.9
66.2
67.5
(75.
2,81
.8)
(68.
1,75
.7)
(62.
8,69
.7)
(63.
7,71
.3)
MSA M
SAN
on-M
SA70
.669
.1(6
8.9,
72.3
)(6
5.7,
72.5
)72
.468
.1(7
0.7,
74.2
)(6
4.8,
71.5
)70
.069
.9(6
8.3,
71.8
)(6
7.5,
72.4
)69
.268
.0(6
7.4,
70.9
)(6
4.3,
71.7
)70
.668
.2(6
8.5,
72.6
)(6
4.2,
72.1
)
Pove
rty
stat
us
,20
0%of
pove
rty
line
$20
0%of
pove
rty
line
61.2
76.6
(59.
0,63
.4)
(75.
0,78
.1)
64.0
77.3
(61.
6,66
.3)
(75.
5,79
.1)
61.4
75.9
(59.
4,63
.5)
(74.
1,77
.8)
61.2
74.0
(58.
7,63
.8)
(72.
0,76
.0)
63.9
74.2
(61.
1,66
.7)
(72.
1,76
.3)
*Sou
rce:
1987
Nat
iona
lM
edic
alE
xpen
ditu
reSu
rvey
(NM
ES)
;19
96–1
999
Med
ical
Exp
endi
ture
Pane
lSu
rvey
(ME
PS).
Age
ncy
for
Hea
lthca
reR
esea
rch
and
Qua
lity.
CI
indi
cate
sco
nfide
nce
inte
rval
;M
SA,
met
ropo
litan
stat
istic
alar
ea.

Tab
leA
-2.
Hos
pita
lO
utpa
tient
Use
for
Chi
ldre
n17
Yea
rsof
Age
and
You
nger
byY
ear*
Cha
ract
eris
tic
1987
Perc
ent
With
Any
Vis
its95
%C
I
1996
Perc
ent
With
Any
Vis
its95
%C
I
1997
Perc
ent
With
Any
Vis
its95
%C
I
1998
Perc
ent
With
Any
Vis
its95
%C
I
1999
Perc
ent
With
Any
Vis
its95
%C
I
Tota
l11
.8(1
0.5,
13.0
)7.
3(6
.3,
8.2)
6.8
(6.0
,7.
5)6.
5(5
.6,
7.3)
6.1
(5.4
,6.
9)
Hea
lthin
sura
nce
cove
rage
Any
priv
ate
Publ
icon
lyU
nins
ured
11.9
14.3 7.2
(10.
5,13
.3)
(11.
6,17
.0)
(5.1
,9.
3)
7.8
7.3
3.7
(6.7
,8.
9)(5
.6,
8.9)
(2.1
,5.
3)
7.1
7.9
2.6
(6.2
,7.
9)(6
.3,
9.5)
(1.5
,3.
7)
6.4
8.6
1.9
(5.4
,7.
5)(6
.8,
10.4
)(0
.9,
2.9)
6.6
5.8
3.1
(5.6
,7.
5)(4
.5,
7.1)
(1.5
,4.
6)
Age
0–
4y
5–9
y10
–14
y15
–17
y
15.9
10.4 8.6
11.8
(13.
6,18
.3)
(8.7
,12
.1)
(7.3
,9.
9)(9
.7,
13.8
)
9.7
6.2
5.9
7.2
(8.0
,11
.4)
(4.8
,7.
6)(4
.4,
7.4)
(5.4
,9.
1)
9.1
5.2
5.9
7.1
(7.5
,10
.7)
(4.1
,6.
2)(4
.6,
7.2)
(5.6
,8.
6)
7.5
6.9
5.5
5.7
(5.8
,9.
1)(5
.4,
8.3)
(4.1
2,7.
0)(4
.0,
7.3)
5.8
6.1
6.7
5.8
(4.6
,7.
1)(4
.8,
7.3)
(5.3
,8.
1)(4
.0,
7.6)
Sex M
ale
Fem
ale
11.8
11.8
(10.
3,13
.3)
(10.
4,13
.1)
7.4
7.0
(6.2
,8.
6)(5
.7,
8.3)
7.4
6.0
(6.4
,8.
5)(5
.2,
6.9)
6.5
6.4
(5.4
,7.
6)(5
.2,
7.6)
6.3
6.0
(5.2
,7.
3)(5
.0,
7.0)
Rac
e/E
thni
city
Whi
te,
non-
His
pani
cA
fric
anA
mer
ican
,no
n-H
ispa
nic
His
pani
cO
ther
,no
n-H
ispa
nic
12.2
11.7 9.8
9.9
(10.
9,13
.5)
(9.3
,14
.0)
(7.2
,12
.4)
(5.0
,14
.8)
8.3
5.4
4.9
6.3
(7.1
,9.
5)(3
.4,
7.3)
(3.6
,6.
3)(3
.0,
9.7)
7.4
6.2
4.9
5.6
(6.4
,8.
4)(4
.5,
8.0)
(3.9
,5.
9)(1
.6,
9.6)
7.2
5.4
5.3
3.4
(6.0
,8.
4)(3
.4,
7.3)
(3.8
,6.
8)(0
.2,
6.5)
7.2
4.5
4.4
2.9
(6.2
,8.
2)(2
.9,
6.0)
(3.1
,5.
7)(0
.8,
4.9)
Perc
eive
dhe
alth
stat
us
Exc
elle
nt,
very
good
,go
odFa
iror
poor
10.5
22.2
(9.4
,11
.6)
(18.
0,26
.4)
6.9
18.3
(6.0
,7.
8)(1
2.1,
24.6
)6.
417
.8(5
.7,
7.2)
(12.
6,23
.0)
6.0
21.1
(5.2
,6.
9)(1
2.9,
29.3
)5.
918
.1(5
.1,
6.6)
(10.
8,25
.3)
Reg
ion
Nor
thea
stM
idw
est
Sout
hW
est
13.9
12.4 9.9
12.5
(11.
9,15
.8)
(10.
3,14
.4)
(7.3
,12
.5)
(9.9
,15
.1)
9.3
9.5
5.0
6.7
(6.8
,11
.9)
(7.4
,11
.6)
(3.6
,6.
3)(5
.4,
8.0)
9.1
8.3
6.2
4.3
(7.4
,10
.8)
(6.5
,10
.1)
(5.0
,7.
4)(3
.0,
5.5)
8.3
7.8
5.5
5.0
(6.5
,10
.1)
(5.7
,9.
8)(4
.4,
6.6)
(2.9
,7.
2)
8.3
7.2
5.5
4.4
(6.3
,10
.3)
(5.7
,8.
8)(4
.2,
6.7)
(3.1
,5.
7)
MSA M
SAN
on-M
SA12
.111
.0(1
1.0,
13.1
)(7
.5,
14.5
)7.
27.
4(6
.2,
8.2)
(5.3
,9.
6)6.
77.
2(5
.9,
7.5)
(5.3
,9.
0)6.
56.
3(5
.4,
7.5)
(4.9
,7.
8)6.
16.
1(5
.3,
6.9)
(4.5
,7.
7)
Pove
rty
stat
us
,20
0%of
pove
rty
line
$20
0%of
pove
rty
line
12.4
11.3
(10.
3,14
.5)
(10.
1,12
.5)
6.3
8.0
(5.2
,7.
4)(6
.8,
9.1)
6.0
7.3
(5.0
,6.
9)(6
.3,
8.3)
6.3
6.5
(5.3
,7.
3)(5
.3,
7.7)
5.0
6.9
(4.0
,5.
9)(5
.9,
7.9)
*Sou
rce:
1987
Nat
iona
lM
edic
alE
xpen
ditu
reSu
rvey
(NM
ES)
;19
96–1
999
Med
ical
Exp
endi
ture
Pane
lSu
rvey
(ME
PS).
Age
ncy
for
Hea
lthca
reR
esea
rch
and
Qua
lity.
CI
indi
cate
sco
nfide
nce
inte
rval
;M
SA,
met
ropo
litan
stat
istic
alar
ea.

Tab
leA
-3.
Hos
pita
lIn
patie
ntU
sefo
rC
hild
ren
17Y
ears
ofA
gean
dY
oung
erby
Yea
r*
Cha
ract
eris
tic
1987
Perc
ent
With
Any
Dis
char
ges
95%
CI
1996
Perc
ent
With
Any
Dis
char
ges
95%
CI
1997
Perc
ent
With
Any
Dis
char
ges
95%
CI
1998
Perc
ent
With
Any
Dis
char
ges
95%
CI
1999
Perc
ent
With
Any
Dis
char
ges
95%
CI
Tota
l4.
7(4
.1,
5.3)
2.9
(2.4
,3.
5)2.
7(2
.3,
3.2)
2.9
(2.5
,3.
4)2.
6(2
.1,
3.1)
Hea
lthin
sura
nce
cove
rage
Any
priv
ate
Publ
icon
lyU
nins
ured
4.6
6.4
3.0
(4.0
,5.
3)(4
.8,
7.9)
(1.8
,4.
2)
2.4
5.4
1.9
(1.8
,2.
9)(3
.9,
6.8)
(0.8
,3.
0)
2.4
4.2
2.1
(1.9
,2.
9)(3
.2,
5.2)
(0.8
,3.
4)
2.7
4.1
2.2
(2.1
,3.
3)(3
.1,
5.1)
(0.9
,3.
5)
2.3
4.1
2.0
(1.8
,2.
8)(2
.9,
5.2)
(0.7
,3.
3)
Age
0–
4y
5–9
y10
–14
y15
–17
y
9.7
2.0
1.8
5.0
(8.3
,11
.2)
(1.4
,2.
7)(1
.2,
2.4)
(3.7
,6.
3)
5.2
2.1
1.0
3.8
(4.0
,6.
3)(1
.2,
3.0)
(0.5
,1.
5)(2
.5,
5.1)
5.6
1.5
1.3
2.6
(4.3
,6.
8)(1
.0,
1.9)
(0.8
,1.
8)(1
.7,
3.5)
5.1
1.7
1.7
3.6
(4.0
,6.
1)(0
.9,
2.5)
(1.1
,2.
2)(2
.3,
4.9)
5.2
1.6
1.2
2.7
(4.1
,6.
3)(0
.8,
2.3)
(0.7
,1.
8)(1
.2,
4.1)
Sex M
ale
Fem
ale
4.4
5.1
(3.7
,5.
0)(4
.3,
5.9)
2.9
3.0
(2.2
,3.
6)(2
.2,
3.8)
3.0
2.4
(2.4
,3.
7)(1
.9,
2.9)
3.3
2.6
(2.6
,3.
9)(1
.9,
3.3)
3.2
2.0
(2.5
,4.
0)(1
.4,
2.6)
Rac
e/E
thni
city
Whi
te,
non-
His
pani
cA
fric
anA
mer
ican
,no
n-H
ispa
nic
His
pani
cO
ther
,no
n-H
ispa
nic
5.0
4.6
4.0
2.8
(4.3
,5.
6)(3
.4,
5.7)
(2.3
,5.
7)(0
.7,
5.0)
2.8
3.5
3.3
1.4
(2.2
,3.
5)(2
.0,
5.0)
(2.1
,4.
5)(0
.2,
2.9)
2.6
3.6
2.8
1.2
(2.0
,3.
2)(2
.4,
4.8)
(2.1
,3.
5)(0
.1,
2.3)
2.9
3.2
3.1
1.9
(2.2
,3.
6)(2
.0,
4.4)
(2.2
,3.
9)(0
.0,
3.9)
2.6
2.2
2.9
4.1
(2.0
,3.
2)(1
.2,
3.1)
(2.0
,3.
8)(1
.0,
7.2)
Perc
eive
dhe
alth
stat
us
Exc
elle
nt,
very
good
,go
odFa
iror
poor
3.0
9.3
(2.5
,3.
5)(6
.6,
12.0
)2.
613
.2(2
.0,
3.1)
(7.7
,18
.8)
2.2
14.6
(1.8
,2.
6)(1
0.1,
19.1
)2.
611
.6(2
.2,
3.0)
(6.1
,17
.1)
2.2
14.2
(1.7
,2.
7)(7
.1,
21.3
)
Reg
ion
Nor
thea
stM
idw
est
Sout
h
4.7
6.0
4.2
(3.4
,5.
9)(4
.9,
7.0)
(3.3
,5.
2)
2.3
3.5
3.3
(1.4
,3.
2)(2
.4,
4.7)
(2.3
,4.
4)
1.9
3.5
3.1
(1.1
,2.
7)(2
.4,
4.6)
(2.4
,3.
9)
2.5
3.2
3.0
(1.8
,3.
2)(2
.0,
4.3)
(2.4
,3.
6)
3.4
1.8
2.9
(1.9
,4.
9)(1
.1,
2.6)
(2.2
,3.
7)W
est
4.0
(2.4
,5.
5)2.
3(1
.2,
3.3)
2.0
(1.3
,2.
6)2.
9(1
.8,
4.1)
2.5
(1.6
,3.
3)
MSA M
SAN
on-M
SA4.
45.
5(3
.8,
5.1)
(4.1
,6.
9)2.
93.
3(2
.3,
3.4)
(1.9
,4.
7)2.
72.
8(2
.2,
3.2)
(2.0
,3.
6)2.
93.
0(2
.4,
3.4)
(1.6
,4.
4)2.
43.
7(1
.9,
2.9)
(2.5
,4.
9)
Pove
rty
stat
us
,20
0%of
pove
rty
line
$20
0%of
pove
rty
line
5.0
4.5
(4.2
,5.
9)(3
.7,
5.3)
3.9
2.2
(3.0
,4.
8)(1
.6,
2.8)
3.3
2.3
(2.7
,4.
0)(1
.8,
2.8)
3.4
2.7
(2.5
,4.
2)(2
.0,
3.3)
3.6
2.0
(2.8
,4.
5)(1
.4,
2.5)
*Sou
rce:
1987
Nat
iona
lM
edic
alE
xpen
ditu
reSu
rvey
(NM
ES)
;19
96–1
999
Med
ical
Exp
endi
ture
Pane
lSu
rvey
(ME
PS).
Age
ncy
for
Hea
lthca
reR
esea
rch
and
Qua
lity.
CI
indi
cate
sco
nfide
nce
inte
rval
;M
SA,
met
ropo
litan
stat
istic
alar
ea.

Tab
leA
-4.
Em
erge
ncy
Dep
artm
ent
Use
for
Chi
ldre
n17
Yea
rsof
Age
and
You
nger
byY
ear*
Cha
ract
eris
tic
1987
Perc
ent
With
Any
Vis
its95
%C
I
1996
Perc
ent
With
Any
Vis
its95
%C
I
1997
Perc
ent
With
Any
Vis
its95
%C
I
1998
Perc
ent
With
Any
Vis
its95
%C
I
1999
Perc
ent
With
Any
Vis
its95
%C
I
Tota
l17
.1(1
6.0,
18.2
)12
.9(1
1.9,
14.0
)11
.9(1
1.1,
12.8
)11
.8(1
0.9,
12.8
)11
.1(1
0.3,
12.0
)
Hea
lthin
sura
nce
cove
rage
Any
priv
ate
Publ
icon
lyU
nins
ured
16.8
21.9
12.6
(15.
6,18
.0)
(18.
8,25
.1)
(10.
0,15
.2)
12.5
15.5
10.8
(11.
3,13
.7)
(13.
1,17
.9)
(8.2
,13
.4)
11.6
14.2 9.7
(10.
6,12
.6)
(12.
4,16
.0)
(7.4
,12
.0)
11.4
14.7 9.0
(10.
1,12
.6)
(12.
6,16
.8)
(6.3
,11
.7)
11.1
12.7 7.8
(10.
0,12
.2)
(10.
7,14
.6)
(5.2
,10
.3)
Age
0–
4y
5–9
y10
–14
y15
–17
y
22.2
16.0
12.5
17.4
(20.
1,24
.2)
(14.
2,17
.8)
(11.
0,13
.9)
(15.
3,19
.6)
15.9
11.2
11.7
13.1
(13.
9,17
.8)
(9.3
,13
.0)
(9.8
,13
.5)
(10.
6,15
.7)
16.1
10.3 9.3
12.4
(14.
2,18
.1)
(8.9
,11
.7)
(7.9
,10
.6)
(10.
4,14
.5)
16.8
10.5 8.9
11.1
(14.
8,18
.8)
(8.8
,12
.2)
(7.2
,10
.6)
(8.8
,13
.3)
15.0 9.0
8.8
12.6
(13.
0,17
.0)
(7.5
,10
.5)
(7.2
,10
.4)
(10.
2,15
.0)
Sex M
ale
Fem
ale
19.3
14.9
(17.
8,20
.7)
(13.
5,16
.3)
13.8
12.1
(12.
4,15
.1)
(10.
7,13
.4)
12.5
11.4
(11.
3,13
.7)
(10.
1,12
.6)
12.5
11.1
(11.
1,13
.9)
(9.9
,12
.4)
12.7 9.5
(11.
4,14
.0)
(8.3
,10
.7)
Rac
e/E
thni
city
Whi
te,
non-
His
pani
cA
fric
anA
mer
ican
,no
n-H
ispa
nic
His
pani
cO
ther
,no
n-H
ispa
nic
17.7
18.5
12.6
14.6
(16.
3,19
.0)
(16.
6,20
.4)
(9.5
,15
.7)
(10.
4,18
.7)
14.4
10.3
11.1 7.2
(13.
0,15
.8)
(8.1
,12
.6)
(9.5
,12
.8)
(3.8
,10
.5)
12.2
12.1
11.7 8.4
(11.
0,13
.4)
(10.
2,13
.9)
(10.
2,13
.2)
(4.6
,12
.1)
12.4
13.3 9.9
4.7
(11.
1,13
.7)
(10.
9,15
.7)
(8.1
,11
.7)
(1.4
,8.
0)
11.4
11.3
10.4 8.9
(10.
3,12
.5)
(8.9
,13
.8)
(8.6
,12
.2)
(4.5
,13
.4)
Perc
eive
dhe
alth
stat
us
Exc
elle
nt,
very
good
,go
odFa
iror
poor
16.6
31.6
(15.
4,17
.8)
(26.
8,36
.5)
12.8
22.7
(11.
7,13
.8)
(15.
7,29
.7)
11.5
30.3
(10.
6,12
.4)
(23.
7,36
.8)
11.7
21.3
(10.
7,12
.7)
(14.
7,27
.8)
10.9
25.7
(10.
0,11
.8)
(16.
8,34
.5)
Reg
ion
Nor
thea
stM
idw
est
Sout
hW
est
19.8
17.9
16.2
15.2
(17.
8,21
.8)
(15.
7,20
.2)
(14.
2,18
.3)
(13.
3,17
.1)
14.2
16.2
12.6 9.3
(11.
8,16
.7)
(13.
6,18
.7)
(10.
8,14
.4)
(7.7
,10
.8)
9.9
13.6
13.8 9.3
(7.9
,11
.9)
(11.
6,15
.5)
(12.
2,15
.3)
(7.8
,10
.8)
11.1
13.4
13.4 8.7
(9.2
,13
.1)
(11.
1,15
.6)
(11.
6,15
.1)
(7.1
,10
.2)
11.1
13.5
11.7 8.0
(8.7
,13
.5)
(11.
4,15
.6)
(10.
2,13
.3)
(6.8
,9.
2)
MSA M
SAN
on-M
SA16
.818
.1(1
5.7,
17.9
)(1
5.3,
20.8
)12
.415
.3(1
1.2,
13.5
)(1
2.8,
17.7
)11
.414
.4(1
0.4,
12.3
)(1
2.3,
16.6
)11
.214
.9(1
0.1,
12.2
)(1
2.4,
17.3
)10
.812
.8(9
.8,
11.7
)(1
0.8,
14.9
)
Pove
rty
stat
us
,20
0%of
pove
rty
line
$20
0%of
pove
rty
line
19.3
15.6
(17.
5,21
.0)
(14.
4,16
.8)
13.7
12.4
(12.
2,15
.2)
(11.
0,13
.7)
13.8
10.6
(12.
5,15
.0)
(9.5
,11
.8)
13.3
10.9
(11.
8,14
.8)
(9.4
,12
.3)
12.7
10.1
(11.
3,14
.2)
(9.0
,11
.2)
*Sou
rce:
1987
Nat
iona
lM
edic
alE
xpen
ditu
reSu
rvey
(NM
ES)
;19
96–1
999
Med
ical
Exp
endi
ture
Pane
lSu
rvey
(ME
PS).
Age
ncy
for
Hea
lthca
reR
esea
rch
and
Qua
lity.
CI
indi
cate
sco
nfide
nce
inte
rval
;M
SA,
met
ropo
litan
stat
istic
alar
ea.

Tab
leA
-5.
Den
tal
Use
for
Chi
ldre
n17
Yea
rsof
Age
and
You
nger
byY
ear*
Cha
ract
eris
tic
1987
Perc
ent
With
Any
Vis
its95
%C
I
1996
Perc
ent
With
Any
Vis
its95
%C
I
1997
Perc
ent
With
Any
Vis
its95
%C
I
1998
Perc
ent
With
Any
Vis
its95
%C
I
1999
Perc
ent
With
Any
Vis
its95
%C
I
Tota
l40
.1(3
8.3,
41.9
)42
.5(4
0.5,
44.5
)41
.3(3
9.5,
43.2
)42
.1(4
0.1,
44.1
)42
.1(4
0.2,
44.1
)
Hea
lthin
sura
nce
cove
rage
Any
priv
ate
Publ
icon
lyU
nins
ured
45.9
25.7
18.7
(43.
9,47
.9)
(22.
5,28
.8)
(15.
7,21
.8)
50.1
28.6
20.7
(47.
6,52
.6)
(25.
2,32
.0)
(16.
3,25
.1)
48.2
28.5
22.0
(46.
1,50
.4)
(25.
9,31
.2)
(18.
4,25
.5)
49.8
27.3
20.4
(47.
4,52
.3)
(24.
0,30
.6)
(16.
2,24
.5)
48.8
27.5
19.5
(46.
5,51
.1)
(24.
2,30
.8)
(15.
0,23
.9)
Age
0–
4y
5–9
y10
–14
y15
–17
y
13.7
51.8
51.8
47.7
(12.
1,15
.2)
(48.
6,55
.0)
(49.
0,54
.7)
(44.
8,50
.6)
15.6
53.2
54.3
50.0
(13.
6,17
.6)
(49.
8,56
.6)
(51.
1,57
.5)
(46.
0,53
.9)
13.4
50.5
53.4
51.2
(11.
5,15
.2)
(47.
5,53
.5)
(50.
5,56
.3)
(48.
0,54
.5)
16.6
50.8
53.0
49.9
(14.
5,18
.7)
(47.
3,54
.3)
(49.
5,56
.5)
(46.
1,53
.7)
13.7
52.4
55.6
48.2
(11.
8,15
.6)
(49.
1,55
.8)
(52.
4,58
.8)
(44.
3,52
.0)
Sex M
ale
Fem
ale
39.2
41.0
(37.
2,41
.1)
(38.
7,43
.4)
41.6
43.5
(30.
0,44
.1)
(41.
1,45
.9)
39.4
43.3
(37.
2,41
.7)
(41.
1,45
.5)
41.1
43.1
(38.
6,43
.6)
(40.
5,45
.7)
41.0
43.3
(38.
7,43
.3)
(41.
0,45
.7)
Rac
e/E
thni
city
Whi
te,
non-
His
pani
cA
fric
anA
mer
ican
,no
n-H
ispa
nic
His
pani
cO
ther
,no
n-H
ispa
nic
46.3
24.7
23.7
33.5
(44.
1,48
.6)
(22.
0,27
.4)
(20.
4,26
.9)
(24.
7,42
.3)
49.3
27.2
29.2
42.2
(46.
5,52
.0)
(23.
3,31
.1)
(26.
3,32
.0)
(33.
0,51
.3)
47.7
28.0
27.7
43.6
(45.
4,50
.1)
(24.
9,31
.1)
(25.
1,30
.4)
(36.
2,50
.9)
49.4
28.9
25.9
41.7
(46.
7,52
.0)
(24.
7,33
.0)
(23.
2,28
.6)
(32.
6,50
.8)
49.7
29.6
24.3
40.9
(47.
1,52
.3)
(24.
8,34
.5)
(21.
7,27
.0)
(30.
5,51
.2)
Perc
eive
dhe
alth
stat
us
Exc
elle
nt,
very
good
,go
odFa
iror
poor
44.3
34.6
(42.
2,46
.3)
(28.
9,40
.3)
43.3
36.3
(41.
2,45
.3)
(28.
4,44
.1)
42.1
32.9
(40.
3,44
.0)
(26.
2,39
.6)
42.7
30.2
(40.
7,44
.8)
(22.
0,38
.3)
42.9
30.6
(41.
0,44
.9)
(22.
5,38
.8)
Reg
ion
Nor
thea
stM
idw
est
Sout
hW
est
46.6
44.9
34.1
38.7
(41.
7,51
.6)
(42.
1,47
.7)
(31.
4,36
.7)
(33.
9,43
.5)
43.9
52.6
36.0
40.8
(39.
1,48
.8)
(48.
6,56
.6)
(32.
7,39
.2)
(36.
8,44
.8)
45.3
47.3
36.3
39.7
(40.
6,50
.0)
(43.
8,50
.8)
(33.
5,39
.2)
(36.
0,43
.4)
45.4
48.0
36.1
42.1
(40.
3,50
.5)
(43.
5,52
.4)
(33.
2,39
.0)
(37.
8,46
.3)
48.3
46.6
36.9
40.4
(43.
6,52
.9)
(42.
7,50
.6)
(33.
7,40
.0)
(36.
6,44
.1)
MSA M
SAN
on-M
SA40
.738
.3(3
8.6,
42.9
)(3
5.0,
41.7
)42
.741
.8(4
0.4,
45.0
)(3
7.9,
45.7
)42
.039
.1(3
9.9,
44.0
)(3
5.8,
42.4
)42
.839
.2(4
0.6,
45.0
)(3
4.0,
44.4
)41
.943
.2(3
9.8,
44.0
)(3
8.3,
48.2
)
Pove
rty
stat
us
,20
0%of
pove
rty
line
$20
0%of
pove
rty
line
26.8
49.6
(24.
5,29
.0)
(47.
3,51
.8)
28.1
53.6
(25.
7,30
.5)
(51.
0,56
.1)
28.9
50.2
(26.
6,31
.2)
(47.
7,52
.6)
26.9
52.2
(24.
5,29
.2)
(49.
6,54
.9)
26.9
52.2
(24.
8,29
.0)
(49.
5,54
.9)
*Sou
rce:
1987
Nat
iona
lM
edic
alE
xpen
ditu
reSu
rvey
(NM
ES)
;19
96–1
999
Med
ical
Exp
endi
ture
Pane
lSu
rvey
(ME
PS).
Age
ncy
for
Hea
lthca
reR
esea
rch
and
Qua
lity.
CI
indi
cate
sco
nfide
nce
inte
rval
;M
SA,
met
ropo
litan
stat
istic
alar
ea.

Tab
leA
-6.
Pres
crip
tion
(Scr
ipts
)M
edic
ine
Use
for
Chi
ldre
n17
Yea
rsof
Age
and
You
nger
byY
ear*
Cha
ract
eris
tic
1987
Perc
ent
With
Any
Scri
pts
95%
CI
1996
Perc
ent
With
Any
Scri
pts
95%
CI
1997
Perc
ent
With
Any
Scri
pts
95%
CI
1998
Perc
ent
With
Any
Scri
pts
95%
CI
1999
Perc
ent
With
Any
Scri
pts
95%
CI
Tota
l50
.9(4
9.3,
52.5
)55
.6(5
4.1,
57.1
)52
.5(5
1.1,
54.0
)50
.5(4
8.9,
52.1
)50
.3(4
8.5,
52.0
)
Hea
lthin
sura
nce
cove
rage
Any
priv
ate
Publ
icon
lyU
nins
ured
54.2
45.6
34.5
(52.
6,55
.8)
(41.
9,49
.4)
(30.
4,38
.6)
59.1
52.9
38.4
(57.
1,61
.0)
(49.
7,56
.1)
(34.
0,42
.8)
54.8
52.2
38.7
(52.
9,56
.6)
(49.
3,55
.1)
(34.
6,42
.7)
53.2
49.8
33.2
(51.
2,55
.2)
(46.
8,52
.9)
(29.
0,37
.3)
52.8
49.5
29.8
(50.
8,54
.8)
(46.
1,52
.9)
(25.
5,34
.1)
Age
0–
4y
5–9
y10
–14
y15
–17
y
63.1
51.7
40.4
44.8
(60.
9,65
.4)
(49.
3,54
.1)
(37.
8,43
.1)
(42.
2,47
.4)
65.7
58.8
46.0
49.3
(62.
8,68
.7)
(56.
2,61
.4)
(43.
1,48
.8)
(45.
5,53
.2)
62.5
53.0
45.9
46.2
(59.
9,65
.2)
(50.
6,55
.4)
(43.
2,48
.5)
(43.
0,49
.3)
59.4
50.5
44.4
46.5
(56.
4,62
.3)
(47.
6,53
.5)
(41.
7,47
.0)
(42.
8,50
.2)
59.6
49.9
44.3
45.5
(56.
6,62
.7)
(46.
9,53
.0)
(41.
4,47
.2)
(42.
1,48
.9)
Sex M
ale
Fem
ale
50.1
51.8
(48.
2,51
.9)
(49.
8,53
.7)
55.8
55.4
(53.
7,57
.9)
(53.
3,57
.4)
52.5
52.6
(50.
4,54
.5)
(50.
6,54
.5)
50.0
51.0
(47.
8,52
.3)
(48.
9,53
.2)
50.6
49.9
(48.
4,52
.8)
(47.
6,52
.2)
Rac
e/E
thni
city
Whi
te,
non-
His
pani
cA
fric
anA
mer
ican
,no
n-H
ispa
nic
His
pani
cO
ther
,no
n-H
ispa
nic
57.0
34.9
39.1
37.5
(55.
3,58
.6)
(31.
7,38
.1)
(35.
2,43
.0)
(29.
8,45
.2)
60.5
43.9
49.4
45.2
(58.
5,62
.6)
(39.
9,47
.8)
(45.
7,53
.0)
(38.
6,51
.8)
57.0
42.0
47.8
41.4
(55.
1,58
.9)
(38.
9,45
.2)
(45.
4,50
.2)
(34.
6,48
.1)
56.2
37.4
44.4
35.5
(54.
3,58
.0)
(33.
4,41
.4)
(41.
7,47
.1)
(26.
2,44
.8)
55.7
38.7
42.0
41.3
(53.
3,58
.1)
(34.
6,42
.9)
(39.
2,44
.7)
(33.
7,48
.9)
Perc
eive
dhe
alth
stat
us
Exc
elle
nt,
very
good
,go
odFa
iror
poor
50.6
65.8
(49.
0,52
.3)
(60.
7,70
.8)
55.6
76.1
(54.
1,57
.2)
(69.
0,83
.3)
52.1
82.9
(50.
6,53
.6)
(78.
3,87
.6)
50.0
80.5
(48.
4,51
.6)
(71.
9,89
.1)
49.9
85.2
(48.
1,51
.7)
(78.
6,91
.7)
Reg
ion
Nor
thw
est
Mid
wes
tSo
uth
Wes
t
53.9
54.4
46.8
51.0
(50.
6,57
.2)
(51.
8,57
.0)
(43.
8,49
.8)
(48.
4,53
.7)
58.3
59.4
54.2
51.7
(54.
6,61
.9)
(56.
3,62
.4)
(51.
7,56
.8)
(48.
7,54
.8)
47.4
54.6
54.4
51.6
(43.
9,50
.9)
(51.
5,57
.6)
(51.
8,57
.0)
(48.
8,54
.5)
47.8
53.1
50.7
49.7
(44.
2,51
.4)
(49.
8,56
.5)
(47.
9,53
.5)
(46.
3,53
.0)
54.6
53.0
49.2
45.9
(50.
5,58
.7)
(48.
9,57
.1)
(46.
2,52
.1)
(43.
1,48
.8)
MSA M
SAN
on-M
SA50
.651
.8(4
8.8,
52.3
)(4
8.3,
55.3
)55
.556
.4(5
3.8,
57.1
)(5
2.6,
60.2
)51
.756
.2(5
0.1,
53.4
)(5
3.1,
59.3
)49
.654
.6(4
7.8,
51.5
)(5
1.9,
57.4
)49
.852
.5(4
7.8,
51.8
)(4
8.8,
56.1
)
Pove
rty
stat
us
,20
0%of
pove
rty
line
$20
0%of
pove
rty
line
43.0
56.5
(40.
9,45
.2)
(54.
9,58
.1)
50.2
59.7
(47.
9,52
.5)
(57.
6,61
.8)
47.3
56.2
(45.
3,49
.4)
(54.
2,58
.2)
45.0
54.2
(42.
6,47
.4)
(52.
0,56
.4)
47.3
52.2
(44.
8,49
.8)
(50.
0,54
.5)
*Sou
rce:
1987
Nat
iona
lM
edic
alE
xpen
ditu
reSu
rvey
(NM
ES)
;19
96–1
999
Med
ical
Exp
endi
ture
Pane
lSu
rvey
(ME
PS).
Age
ncy
for
Hea
lthca
reR
esea
rch
and
Qua
lity.
CI
indi
cate
sco
nfide
nce
inte
rval
;M
SA,
met
ropo
litan
stat
istic
alar
ea.
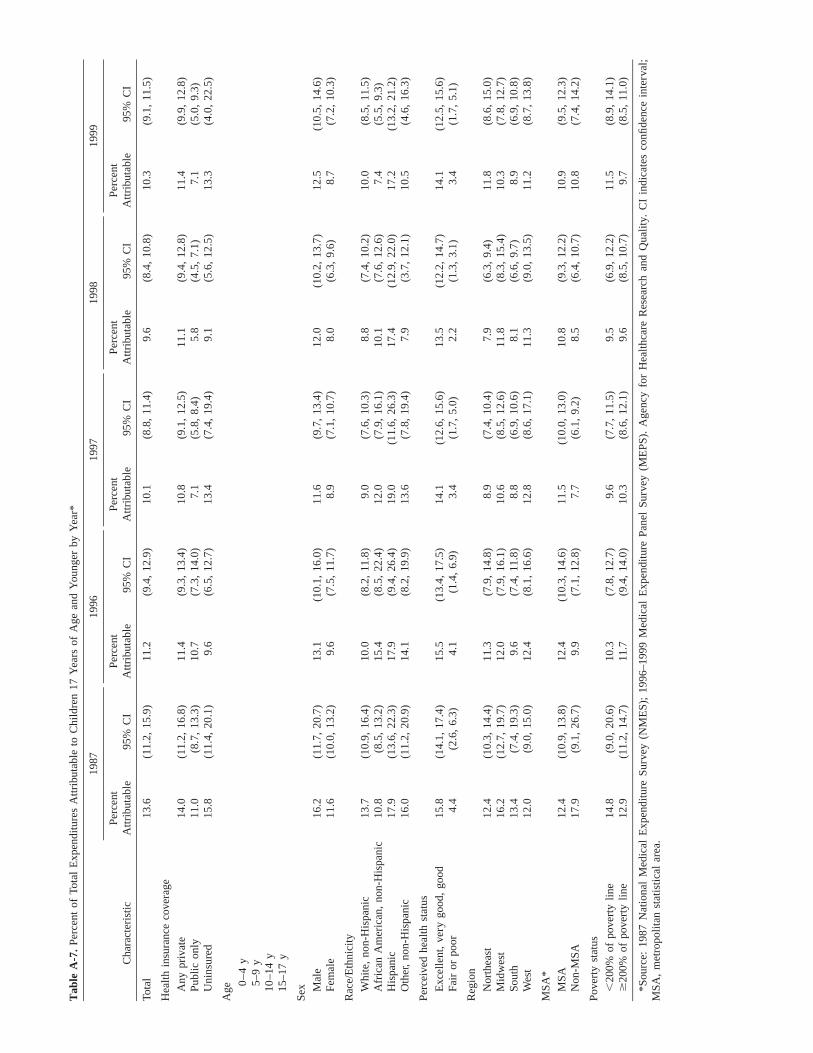
Tab
leA
-7.
Perc
ent
ofTo
tal
Exp
endi
ture
sA
ttrib
utab
leto
Chi
ldre
n17
Yea
rsof
Age
and
You
nger
byY
ear*
Cha
ract
eris
tic
1987
Perc
ent
Attr
ibut
able
95%
CI
1996
Perc
ent
Attr
ibut
able
95%
CI
1997
Perc
ent
Attr
ibut
able
95%
CI
1998
Perc
ent
Attr
ibut
able
95%
CI
1999
Perc
ent
Attr
ibut
able
95%
CI
Tota
l13
.6(1
1.2,
15.9
)11
.2(9
.4,
12.9
)10
.1(8
.8,
11.4
)9.
6(8
.4,
10.8
)10
.3(9
.1,
11.5
)
Hea
lthin
sura
nce
cove
rage
Any
priv
ate
Publ
icon
lyU
nins
ured
14.0
11.0
15.8
(11.
2,16
.8)
(8.7
,13
.3)
(11.
4,20
.1)
11.4
10.7 9.6
(9.3
,13
.4)
(7.3
,14
.0)
(6.5
,12
.7)
10.8 7.1
13.4
(9.1
,12
.5)
(5.8
,8.
4)(7
.4,
19.4
)
11.1 5.8
9.1
(9.4
,12
.8)
(4.5
,7.
1)(5
.6,
12.5
)
11.4 7.1
13.3
(9.9
,12
.8)
(5.0
,9.
3)(4
.0,
22.5
)
Age
0–
4y
5–9
y10
–14
y15
–17
y
Sex M
ale
Fem
ale
16.2
11.6
(11.
7,20
.7)
(10.
0,13
.2)
13.1 9.6
(10.
1,16
.0)
(7.5
,11
.7)
11.6 8.9
(9.7
,13
.4)
(7.1
,10
.7)
12.0 8.0
(10.
2,13
.7)
(6.3
,9.
6)12
.5 8.7
(10.
5,14
.6)
(7.2
,10
.3)
Rac
e/E
thni
city
Whi
te,
non-
His
pani
cA
fric
anA
mer
ican
,no
n-H
ispa
nic
His
pani
cO
ther
,no
n-H
ispa
nic
13.7
10.8
17.9
16.0
(10.
9,16
.4)
(8.5
,13
.2)
(13.
6,22
.3)
(11.
2,20
.9)
10.0
15.4
17.9
14.1
(8.2
,11
.8)
(8.5
,22
.4)
(9.4
,26
.4)
(8.2
,19
.9)
9.0
12.0
19.0
13.6
(7.6
,10
.3)
(7.9
,16
.1)
(11.
6,26
.3)
(7.8
,19
.4)
8.8
10.1
17.4 7.9
(7.4
,10
.2)
(7.6
,12
.6)
(12.
9,22
.0)
(3.7
,12
.1)
10.0 7.4
17.2
10.5
(8.5
,11
.5)
(5.5
,9.
3)(1
3.2,
21.2
)(4
.6,
16.3
)
Perc
eive
dhe
alth
stat
us
Exc
elle
nt,
very
good
,go
odFa
iror
poor
15.8 4.4
(14.
1,17
.4)
(2.6
,6.
3)15
.5 4.1
(13.
4,17
.5)
(1.4
,6.
9)14
.1 3.4
(12.
6,15
.6)
(1.7
,5.
0)13
.5 2.2
(12.
2,14
.7)
(1.3
,3.
1)14
.1 3.4
(12.
5,15
.6)
(1.7
,5.
1)
Reg
ion
Nor
thea
stM
idw
est
Sout
h
12.4
16.2
13.4
(10.
3,14
.4)
(12.
7,19
.7)
(7.4
,19
.3)
11.3
12.0 9.6
(7.9
,14
.8)
(7.9
,16
.1)
(7.4
,11
.8)
8.9
10.6 8.8
(7.4
,10
.4)
(8.5
,12
.6)
(6.9
,10
.6)
7.9
11.8 8.1
(6.3
,9.
4)(8
.3,
15.4
)(6
.6,
9.7)
11.8
10.3 8.9
(8.6
,15
.0)
(7.8
,12
.7)
(6.9
,10
.8)
Wes
t12
.0(9
.0,
15.0
)12
.4(8
.1,
16.6
)12
.8(8
.6,
17.1
)11
.3(9
.0,
13.5
)11
.2(8
.7,
13.8
)
MSA
*
MSA
Non
-MSA
12.4
17.9
(10.
9,13
.8)
(9.1
,26
.7)
12.4 9.9
(10.
3,14
.6)
(7.1
,12
.8)
11.5 7.7
(10.
0,13
.0)
(6.1
,9.
2)10
.8 8.5
(9.3
,12
.2)
(6.4
,10
.7)
10.9
10.8
(9.5
,12
.3)
(7.4
,14
.2)
Pove
rty
stat
us
,20
0%of
pove
rty
line
$20
0%of
pove
rty
line
14.8
12.9
(9.0
,20
.6)
(11.
2,14
.7)
10.3
11.7
(7.8
,12
.7)
(9.4
,14
.0)
9.6
10.3
(7.7
,11
.5)
(8.6
,12
.1)
9.5
9.6
(6.9
,12
.2)
(8.5
,10
.7)
11.5 9.7
(8.9
,14
.1)
(8.5
,11
.0)
*Sou
rce:
1987
Nat
iona
lM
edic
alE
xpen
ditu
reSu
rvey
(NM
ES)
;19
96–1
999
Med
ical
Exp
endi
ture
Pane
lSu
rvey
(ME
PS).
Age
ncy
for
Hea
lthca
reR
esea
rch
and
Qua
lity.
CI
indi
cate
sco
nfide
nce
inte
rval
;M
SA,
met
ropo
litan
stat
istic
alar
ea.
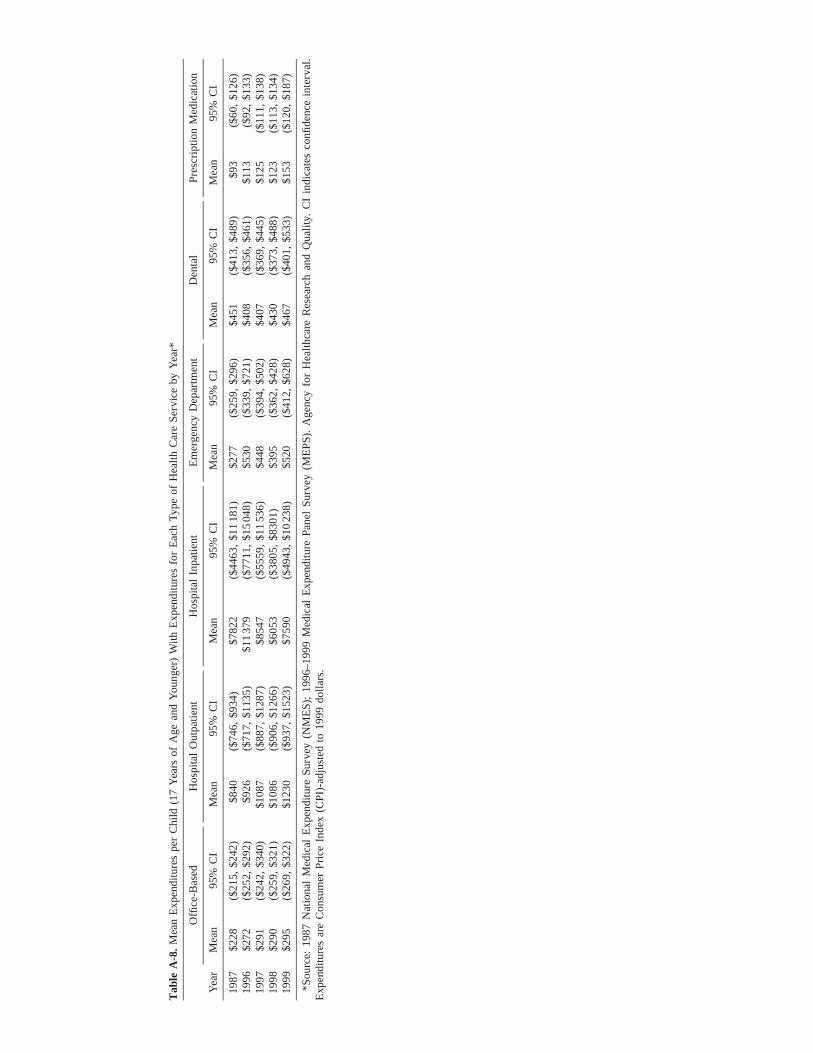
Tab
leA
-8.
Mea
nE
xpen
ditu
res
per
Chi
ld(1
7Y
ears
ofA
gean
dY
oung
er)
With
Exp
endi
ture
sfo
rE
ach
Typ
eof
Hea
lthC
are
Serv
ice
byY
ear*
Yea
r
Offi
ce-B
ased
Mea
n95
%C
I
Hos
pita
lO
utpa
tient
Mea
n95
%C
I
Hos
pita
lIn
patie
nt
Mea
n95
%C
I
Em
erge
ncy
Dep
artm
ent
Mea
n95
%C
I
Den
tal
Mea
n95
%C
I
Pres
crip
tion
Med
icat
ion
Mea
n95
%C
I
1987
1996
1997
1998
1999
$228
$272
$291
$290
$295
($21
5,$2
42)
($25
2,$2
92)
($24
2,$3
40)
($25
9,$3
21)
($26
9,$3
22)
$840
$926
$108
7$1
086
$123
0
($74
6,$9
34)
($71
7,$1
135)
($88
7,$1
287)
($90
6,$1
266)
($93
7,$1
523)
$782
2$1
137
9$8
547
$605
3$7
590
($44
63,
$11
181)
($77
11,
$15
048)
($55
59,
$11
536)
($38
05,
$830
1)($
4943
,$1
023
8)
$277
$530
$448
$395
$520
($25
9,$2
96)
($33
9,$7
21)
($39
4,$5
02)
($36
2,$4
28)
($41
2,$6
28)
$451
$408
$407
$430
$467
($41
3,$4
89)
($35
6,$4
61)
($36
9,$4
45)
($37
3,$4
88)
($40
1,$5
33)
$93
$113
$125
$123
$153
($60
,$1
26)
($92
,$1
33)
($11
1,$1
38)
($11
3,$1
34)
($12
0,$1
87)
*Sou
rce:
1987
Nat
iona
lM
edic
alE
xpen
ditu
reSu
rvey
(NM
ES)
;19
96–1
999
Med
ical
Exp
endi
ture
Pane
lSu
rvey
(ME
PS).
Age
ncy
for
Hea
lthca
reR
esea
rch
and
Qua
lity.
CI
indi
cate
sco
nfide
nce
inte
rval
.E
xpen
ditu
res
are
Con
sum
erPr
ice
Inde
x(C
PI)-
adju
sted
to19
99do
llars
.

Table A-9. Percent Distribution of Source of Payment for Total Health Care Expenditures for Children 17 Years of Age and Younger byYear*
Year
Total DollarExpenditures(in Millions) 95% CI
Percent Distribution of Source of Payment forChildren With Any Expenditures (95% CI)
Private Medicaid Out of Pocket Other
1996199719981999
$64 932$57 956$54 839$61 478
($54 373, $75 490)($50 230, $65 681)($48 125, $61 544)($53 382, $69 754)
55.1 (48.2, 62.1)54.3 (48.8, 59.8)56.4 (51.0, 61.9)50.9 (45.9, 55.9)
19.5 (13.2, 25.7)13.9 (11.3, 16.5)16.0 (12.3, 19.8)17.1 (12.5, 21.6)
20.2 (16.9, 23.5)24.2 (20.6, 27.9)22.4 (19.7, 25.1)22.7 (19.9, 25.4)
5.2 (1.9, 8.6)7.6 (4.8, 10.3)5.1 (3.5, 6.7)9.4 (5.7, 13.0)
*Source: 1996–1999 Medical Expenditure Panel Survey (MEPS). Agency for Healthcare Research and Quality. CI indicates confidenceinterval. Totals are total dollar expenditures for all health care services. Expenditures are Consumer Price Index (CPI)-adjusted to 1999dollars.

Tab
leA
-10.
Hea
lthC
are
Qua
lity
for
Chi
ldre
n17
Yea
rsof
Age
and
Und
er,
2000
–01†
Perc
enta
geof
Chi
ldre
n(9
5%C
I)
2000
Tota
lA
nyPr
ivat
eIn
sura
nce
Publ
ic-O
nly
Insu
ranc
eU
nins
ured
2001
Tota
lA
nyPr
ivat
eIn
sura
nce
Publ
ic-O
nly
Insu
ranc
eU
nins
ured
Perc
ent
ofch
ildre
nw
how
ent
todo
ctor
’sof
fice
orcl
inic
duri
ngth
ela
st12
mo
(exc
ludi
ngem
erge
ncy
room
).O
fth
ose:
78.0
(76.
2,79
.9)
82.4
(80.
6,84
.3)
77.7
(74.
0,81
.4)
57.6
(53.
0,62
.3)
75.8
(74.
2,77
.3)
79.5
(77.
9,81
.2)
77.0
(74,
80)
57.5
(53.
5,61
.5)
Perc
ent
dist
ribu
tion
byex
tent
ofpr
oble
min
rece
ivin
gne
cess
ary
care
Abi
gpr
oble
mA
smal
lpr
oble
mN
ota
prob
lem
1.9
(1.3
,2.
5)9.
5(8
.2,
10.8
)88
.6(8
7.2,
89.9
)
1.0
(0.6
,1.
3)7.
0(5
.7,
8.2)
92.1
(90.
8,93
.4)
3.8
(1.7
,6.
0)16
.5(1
3.1,
19.9
)79
.6(7
5.4,
83.9
)
4.1
(1.9
,6.
2)11
.7(8
.2,
15.2
)84
.2(7
9.7,
88.7
)
1.5
(1.1
,1.
9)6.
6(5
.8,
7.4)
91.9
(90.
9,92
.8)
1.2
(0.8
,1.
6)5.
7(4
.7,
6.6)
93.2
(92,
94.3
)
2.6
(1.7
,3.
4)7.
9(6
.4,
9.5)
89.5
(87.
7,91
.2)
1.4*
(0.5
,2.
3)9.
5(7
.2,
11.8
)89
.1(8
6.6,
91.6
)
Perc
ent
ofch
ildre
nw
hose
pare
ntor
ado
ctor
thou
ght
the
child
need
edto
see
asp
ecia
list.
Of
thos
e:18
.1(1
6.6,
19.5
)20
.5(1
8.6,
22.4
)15
.5(1
3.7,
17.4
)10
.4(7
.4,
13.4
)17
.4(1
6.3,
18.4
)19
.7(1
8.3,
21)
16.5
(14.
5,18
.5)
9.0
(7.2
,10
.8)
Perc
ent
dist
ribu
tion
byex
tent
ofpr
oble
min
getti
nga
refe
rral
toa
spec
ialis
tA
big
prob
lem
Asm
all
prob
lem
Not
apr
oble
m
5.4
(3.4
,7.
4)17
.1(1
3.9,
20.4
)77
.5(7
4.2,
80.8
)
3.9
(2.1
,5.
7)14
.9(1
1.6,
18.2
)81
.2(7
7.5,
84.9
)
8.7*
(3.2
,14
.3)
24.7
(16.
8,32
.5)
66.6
(59.
4,73
.8)
...
...
...
...
...
...
7.2
(5.5
,8.
8)9.
5(7
.6,
11.5
)83
.3(8
0.7,
86)
5.3
(3.4
,7.
2)9.
1(7
,11
.2)
85.5
(82.
5,88
.5)
13.2
(8.7
,17
.7)
12.1
(6.8
,17
.7)
74.7
(68.
4,81
)
7.1*
(2.6
,11
.7)
5.9*
(2.1
,9.
6)87
.0(8
1.1,
92.9
)
Perc
ent
ofch
ildre
nw
how
ent
toa
doct
or’s
offic
eor
clin
icdu
ring
the
last
12m
o(e
xclu
ding
emer
genc
yro
om).
Of
thos
e:78
.0(7
6.2,
79.9
)82
.4(8
0.6,
84.3
)77
.7(7
4.0,
81.4
)57
.6(5
3.0,
62.3
)75
.8(7
4.2,
77.3
)79
.5(7
7.9,
81.2
)77
.0(7
4.0,
80.0
)57
.5(5
3.5,
61.5
)
Perc
ent
dist
ribu
tion
ofho
wof
ten
heal
thpr
ovid
ers
liste
ned
care
fully
topa
rent
sN
ever
/Som
etim
esU
sual
lyA
lway
s
6.5
(5.4
,7.
6)28
.1(2
5.9,
30.2
)65
.5(6
3.2,
67.8
)
4.4
(3.3
,5.
5)28
.4(2
5.9,
31.0
)67
.2(6
4.7,
69.7
)
12.4
(9.2
,15
.7)
23.7
(20.
0,27
.4)
63.9
(59.
4,68
.4)
7.6
(4.8
,10
.3)
35.3
(29.
5,41
.2)
57.1
(50.
8,63
.4)
7.0
(6.1
,8)
21.8
(20.
1,23
.5)
71.1
(69.
3,73
)
5.1
(4.2
,6.
1)22
.3(2
0.4,
24.3
)72
.5(7
0.4,
74.7
)
11.1
(8.8
,13
.3)
21.6
(18.
2,24
.9)
67.4
(63.
7,71
.1)
10.1
(7.5
,12
.7)
19.4
(15.
9,23
)70
.5(6
6.4,
74.6
)
Perc
ent
dist
ribu
tion
ofho
wof
ten
heal
thpr
ovid
ers
expl
aine
dth
ings
clea
rly
topa
rent
sN
ever
/Som
etim
esU
sual
lyA
lway
s
5.7
(4.9
,6.
5)25
.9(2
3.7,
28.0
)68
.4(6
6.1,
70.8
)
3.4
(2.7
,4.
0)25
.7(2
3.1,
28.2
)70
.9(6
8.3,
73.6
)
11.9
(8.8
,15
.0)
24.4
(20.
3,28
.6)
63.7
(58.
9,68
.4)
8.0
(5.1
,11
.0)
30.4
(24.
1,36
.6)
61.6
(55.
3,67
.9)
5.8
(4.9
,6.
7)20
.0(1
8.1,
21.9
)74
.2(7
2.1,
76.3
)
3.8
(3.1
,4.
6)20
.6(1
8.5,
22.7
)75
.6(7
3.3,
77.8
)
10.2
(7.9
,12
.4)
18.3
(15,
21.7
)71
.5(6
7.6,
75.4
)
8.5
(6,
11)
19.8
(16,
23.6
)71
.7(6
7.2,
76.2
)
Perc
ent
dist
ribu
tion
ofho
wof
ten
heal
thpr
ovid
ers
show
edre
spec
tfo
rw
hat
pare
ntsa
idN
ever
/Som
etim
esU
sual
lyA
lway
s
6.3
(5.3
,7.
4)26
.3(2
4.4,
28.3
)67
.3(6
5.0,
69.6
)
4.6
(3.6
,5.
6)26
.0(2
3.7,
28.4
)69
.3(6
6.8,
71.8
)
11.4
(8.3
,14
.6)
23.7
(19.
8,27
.5)
64.9
(60.
1,69
.7)
6.9
(4.2
,9.
5)34
.5(2
8.2,
40.8
)58
.7(5
2.5,
64.9
)
6.0
(5.1
,6.
9)20
.4(1
8.5,
22.3
)73
.6(7
1.6,
75.6
)
4.2
(3.4
,5)
21.5
(19.
3,23
.6)
74.3
(72,
76.6
)
9.8
(7.5
,12
.1)
17.9
(14.
3,21
.5)
72.3
(68.
4,76
.2)
8.7
(6.2
,11
.2)
19.4
(16,
22.9
)71
.9(6
7.8,
75.9
)
*Est
imat
esw
itha
rela
tive
stan
dard
erro
rgr
eate
rth
an30
%.
†Sou
rce:
2000
–200
1M
edic
alE
xpen
ditu
rePa
nel
Surv
ey(M
EPS
).A
genc
yfo
rH
ealth
care
Res
earc
han
dQ
ualit
y.C
Iin
dica
tes
confi
denc
ein
terv
al;
ellip
ses
are
used
whe
nsa
mpl
esi
zes
are
too
smal
lto
prov
ide
relia
ble
estim
ates
.

Tab
leA
-11.
Chi
ldre
n’s
Hea
lthIn
sura
nce
Cov
erag
e,20
01(F
irst
Hal
fof
Yea
r)*
Cha
ract
eris
tic
Num
ber
ofC
hild
ren
(in
thou
sand
s)
Perc
ent
With
Any
Priv
ate
Insu
ranc
e95
%C
I
Perc
ent
With
Publ
icIn
sura
nce
Onl
y95
%C
I
Perc
ent
Uni
nsur
edT
hrou
ghou
tth
eFi
rst
Hal
fof
the
Yea
r95
%C
I
Tota
l72
650
63.1
(61.
2,65
)22
.3(2
0.6,
24.1
)14
.6(1
3.4,
15.7
)
Age ,
1y
1–4
y5–
9y
10–1
4y
15–1
7y
3870
1596
720
117
2062
212
075
53.5
6.7
62.1
65.2
67.6
(48.
6,58
.4)
(57.
9,63
.5)
(59.
5,64
.7)
(62.
6,67
.7)
(64.
7,70
.5)
34.8
26.3
24.5
19.5
14.4
(30,
39.6
)(2
3.7,
28.8
)(2
2.1,
26.8
)(1
7.1,
22)
(12.
1,16
.7)
11.7
13.0
13.4
15.3
18.0
(8.6
,14
.9)
(11.
2,14
.8)
(11.
8,15
)(1
3.3,
17.3
)(1
5.7,
20.3
)
Sex M
ale
Fem
ale
3735
635
294
63.6
62.6
(61.
4,65
.9)
(60.
4,64
.7)
21.7
23.1
(19.
7,23
.6)
(21,
25.1
)14
.714
.4(1
3.3,
16.1
)(1
3,15
.7)
Rac
e/E
thni
city
Whi
te,
non-
His
pani
cA
fric
anA
mer
ican
,no
n-H
ispa
nic
His
pani
cO
ther
,no
n-H
ispa
nic
4522
511
207
1205
141
67
73.8
45.2
38.3
67.3
(71.
6,76
)(3
9.9,
50.6
)(3
4.6,
41.9
)(5
8.1,
76.5
)
14.6
43.3
32.8
20.3
(12.
8,16
.3)
(38.
1,48
.5)
(29.
6,35
.9)
(12.
1,28
.6)
11.7
11.5
29.0
12.4
(10.
2,13
.1)
(9.2
,13
.8)
(25.
8,32
.1)
(7.5
,17
.3)
Perc
eive
dhe
alth
stat
us
Exc
elle
nt,
very
good
,go
odFa
iror
poor
7031
923
0063
.647
.2(6
1.7,
65.5
)(4
0.3,
54.1
)21
.742
.3(1
9.9,
23.5
)(3
5.7,
48.9
)14
.710
.5(1
3.5,
15.9
)(6
.8,
14.1
)
Reg
ion
Nor
thea
stM
idw
est
Sout
hW
est
1332
717
210
2445
717
656
68.3
71.1
57.9
58.6
(64.
4,72
.2)
(67.
6,74
.7)
(54.
8,61
.1)
(54.
1,63
.2)
23.4
17.4
23.7
24.4
(19.
8,27
)(1
4.1,
20.7
)(2
0.5,
26.9
)(2
0.4,
28.5
)
8.4
11.5
18.4
17.0
(6.1
,10
.6)
(9.5
,13
.5)
(15.
9,20
.8)
(14.
9,19
)
MSA M
SAN
on-M
SA59
757
1289
363
.760
.6(6
1.6,
65.8
)(5
5.9,
65.3
)21
.426
.9(1
9.4,
23.3
)(2
2.3,
31.5
)15
.012
.6(1
3.6,
16.3
)(1
0.1,
15)
*Sou
rce:
2001
Med
ical
Exp
endi
ture
Pane
lSu
rvey
(ME
PS).
Age
ncy
for
Hea
lthca
reR
esea
rch
and
Qua
lity.
Chi
ldre
nar
ecl
assi
fied
asha
ving
priv
ate
insu
ranc
eif
they
wer
epr
ivat
ely
insu
red
(inc
ludi
ngco
vera
geth
roug
hth
eC
ivili
anH
ealth
and
Med
ical
Prog
ram
ofth
eU
nifo
rmed
Serv
ices
)at
any
time
duri
ngth
efir
stha
lfof
the
year
.C
hild
ren
with
nopr
ivat
eco
vera
gebu
tw
hoha
dco
vera
geth
roug
hM
edic
aid,
Med
icar
e,or
any
othe
rty
peof
gove
rnm
ent
prog
ram
prov
idin
gco
vera
gefo
rbo
thho
spita
lan
dm
edic
alca
rear
ecl
assi
fied
aspu
blic
lyin
sure
d.C
hild
ren
not
cove
red
byan
yco
mpr
ehen
sive
hosp
ital
and
phys
icia
nin
sura
nce
prog
ram
atan
ytim
edu
ring
the
first
half
ofth
eye
arar
ecl
assi
fied
asun
insu
red.
CI
indi
cate
sco
nfide
nce
inte
rval
;M
SA,
met
ropo
litan
stat
istic
alar
ea.

Tab
leA
-12.
Hea
lthC
are
Use
for
Chi
ldre
nA
ged
17Y
ears
and
Und
er,
1999
(Ful
l-Y
ear)
:Pe
rcen
tof
Chi
ldre
nW
ithV
isits
*
Cha
ract
eris
tic
Offi
ce-B
ased
Perc
ent
With
Any
Vis
its95
%C
I
Hos
pita
lO
utpa
tient
Perc
ent
With
Any
Vis
its95
%C
I
Hos
pita
lIn
patie
nt
Perc
ent
With
Any
Dis
char
ges
95%
CI
Em
erge
ncy
Dep
artm
ent
Perc
ent
With
Any
Vis
its95
%C
I
Den
tal
Perc
ent
With
Any
Vis
its95
%C
I
Pres
crip
tion
Med
icin
es
Perc
ent
With
Any
Scri
pts
95%
CI
Tota
l70
.1(6
8.3,
71.9
)6.
1(5
.4,
6.9)
2.6
(2.1
,3.
1)11
.1(1
0.3,
12)
42.1
(40.
2,44
.1)
50.3
(48.
5,52
)
Hea
lthin
sura
nce
cove
rage
Any
priv
ate
Publ
icon
lyU
nins
ured
73.6
68.6
43.0
(71.
5,75
.7)
(64.
9,72
.3)
(38.
2,47
.8)
6.6
5.8
3.1
(5.6
,7.
5)(4
.5,
7.1)
(1.5
,4.
6)
2.3
4.1
2.0
(1.8
,2.
8)(2
.9,
5.2)
(0.7
,3.
3)
11.1
12.7 7.8
(10,
12.2
)(1
0.7,
14.6
)(5
.2,
10.3
)
48.8
27.5
19.5
(46.
5,51
.1)
(24.
2,30
.8)
(15,
23.9
)
52.8
49.5
29.8
(50.
8,54
.8)
(46.
1,52
.9)
(25.
5,34
.1)
Age
0–
4y
5–9
y10
–14
y15
–17
y
82.4
66.6
65.7
63.3
(80.
1,84
.6)
(63.
5,69
.7)
(62.
8,68
.5)
(60,
66.7
)
5.8
6.1
6.7
5.8
(4.6
,7.
1)(4
.8,
7.3)
(5.3
,8.
1)(4
,7.
6)
5.2
1.6
1.2
2.7
(4.1
,6.
3)(0
.8,
2.3)
(0.7
,1.
8)(1
.2,
4.1)
15.0 9.0
8.8
12.6
(13,
17)
(7.5
,10
.5)
(7.2
,10
.4)
(10.
2,15
)
13.7
52.4
55.6
48.2
(11.
8,15
.6)
(49.
1,55
.8)
(52.
4,58
.8)
(44.
3,52
)
59.6
49.9
44.3
45.5
(56.
6,62
.7)
(46.
9,53
)(4
1.4,
47.2
)(4
2.1,
48.9
)
Sex M
ale
Fem
ale
70.4
69.8
(68.
3,72
.5)
(67.
4,72
.1)
6.3
6.0
(5.2
,7.
3)(5
,7)
3.2
2.0
(2.5
,4)
(1.4
,2.
6)12
.7 9.5
(11.
4,14
)(8
.3,
10.7
)41
.043
.3(3
8.7,
43.3
)(4
1,45
.7)
50.6
49.9
(48.
4,52
.8)
(47.
6,52
.2)
Rac
e/E
thni
city
Whi
te,
non-
His
pani
cA
fric
anA
mer
ican
,non
-His
pani
cH
ispa
nic
Oth
er,
non-
His
pani
c
76.1
57.0
60.1
65.3
(74.
1,78
.1)
(51.
9,62
.1)
(56.
8,63
.4)
(57.
4,73
.2)
7.2
4.5
4.4
2.9
(6.2
,8.
2)(2
.9,
6)(3
.1,
5.7)
(0.8
,4.
9)
2.6
2.2
2.9
4.1
(2,
3.2)
(1.2
,3.
1)(2
,3.
8)(1
,7.
2)
11.4
11.3
10.4 8.9
(10.
3,12
.5)
(8.9
,13
.8)
(8.6
,12
.2)
(4.5
,13
.4)
49.7
29.6
24.3
40.9
(47.
1,52
.3)
(24.
8,34
.5)
(21.
7,27
)(3
0.5,
51.2
)
55.7
38.7
42.0
41.3
(53.
3,58
.1)
(34.
6,42
.9)
(39.
2,44
.7)
(33.
7,48
.9)
Pove
rty
,20
0%of
pove
rty
line
$20
0%of
pove
rty
line
63.9
74.2
(61.
1,66
.7)
(72.
1,76
.3)
5.0
6.9
(4,
5.9)
(5.9
,7.
9)3.
62.
0(2
.8,
4.5)
(1.4
,2.
5)12
.710
.1(1
1.3,
14.2
)(9
,11
.2)
26.9
52.2
(24.
8,29
)(4
9.5,
54.9
)47
.352
.2(4
4.8,
49.8
)(5
0,54
.5)
Perc
eive
dhe
alth
stat
us
Exc
elle
nt,
very
good
,go
odFa
iror
poor
69.7
90.1
(67.
8,71
.5)
(85.
4,94
.8)
5.9
18.1
(5.1
,6.
6)(1
0.8,
25.3
)2.
214
.2(1
.7,
2.7)
(7.1
,21
.3)
10.9
25.7
(10,
11.8
)(1
6.8,
34.5
)42
.930
.6(4
1,44
.9)
(22.
5,38
.8)
49.9
85.2
(48.
1,51
.7)
(78.
6,91
.7)
Reg
ion
Nor
thea
st78
.5(7
5.2,
81.8
)8.
3(6
.3,
10.3
)3.
4(1
.9,
4.9)
11.1
(8.7
,13
.5)
48.3
(43.
6,52
.9)
54.6
(50.
5,58
.7)
Mid
wes
tSo
uth
Wes
t
71.9
66.2
67.5
(68.
1,75
.7)
(62.
8,69
.7)
(63.
7,71
.3)
7.2
5.5
4.4
(5.7
,8.
8)(4
.2,
6.7)
(3.1
,5.
7)
1.8
2.9
2.5
(1.1
,2.
6)(2
.2,
3.7)
(1.6
,3.
3)
13.5
11.7 8.0
(11.
4,15
.6)
(10.
2,13
.3)
(6.8
,9.
2)
46.6
36.9
40.4
(42.
7,50
.6)
(33.
7,40
)(3
6.6,
44.1
)
53.0
49.2
45.9
(48.
9,57
.1)
(46.
2,52
.1)
(43.
1,48
.8)
MSA M
SAN
on-M
SA70
.668
.2(6
8.5,
72.6
)(6
4.2,
72.1
)6.
16.
1(5
.3,
6.9)
(4.5
,7.
7)2.
43.
7(1
.9,
2.9)
(2.5
,4.
9)10
.812
.8(9
.8,
11.7
)(1
0.8,
14.9
)41
.943
.2(3
9.8,
44)
(38.
3,48
.2)
49.8
52.5
(47.
8,51
.8)
(48.
8,56
.1)
*Sou
rce:
1999
Med
ical
Exp
endi
ture
Pane
lSu
rvey
(ME
PS).
Age
ncy
for
Hea
lthca
reR
esea
rch
and
Qua
lity.
CI
indi
cate
sco
nfide
nce
inte
rval
;M
SA,
met
ropo
litan
stat
istic
alar
ea.

Tab
leA
-13.
Hea
lthC
are
Use
for
Chi
ldre
nA
ged
17Y
ears
and
Und
er,
1999
(Ful
l-Y
ear)
:A
vera
geN
umbe
rof
Vis
its*
Cha
ract
eris
tic
Offi
ce-B
ased
Ave
rage
Num
ber
ofV
isits
95%
CI
Hos
pita
lO
utpa
tient
Ave
rage
Num
ber
ofV
isits
95%
CI
Hos
pita
lIn
patie
nt
Ave
rage
Num
ber
ofD
isch
arge
s95
%C
I
Em
erge
ncy
Dep
artm
ent
Ave
rage
Num
ber
ofV
isits
95%
CI
Den
tal
Ave
rage
Num
ber
ofV
isits
95%
CI
Pres
crip
tion
Med
icin
es
Ave
rage
Num
ber
ofV
isits
95%
CI
Tota
l4.
3(3
.9,
4.7)
2.0
(1.6
,2.
4)1.
2(1
.1,
1.2)
1.2
(1.2
,1.
3)2.
7(2
.6,
2.8)
4.2
(3.9
,4.
5)
Hea
lthin
sura
nce
cove
rage
Any
priv
ate
Publ
icon
lyU
nins
ured
4.5
4.0
2.7
(4,
5)(3
.4,
4.5)
(2.3
,3)
1.9
2.4
...
(1.5
,2.
4)(1
.6,
3.2)
...
...
...
1.2
1.4
...
(1.2
,1.
2)(1
.3,
1.5)
2.9
1.9
2.3
(2.7
,3)
(1.7
,2)
(1.8
,2.
7)
4.1
4.7
3.1
(3.8
,4.
4)(4
,5.
4)(2
.3,
4)
Age
0–
4y
5–9
y10
–14
y15
–17
y
4.6
4.1
4.2
4.3
(4,
5.1)
(3.3
,4.
9)(3
.6,
4.8)
(3.6
,5)
1.8
2.5
2.0
...
(1.5
,2)
(1.4
,3.
5)(1
.5,
2.5)
...
...
...
...
1.3
1.2
1.2
1.2
(1.2
,1.
4)(1
.1,
1.3)
(1.1
,1.
3)(1
.1,
1.3)
1.5
1.9
3.5
3.3
(1.4
,1.
6)(1
.8,
2)(3
.2,
3.7)
(2.9
,3.
6)
3.7
4.0
4.6
4.8
(3.4
,4.
1)(3
.5,
4.5)
(4,
5.2)
(4,
5.6)
Sex M
ale
Fem
ale
4.5
4.1
(3.9
,5.
2)(3
.7,
4.4)
2.2
1.8
(1.5
,2.
8)(1
.5,
2.1)
1.1
...
(1.1
,1.
2)1.
21.
3(1
.2,
1.3)
(1.2
,1.
3)2.
62.
8(2
.4,
2.7)
(2.6
,3)
4.7
3.7
(4.2
,5.
1)(3
.4,
4)
Rac
e/E
thni
city
Whi
te,
non-
His
pani
cA
fric
anA
mer
ican
,non
-His
pani
cH
ispa
nic
Oth
er,
non-
His
pani
c
4.9
2.8
3.2
3.0
(4.3
,5.
4)(2
.4,
3.2)
(2.9
,3.
6)(2
.5,
3.6)
2.0
...
2.2
...
(1.5
,2.
4)
(1.6
,2.
7)
...
...
...
...
1.2
1.3
1.3
...
(1.2
,1.
3)(1
.2,
1.4)
(1.2
,1.
4)
2.9
2.0
2.1
...
(2.7
,3.
1)(1
.7,
2.2)
(1.9
,2.
3)
4.5
3.6
3.4
...
(4.1
,4.
8)(3
,4.
2)(3
,3.
8)
Pove
rty
,20
0%of
pove
rty
line
$20
0%of
pove
rty
line
3.9
4.5
(3.5
,4.
4)(3
.9,
5.1)
1.8
2.1
(1.5
,2.
2)(1
.6,
2.6)
1.2
...
(1.1
,1.
3)1.
31.
2(1
.2,
1.4)
(1.1
,1.
2)2.
12.
9(1
.9,
2.3)
(2.7
,3.
1)4.
44.
0(3
.9,
4.9)
(3.7
,4.
3)
Perc
eive
dhe
alth
stat
us
Exc
elle
nt,
very
good
,go
odFa
iror
poor
4.2
9.4
(3.8
,4.
6)(6
.7,
12.1
)1.
9..
.(1
.5,
2.3)
1.1
...
(1.2
,1.
2)1.
2..
.(1
.2,
1.3)
2.7
...
(2.6
,2.
8)3.
911
.8(3
.6,
4.1)
(8.9
,14
.8)
Reg
ion
Nor
thea
st5.
4(3
.8,
6.9)
...
...
1.3
(1.2
,1.
4)2.
6(2
.3,
2.9)
4.4
(3.6
,5.
1)M
idw
est
Sout
hW
est
4.0
4.1
4.1
(3.4
,4.
6)(3
.7,
4.4)
(3.5
,4.
7)
...
2.2
...
(1.2
,3.
3)..
.
...
...
...
1.2
1.2
1.3
(1.2
,1.
3)(1
.2,
1.3)
(1.1
,1.
4)
2.7
2.7
2.8
(2.4
,2.
9)(2
.4,
3)(2
.5,
3.1)
4.0
4.4
4.0
(3.5
,4.
4)(4
,4.
8)(3
.4,
4.6)
MSA M
SAN
on-M
SA4.
34.
3(3
.8,
4.8)
(3.8
,4.
8)2.
0..
.(1
.6,
2.5)
1.1
...
(1.1
,1.
2)1.
21.
3(1
.2,
1.2)
(1.2
,1.
4)2.
72.
7(2
.5,
2.9)
(2.4
,3)
4.1
4.6
(3.8
,4.
4)(3
.9,
5.2)
*Sou
rce:
1999
Med
ical
Exp
endi
ture
Pane
lSu
rvey
(ME
PS).
Age
ncy
for
Hea
lthca
reR
esea
rch
and
Qua
lity.
CI
indi
cate
sco
nfide
nce
inte
rval
;M
SA,
met
ropo
lita
nst
atis
tical
area
.E
llips
esin
dica
tesa
mpl
esi
zeis
too
smal
lto
prov
ide
relia
ble
estim
ates
.
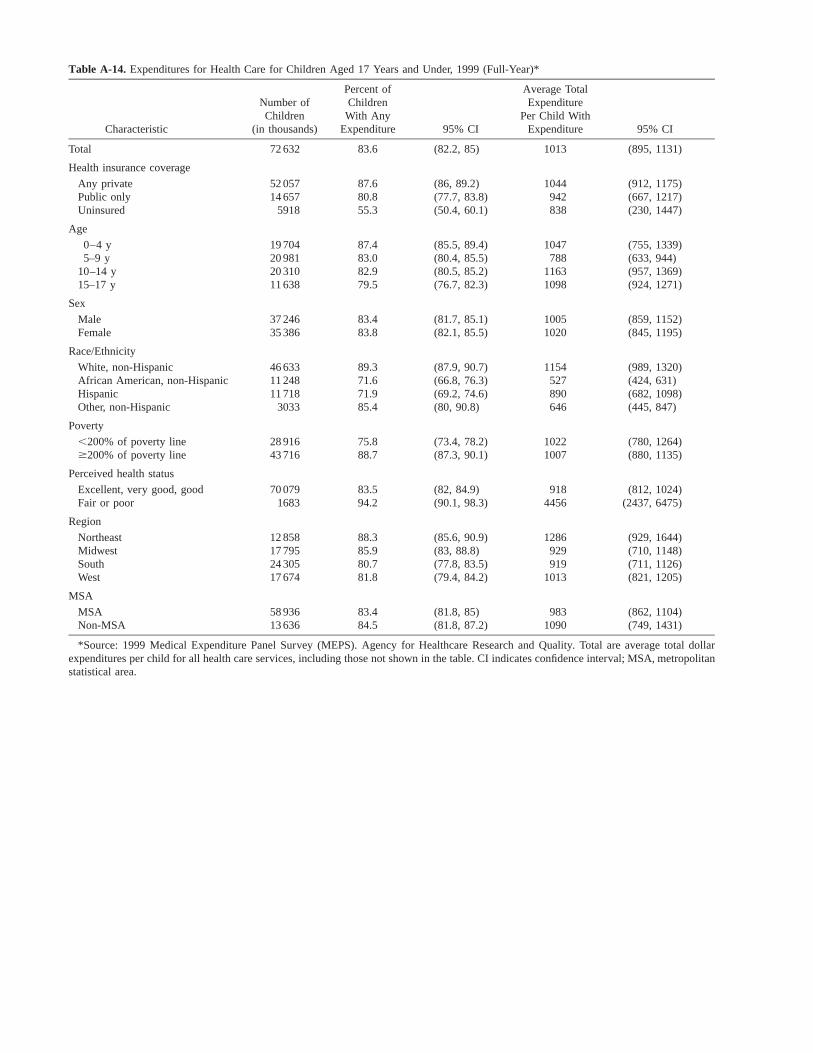
Table A-14. Expenditures for Health Care for Children Aged 17 Years and Under, 1999 (Full-Year)*
Characteristic
Number ofChildren
(in thousands)
Percent ofChildren
With AnyExpenditure 95% CI
Average TotalExpenditure
Per Child WithExpenditure 95% CI
Total 72 632 83.6 (82.2, 85) 1013 (895, 1131)
Health insurance coverage
Any privatePublic onlyUninsured
52 05714 657
5918
87.680.855.3
(86, 89.2)(77.7, 83.8)(50.4, 60.1)
1044942838
(912, 1175)(667, 1217)(230, 1447)
Age
0–4 y5–9 y
10–14 y15–17 y
19 70420 98120 31011 638
87.483.082.979.5
(85.5, 89.4)(80.4, 85.5)(80.5, 85.2)(76.7, 82.3)
1047788
11631098
(755, 1339)(633, 944)(957, 1369)(924, 1271)
Sex
MaleFemale
37 24635 386
83.483.8
(81.7, 85.1)(82.1, 85.5)
10051020
(859, 1152)(845, 1195)
Race/Ethnicity
White, non-HispanicAfrican American, non-HispanicHispanicOther, non-Hispanic
46 63311 24811 718
3033
89.371.671.985.4
(87.9, 90.7)(66.8, 76.3)(69.2, 74.6)(80, 90.8)
1154527890646
(989, 1320)(424, 631)(682, 1098)(445, 847)
Poverty
,200% of poverty line$200% of poverty line
28 91643 716
75.888.7
(73.4, 78.2)(87.3, 90.1)
10221007
(780, 1264)(880, 1135)
Perceived health status
Excellent, very good, goodFair or poor
70 0791683
83.594.2
(82, 84.9)(90.1, 98.3)
9184456
(812, 1024)(2437, 6475)
Region
Northeast 12 858 88.3 (85.6, 90.9) 1286 (929, 1644)MidwestSouthWest
17 79524 30517 674
85.980.781.8
(83, 88.8)(77.8, 83.5)(79.4, 84.2)
929919
1013
(710, 1148)(711, 1126)(821, 1205)
MSA
MSANon-MSA
58 93613 636
83.484.5
(81.8, 85)(81.8, 87.2)
9831090
(862, 1104)(749, 1431)
*Source: 1999 Medical Expenditure Panel Survey (MEPS). Agency for Healthcare Research and Quality. Total are average total dollarexpenditures per child for all health care services, including those not shown in the table. CI indicates confidence interval; MSA, metropolitanstatistical area.

Tab
leA
-15.
Exp
endi
ture
sfo
rH
ealth
Car
efo
rC
hild
ren
Age
d17
Yea
rsan
dU
nder
,19
99(F
ull-
Yea
r)*
Cha
ract
eris
tic
Ave
rage
Exp
endi
ture
sPe
rC
hild
With
Exp
endi
ture
sfo
rE
ach
Typ
eof
Hea
lthC
are
Serv
ice
Offi
ce-
Bas
edV
isit
95%
CI
Hos
pita
lO
utpa
tient
Vis
it95
%C
I
Inpa
tient
Hos
pita
lA
dmit
95%
CI
Em
erge
ncy
Dep
artm
ent
Vis
it95
%C
ID
enta
lV
isit
95%
CI
Pres
crip
tion
Med
icin
e95
%C
I
Tota
l29
5(2
69,
322)
1230
(937
,15
23)
7590
(494
3,10
238)
520
(412
,62
8)46
7(4
01,
533)
153
(120
,18
7)
Hea
lthin
sura
nce
cove
rage
Any
priv
ate
Publ
icon
lyU
nins
ured
322
216
199
(290
,35
3)(1
83,
248)
(145
,25
3)
1302
...
...
(940
,16
63)
...
...
...
578
337
...
(434
,72
2)(2
47,
427)
509
229
369
(431
,58
7)(1
74,
285)
(164
,57
5)
139
220
105
(125
,15
3)(6
3,37
7)(5
6,15
4)
Age
0–
4y
5–9
y10
–14
y15
–17
y
303
269
306
312
(261
,34
5)(2
31,
306)
(262
,35
0)(2
60,
363)
1032
1194
1665
...
(622
,14
42)
(743
,16
45)
(100
0,23
31)
...
...
...
...
381
706
523
551
(315
,44
8)(2
93,
1119
)(3
89,
657)
(415
,68
8)
170
267
658
624
(120
,21
9)(2
09,
325)
(530
,78
5)(4
64,
784)
85 174
175
228
(75,
95)
(65,
284)
(148
,20
1)(1
74,
282)
Sex M
ale
Fem
ale
296
295
(265
,32
6)(2
58,
332)
1524 907
(105
5,19
94)
(663
,11
52)
...
...
452
617
(385
,51
9)(3
74,
860)
397
537
(331
,46
4)(4
34,
641)
187
118
(124
,25
0)(1
02,
134)
Rac
e/E
thni
city
Whi
te,
non-
His
pani
cA
fric
anA
mer
ican
,no
n-H
ispa
nic
His
pani
cO
ther
,no
n-H
ispa
nic
327
186
249
240
(293
,36
1)(1
42,
230)
(198
,30
1)(1
70,
309)
1255
...
...
...
(890
,16
20)
...
...
...
...
520
356
752
...
(438
,60
2)(2
53,
459)
(132
,13
71)
514
237
388
...
(433
,59
5)(1
13,
361)
(301
,47
4)
174
102
107
...
(128
,22
1)(7
9,12
4)(8
5,12
8)
Pove
rty
,20
0%of
pove
rty
line
$20
0%of
pove
rty
line
237
328
(204
,26
9)(2
94,
362)
1140
1271
(806
,14
75)
(879
,16
62)
7739
...
(424
2,11
237)
539
504
(320
,75
8)(4
25,
583)
273
534
(227
,32
0)(4
49,
618)
176
140
(92,
260)
(124
,15
6)
Perc
eive
dhe
alth
stat
us
Exc
elle
nt,
very
good
,go
odFa
iror
poor
287
607
(262
,31
3)(4
20,
793)
1140
...
(861
,14
19)
7585
...
(447
3,10
697)
518
...
(405
,63
1)46
6..
.(4
00,
532)
130
734
(116
,14
4)(2
39,
1508
)
Reg
ion
Nor
thea
st28
7(2
41,
333)
...
...
531
(365
,69
7)42
5(3
14,
535)
217
(54,
380)
Mid
wes
tSo
uth
Wes
t
335
260
308
(270
,40
1)(2
27,
293)
(249
,36
7)
...
1686
...
(963
,24
09)
...
...
...
482
405
806
(381
,58
3)(3
26,
483)
(257
,13
56)
430
353
687
(327
,53
3)(2
93,
414)
(474
,89
9)
131
145
137
(105
,15
7)(1
26,
164)
(102
,17
1)
MSA M
SAN
on-M
SA30
126
9(2
70,
332)
(230
,30
8)11
47..
.(8
39,
1456
)68
32..
.(4
151,
9513
)51
852
7(3
87,
649)
(385
,66
9)50
232
1(4
24,
580)
(245
,39
7)15
116
4(1
10,
191)
(122
,20
7)
*Sou
rce:
1999
Med
ical
Exp
endi
ture
Pane
lSu
rvey
(ME
PS).
Tota
lar
eav
erag
eto
tal
dolla
rex
pend
iture
spe
rch
ildfo
ral
lhe
alth
care
serv
ices
,inc
ludi
ngth
ose
not
show
nin
the
tabl
e.C
Iin
dica
tes
confi
denc
ein
terv
al;
MSA
,m
etro
polit
anst
atis
tical
area
.E
llips
esin
dica
tesa
mpl
esi
zeto
osm
all
topr
ovid
ere
liabl
ees
timat
es.

Tab
leA
-16.
Perc
ent
Dis
trib
utio
nof
Sour
ceof
Paym
ent
for
Tota
lH
ealth
Car
eE
xpen
ditu
res
for
Chi
ldre
nA
ged
17Y
ears
and
Und
er,
1999
(Ful
l-Y
ear)
*
Cha
ract
eris
tic
Tota
lD
olla
rE
xpen
ditu
res
(in
mill
ions
)95
%C
I
Perc
ent
Dis
trib
utio
nof
Sour
ceof
Paym
ent
for
Chi
ldre
nW
ithA
nyE
xpen
ditu
re
Priv
ate
95%
CI
Med
icai
d95
%C
IO
utof
Pock
et95
%C
IO
ther
95%
CI
Tota
l61
478
(53
382,
6957
4)50
.9(4
5.9,
55.9
)17
.1(1
2.5,
21.6
)22
.7(1
9.9,
25.4
)9.
4(5
.7,
13)
Hea
lthin
sura
nce
cove
rage
Any
priv
ate
Publ
icon
lyU
nins
ured
4758
311
152
2742
(40
790,
5437
7)(7
772,
1453
3)(7
08,
4777
)
65.8
...
...
(61.
6,70
)5.
272
.0..
.
(1.2
,9.
1)(6
1.7,
82.4
)25
.4 7.8
35.7
(22.
1,28
.7)
(4.2
,11
.3)
(10.
2,61
.1)
3.7
20.2
64.4
(2.2
,5.
1)(9
.8,
30.6
)(3
8.9,
89.8
)
Age
0–
4y
5–9
y10
–14
y15
–17
y
1803
613
722
1956
910
152
(12
822,
2325
0)(1
076
3,16
680)
(15
876,
2326
2)(8
282,
1202
1)
43.8
49.5
57.3
53.3
(32,
55.6
)(4
1.5,
57.5
)(5
0.3,
64.3
)(4
7.1,
59.6
)
29.7
18.8 8.3
9.2
(17.
2,42
.1)
(13.
4,24
.3)
(5.7
,10
.8)
(5.4
,13
)
11.8
23.5
26.9
32.5
(7.8
,15
.8)
(18.
1,28
.9)
(22.
2,31
.6)
(26.
8,38
.2)
14.7 8.2
7.5
5.0
(4.4
,25
.1)
(4.4
,11
.9)
(2.5
,12
.6)
(2.5
,7.
4)
Sex M
ale
Fem
ale
3122
430
254
(26
021,
3642
6)(2
474
5,35
763)
49.7
52.2
(43.
5,56
)(4
4.9,
59.5
)17
.117
.1(1
1.4,
22.7
)(1
0.2,
23.9
)22
.123
.2(1
8.4,
25.9
)(1
9,27
.3)
11.1 7.6
(4.7
,17
.4)
(4.7
,10
.5)
Rac
e/E
thni
city
Whi
te,
non-
His
pani
cA
fric
anA
mer
ican
,no
n-H
ispa
nic
His
pani
cO
ther
,no
n-H
ispa
nic
4806
042
4475
0016
74
(40
410,
5571
0)(3
155,
5332
)(5
545,
9456
)(8
72,
2475
)
53.0
42.2
43.3
49.1
(46.
9,59
)(3
1.5,
52.9
)(3
2.3,
54.3
)(3
8.2,
60)
14.1
31.4
25.4
27.7
(8.5
,19
.8)
(22,
40.8
)(1
7.9,
32.8
)(1
2.4,
42.9
)
23.6
18.3
19.8
19.8
(20.
3,26
.9)
(12.
4,24
.1)
(12.
4,27
.2)
(11.
2,28
.4)
9.3
8.2
11.5 3.4
(4.7
,13
.9)
(2.7
6,13
.6)
(7,
16)
(1.4
,5.
5)
Pove
rty
,20
0%of
pove
rty
line
$20
0%of
pove
rty
line
2441
039
068
(16
920,
2790
1)(3
353
8,44
597)
30.7
62.5
(21.
3,40
.1)
(57.
6,67
.4)
41.1 3.3
(31.
6,50
.6)
(2.1
,4.
4)16
.326
.3(1
1.6,
21)
(23,
29.5
)11
.9 7.9
(6.2
,17
.5)
(3.1
,12
.8)
Perc
eive
dhe
alth
stat
us
Exc
elle
nt,
very
good
,go
odFa
iror
poor
5371
370
64(4
640
9,61
016)
(352
7,10
601)
54.3
25.3
(49.
4,59
.3)
(13.
3,37
.3)
13.3
45.1
(9.5
,17
.2)
(27,
63.2
)23
.715
.6(2
0.9,
26.5
)(5
.5,
25.6
)8.
614
.0(4
.6,
12.6
)(5
.2,
22.8
)
Reg
ion
Nor
thea
stM
idw
est
Sout
hW
est
1460
214
209
1801
914
648
(10
468,
1873
6)(1
045
1,17
967)
(13
564,
2247
3)(1
086
0,18
436)
38.8
67.0
47.7
51.5
(28.
7,48
.8)
(59.
5,74
.5)
(37.
9,57
.5)
(45.
8,57
.1)
20.3 6.6
24.5
14.9
(8.9
,31
.6)
(3.1
,10
)(1
4.2,
34.8
)(1
0.3,
19.4
)
19.3
22.6
21.5
27.5
(13.
2,25
.4)
(17.
3,27
.9)
(17.
2,25
.8)
(22.
2,32
.7)
21.7 3.8
6.3
6.2
(8.9
,34
.4)
(2.3
,5.
3)(3
.3,
9.4)
(3.4
,9)
MSA M
SAN
on-M
SA48
311
1256
1(4
130
8,55
313)
(836
6,16
755)
52.3
47.2
(47,
57.7
)(3
3.5,
60.9
)13
.230
.8(9
.1,
17.3
)(1
6.5,
45.1
)23
.918
.8(2
0.8,
27)
(14,
23.6
)10
.6 3.2
(6.1
,15
.1)
(1.2
,5.
2)
*Sou
rce:
1999
Med
ical
Exp
endi
ture
Pane
lSu
rvey
(ME
PS).
Age
ncy
for
Hea
lthca
reR
esea
rch
and
Qua
lity.
CI
indi
cate
sco
nfide
nce
inte
rval
;M
SA,
met
ropo
lita
nst
atis
tical
area
.E
llips
esin
dica
tesa
mpl
esi
zeto
osm
all
topr
ovid
ere
liabl
ees
timat
es.

Table B-1. Trends in Children and Adolescent Hospital Discharges Compared to Adult Discharges (Population Ratios), by Region and forthe Nation, 1995–00*
Characteristic
1995
PopulationRatio (SE)
95% LCI& UCI
1996
PopulationRatio (SE)
95% LCI& UCI
1997
PopulationRatio (SE)
95% LCI& UCI
Children (0–17 y)
National total 93.39 (4.31) (84.94, 101.84) 89.15 (4.06) (81.19, 97.11) 91.34 (4.05) (83.40, 99.28)
Age
,1 y1–4 y5–9 y
10–14 y15–17 y†
1179.36 (56.57)39.46 (2.79)18.69 (1.31)19.62 (1.15)50.38 (2.07)
(1068.48, 1290.24)(33.99, 44.93)(16.12, 21.26)(17.37, 21.87)(46.32, 54.44)
1173.08 (56.02)34.73 (2.35)16.53 (1.10)18.17 (1.07)46.93 (1.97)
(1063.28, 1282.88)(30.12, 39.34)(14.37, 18.69)(16.07, 20.27)(43.07, 50.79)
1191.94 (52.56)38.57 (2.67)18.37 (1.40)18.97 (1.30)46.04 (2.08)
(1088.92, 1294.96)(33.34, 43.80)(15.63, 21.11)(16.42, 21.52)(41.96, 50.12)
Expected payer
PrivateMedicaidUninsured
66.58 (3.30)162.14 (9.47)36.94 (4.64)
(60.12, 73.04)(143.59, 180.69)(27.84, 46.04)
66.72 (3.41)158.80 (8.99)31.15 (2.88)
(60.04, 73.40)(141.18, 176.43)(25.50, 36.80)
70.52 (3.44)162.81 (8.47)30.23 (2.04)
(63.77, 77.26)(146.20, 179.42)(26.24, 34.22)
Region
NortheastMidwestSouthWest
94.12 (8.84)93.86 (6.70)93.86 (7.74)91.62 (10.74)
(76.79, 111.45)(80.73, 106.99)(78.69, 109.03)(70.57, 112.67)
90.63 (8.87)91.04 (6.95)88.79 (7.02)86.64 (9.75)
(73.24, 108.02)(77.42, 104.66)(75.03, 102.55)(67.53, 105.75)
91.45 (8.63)980.62 (6.87)94.47 (7.98)87.28 (8.03)
(74.54, 108.36)(77.15, 104.09)(78.83, 110.11)(71.54, 103.02)
Adults (181 y)
National total 146.10 (5.01) (136.28, 155.92) 146.37 (5.17) (136.24, 156.50) 146.54 (4.97) (136.80, 156.28)
Expected payer
PrivateMedicaidUninsured
95.72 (3.74)328.45 (14.81)46.99 (4.00)
(88.40, 103.05)(299.43, 357.47)(39.15, 54.83)
96.73 (4.03)307.85 (14.44)44.48 (3.05)
(88.83, 104.64)(279.55, 336.16)(38.50, 50.46)
95.23 (3.84)321.05 (14.16)41.56 (2.07)
(87.71, 102.76)(293.29, 348.81)(37.51, 45.60)
Region
NortheastMidwestSouthWest
162.28 (10.59)147.89 (8.19)153.37 (9.63)117.20 (10.94)
(141.52, 183.04)(131.84, 163.94)(134.50, 172.24)(95.76, 138.64)
160.33 (11.38)147.29 (9.45)154.51 (9.28)119.21 (11.44)
(38.03, 182.63)(128.77, 165.81)(136.32, 172.70)(96.79, 141.63)
160.80 (11.03)147.80 (9.88)154.62 (9.33)119.16 (9.01)
(139.18, 182.42)(128.44, 167.16)(136.33, 172.91)(101.50, 136.82)
*Source: Data are from the Healthcare Cost and Utilization Project, 1995–2000 Nationwide Inpatient Sample (NIS). Agency for HealthcareResearch and Quality. Population ratio indicates population ratio or the number of discharges per 1000 in the US Census population. LCI,lower confidence interval; UCI, upper confidence interval; Differences in CIs may not be apparent because of rounding.
†Comparison of 95% CI suggests significant difference between 1995 and 2000 point estimates.

Table B-1. Extended.
1998
PopulationRatio (SE)
95% LCI& UCI
1999
PopulationRatio (SE)
95% LCI& UCI
2000
PopulationRatio (SE)
95% LCI% UCI
86.75 (4.27) (78.38, 95.12) 92.08 (4.54) (83.18, 100.98) 88.01 (4.39) (79.41, 96.61)
1147.17 (54.43)33.88 (2.75)16.66 (1.45)18.17 (1.45)44.18 (2.21)
(1040.49, 1253.85)(28.49, 39.27)(13.82, 19.50)(15.33, 21.01)(39.85, 48.51)
1187.16 (57.55)40.84 (3.21)19.22 (1.64)20.77 (1.56)44.38 (2.15)
(1074.37, 1299.95)(34.56, 47.13)(16.01, 22.43)(17.71, 23.83)(40.17, 48.59)
1224.16 (62.21)32.41 (2.57)15.59 (1.27)17.33 (1.23)41.87 (2.04)
(1102.23, 1346.09)(27.37, 37.45)(14.00, 18.08)(14.92, 19.74)(37.87, 45.87)
66.95 (3.79)160.28 (9.37)29.53 (2.26)
(59.54, 74.37)(141.91, 178.64)(25.11, 33.96)
69.53 (3.94)164.65 (9.28)36.25 (2.76)
(61.81, 77.24)(146.46, 182.84)(30.84, 41.65)
68.39 (3.95)158.61 (9.04)37.55 (4.63)
(60.65, 76.14)(140.90, 176.33)(28.48, 46.62)
95.91 (12.20)80.87 (6.48)88.12 (7.63)83.53 (8.44)
(72.00, 119.82)(68.17, 93.57)(73.17, 103.07)(66.99, 100.07)
91.77 (11.20)86.93 (7.84)96.38 (8.23)90.96 (9.33)
(69.72, 113.82)(71.56, 102.30)(80.25, 112.51)(72.67, 109.25)
85.98 (9.88)86.02 (7.72)92.39 (8.19)84.93 (9.08)
(66.62, 105.34)(70.89, 101.15)(76.34, 108.44)(67.13, 102.73)
143.77 (5.54) (132.91, 154.63) 143.18 (5.65) (132.11, 154.25) 143.68 (5.67) (132.57, 154.79)
94.86 (4.37)356.63 (18.57)42.30 (2.48)
(86.30, 103.42)(320.24, 393.03)(37.44, 47.16)
89.90 (4.14)353.83 (18.27)46.68 (3.02)
(81.79, 98.02)(318.02, 389.63)(40.75, 52.61)
92.90 (4.34)352.97 (17.50)45.64 (4.32)
(84.39, 101.40)(318.67, 387.27)(37.17, 54.11)
153.51 (13.95)146.38 (10.73)153.01 (9.82)117.38 (10.20)
(126.17, 180.85)(125.35, 167.41)(133.76, 172.26)(97.39, 137.37)
155.24 (14.52)144.97 (10.95)152.56 (10.11)115.63 (9.88)
(126.78, 183.70)(123.51, 166.43)(132.74, 172.38)(96.27, 134.99)
153.57 (14.48)146.46 (10.99)152.00 (9.87)118.68 (10.68)
(125.19, 181.95)(124.92, 168.00)(132.65, 171.35)(97.75, 139.61)
Table B-2. Trends in Mean Length of Stay (LOS) in Days for Children and Adolescent Hospital Discharges, 1995–00*
Characteristic
1995
LOS95% LCI& UCI
1996
LOS95% LCI& UCI
1997
LOS95% LCI& UCI
1998
LOS95% LCI& UCI
1999
LOS95% LCI& UCI
2000
LOS95% LCI& UCI
National total 3.4 (3.2, 3.5) 3.3 (3.1, 3.4) 3.5 (3.3, 3.6) 3.4 (3.3, 3.6) 3.5 (3.4, 3.6) 3.3 (3.2, 3.4)
Age
,1 y1–4 y5–9 y
10–14 y15–17 y
3.13.34.04.83.8
(3.0, 3.3)(3.2, 3.5)(3.7, 4.2)(4.4, 5.1)(3.6, 4.1)
3.13.23.84.53.7
(3.0, 3.2)(3.1, 3.4)(3.6, 4.1)(4.2, 4.8)(3.4, 3.9)
3.33.23.84.63.8
(3.2, 3.5)(3.0, 3.3)(3.6, 4.1)(4.3, 5.0)(3.5, 4.0)
3.33.23.74.43.7
(3.2, 3.5)(3.0, 3.4)(3.5, 4.0)(4.1, 4.7)(3.5, 3.9)
3.43.13.84.74.0
(3.3, 3.5)(3.0, 3.3)(3.6, 4.0)(4.2, 5.1)(3.7, 4.3)
3.32.93.44.23.7
(3.1, 3.4)(2.8, 3.1)(3.2, 3.6)
(14.0, 4.5)(3.5, 3.9)
Expected payer
PrivateMedicaidUninsured
3.03.83.0
(2.8, 3.1)(3.6, 4.0)(2.5, 3.5)
3.03.72.8
(2.9, 3.1)(3.5, 3.9)(2.5, 3.1)
3.23.92.8
(3.1, 3.3)(3.7, 4.1)(2.7, 3.0)
3.23.82.9
(3.1, 3.3)(3.6, 4.0)(2.7, 3.1)
3.34.02.9
(3.2, 3.4)(3.8, 4.2)(2.7, 3.0)
3.13.72.7
(3.0, 3.2)(3.6, 3.9)(2.6, 2.8)
Region
NortheastMidwestSouthWest
3.83.33.52.8
(3.4, 4.1)(3.1, 3.6)(3.2, 3.8)(2.4, 3.1)
3.83.33.42.7
(3.4, 4.1)(3.1, 3.5)(3.2, 3.7)(2.4, 2.9)
3.93.43.62.9
(3.5, 4.2)(3.3, 3.6)(3.3, 3.9)(2.6, 3.2)
3.93.43.62.9
(3.5, 4.2)(3.1, 3.7)(3.4, 3.8)(2.6, 3.2)
4.03.43.53.3
(3.7, 4.3)(3.2, 3.6)(3.3, 3.7)(3.0, 3.6)
3.63.43.33.1
(3.3, 3.8)(3.2, 3.7)(3.1, 3.5)(2.8, 3.4)
*Source: Data are from the Healthcare Cost and Utilization Project, 1995–2000 Nationwide Inpatient Sample (NIS). Agency for HealthcareResearch and Quality. LOS indicates length of stay; LCI, lower confidence interval; and UCI, upper confidence interval. Differences in CIsmay not be apparent as a result of rounding.

Tab
leB
-3.
Tren
dsin
Four
Mos
tFr
eque
ntA
ge-S
peci
ficPr
inci
pal
Dia
gnos
esTr
eate
din
US
Hos
pita
ls,
1995
–00*
Age
Con
ditio
n
1995
Perc
ent
95%
LC
I&
UC
I
1996
Perc
ent
95%
LC
I&
UC
I
1997
Perc
ent
95%
LC
I&
UC
I
1998
Perc
ent
95%
LC
I&
UC
I
1999
Perc
ent
95%
LC
I&
UC
I
2000
Perc
ent
95%
LC
I&
UC
I
,1
yL
iveb
orn
Acu
tebr
onch
itis
Pneu
mon
iaO
ther
peri
nata
lco
nditi
ons
85.5 2.3
1.5
1.2
(83.
9,87
.1)
(1.9
,2.
6)(1
.3,
1.7)
(1.0
,1.
3)
86.6 2.1
1.3
1.2
(85.
1,88
.0)
(1.9
,2.
4)(1
.1,
1.4)
(1.0
,1.
3)
85.4 2.4
1.3
1.3
(83.
7,87
.0)
(2.2
,2.
7)(1
.1,
1.4)
(1.1
,1.
5)
86.4 2.2
1.2
1.2
(84.
8,87
.9)
(2.0
,2.
4)(1
.1,
1.3)
(1.0
,1.
3)
84.7 2.6
1.3
1.3
(82.
9,86
.6)
(2.3
,2.
9)(1
.1,
1.4)
(1.1
,1.
5)
87.6 2.3
0.9
1.1
(86.
1,89
.2)
(2.0
,2.
6)(0
.8,
1.0)
(0.9
,1.
3)
1–4
yPn
eum
onia
Ast
hma
Flui
dan
del
ectr
olyt
edi
sord
ers
Acu
tebr
onch
itis
16.1
11.2 9.0
5.4
(14.
9,17
.2)
(10.
4,12
.0)
(8.0
,10
.0)
(4.2
,6.
6)
15.1
11.9
10.6 5.0
(14.
0,16
.2)
(11.
1,12
.7)
(9.6
,11
.6)
(4.0
,5.
9)
14.8
12.6 7.2
5.4
(13.
6,16
.0)
(11.
7,13
.4)
(6.4
,8.
0)(4
.9,
5.9)
15.8
10.6 7.2
4.5
(14.
5,17
.2)
(9.7
,11
.5)
(6.4
,8.
0)(4
.0,
5.0)
14.6
11.7 7.8
5.2
(13.
7,15
.6)
(10.
7,12
.7)
(7.0
,8.
5)(4
.7,
5.6)
14.0
12.6 8.5
5.5
(12.
8,15
.2)
(11.
8,13
.4)
(7.6
,9.
4)(5
.0,
6.0)
5–9
yA
sthm
aPn
eum
onia
Flui
dan
del
ectr
olyt
edi
sord
ers
App
endi
citis
12.2
10.1 4.7
4.6
(11.
3,13
.1)
(9.3
,10
.8)
(4.0
,5.
4)(4
.2,
5.0)
12.6 9.0
4.9
5.0
(11.
6,13
.6)
(8.3
,9.
7)(4
.4,
5.5)
(4.5
,5.
4)
13.4 8.5
3.9
4.5
(12.
3,14
.5)
(7.8
,9.
2)(3
.4,
4.4)
(4.1
,4.
9)
10.3 8.9
3.5
5.2
(9.3
,11
.4)
(8.0
,9.
8)(3
.1,
3.9)
(4.8
,5.
7)
12.6 8.3
3.7
5.2
(11.
3,13
.8)
(7.6
,8.
9)(3
.2,
4.1)
(4.7
,5.
7)
12.0 7.6
4.1
6.1
(11.
0,12
.9)
(6.9
,8.
3)(3
.7,
4.6)
(5.5
,6.
7)
10–1
4y
App
endi
citis
Ast
hma
Aff
ectiv
edi
sord
ers
Pneu
mon
ia
8.0
7.1
5.3
4.1
(7.3
,8.
7)(6
.5,
7.7)
(4.2
,6.
4)(3
.7,
4.4)
8.4
7.5
5.7
3.7
(7.6
,9.
1)(6
.8,
8.3)
(4.4
,7.
0)(3
.4,
4.0)
8.0
7.5
6.2
3.5
(7.3
,8.
7)(6
.9,
8.2)
(4.8
,7.
5)(3
.2,
3.8)
8.3
6.3
5.8
3.8
(7.6
,9.
2)(5
.6,
7.1)
(4.4
,7.
3)(3
.5,
4.2)
7.8
7.3
7.5
3.3
(7.2
,8.
5)(6
.5,
8.0)
(5.6
,9.
3)(3
.1,
3.6)
9.1
6.8
8.3
2.9
(8.3
,9.
9)(6
.2,
7.5)
(6.4
,10
.3)
(2.7
,3.
2)
15–1
7y
Nor
mal
preg
nanc
yan
d/or
deliv
ery
Trau
ma
tope
rine
uman
dvu
lva
Aff
ectiv
edi
sord
ers
Oth
erco
mpl
icat
ions
ofpr
egna
ncy
6.2
6.1
5.0
4.3
(5.6
,6.
8)(5
.6,
6.5)
(4.1
,6.
0)(4
.0,
4.7)
6.2
6.6
5.3
4.3
(5.6
,6.
8)(6
.0,
7.1)
(4.3
,6.
4)(3
.9,
4.7)
5.8
6.6
5.8
4.3
(5.3
,6.
3)(6
.1,
7.2)
(4.7
,6.
9)(3
.9,
4.7)
5.5
6.7
5.6
4.4
(4.9
,6.
0)(6
.2,
7.3)
(4.5
,6.
8)(4
.0,
4.8)
4.6
6.1
7.6
3.9
(4.2
,5.
1)(5
.6,
6.6)
(6.0
,9.
1)(3
.6,
4.3)
4.7
6.7
8.2
4.3
(4.2
,5.
1)(6
.0,
7.3)
(6.6
,9.
7)(3
.9,
4.6)
*Sou
rce:
Dat
aar
efr
omth
eH
ealth
care
Cos
tan
dU
tiliz
atio
nPr
ojec
t,19
95–2
000
Nat
ionw
ide
Inpa
tient
Sam
ple
(NIS
).A
genc
yfo
rH
ealth
care
Res
earc
han
dQ
ualit
y.A
llda
taar
epe
rcen
tof
disc
harg
esfo
rth
eag
egr
oup.
LC
Iin
dica
tes
low
erco
nfide
nce
inte
rval
;U
CI,
uppe
rco
nfide
nce
inte
rval
.D
iffe
renc
esin
roun
ding
may
not
beap
pare
ntas
are
sult
ofro
undi
ng.

Tab
leB
-4.
Tren
dsin
Len
gth
ofSt
ay(L
OS)
for
the
Four
Mos
tFr
eque
ntA
ge-S
peci
ficPr
inci
pal
Dia
gnos
esTr
eate
din
US
Hos
pita
ls,
1995
–00*
Age
Con
ditio
n
1995
LO
S95
%L
CI
&U
CI
1996
LO
S95
%L
CI
&U
CI
1997
LO
S95
%L
CI
&U
CI
1998
LO
S95
%L
CI
&U
CI
1999
LO
S95
%L
CI
&U
CI
2000
LO
S95
%L
CI
&U
CI
,1
yL
iveb
orn
Acu
tebr
onch
itis
Pneu
mon
iaO
ther
peri
nata
lco
nditi
ons
2.8
3.3
4.2
6.7
(2.8
,2.
8)(3
.3,
3.4)
(4.1
,4.
3)(6
.5,
7.0)
2.8
3.2
3.9
6.6
(2.8
,2.
8)(3
.2,
3.3)
(3.9
,4.
0)(6
.3,
6.8)
3.0
3.2
3.9
7.0
(3.0
,3.
0)(3
.2,
3.2)
(3.8
,4.
0)(6
.8,
7.3)
3.1
3.2
3.8
6.6
(3.1
,3.
1)(3
.2,
3.3)
(3.7
,3.
8)(6
.4,
6.9)
3.1
3.1
3.8
7.3
(3.0
,3.
1)(3
.1,
3.2)
(3.7
,3.
9)(7
.0,
7.6)
3.0
3.0
3.6
6.9
(3.0
,3.
0)(3
.0,
3.1)
(3.5
,3.
7)(6
.7,
7.2)
1–4
yPn
eum
onia
Ast
hma
Flui
dan
del
ectr
olyt
edi
sord
ers
Acu
tebr
onch
itis
3.4
2.4
2.3
2.7
(3.3
,3.
4)(2
.4,
2.5)
(2.2
,2.
3)(2
.6,
2.8)
3.2
2.4
2.1
2.7
(3.1
,3.
2)(2
.3,
2.4)
(2.1
,2.
2)(2
.6,
2.7)
3.2
2.3
2.1
2.6
(3.2
,3.
3)(2
.2,
2.3)
(2.1
,2.
1)(2
.6,
2.6)
3.1
2.2
2.1
2.6
(3.0
,3.
1)(2
.2,
2.3)
(2.0
,2.
1)(2
.5,
2.7)
3.1
2.1
2.0
2.5
(3.0
,3.
1)(2
.1,
2.2)
(2.0
,2.
1)(2
.5,
2.6)
14.0 2.1
1.9
2.5
(14.
0,14
.0)
(2.1
,2.
1)(1
.9,
2.0)
(2.4
,2.
6)
5–9
yA
sthm
aPn
eum
onia
Flui
dan
del
ectr
olyt
edi
sord
ers
App
endi
citis
2.6
3.6
2.2
3.8
(2.6
,2.
6)(3
.5,
3.7)
(2.1
,2.
3)(3
.7,
3.9)
2.4
3.5
2.0
3.8
(2.4
,2.
5)(3
.4,
3.6)
(2.0
,2.
1)(3
.6,
3.9)
2.4
3.5
2.0
3.7
(2.4
,2.
4)(3
.4,
3.6)
(2.0
,2.
1)(3
.6,
3.8)
2.4
3.4
1.9
3.5
(2.4
,2.
5)(3
.3,
3.5)
(1.9
,2.
0)(3
.4,
3.6)
2.4
3.4
2.0
3.5
(2.3
,2.
4)(3
.3,
3.5)
(1.9
,2.
0)(3
.4,
3.6)
2.3
3.1
1.8
3.5
(2.2
,2.
3)(3
.0,
3.2)
(1.8
,1.
9)(3
.4,
3.6)
10–1
4y
App
endi
citis
Ast
hma
Aff
ectiv
edi
sord
ers
Pneu
mon
ia
3.4
2.8
11.7 4.5
(3.3
,3.
4)(2
.8,
2.9)
(11.
3,12
.1)
(4.3
,4.
7)
3.2
2.7
10.0 4.5
(3.1
,3.
3)(2
.7,
2.8)
(9.7
,10
.4)
(4.3
,4.
7)
3.2
2.7
9.5
4.5
(3.1
,3.
3)(2
.6,
2.7)
(9.2
,9.
9)(4
.3,
4.7)
3.1
2.7
8.2
4.1
(3.1
,3.
2)(2
.6,
2.8)
(7.9
,8.
5)(3
.9,
4.3)
3.1
2.6
8.7
4.4
(3.1
,3.
2)(2
.6,
2.7)
(8.3
,9.
1)(4
.2,
4.6)
3.0
2.5
7.4
4.0
(2.9
,3.
1)(2
.5,
2.6)
(7.2
,7.
7)(3
.8,
4.1)
15–1
7y
Nor
mal
preg
nanc
yan
d/or
deliv
ery
Trau
ma
tope
rine
uman
dvu
lva
Aff
ectiv
edi
sord
ers
Oth
erco
mpl
icat
ions
ofpr
egna
ncy
1.5
1.7
9.4
2.2
(1.5
,1.
6)(1
.7,
1.7)
(9.1
,9.
7)(2
.2,
2.3)
1.6
1.7
8.1
2.3
(1.6
,1.
7)(1
.7,
1.7)
(7.9
,8.
3)(2
.2,
2.3)
1.8
1.9
7.7
2.3
(1.8
,1.
8)(1
.8,
1.9)
(7.5
,8.
0)(2
.2,
2.4)
1.8
2.0
6.9
2.3
(1.8
,1.
8)(1
.9,
2.0)
(6.6
,7.
1)(2
.3,
2.4)
1.9
2.0
7.2
2.4
(1.9
,1.
9)(2
.0,
2.1)
(7.0
,7.
5)(2
.4,
2.5)
1.9
2.1
6.3
2.4
(1.9
,2.
0)(2
.0,
2.1)
(6.2
,6.
5)(2
.4,
2.5)
*Sou
rce:
Dat
aar
efr
omth
eH
ealth
care
Cos
tan
dU
tiliz
atio
nPr
ojec
t,19
95–2
000
Nat
ionw
ide
Inpa
tient
Sam
ple
(NIS
).A
genc
yfo
rH
ealth
care
Res
earc
han
dQ
ualit
y.L
OS
indi
cate
sm
ean
leng
thof
stay
inda
ys;
LC
I,lo
wer
confi
denc
ein
terv
al;
and
UC
I,up
per
confi
denc
ein
terv
al.
Dif
fere
nces
inC
Ism
ayno
tbe
appa
rent
asa
resu
ltof
roun
ding
.

Tab
leB
-5.
Cha
ract
eris
tics
ofC
hild
ren
and
Ado
lesc
ent
Hos
pita
lD
isch
arge
sC
ompa
red
with
Adu
ltD
isch
arge
s,20
00*
Cha
ract
eris
tics
All
Age
s
Adu
lts(1
81y)
Chi
ldre
n&
Ado
lesc
ents
(0–1
7y)
Chi
ldre
nan
dA
dole
scen
ts
,1
y1–
4y
5–9
y10
–14
y15
–17
y
Tota
lnu
mbe
rof
disc
harg
esFe
mal
eM
ean
leng
thof
stay
,da
ys(S
E)
Adm
itted
thro
ugh
ED
3005
018
450
(61.
4)4.
9(.
01)
1312
0(4
3.7)
6363
3132
(49.
2)3.
3(.
01)
929
(14.
6)
4685
(73.
6)†
2253
(48.
1)3.
3(.
01)
222
(4.7
)
498
(7.8
)†21
9(4
4.0)
2.9
(.01
)22
7(4
5.7)
320
(5.0
)†14
0(4
3.7)
3.4
(.02
)14
8(4
6.1)
356
(5.6
)†16
8(4
7.3)
4.2
(.03
)15
6(4
3.7)
504
(7.9
)†35
2(6
9.9)
3.7
(.02
)17
6(3
5.0)
Exp
ecte
dpa
yer‡
Priv
ate
Med
icai
dU
nins
ured
1390
0(4
6.7)
5098
(17.
0)14
23(4
.8)
3454
(54.
5)23
93(3
7.8)
324
(5.1
)
2607
(55.
9)17
09(3
6.6)
236
5.1)
239
(48.
4)21
8(4
4.0)
24(4
.9)
167
(52.
4)12
6(3
9.5)
16(4
.9)
197
(55.
7)12
8(3
6.1)
17(4
.8)
243
(48.
3)21
3(4
2.4)
31(6
.1)
Bed
size
ofho
spita
l
Smal
lM
ediu
mL
arge
4392
(14.
6)88
02(2
9.3)
1685
0(5
6.1)
1035
(16.
3)18
37(2
8.9)
3491
(54.
9)
700
(14.
9)13
53(2
8.9)
2632
(56.
2)
107
(21.
5)14
4(2
9.0)
247
(49.
6)
70(2
1.8)
92(2
8.6)
159
(49.
6)
71(1
9.9)
100
(28.
0)18
6(5
2.2)
88(1
7.4)
149
(29.
5)26
8(5
3.1)
Ow
ners
hip
ofho
spita
l
Priv
ate,
not
for
profi
tPr
ivat
e,fo
rpr
ofit
Gov
ernm
ent,
non-
Fede
ral
2254
0(7
5.0)
3674
(12.
2)38
35(1
2.8)
4751
(74.
7)68
6(1
0.8)
926
(14.
6)
3493
(74.
6)53
3(1
1.4)
659
(14.
1)
372
(74.
9)41
(8.1
)85
(17.
0)
244
(76.
0)24
(7.6
)52
(16.
4)
274
(76.
9)30
(8.5
)52
(14.
6)
368
(73.
0)58
(11.
5)78
(15.
4)
Urb
anho
spita
lTe
achi
ngho
spita
l25
200
(84.
0)93
29(3
1.1)
5474
(86.
2)22
39(3
5.2)
4053
(86.
7)15
80(3
3.7)
410
(82.
6)20
0(4
0.2)
275
(86.
1)13
9(4
3.4)
309
(86.
9)14
6(4
1.0)
426
(84.
7)17
3(3
4.4)
Reg
ion
Nor
thea
stM
idw
est
6227
(20.
7)69
93(2
3.3)
1122
(17.
6)14
32(2
2.5)
827
(17.
7)10
19(2
1.8)
86(1
7.4)
111
(22.
3)59
(18.
4)74
(23.
0)64
(18.
1)94
(26.
5)85
(16.
9)13
4(2
6.6)
Sout
hW
est
1135
0(3
7.8)
5479
(18.
2)23
62(3
7.1)
1447
(22.
7)17
75(3
7.9)
1064
(22.
7)18
3(3
6.7)
117
(23.
6)11
0(3
4.3)
78(2
4.2)
115
(32.
3)82
(23.
0)18
0(3
5.6)
105
(20.
9)
*Sou
rce:
Dat
aar
efr
omth
eH
ealth
care
Cos
tan
dU
tiliz
atio
nPr
ojec
t,20
00N
atio
nwid
eIn
patie
ntSa
mpl
e(N
IS).
Age
ncy
for
Hea
lthca
reR
esea
rch
and
Qua
lity.
Chi
ldda
tain
clud
edne
wbo
rns.
All
data
are
num
ber
(per
cent
)of
disc
harg
esin
thou
sand
s(p
erce
ntof
colu
mn
tota
l),u
nles
sot
herw
ise
indi
cate
d.SE
indi
cate
sst
anda
rder
ror;
ED
,Em
erge
ncy
Dep
artm
ent.
The
pre-
1998
defin
ition
sof
bed
size
,ow
ners
hip,
and
teac
hing
stat
usw
ere
used
.†P
erce
ntin
dica
tes
perc
enta
geof
tota
lnu
mbe
rof
disc
harg
esfr
omch
ildre
nan
dad
oles
cent
s0
–17
y(p
erce
ntof
row
tota
l).
‡Not
all
perc
enta
ges
tota
l10
0%,
sinc
edi
scha
rges
paid
byM
edic
are
and
othe
rth
ird-
part
ypa
yers
are
not
incl
uded
.

Tab
leB
-6.
Patie
ntC
hara
cter
istic
sfo
rC
hild
ren
and
Ado
lesc
ent
Hos
pita
lD
isch
arge
sby
Stat
e,R
egio
n,an
dfo
rth
eN
atio
n,20
00*
No.
(%)
ofD
isch
arge
s†
Mea
nL
engt
hof
Stay
,D
ays
(SE
)
Adm
itted
Thr
ough
ED
,N
o.(%
)
Age
,N
o.(%
)
,1
y1–
4y
5–9
y10
–14
y15
–17
y
Exp
ecte
dPa
yer,
No.
(%)‡
Priv
ate
Med
icai
dU
nins
ured
2000
NIS
—N
atio
nal
6363
3.3
(.01
)92
9(1
4.6)
4685
(73.
6)49
8(7
.8)
320
(5.0
)35
6(5
.6)
504
(7.9
)34
54(5
4.3)
2393
(37.
6)32
4(5
.1)
Reg
ions
and
stat
es
Nor
thea
stC
onne
ctic
utM
aine
Mas
sach
uset
tsN
ewJe
rsey
1122
(17.
6)65
(1.3
)22
(0.5
)12
6(2
.5)
177
(3.5
)
3.5
(.02
)3.
8(.
03)
4.7
(.08
)4.
0(.
02)
3.7
(.02
)
197
(17.
6)10
(15.
2)3
(13.
1)10
(8.3
)30
(17.
1)
827
(73.
7)49
(74.
6)15
(68.
0)93
(73.
9)12
8(7
2.6)
86(7
.7)
4(6
.8)
2(7
.2)
8(6
.7)
16(8
.8)
59(5
.3)
3(5
.2)
1(6
.0)
7(5
.4)
10(5
.7)
64(5
.8)
4(6
.3)
2(8
.4)
8(6
.6)
11(6
.1)
85(7
.6)
5(7
.1)
2(1
0.3)
9(7
.3)
12(6
.8)
687
(61.
3)42
(64.
3)12
(54.
4)85
(67.
6)13
6(7
6.8)
370
(33.
0)21
(32.
2)9
(39.
0)36
(28.
7)23
(12.
9)
44(3
.9)
2(2
.3)
...
3(2
.1)
15(8
.2)
New
Yor
kPe
nnsy
lvan
iaM
idw
est
Illin
ois
Iow
a
410
(8.2
)25
6(5
.1)
1432
(22.
5)28
3(5
.6)
61(1
.2)
4.0
(.01
)4.
2(.
02)
3.4
(.01
)3.
5(.
01)
3.5
(.03
)
104
(25.
3)50
(19.
7)20
2(1
4.1)
46(1
6.2)
8(1
3.5)
283
(69.
1)16
6(6
4.8)
1019
(71.
1)20
1(7
0.8)
44(7
2.3)
41(9
.9)
22(8
.7)
111
(7.8
)22
(7.8
)5
(8.0
)
27(6
.5)
18(7
.0)
74(5
.2)
15(5
.5)
3(4
.8)
29(7
.0)
24(9
.4)
94(6
.6)
19(6
.7)
4(6
.4)
31(7
.5)
26(1
0.1)
134
(9.4
)26
(9.2
)5
(8.6
)
208
(50.
7)15
4(6
0.1)
858
(59.
9)15
8(5
5.8)
40(6
6.0)
172
(41.
9)91
(35.
5)45
5(3
1.8)
99(3
4.9)
15(2
4.6)
23(5
.6)
6(2
.2)
63(4
.4)
14(4
.9)
5(7
.7)
Kan
sas
Mic
higa
nM
isso
uri
Wis
cons
inSo
uth
54(1
.1)
208
(4.1
)12
6(2
.5)
111
(2.2
)23
62(3
7.1)
3.1
(.03
)3.
3(.
02)
4.0
(.03
)3.
9(.
03)
3.3
(.01
)
...
32(1
5.3)
23(1
8.0)
16(1
4.4)
320
(13.
6)
40(7
3.6)
152
(73.
1)84
(67.
0)77
(68.
8)17
75(7
5.1)
4(7
.9)
17(8
.2)
12(9
.3)
8(7
.3)
183
(7.7
)
2(4
.0)
11(5
.5)
8(6
.3)
6(5
.5)
110
(4.7
)
3(5
.5)
12(6
.0)
10(7
.8)
9(7
.9)
115
(4.9
)
5(8
.9)
15(7
.1)
12(9
.7)
12(1
0.5)
180
(7.6
)
32(5
9.1)
148
(71.
0)60
(48.
0)73
(65.
4)11
18(4
7.3)
15(2
8.8)
52(2
4.9)
56(4
4.7)
34(3
0.6)
1009
(42.
7)
2(4
.2)
4(1
.8)
4(2
.8)
3(3
.1)
159
(6.8
)Fl
orid
aG
eorg
iaK
entu
cky
Mar
ylan
dN
orth
Car
olin
a
336
(6.7
)19
5(3
.9)
77(1
.5)
100
(2.0
)17
5(3
.5)
3.8
(.01
)3.
9(.
03)
3.7
(.03
)3.
5(.
02)
3.7
(.02
)
62(1
8.6)
17(9
.0)
9(1
2.2)
17(1
6.7)
20(1
1.4)
232
(69.
1)14
7(7
5.1)
51(6
6.8)
74(7
3.5)
129
(74.
0)
31(9
.3)
14(7
.3)
8(1
0.8)
7(7
.1)
13(7
.6)
20(5
.9)
8(4
.3)
5(6
.4)
5(5
.3)
8(4
.9)
24(7
.0)
10(5
.4)
5(6
.6)
6(5
.9)
10(5
.7)
29(8
.7)
15(7
.9)
7(9
.4)
8(8
.2)
14(7
.8)
167
(49.
7)87
(44.
3)35
(45.
6)60
(60.
0)79
(45.
4)
135
(40.
1)88
(45.
3)34
(44.
5)37
(36.
6)75
(42.
9)
25(7
.5)
10(5
.4)
2(2
.7)
2(2
.1)
10(5
.8)
Sout
hC
arol
ina
Tenn
esse
eTe
xas
Vir
gini
aW
est
Vir
gini
a
89(1
.8)
126
(2.5
)55
0(1
0.9)
142
(2.8
)35
(0.7
)
3.5
(.03
)3.
7(.
02)
3.8
(.01
)3.
7(.
03)
3.2
(.04
)
12(1
3.9)
24(1
8.6)
74(1
3.4)
20(1
4.2)
6(1
8.5)
60(6
8.0)
91(7
2.4)
397
(72.
3)10
2(7
1.5)
24(6
8.5)
9(9
.9)
11(8
.5)
45(8
.2)
11(7
.9)
4(1
1.3)
6(6
.2)
7(5
.2)
27(5
.0)
8(5
.5)
2(6
.6)
6(6
.8)
7(5
.6)
32(5
.9)
10(6
.8)
2(5
.8)
8(9
.1)
10(8
.2)
48(8
.7)
12(8
.3)
3(7
.9)
34(3
7.8)
57(4
4.9)
237
(43.
1)91
(63.
8)13
(37.
7)
49(5
4.8)
62(4
8.8)
250
(45.
4)39
(27.
6)16
(45.
7)
4(4
.2)
3(2
.8)
47(8
.5)
7(4
.7)
1(4
.2)
Wes
tA
rizo
naC
alif
orni
aC
olor
ado
Haw
aii
1447
(22.
7)12
3(2
.5)
810
(16.
1)94
(1.9
)26
(0.5
)
3.1
(.01
)2.
9(.
02)
3.4
(.01
)3.
4(.
02)
3.3
(.05
)
210
(14.
5)16
(12.
8)11
3(1
3.9)
13(1
3.9)
4(1
4.4)
1064
(73.
6)92
(74.
3)59
7(7
3.7)
71(7
5.8)
19(7
5.4)
117
(8.1
)9
(7.4
)61
(7.5
)6
(6.6
)2
(8.5
)
78(5
.4)
6(4
.8)
42(5
.2)
4(3
.9)
1(4
.6)
82(5
.7)
7(5
.3)
49(6
.0)
5(5
.4)
1(4
.7)
105
(7.3
)10
(8.2
)61
(7.5
)8
(8.4
)2
(6.8
)
792
(54.
7)54
(44.
1)42
1(5
1.9)
62(6
5.6)
14(5
3.1)
559
(38.
6)56
(45.
6)34
2(4
2.3)
24(2
6.0)
7(2
7.4)
57(4
.0)
6(4
.6)
24(3
.0)
6(6
.6)
...
Ore
gon
Uta
hW
ashi
ngto
n
66(1
.3)
68(1
.4)
116
(2.3
)
3.1
(.02
)3.
8(.
04)
3.2
(.02
)
7(1
0.4)
7(1
0.5)
17(1
4.4)
50(7
6.1)
54(7
8.4)
86(7
4.6)
4(6
.3)
4(6
.5)
9(7
.5)
3(4
.3)
2(3
.5)
5(4
.7)
4(5
.5)
3(4
.7)
7(5
.8)
5(7
.8)
5(6
.8)
8(7
.3)
37(5
6.4)
51(7
4.9)
64(5
5.7)
21(3
2.1)
13(1
9.8)
48(4
1.7)
4(6
.1)
2(2
.7)
1(1
.1)
*Sou
rce:
Dat
aar
efr
omth
eH
ealth
care
Cos
tan
dU
tiliz
atio
nPr
ojec
t,20
00N
atio
nwid
eIn
patie
ntSa
mpl
e(N
IS)
(nat
iona
lan
dre
gion
ales
timat
es)
and
Stat
eIn
patie
ntD
atab
ases
(sta
tefig
ures
).A
genc
yfo
rH
ealth
care
Res
earc
han
dQ
ualit
yan
dC
ontr
ibut
ing
Stat
eD
ata
Part
ners
.C
hild
ren
data
incl
uded
new
born
s.A
llda
taar
enu
mbe
r(p
erce
nt)
ofdi
scha
rges
inth
ousa
nds
(per
cent
ofro
wto
tal)
unle
ssot
herw
ise
indi
cate
d.SE
indi
cate
sst
anda
rder
ror;
ED
,E
mer
genc
yD
epar
tmen
t.E
llips
esin
dica
tefe
wer
than
1000
disc
harg
es.
†Per
cent
indi
cate
spe
rcen
tage
ofto
tal
num
ber
ofdi
scha
rges
from
child
ren
and
adol
esce
nts
0–1
7y
(per
cent
ofco
lum
nto
tal)
.‡R
owpe
rcen
tage
sdo
not
tota
l10
0%,
sinc
edi
scha
rges
paid
byM
edic
are
and
othe
rth
ird-
part
ypa
yers
are
not
incl
uded
.

Table B-7. Characteristics of Children and Adolescent Hospital Discharges by Expected Payer, 2000*
Characteristics
Expected Payer
Private Medicaid Uninsured
Number of dischargesMean length of stay, days (SE)Admitted through ED
3454 (54.3)3.1 (.01)
429 (12.4)
2393 (37.6)3.7 (.01)
408 (17.0)
324 (5.1)2.7 (.02)
63 (19.4)
Bed size of hospital
SmallMediumLarge
505 (14.6)956 (27.7)
1993 (57.7)
436 (18.2)754 (31.5)
1204 (50.3)
54 (16.8)72 (22.3)
197 (60.9)
Ownership of hospital
Private, not for profitPrivate, for profitGovernment, non-Federal
2808 (81.3)333 (9.6)314 (9.1)
1634 (68.3)285 (11.9)474 (19.8)
193 (59.6)30 (9.2)
101 (31.2)
Urban hospitalTeaching hospital
3072 (88.9)1233 (35.7)
1981 (82.8)852 (35.6)
272 (84.2)98 (30.4)
*Source: Data are from the Healthcare Cost and Utilization Project, 2000 Nationwide Inpatient Sample (NIS). Agency for HealthcareResearch and Quality. Children data included newborns. All data are number (percent) of discharges in thousands unless otherwise indicated.SE indicates standard error; ED, Emergency Department. The pre-1998 definitions of bed size, ownership, and teaching status were used.

Tab
leB
-8.
Hos
pita
lC
hara
cter
istic
sfo
rC
hild
ren
and
Ado
lesc
ent
Hos
pita
lD
isch
arge
s,by
Stat
e,R
egio
n,an
dfo
rth
eN
atio
n,20
00*
Hos
pita
lB
edSi
ze
Smal
lM
ediu
mL
arge
Ow
ners
hip
ofH
ospi
tal
Priv
ate,
Not
For
Profi
tPr
ivat
e,Fo
rPr
ofit
Gov
ernm
ent,
Non
-Fed
eral
Urb
anH
ospi
tal
Teac
hing
Hos
pita
l
2000
NIS
—N
atio
nal
1035
(16.
3)18
37(2
8.9)
3491
(54.
9)47
51(7
4.7)
686
(10.
8)92
6(1
4.6)
5474
(86.
0)22
39(3
5.2)
Reg
ions
and
stat
es
Nor
thea
stC
onne
ctic
utM
aine
Mas
sach
uset
tsN
ewJe
rsey
200
(17.
8)17
(25.
8)6
(25.
1)7
(5.4
)18
(10.
4)
429
(38.
3)23
(35.
5)8
(35.
6)51
(40.
4)47
(26.
7)
493
(43.
9)25
(37.
6)8
(36.
2)65
(52.
1)11
2(6
3.3)
1060
(94.
5)64
(98.
8)21
(93.
9)11
8(9
3.7)
171
(97.
0)
26(2
.3)
0(0
.0)
...
5(4
.3)
0(0
.0)
36(3
.2)
...
...
2(1
.4)
5(2
.7)
1035
(92.
3)61
(94.
1)12
(54.
9)11
2(8
9.1)
176
(99.
8)
736
(65.
6)53
(81.
4)11
(50.
6)82
(65.
1)11
1(6
2.8)
New
Yor
kPe
nnsy
lvan
iaM
idw
est
Illin
ois
Iow
a
31(7
.6)
47(1
8.3)
238
(16.
7)43
(15.
1)13
(21.
6)
140
(34.
1)10
7(4
2.0)
433
(30.
2)87
(30.
7)16
(25.
9)
276
(67.
3)10
6(4
1.5)
761
(53.
1)16
6(5
8.4)
39(6
4.6)
342
(83.
3)24
4(9
5.5)
1264
(88.
2)25
9(9
1.3)
46(7
6.8)
7(1
.8)
1(0
.3)
27(1
.9)
6(2
.1)
0(0
.0)
60(1
4.7)
...
141
(9.9
)12
(4.3
)14
(23.
2)
391
(95.
3)21
9(8
5.6)
1191
(83.
2)25
2(8
8.8)
40(6
5.8)
311
(75.
9)15
4(6
0.3)
530
(37.
0)13
8(4
8.7)
32(5
3.2)
Kan
sas
Mic
higa
nM
isso
uri
Wis
cons
inSo
uth
8(1
4.3)
17(8
.2)
30(2
4.1)
28(2
5.6)
269
(11.
4)
9(1
7.6)
57(2
7.5)
24(1
9.1)
46(4
1.2)
558
(23.
6)
40(7
3.7)
152
(73.
3)79
(62.
5)40
(36.
2)15
35(6
5.0)
32(6
0.2)
196
(94.
2)10
4(8
2.4)
106
(95.
1)14
73(6
2.4)
9(1
7.6)
0(0
.0)
8(6
.3)
...
438
(18.
6)
11(2
1.0)
12(5
.8)
14(1
0.8)
...
451
(19.
1)
32(5
9.9)
185
(88.
9)99
(78.
9)84
(75.
4)19
47(8
2.4)
22(4
1.0)
141
(67.
8)57
(45.
0)54
(48.
1)54
7(2
3.1)
Flor
ida
Geo
rgia
Ken
tuck
yM
aryl
and
Nor
thC
arol
ina
32(9
.7)
15(7
.8)
4(5
.3)
28(2
8.2)
7(4
.2)
50(1
4.8)
72(3
6.9)
21(2
7.5)
29(2
8.8)
20(1
1.3)
250
(74.
5)10
6(5
4.4)
52(6
8.3)
35(3
5.1)
144
(82.
6)
193
(57.
5)19
9(6
1.1)
57(7
4.2)
98(9
7.9)
115
(65.
8)
83(2
4.8)
23(1
1.7)
8(1
0.8)
2(2
.1)
6(3
.5)
56(1
6.7)
50(2
5.4)
10(1
3.2)
...
52(2
9.6)
322
(96.
0)14
3(7
3.0)
40(5
2.0)
93(9
2.9)
132
(75.
6)
133
(39.
7)68
(34.
6)20
(25.
8)60
(59.
9)73
(41.
5)So
uth
Car
olin
aTe
nnes
see
Texa
sV
irgi
nia
Wes
tV
irgi
nia
2(2
.7)
8(6
.7)
53(9
.6)
11(7
.4)
3(7
.2)
27(3
1.0)
31(2
4.4)
194
(35.
2)40
(27.
7)8
(21.
6)
59(6
6.8)
88(7
0.0)
266
(48.
3)80
(56.
5)23
(65.
7)
45(5
0.3)
83(6
5.8)
268
(48.
7)10
0(7
0.3)
28(7
9.0)
19(2
1.3)
21(1
6.9)
179
(32.
4)23
(16.
4)5
(13.
9)
25(2
8.4)
22(1
7.3)
83(1
5.1)
16(1
1.1)
2(6
.8)
68(7
6.9)
104
(82.
3)50
1(9
1.0)
119
(83.
3)19
(53.
3)
44(4
9.5)
66(5
2.0)
228
(41.
4)74
(52.
0)19
(53.
3)W
est
Ari
zona
Cal
ifor
nia
Col
orad
oH
awai
i
328
(22.
7)18
(14.
7)16
1(1
9.9)
22(2
3.8)
13(4
9.7)
416
(28.
8)31
(25.
4)21
5(2
6.6)
29(3
1.2)
13(5
1.4)
702
(48.
6)80
(65.
1)45
0(5
5.5)
57(6
1.0)
7(2
9.0)
954
(66.
0)96
(78.
0)54
4(6
7.1)
55(5
8.1)
17(6
5.3)
194
(13.
4)18
(14.
4)11
3(1
3.9)
21(2
1.9)
...
298
(20.
6)9
(7.2
)12
0(1
4.8)
17(1
8.0)
5(1
7.4)
1301
(89.
9)11
4(9
2.5)
759
(93.
7)83
(87.
8)16
(61.
0)
425
(29.
4)59
(47.
9)32
2(3
9.7)
25(2
6.5)
15(5
6.2)
Ore
gon
Uta
hW
ashi
ngto
n
13(4
9.7)
25(3
6.1)
33(2
8.4)
9(1
3.5)
18(2
6.9)
27(2
3.4)
51(7
6.6)
36(5
2.8)
53(4
5.7)
54(8
1.7)
44(6
4.4)
87(7
5.2)
1(1
.6)
18(2
6.8)
3(2
.2)
11(1
6.7)
5(7
.5)
23(2
0.0)
50(7
5.9)
55(8
1.3)
98(8
4.7)
29(4
3.9)
20(2
9.2)
48(4
1.6)
*Sou
rce:
The
Hea
lthca
reC
ost
and
Util
izat
ion
Proj
ect,
2000
Nat
ionw
ide
Inpa
tient
Sam
ple
(NIS
)(n
atio
nal
and
regi
onal
estim
ates
)an
dSt
ate
Inpa
tient
Dat
abas
es(s
tate
figur
es).
Age
ncy
for
Hea
lthca
reR
esea
rch
and
Qua
lity
and
Con
trib
utin
gSt
ate
Dat
aPa
rtne
rs.
Dat
ain
clud
edne
wbo
rns.
All
data
are
num
ber
(per
cent
)of
disc
harg
esin
thou
sand
s.E
llips
esin
dica
tefe
wer
than
1000
disc
harg
es.T
hepr
e-19
98de
finiti
ons
ofbe
dsi
ze,
owne
rshi
p,an
dte
achi
ngst
atus
wer
eus
ed.

Tab
leB
-9.
Mos
tFr
eque
ntPr
inci
pal
Dia
gnos
es,
Gro
uped
byG
ener
alC
ondi
tion
orB
ody
Syst
em,
Am
ong
Chi
ldre
nTr
eate
din
US
Hos
pita
lsC
ompa
red
toA
dults
Trea
ted
inU
SH
ospi
tals
,by
Age
,20
00*
Prin
cipa
lD
iagn
osis
No.
ofD
isch
arge
sin
Tho
usan
ds(%
ofD
isch
arge
sby
Age
Gro
up)
,1
y1–
4y
5–9
y10
–14
y15
–17
yA
dults
($18
y)
Cer
tain
cond
ition
sor
igin
atin
gin
peri
nata
lpe
riod
Dis
ease
sof
the
resp
irat
ory
syst
emD
isea
ses
ofth
edi
gest
ive
syst
emC
onge
nita
lan
omal
ies
End
ocri
ne,
nutr
ition
al,
met
abol
ic,
and
imm
unity
diso
rder
s
4220
(90.
1)20
2(4
.3)
52(1
.1)
44(0
.9)
33(0
.7)
199
(39.
9)54
(10.
8)17
(3.5
)49
(9.8
)
81(2
5.4)
45(1
4.0)
11(3
.4)
20(6
.3)
46(1
2.9)
54(1
5.2)
18(5
.2)
25(4
.9)
42(8
.4)
13(2
.7)
2735
(9.1
)30
15(1
0.0)
Infe
ctio
usan
dpa
rasi
ticdi
seas
esD
isea
ses
ofth
ene
rvou
ssy
stem
and
sens
eor
gans
Sym
ptom
s,si
gns,
and
ill-d
efine
dco
nditi
ons
and
fact
ors
influ
enci
nghe
alth
Dis
ease
sof
the
geni
tour
inar
ysy
stem
Inju
ryan
dpo
ison
ing
31(0
.7)
25(0
.5)
24(0
.5)
20(0
.4)
16(0
.4)
17(3
.5)
36(7
.3)
16(3
.2)
15(3
.1)
47(9
.5)
21(6
.4)
14(4
.3)
14(4
.3)
47(1
4.7)
17(4
.9)
14(4
.0)
13(3
.7)
60(1
6.8)
12(2
.4)
12(2
.4)
19(3
.8)
70(1
3.8)
1098
(3.7
)15
50(5
.2)
2417
(8.0
)N
eopl
asm
sM
enta
ldi
sord
ers
Dis
ease
sof
mus
culo
skel
etal
syst
eman
dco
nnec
tive
tissu
ePr
egna
ncy,
child
birt
h,an
dpu
erpe
rium
Dis
ease
sof
the
circ
ulat
ory
syst
emD
isch
arge
sw
ithdi
agno
sis
inth
eto
p10
4667
(99.
6)
14(2
.8)
465
(93.
4)
13(4
.1)
14(4
.4)
280
(87.
4)
14(3
.8)
55(1
5.5)
15(4
.2)
306
(86.
1)
11(2
.2)
73(1
4.5)
188
(37.
2)
465
(92.
3)
1868
(6.2
)16
73(5
.6)
1453
(4.8
)44
08(1
4.7)
6834
(22.
7)27
051
(90.
0)
*Sou
rce:
Dat
aar
efr
omth
eH
ealth
care
Cos
tan
dU
tiliz
atio
nPr
ojec
t,20
00N
atio
nwid
eIn
patie
ntSa
mpl
e(N
IS).
Age
ncy
for
Hea
lthca
reR
esea
rch
and
Qua
lity.
Chi
ldda
tain
clud
edne
wbo
rns.
All
data
are
num
ber
(per
cent
)of
disc
harg
esin
thou
sand
s.Pe
rcen
tage
sm
ayno
tm
atch
num
bers
beca
use
ofro
undi
ng.
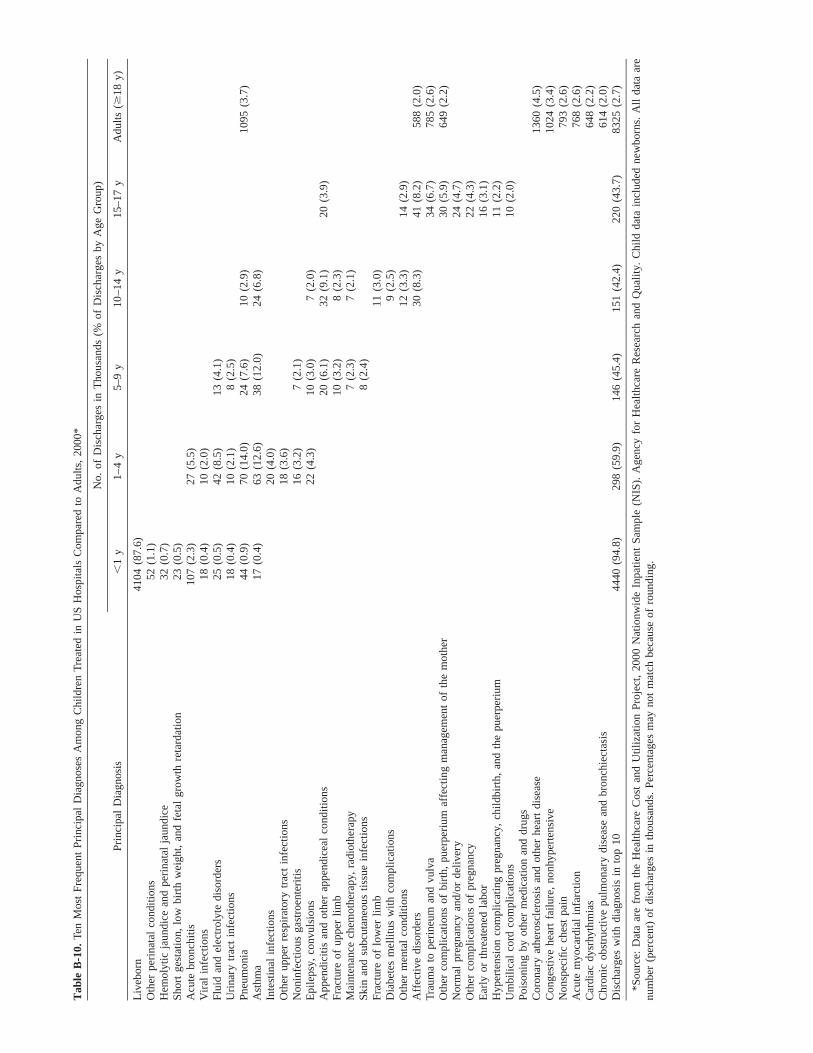
Tab
leB
-10.
Ten
Mos
tFr
eque
ntPr
inci
pal
Dia
gnos
esA
mon
gC
hild
ren
Trea
ted
inU
SH
ospi
tals
Com
pare
dto
Adu
lts,
2000
*
Prin
cipa
lD
iagn
osis
No.
ofD
isch
arge
sin
Tho
usan
ds(%
ofD
isch
arge
sby
Age
Gro
up)
,1
y1–
4y
5–9
y10
–14
y15
–17
yA
dults
($18
y)
Liv
ebor
nO
ther
peri
nata
lco
nditi
ons
Hem
olyt
icja
undi
cean
dpe
rina
tal
jaun
dice
Shor
tge
stat
ion,
low
birt
hw
eigh
t,an
dfe
tal
grow
thre
tard
atio
nA
cute
bron
chiti
s
4104
(87.
6)52
(1.1
)32
(0.7
)23
(0.5
)10
7(2
.3)
27(5
.5)
Vir
alin
fect
ions
Flui
dan
del
ectr
olyt
edi
sord
ers
Uri
nary
trac
tin
fect
ions
Pneu
mon
iaA
sthm
a
18(0
.4)
25(0
.5)
18(0
.4)
44(0
.9)
17(0
.4)
10(2
.0)
42(8
.5)
10(2
.1)
70(1
4.0)
63(1
2.6)
13(4
.1)
8(2
.5)
24(7
.6)
38(1
2.0)
10(2
.9)
24(6
.8)
1095
(3.7
)
Inte
stin
alin
fect
ions
Oth
erup
per
resp
irat
ory
trac
tin
fect
ions
Non
infe
ctio
usga
stro
ente
ritis
Epi
leps
y,co
nvul
sion
sA
ppen
dici
tisan
dot
her
appe
ndic
eal
cond
ition
s
20(4
.0)
18(3
.6)
16(3
.2)
22(4
.3)
7(2
.1)
10(3
.0)
20(6
.1)
7(2
.0)
32(9
.1)
20(3
.9)
Frac
ture
ofup
per
limb
Mai
nten
ance
chem
othe
rapy
,ra
diot
hera
pySk
inan
dsu
bcut
aneo
ustis
sue
infe
ctio
nsFr
actu
reof
low
erlim
bD
iabe
tes
mel
litus
with
com
plic
atio
ns
10(3
.2)
7(2
.3)
8(2
.4)
8(2
.3)
7(2
.1)
11(3
.0)
9(2
.5)
Oth
erm
enta
lco
nditi
ons
Aff
ectiv
edi
sord
ers
Trau
ma
tope
rine
uman
dvu
lva
Oth
erco
mpl
icat
ions
ofbi
rth,
puer
peri
umaf
fect
ing
man
agem
ent
ofth
em
othe
rN
orm
alpr
egna
ncy
and/
orde
liver
y
12(3
.3)
30(8
.3)
14(2
.9)
41(8
.2)
34(6
.7)
30(5
.9)
24(4
.7)
588
(2.0
)78
5(2
.6)
649
(2.2
)
Oth
erco
mpl
icat
ions
ofpr
egna
ncy
Ear
lyor
thre
aten
edla
bor
Hyp
erte
nsio
nco
mpl
icat
ing
preg
nanc
y,ch
ildbi
rth,
and
the
puer
peri
umU
mbi
lical
cord
com
plic
atio
nsPo
ison
ing
byot
her
med
icat
ion
and
drug
s
22(4
.3)
16(3
.1)
11(2
.2)
10(2
.0)
Cor
onar
yat
hero
scle
rosi
san
dot
her
hear
tdi
seas
eC
onge
stiv
ehe
art
failu
re,
nonh
yper
tens
ive
Non
spec
ific
ches
tpa
in
1360
(4.5
)10
24(3
.4)
793
(2.6
)A
cute
myo
card
ial
infa
rctio
nC
ardi
acdy
srhy
thm
ias
Chr
onic
obst
ruct
ive
pulm
onar
ydi
seas
ean
dbr
onch
iect
asis
Dis
char
ges
with
diag
nosi
sin
top
1044
40(9
4.8)
298
(59.
9)14
6(4
5.4)
151
(42.
4)22
0(4
3.7)
768
(2.6
)64
8(2
.2)
614
(2.0
)83
25(2
.7)
*Sou
rce:
Dat
aar
efr
omth
eH
ealth
care
Cos
tan
dU
tiliz
atio
nPr
ojec
t,20
00N
atio
nwid
eIn
patie
ntSa
mpl
e(N
IS).
Age
ncy
for
Hea
lthca
reR
esea
rch
and
Qua
lity.
Chi
ldda
tain
clud
edne
wbo
rns.
All
data
are
num
ber
(per
cent
)of
disc
harg
esin
thou
sand
s.Pe
rcen
tage
sm
ayno
tm
atch
beca
use
ofro
undi
ng.