health disparities in wv and the wvu health disparities...
TRANSCRIPT
Health Disparities in WV and the WVU Health Disparities Program
Stephenie K. Kennedy, EdD 12/1/2016
Health Disparities
Inequalities in the prevalence, morbidity, mortality, or survival rates in a given
population as compared to the health status of the general population.
Disparities in WV
• Provider shortage areas • Geography • Socioeconomic Status • Health Insurance status • Education
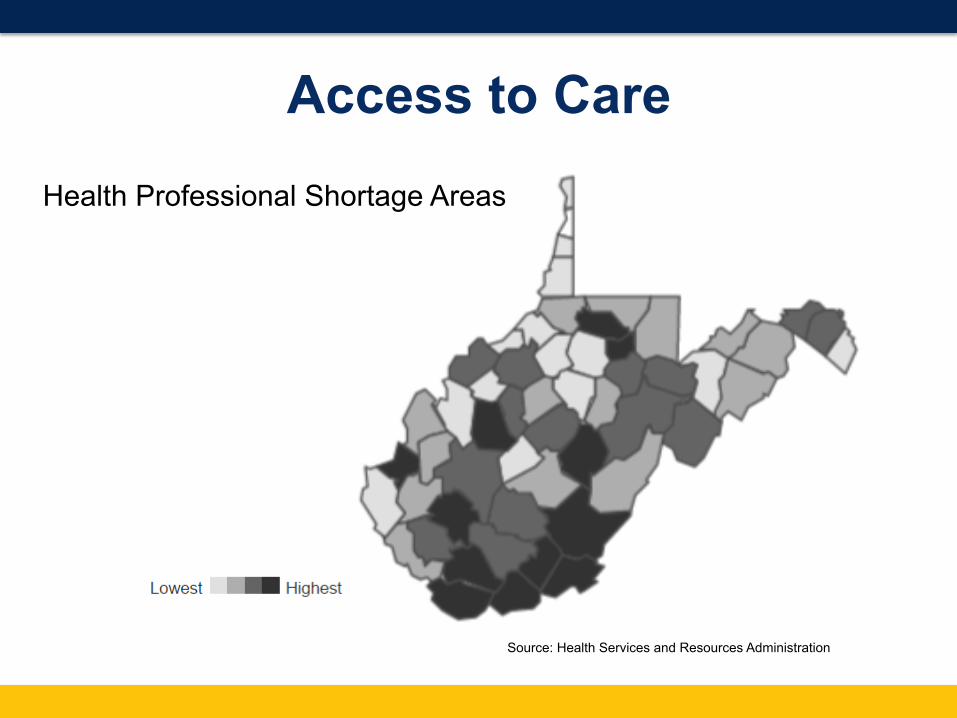
Access to Care
Health Professional Shortage Areas
Source: Health Services and Resources Administration
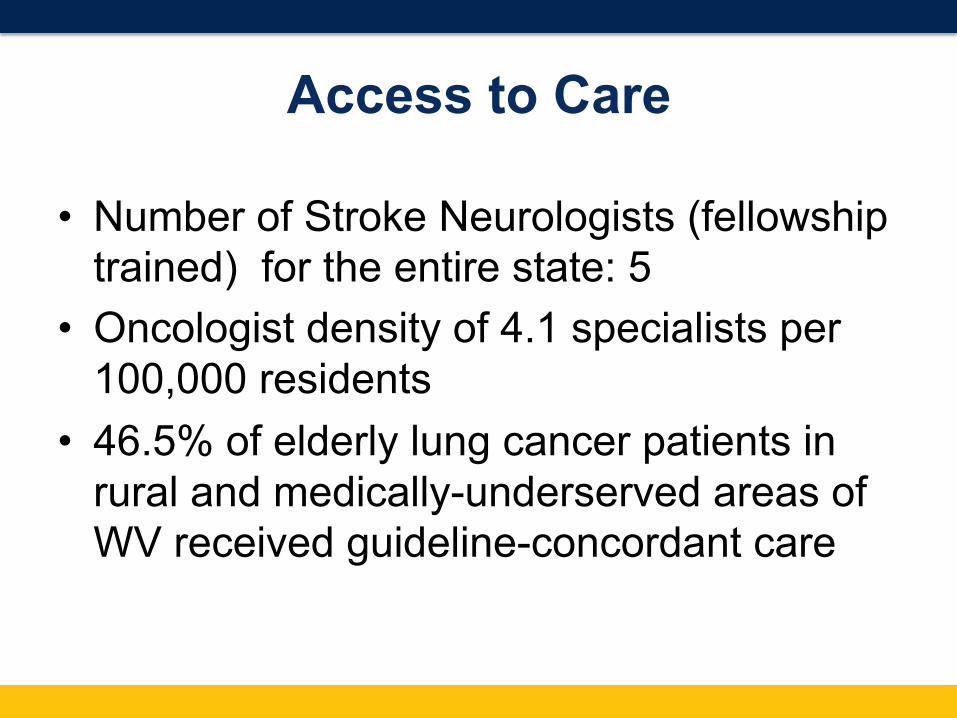
Access to Care
• Number of Stroke Neurologists (fellowship trained) for the entire state: 5
• Oncologist density of 4.1 specialists per 100,000 residents
• 46.5% of elderly lung cancer patients in rural and medically-underserved areas of WV received guideline-concordant care

Geography

Socioeconomic Status
• Average per capita income - WV: $23,327 • Average per capita income - US: $28,555 • Average household income – WV: $41,576 • Average household income – US: $53,482
• Poverty rate in WV: 17.9% • Poverty rate in US: 13.5%
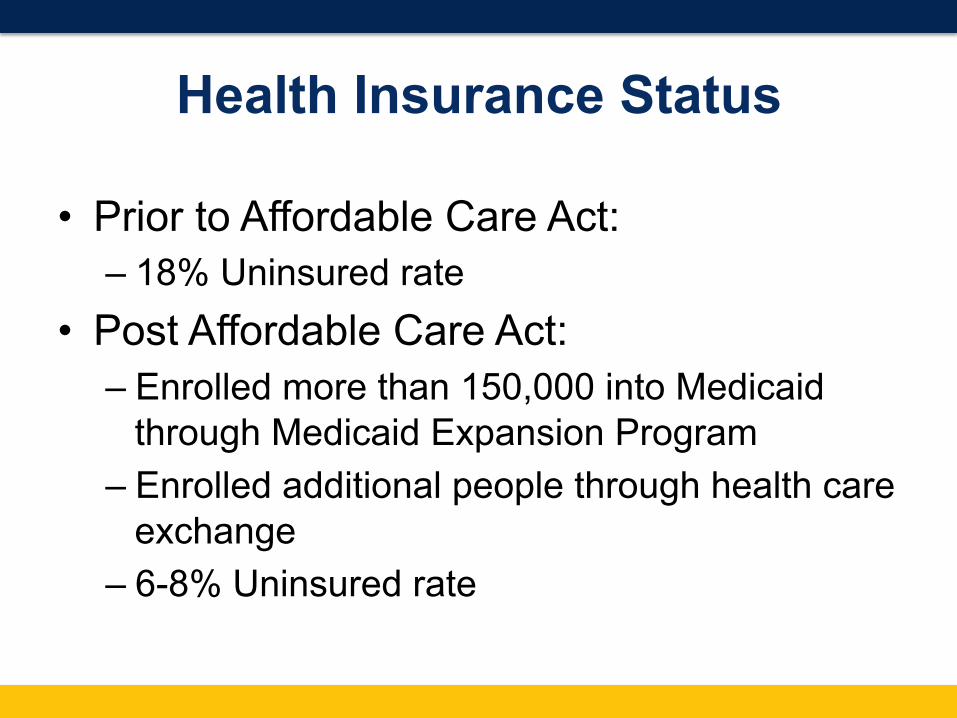
Health Insurance Status
• Prior to Affordable Care Act: – 18% Uninsured rate
• Post Affordable Care Act: – Enrolled more than 150,000 into Medicaid
through Medicaid Expansion Program – Enrolled additional people through health care
exchange – 6-8% Uninsured rate
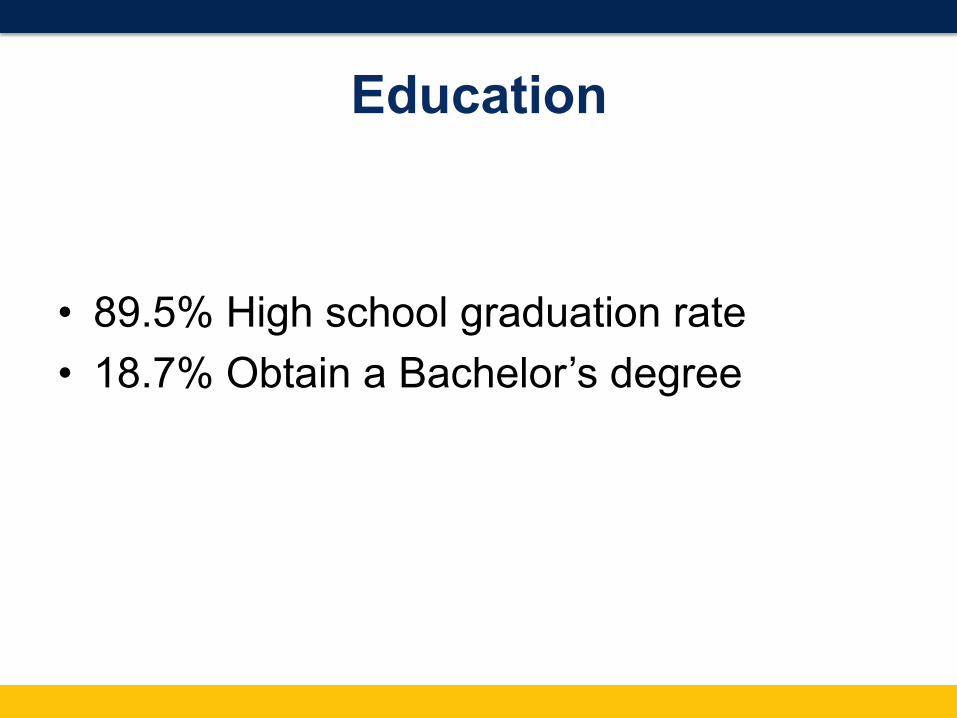
Education
• 89.5% High school graduation rate • 18.7% Obtain a Bachelor’s degree
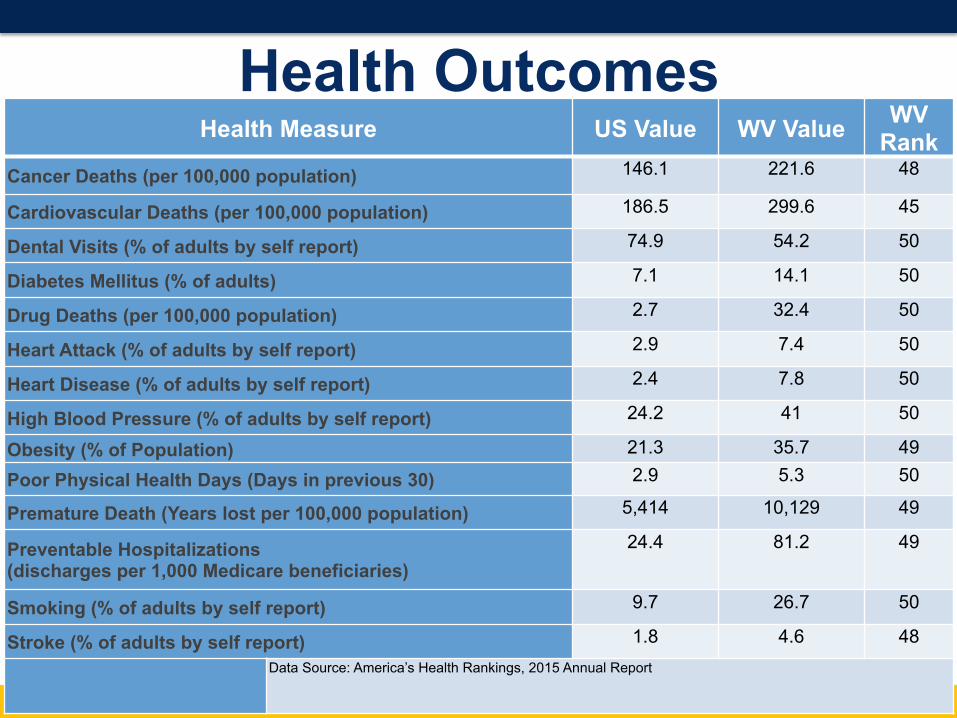
Health Outcomes Health Measure US Value WV Value WV
Rank Cancer Deaths (per 100,000 population) 146.1 221.6 48
Cardiovascular Deaths (per 100,000 population) 186.5 299.6 45
Dental Visits (% of adults by self report) 74.9 54.2 50
Diabetes Mellitus (% of adults) 7.1 14.1 50
Drug Deaths (per 100,000 population) 2.7 32.4 50
Heart Attack (% of adults by self report) 2.9 7.4 50
Heart Disease (% of adults by self report) 2.4 7.8 50
High Blood Pressure (% of adults by self report) 24.2 41 50
Obesity (% of Population) 21.3 35.7 49
Poor Physical Health Days (Days in previous 30) 2.9 5.3 50
Premature Death (Years lost per 100,000 population) 5,414 10,129 49
Preventable Hospitalizations (discharges per 1,000 Medicare beneficiaries)
24.4 81.2 49
Smoking (% of adults by self report) 9.7 26.7 50
Stroke (% of adults by self report) 1.8 4.6 48
Data Source: America’s Health Rankings, 2015 Annual Report

Health-Related Quality of Life Measures
West Virginia United States
14 or More Physically Unhealthy Days per Month
16.9% 11.1%
14 or More Mentally Unhealthy Days per Month
14.9% 10.7%
Fair or Poor Self-Rated Worth 23.4% 16.1%
Behavioral Risk Factor Surveillance System (BRFSS)/CDC
Use data…
• Identify the disparities • Look for the story • Drives the research • Develops the intervention • Leads to dissemination • Maybe the science is dissemination research,
maybe it is systems-based practice change, maybe it is new drug discovery addressing something unique to our population, etc.
Bright Spots
• Changing the narrative • Building on the strengths of the population • Identifying places and people that are
doing better than expected given their resources
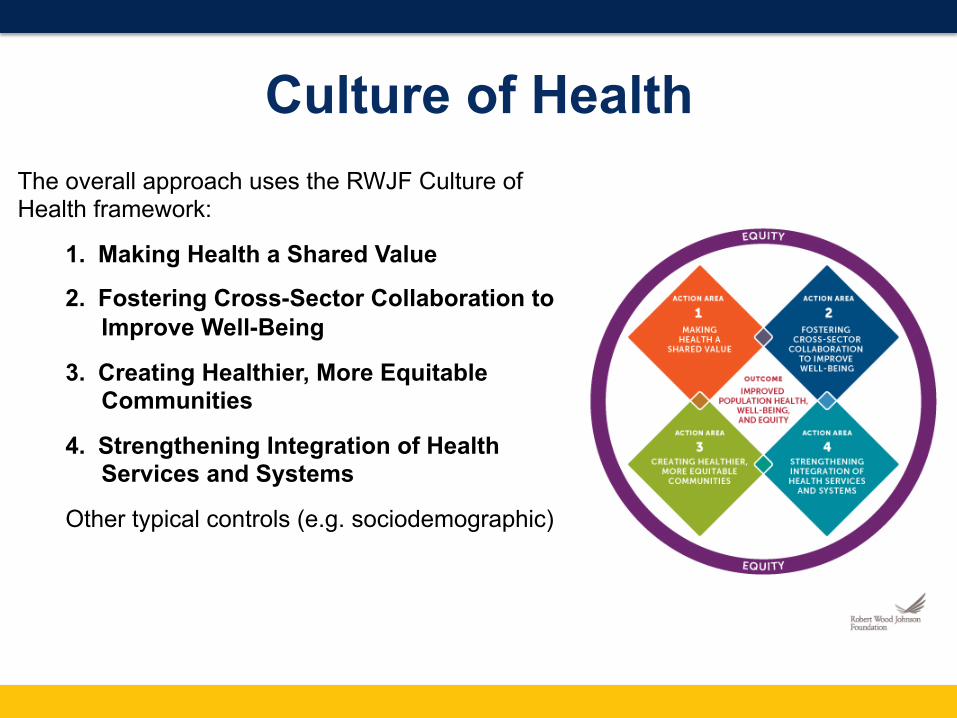
Culture of Health The overall approach uses the RWJF Culture of
Health framework:
1. Making Health a Shared Value
2. Fostering Cross-Sector Collaboration to Improve Well-Being
3. Creating Healthier, More Equitable Communities
4. Strengthening Integration of Health Services and Systems
Other typical controls (e.g. sociodemographic)
Delineating Bright Spots
• Identify Appalachian counties with better than expected health.
• Identify the relationship between each of 19 outcomes and 29 drivers among Appalachian and “Appalachian-like” counties.
• Determine predicted values for each outcome in each Appalachian county given its drivers.
• Calculate the gap between predicted and observed values for each outcome.
• Find the counties with the largest average residual. These counties are, on average, the most “unexpectedly healthy” and therefore “Bright Spots.”

Outcome Measures Category Measure
Behavioral Health
Suicide IncidenceDepression PrevalenceExcessive DrinkingPoisoning MortalityOpioid Prescription Rates
Children Low Birthweight BirthsInfant Mortality
Mortality
Heart Disease DeathsYears of Potential Life Lost RateCancer DeathsInjury DeathsStroke DeathsCOPD Deaths
Category Measure
Morbidity
Physically Unhealthy DaysMentally Unhealthy DaysMedicare HCCsDiabetes PrevalenceObesity Prevalence
Health Care Systems and
Utilization
Heart Disease Hospitalizations
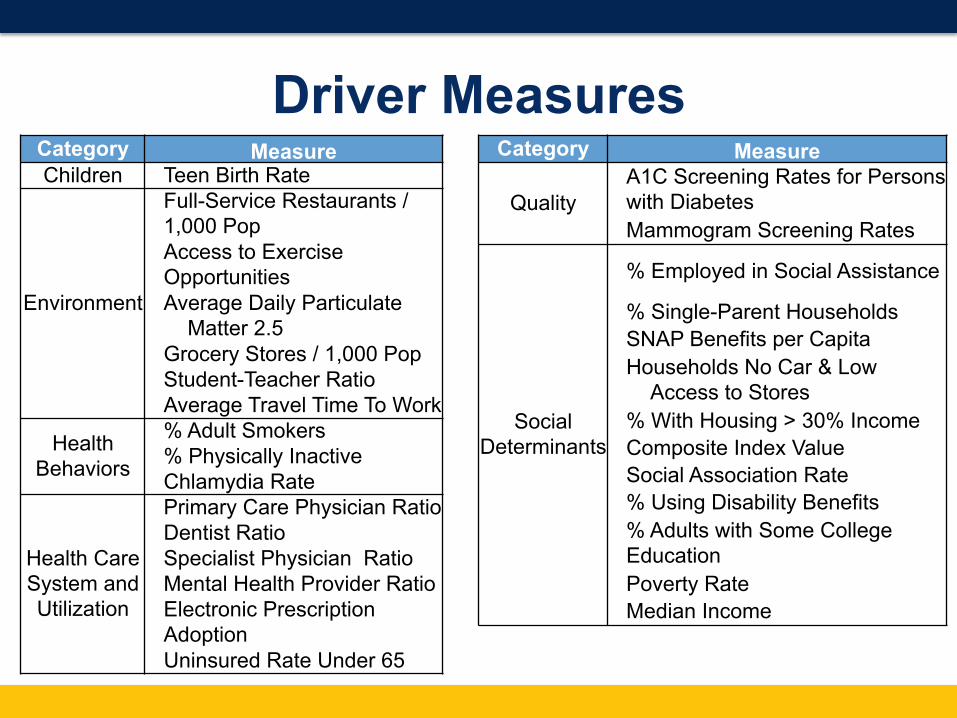
Driver Measures Category Measure
Children Teen Birth Rate
Environment
Full-Service Restaurants / 1,000 PopAccess to Exercise OpportunitiesAverage Daily Particulate
Matter 2.5Grocery Stores / 1,000 PopStudent-Teacher RatioAverage Travel Time To Work
Health Behaviors
% Adult Smokers% Physically InactiveChlamydia Rate
Health Care System and Utilization
Primary Care Physician RatioDentist RatioSpecialist Physician RatioMental Health Provider RatioElectronic Prescription AdoptionUninsured Rate Under 65
Category Measure
Quality A1C Screening Rates for Persons with DiabetesMammogram Screening Rates
Social Determinants
% Employed in Social Assistance
% Single-Parent HouseholdsSNAP Benefits per CapitaHouseholds No Car & Low
Access to Stores% With Housing > 30% IncomeComposite Index ValueSocial Association Rate% Using Disability Benefits% Adults with Some College EducationPoverty RateMedian Income

Bright Spots: Top Ten Residuals Non-Metro
County State Avg. Residual
Wayne Kentucky 0.71
Grant West Virginia 0.67
Noxubee Mississippi 0.64
McCreary Kentucky 0.62
Morgan Kentucky 0.57
Calhoun West Virginia 0.55
Russell Kentucky 0.54
Bledsoe Tennessee 0.53
Pulaski Kentucky 0.52
Hardy West Virginia 0.49
MetroCounty State Avg.
ResidualWirt West Virginia 0.44Hale Alabama 0.41Clay West Virginia 0.40
Madison North Carolina 0.35
Henderson North Carolina 0.34
Sequatchie Tennessee 0.33
Tioga New York 0.32Whitfield Georgia 0.31Marshall Mississippi 0.29Jefferson West Virginia 0.29
WVU Health Disparities Program
• Mission: fostering multidisciplinary collaboration among researchers and practitioners across West Virginia to achieve health equity in the Appalachian region.
WVU Health Disparities Program
• Programming – Highlights health disparities research across
the University campus – Promotes collaboration by focusing on funding
announcements and networking sessions – Shares available data resources and
statewide partnerships that can be helpful in building research proposals
WVU Health Disparities Program
• Planning/Implementing – “Meeting of the Minds” sessions for the Spring
Semester – Expansion of Steering Committee to include
representation from all Colleges and Schools across the campus
– Increase in the Program’s visibility and mission, both inside and outside the institution
– Strategic plan completion
Questions/Discussion