health disparities & hiap - minnesota public health ... keynote oakes 2014.pdfmpha june 2014...
TRANSCRIPT

J. Michael Oakes, PhD
Associate Professor
Co-Director, US Census Research Data Center
Division of Epidemiology University of Minnesota
MPHA June 2014
Health Disparities & HiAP


Conclusion
1. Stark health disparities must be mitigated
2. Health in all policies is needed and important

On being asked to talk on the principles of research, my first thought was to arise… and say,
“Be careful”
and to sit down.
J Cornfield 1959

Why do we get sick and ultimately die?

Some items from: Baicker & 2008. "Myths and misconceptions about U.S. health insurance." Health Aff 27:w533-43.
Myths about Health Insurance
• Narrowly, not having health insurance does not make you sick… the reason you got a headache is not because you didn’t have an aspirin.
• It’s not clear how much health insurance or even medicine prevents disease
• Health insurance does not imply quality care

Mensah and Brown. 2005. An Overview Of Cardiovascular Disease Burden In The United States, Health Affairs, Vol 26, Issue 1, 38-48

Mokdad, et al "Actual causes of death in the United States, 2000." JAMA 291:1238-45.


What Causes Disease?
Physiology Molec. Bio. Genetics Germs
Behavior Life-Style
Choice
Social Forces Markets Norms
Racism; Sexism
Fundamental/Upstream
Cause of Disease
Immediate/Proximal
D


Health disparities are systematic, plausibly avoidable health differences adversely affecting socially disadvantaged groups…
Braveman et al Health Disparities and Health Equity: The Issue Is Justice. American Journal of Public Health: December 2011, Vol. 101, No. S1, pp. S149-S155. doi: 10.2105/AJPH.2010.300062

A Couple of Basic Facts on
Health Disparities

Harper et al. 2007. "Trends in the black-white life expectancy gap in the United States, 1983-2003." JAMA 297:1224-32.

Infant Mortality Rates by Race, US 1900 - 1998
0
50
100
150
200
250
300
350
1900
1904
1908
1912
1916
1920
1924
1928
1932
1936
1940
1944
1948
1952
1956
1960
1964
1968
1972
1976
1980
1984
1988
1992
1996
Dea
ths
per 1
000
liveb
irths Non-White
White

Homicide, HIV, and perinatal death, although demonstrating favorable trends, continue to keep the black-white gap unnecessarily large… However, cardiovascular-related diseases remain the leading cause of black/white differences in life expectancy. If all cardiovascular causes and diabetes are considered together, they account for 35% and 52% of the gap for males and females, respectively.
Harper et al. 2007. "Trends in the black-white life expectancy gap in the United States, 1983-2003." JAMA 297:1224-32.

International Comparisons

• Kunitz & Pesis-Katz. 2005. "Mortality of white Americans, African Americans, and Canadians: the causes and consequences for health of welfare state institutions and policies." Milbank Q 83:5-39.

Lower Life Expectancy?
Low Class High Class
USA (1980-82) 73.0 75.8
England/Wales (men 1971-76) 66.5 72.0
Brazil (1970) 53.2 62.0
Life Expectancy at Birth
-3
+20 +11
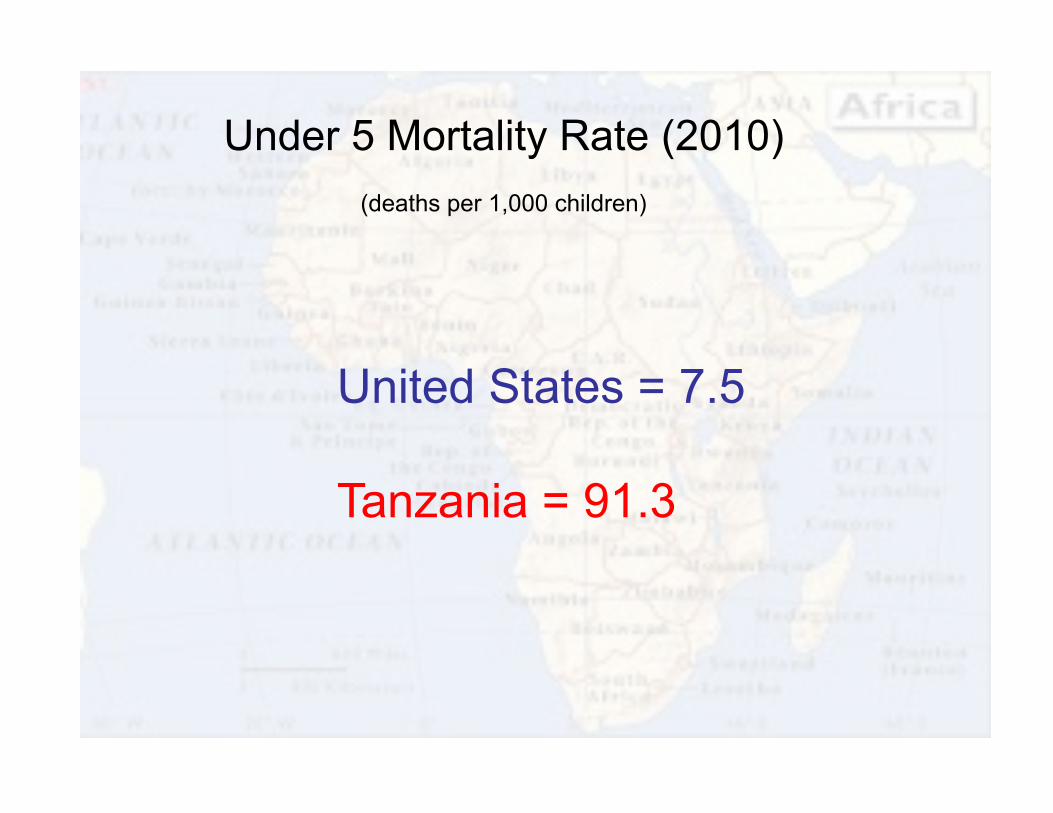
Under 5 Mortality Rate (2010)
(deaths per 1,000 children)
United States = 7.5 Tanzania = 91.3

Tabulation from Ghiselli 2011: 2010 DHS
Avg U5MR = 91
0 50 100 150
Under 5 Mortality per 1,000 Live Births
MaraLindi
IringaMtwaraTanga
MorogoroKigomaKagera
DodomaDar es Salaam
RukwaPemba North
Zanzibar NorthMbeya
Pemba SouthRuvuma
TaboraPwani
MwanzaShinyanga
Zanzibar SouthTown West
SingidaArusha
ManyaraKilimanjaro
Child Mortality in Tanzania, by Region

What surprises me?
What aren’t disparities bigger?

Some Issues
Justice?

Utilitarian: Greatest good for greatest number
Platonic: To the victor, the spoils
Rawlsian: Max welfare of least well off: fairness
Nozickian: Just rules = Just outcome
Marxist: From each according to their ability, to each according to their need
Meritocratic: From each according to their effort, to each according to their effort

Theist: God’s will
Oakesian: Tall people decide
Hippie: Let’s all share; give me some of yours
Golden Rule: Do unto others…
Aristotelian: Treat equals equally, unequals unequally
Egalitarian: Equal outcomes

0
2000
4000
6000
8000
Milli
ons
of P
eopl
e
1000 1200 1400 1600 1800 2000
Year
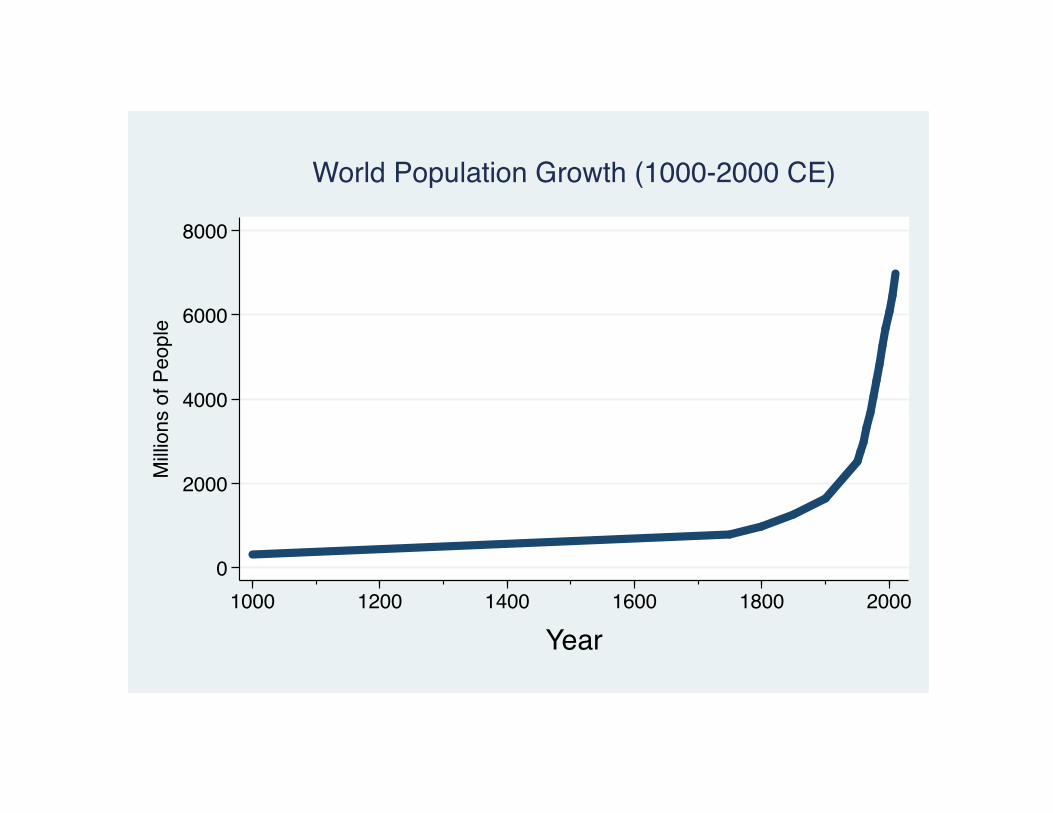
World Population Growth (1000-2000 CE)
Difference/Disparity in
Outcome or
Opportunity?

Difference or Ratio?


There is nothing new here

Source: Coleman, W. (1982). Death is a Social Disease: Public Health and Political Economy in Early Industrial France. Madison, WI, University of Wisconsin Press.

Source: Coleman, W. (1982). Death is a Social Disease: Public Health and Political Economy in Early Industrial France. Madison, WI, University of Wisconsin Press.

US Child (0-19 years) Mortality Rates, by time and SES
DiLiberti "The relationship between social stratification and all-cause…." Pediatrics 105.1 (2000)

Steckel, Richard H. "A dreadful childhood: The excess mortality of American slaves." Social Science History 10.4 (1986): 427-465.

Causes of Health Differences


Source: Aber, J. L., N. G. Bennett, et al. (1997). "The effects of poverty on child health and development." Annual Review of Public Health 18: 463-83.
Today: Poverty and Child Health • Intrauterine effects • Infant mortality • Low birth weight • Accidental death • Blood lead • Cognitive deficiencies • Sick days at School • Lower educational attainment • Obesity • Asthma • Hearing loss • Chronic stress • etc…
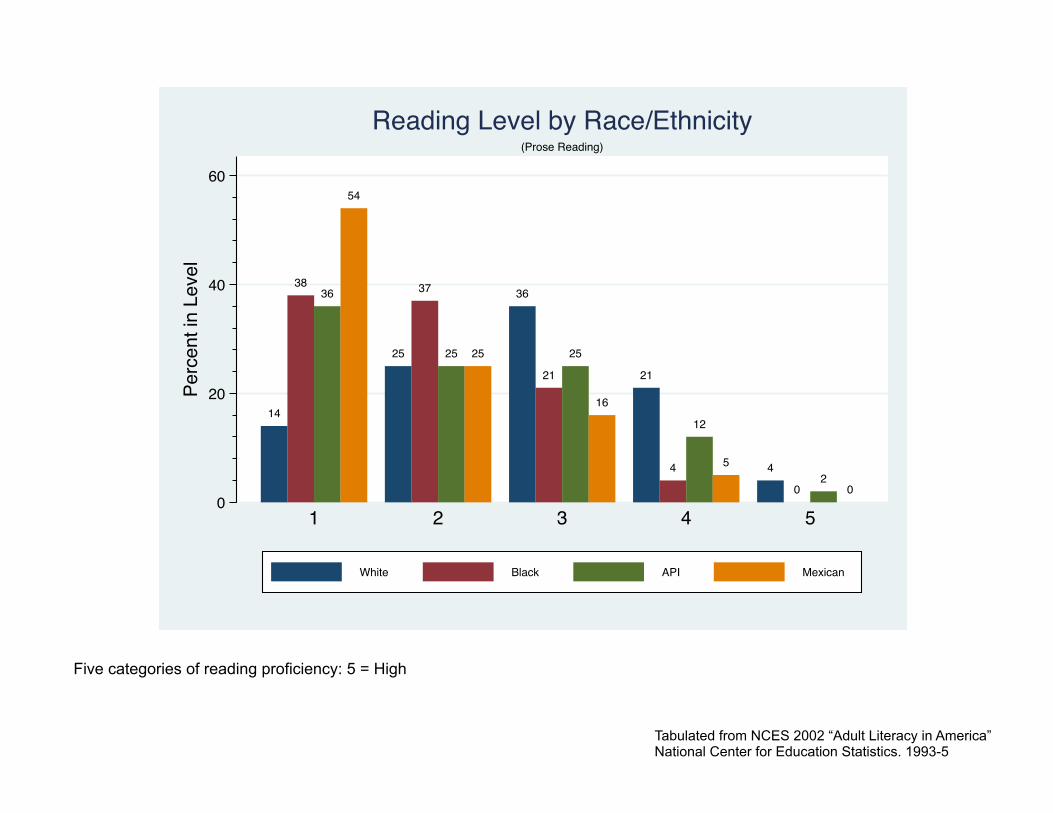
14
3836
54
25
37
25 25
36
21
25
16
21
4
12
5 4
02
00
20
40
60Pe
rcen
t in
Leve
l
1 2 3 4 5
(Prose Reading)
Reading Level by Race/Ethnicity
White Black API Mexican
Five categories of reading proficiency: 5 = High
Tabulated from NCES 2002 “Adult Literacy in America” National Center for Education Statistics. 1993-5

Hart & Risley 1995. Meaningful Differences in the Everyday Experience of Young American Children.

Estimates for the first 4 years of life reveal… a child of a professional family would accumulate 560,000 more encouragements than discouragements. But a child from a welfare family would accumulate 125,000 more discouragements than encouragements.
Hart & Risley 1995. Meaningful Differences in the Everyday Experience of Young American Children.

PERIOD LOW HIGH
1ST Grade 49 45 2ND Grade 43 42
Total 1st-5th Grade 186 186
Summer 1st – 2nd -5 9 Summer 2nd – 3rd -5 3 Total Summer 1-5 -8 25
Math Gains in Math Achievement Test, by SES
Heckman & Krueger 2005 “Inequality in America” Summary of Table 1.2 (page 31)

Percent who reject Evolution (2005) Source: National Geographic


Different Environments


Sure, but where does environment come from?

HiAP

Whose health? What do you mean by “health”? What policies? Who gets to decide?

Change health to social welfare and you’ll find 250 years of scholarship on how all policies impact social welfare, and which are deemed just/fair by what criteria.

Source: Slide by Linda Rudolf, MD, Public Health Inst


$1,000,000 each, just to get started

$13,000,000,000 to just build

Remedial Models

Poor
Rich
Health Disparity = 3
Soc
ioec
onom
ic s
tatu
s
White
Black

Poor
Excellent
Poor
Rich
Health Disparity = 7
Soc
ioec
onom
ic s
tatu
s

Poor
Excellent
Poor2
Rich
Health Disparity = 2
Poor1

Poor
Excellent
Poor
Rich
Health Disparity = 2

Poor
Poor
Rich
Health Disparity = 3
Soc
ioec
onom
ic s
tatu
s
Health Loss = 5

Poor
Excellent Rich
Health Disparity = 2
Health Loss = 7
Health Loss = 1

Poor
Excel1
Poor1
Rich
Health Disparity = 6
Excel2
Poor2
Health Loss = 2
Health Gain = 2

Poor
Excel2
Poor1
Rich
Health Disparity = 11
Poor2
Health Gain = 4
Health Gain = 5
Excel1

HiAP
Food for Thought

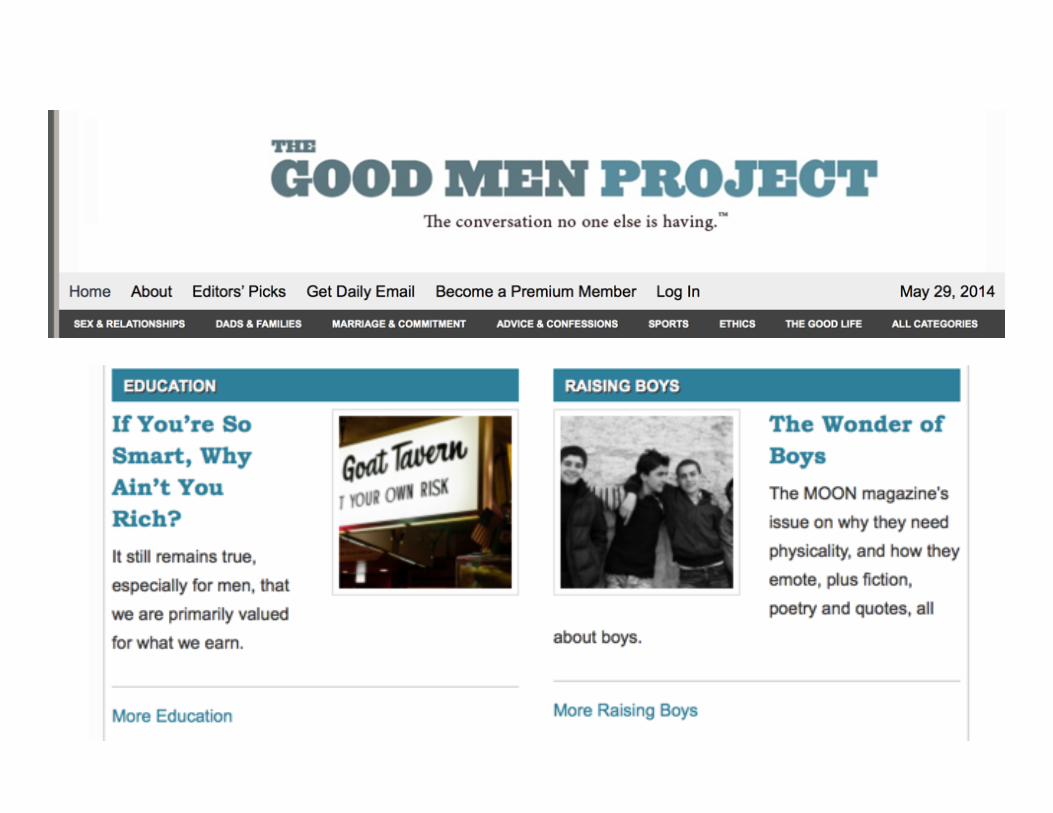
In 2013, the WHO reported that globally, nearly 1/3 of all women are victims of physical or sexual violence. The vast majority of these are attacked by their husbands or boyfriends.


The Atlantic


Simple Results: • Approx 40% of families eligible to move chose not to
• Many target communities rejected study families
• Approx 20% of families that moved to better neighborhoods, moved back
• No discernable effects on employment rates
• Self-reported mental health of adults appears to have improved
• Girls seemed to improve, boys suffered
The $10,000,000 question.

“Mike, you’re the expert,
What should we do?”


• Create jobs • Improve schools • Add PH nurses services • Increase prenatal services • Give each HH $10k • Help increase program take-up • Add cops to street • Buy, renovate, and rent houses • Fund free clinic • Increase family (abuse) services • …

• Early childhood education
• Provision of health insurance
• Medical screening
• Assistance coordination
• ???

Eden Prairie School District’s 2009 Boundary Re-Drawing
New boundaries would rebalance the schools' enrollments socioeconomically and by school capacity
At Forest Hills Elementary the percent of students receiving free and reduced lunch has climbed to more than 42 percent; but at Cedar Ridge Elementary, it's less than 10 percent. Under the new boundary plan, that discrepancy would fall from a 33-point difference to 2 points.


Conclusion
1. Stark health disparities must be mitigated
2. Health in all policies is needed and important
This stuff is too important to be sloppy
in our thinking…
This stuff is too important to be sloppy
in our thinking…
Let’s get to work!

Thank you