health financing in indonesia - world bank
TRANSCRIPT

D I R E C T I O N S I N D E V E L O P M E N T
Human Development
Health Financing in IndonesiaA Reform Road Map
Claudia RokxGeorge SchieberPandu Harimurti
Ajay TandonAparnaa Somanathan
Pub
lic D
iscl
osur
e A
utho
rized
Pub
lic D
iscl
osur
e A
utho
rized
Pub
lic D
iscl
osur
e A
utho
rized
Pub
lic D
iscl
osur
e A
utho
rized


Health Financing in Indonesia


Health Financing in IndonesiaA Reform Road Map
Claudia Rokx
George Schieber
Pandu Harimurti
Ajay Tandon
Aparnaa Somanathan

© 2009 The International Bank for Reconstruction and Development / The World Bank
1818 H Street NWWashington DC 20433Telephone: 202-473-1000Internet: www.worldbank.orgE-mail: [email protected]
All rights reserved
1 2 3 4 12 11 10 09
This volume is a product of the staff of the International Bank for Reconstruction andDevelopment / The World Bank. The findings, interpretations, and conclusions expressed in thisvolume do not necessarily reflect the views of the Executive Directors of The World Bank or thegovernments they represent.
The World Bank does not guarantee the accuracy of the data included in this work. The bound-aries, colors, denominations, and other information shown on any map in this work do not implyany judgement on the part of The World Bank concerning the legal status of any territory or theendorsement or acceptance of such boundaries.
Rights and Permissions
The material in this publication is copyrighted. Copying and/or transmitting portions or all of thiswork without permission may be a violation of applicable law. The International Bank forReconstruction and Development / The World Bank encourages dissemination of its work and willnormally grant permission to reproduce portions of the work promptly.
For permission to photocopy or reprint any part of this work, please send a request with completeinformation to the Copyright Clearance Center Inc., 222 Rosewood Drive, Danvers, MA 01923,USA; telephone: 978-750-8400; fax: 978-750-4470; Internet: www.copyright.com.
All other queries on rights and licenses, including subsidiary rights, should be addressed to theOffice of the Publisher, The World Bank, 1818 H Street NW, Washington, DC 20433, USA; fax:202-522-2422; e-mail: [email protected].
ISBN: 978-0-8213-8006-2eISBN: 978-0-8213-8007-9DOI: 10.1596/978-0-8213-8006-2
Library of Congress Cataloging-in-Publication Data
Health financing in Indonesia : a reform roadmap / by Claudia Rokx ... [et al.].p. ; cm. — (Directions in development)
Includes bibliographical references and index.ISBN 978-0-8213-8006-2 (alk. paper)1. Medical economics—Indonesia. 2. Health care reform—Indonesia. 3. National health
insurance—Indonesia. I. Rokx, Claudia, 1964- II. World Bank. III. Series: Directions in develop-ment (Washington, D.C.) [DNLM: 1. National Health Programs—economics—Indonesia. 2. Financing, Government—
Indonesia. 3. Health Care Reform—economics—Indonesia. 4. Insurance, Health—economics—Indonesia. 5. Population Dynamics—Indonesia. WA 540 JI5 H434 2009]RA410.55.I5.H43 2009338.4'33621009598—dc22
2009015207

v
Foreword xiiiAcknowledgments xvAbbreviations and Acronyms xviiOverview xxi
Chapter 1 Introduction 1Rationale for a Health Financing Study 3Objectives 4Methodology and Scope 5Structure and Outline of the Review 6
Chapter 2 Socioeconomic and Health Systems Context 9Population Dynamics and Demographic Changes 9Epidemiological Changes 11Labor Market Situation 13Indonesia’s Health System 14Notes 24
Chapter 3 Indonesia’s Health Financing System 27Health Financing Functions 27Indonesia’s Health Financing Programs 29
Contents

vi Contents
Indonesia’s Health Insurance Providers 32Indonesia’s Health Spending Trends 42Notes 51
Chapter 4 Assessment of Health Financing Performance 53Health Outcomes 54Health Spending 60Efficiency 63Financial Protection and Equity in Financing
and Delivery of Health Care 70Quality of Health Services 84The Current Health Policy Reform Baseline:
Strengths and Weaknesses 86Notes 90
Chapter 5 Key Policy Issues, Options, and Costs 93Mandatory Health Insurance (MHI) Goals 95The Global Evidence Base on Good Practices
in Major MHI Reforms 96Socioeconomic and Institutional Realities
Affecting the Design of Policy Options 99Key Policy Questions for Major MHI Expansion 102An Operational Analytical Framework for
Addressing Issues 108Design and Costing of MHI in Indonesia 111Notes 122
Chapter 6 Policy Options: Finding Resources for Health 123Favorable Macroeconomic Conditions 124Reprioritizing the Health Budget 127Health-Specific Resources 129Efficiencies in Health Spending 132Notes 135
Chapter 7 Conclusions and Next Steps 137Wisdom from Global Health Financing
Reform Efforts 138The Way Forward 139Conclusion 142Note 143

Contents vii
Appendix 1 Probit Analysis of Demand Inducement from Insurance Coverage and Socioeconomic Changes 145
Bibliography 151
Index 161
Boxes4.1 Health System Efficiency in Sri Lanka 716.1 Visualizing Fiscal Space for Health: Hypothetical
Scenario for Indonesia 1256.2 Designing Interfiscal Transfers to Attain Health
Results in Argentina 133
Figures2.1 Potential Window of Opportunity for Indonesia 122.2 Employment (2001–07) 132.3 Employment by Sector and Gender (1990–2007) 132.4 Growth of Formal Sector Share of Employment
in Indonesia (1990–2007) 142.5 Global Comparison of Hospital Beds to Population
Ratio with GDP 172.6 Global Comparisons of Doctors and Health Workers
to Population Trend Lines (2000–06) 212.7 Care-Seeking Behavior among Those Reporting Ill
(1993–2007) 232.8 Choice of Provider (1999–2007) 243.1 Health Financing Functions and Objectives 283.2 Insurance Coverage Status of the Indonesian Population 323.3 Insurance Participation 333.4 Current Health Insurance Systems (Type and Coverage) 353.5 Public Flows of Funds 433.6 Private Flows of Funds 443.7 Trends in Nominal Health Spending (1996–2006) 463.8 Public, Total Private, and OOP Private Shares of
Total Health Spending (1996–2006) 473.9 Spending Components as Share of GDP (1996–2006) 473.10 Health Spending per Capita in Exchange
Rate–Based US$ (1996–2006) 48

viii Contents
3.11 Health Spending per Capita in International Dollars (1996–2006) 49
3.12 Real Health Spending (1996–2006) 493.13 Inflation in Indonesia (1996–2006) 504.1 Life Expectancy in Selected Comparators (1960–2006) 544.2 GDP per Capita in Selected Comparators (1960–2006) 554.3 Life Expectancy versus Income (1960–2006) 564.4 Global Comparisons of Life Expectancy versus Income
and Health Spending 574.5 Infant Mortality Rates in Selected Comparators
(1960–2006) 574.6 Infant Mortality versus Income (1960–2006) 584.7 Global Comparisons of Infant Mortality versus Income
and Health Spending 594.8 Global Comparisons of Maternal Mortality versus
Income and Health Spending 604.9 Female Literacy and Income 604.10 Total Health Expenditure as Share of GDP
versus Income per Capita (2006) 614.11 Total Health Expenditure per Capita versus
Income per Capita (2006) 614.12 Public Expenditure as Share of Total Health
Expenditure versus Income per Capita (2006) 624.13 Public Expenditure on Health as Share of GDP
versus Income per Capita (2006) 624.14 Public Expenditure on Health per Capita versus
Income per Capita (2006) 634.15 Public Expenditure on Health as Share of Total Government
Expenditure versus Income per Capita (2006) 634.16 Out-of-Pocket Spending as Share of
Total Health Spending versus Income per Capita 644.17 Variations in Hospital Efficiency across
Indonesian Provinces 664.18 Relative Hospital Efficiency in Indonesia and
Other Countries 674.19 Comparison with Selected Countries of Indonesian
Districts’ Attainment of DPT3 Immunization and Skilled Birth Attendance (2005) 69
4.20 OOP Share of Total Household Budget by Consumption-Based Quintile (2001 and 2006) 73
Contents ix
4.21 Incidence of Catastrophic Payments Defined Relative to Total and Nonfood Expenditures 75
4.22 Kakwani Indexes for Finance Sources 794.23 Utilization Rates of Public Sector Facilities
(2001 and 2007) 804.24 Utilization Rates of Private Sector Facilities
(2001 and 2007) 804.25 Poorest Quintile Share of Public Hospital
Inpatient Subsidies in EAP Region 824.26 Comparison of IMR and U5MR between
Provinces (2007) 834.27 Percentage of Dissatisfaction with Various
Aspects of Service 844.28 Outpatient and Inpatient Satisfaction Levels 854.29 Quality of Care Comparisons 865.1 Indonesia’s Transition to Universal Coverage under
National Social Security Law No. 40/2004 945.2 Health Financing Functions and the Importance of
the Basic Benefits Package 955.3 Enabling Factors in Health Financing Reforms 985.4 Enabling Conditions for Social Health Insurance 995.5 Distribution of Insurance Coverage by Income
Quintile for Different Programs 1015.6 Provider Payment Mechanisms and Health System
Organization 1045.7 Evolution of Health Financing Systems 1125.8 Projected Changes in Utilization Caused by
Demographics and Expansion of Jamkesmas to the Entire Population in 2025 119
5.9 Possible Future Scenarios for Health Expenditure (% of GDP) 121
6.1 Revised Economic Growth Forecast for Indonesia (2008–13) 126
6.2 Long-term Trends in Government Health Spending in Indonesia (1979–2007) 127
6.3 Comparison of Government Total Expenditure as a Share of GDP with Government Health Expenditure as a Share of GDP (2006) 129
6.4 External Resources as Share of Health Spending in Indonesia (1995–2006) 130
x Contents
Tables1.1 At a Glance: Health Outcomes and Trends in Indonesia 22.1 Population and Demographic Indicators and Projections
for Indonesia (1961–2025) 102.2 Number of Hospitals by Ownership 182.3 Number of Beds by Hospital Ownership 182.4 Ratio of Doctors and Midwives by Region
(1996–2006) 222.5 Total Number and Ratio of Specialists to Population 233.1 Overview of Social Health Insurance
Landmarks in Indonesia 303.2 Comparisons of Features of Health
Financing Programs 363.3 Covered Health Care Expenditures 423.4 Health Spending (1996–2006) 454.1 Hospital and Nonhospital Care: Share of Total
Public Health Expenditures in Asian and Pacific Countries (Various Years) 65
4.2 Selected Countries with Lower Health Spending Than Indonesia but Higher DPT3 Coverage Rates (2005) 70
4.3 Incidence (Headcount) of Catastrophic OOP Payments for Health Care on Total Household Spending (2001 and 2006) 74
4.4 Impact of OOP Health Care Payments on Poverty Headcounts (% Change) 76
4.5 Quintile Shares of Ability to Pay and Sources of Financing for Health Care (2001 and 2006) 77
4.6 Benefit Incidence Analysis: Distribution of Public Health Subsidies by Income Quintile (2001 and 2006) 81
5.1 Governance Factors 975.2 Population Employment Composition 1005.3 Framework for Describing Major Features of
HI Reform Proposals 1085.4 Framework for Assessing Cost and Coverage Impacts
of UC Options 110

Contents xi
6.1 Government Health Expenditure: Actual (2004–07) and Projected (2008–13) 128
1A.1 Utilization Rates by Insurance Status 1461A.2 Probit Analysis of Utilization Differentials by
Insurance Status and Socioeconomic Factors 148


xiii
Indonesia has embarked upon major reforms of its social security andhealth systems. One of the key areas of these reform efforts is the tran-sition to universal health insurance coverage for all Indonesians. Thegovernment has taken the first significant step by providing coverage toan estimated 76 million poor and near poor through the government-funded Jamkesmas program. Yet, over half the population still lacks cov-erage, and the full fiscal implications of both the Jamkesmas expansionand the costs of universal coverage need to be carefully assessed as partof the reform process.
Very few middle-income countries have successfully achieved universalcoverage, and those few that have continue to face significant cost escala-tion pressures. Successful health insurance reforms must be carefully coor-dinated with needed health systems changes, as well as with the availablecurrent and future fiscal space. The design and implementation of thesereforms must be based on sound information and modern health policyanalyses. As the government develops the final configuration of itshealth system and the transition steps to get there, it must systemati-cally deal with the key “devils in the details,” including the design of thebasic benefits package, eligibility criteria for different socioeconomicand employment groups, financing of the reform, provider payment
Foreword

mechanisms, the delivery system configuration, and the overall regulatoryand macroeconomic environments.
This study, based on both the Indonesia-specific and global evidencebases, provides a critically needed road map for the reform effort. Its ana-lytical assessment of the current Indonesian health system and itsstrengths and weaknesses provides the health policy baseline for thereform. The assessment of key policy parameters needing resolution andof plausible transition options based on the goals of maximizing healthoutcomes, financial protection, and consumer responsiveness provides thegovernment with an extremely valuable guide for moving the reform for-ward. The study also provides useful inputs to Indonesia’s next Five-YearDevelopment Plan. As such, this study is an invaluable tool for assistingthe government at this critical juncture in its reform process.
Nina SardjunaniDeputy Minister for Human Resources and Cultural Affairs
State Ministry for National Development Planning (Bappenas)
Emmanuel Y. JimenezSector Director
East Asia Human Development SectorThe World Bank
xiv Foreword

xv
This report was prepared by a team led by Claudia Rokx (Lead HealthSpecialist, East Asia Human Development Sector Department, EASHD)and George Schieber (Health Policy Advisor, EASHD, Consultant). Themain authors are Claudia Rokx, George Schieber, Pandu Harimurti(Health Specialist, EASHD), Ajay Tandon (Senior Health Economist,Human Development Network, HDNHE), and Aparnaa Somanathan(Health Economist, EASHD).
Puti Marzoeki (Senior Health Specialist, EASHD), Valerie Moran(Junior Professional Associate, HDNHE), Elif Yavuz (Public ExpenditureSpecialist, Consultant), Eko Pambudi (Research Analyst, EASHD), DeniHarbianto (Researcher, Gadjah Mada University), Vaibhav Gupta(Health Specialist, HDNHE, Consultant), Loraine Hawkins (HealthExpert, Consultant), and Brent Walker (Actuary, Consultant) all con-tributed to the report. William Wallace (Lead Economist, East AsiaRegion Poverty Reduction, EASPR) and Wolfgang Fengler (SeniorEconomist, EASPR) provided insightful guidance on the macroeconomicand decentralization parts of the report. Editorial assistance was providedby Chris Stewart. The final report benefited from the comments ofMaureen Lewis (Advisor, Development Research Group , DECVP), PeterBerman (Lead Health Economist, HDNHE), and Jack Langenbrunner
Acknowledgments
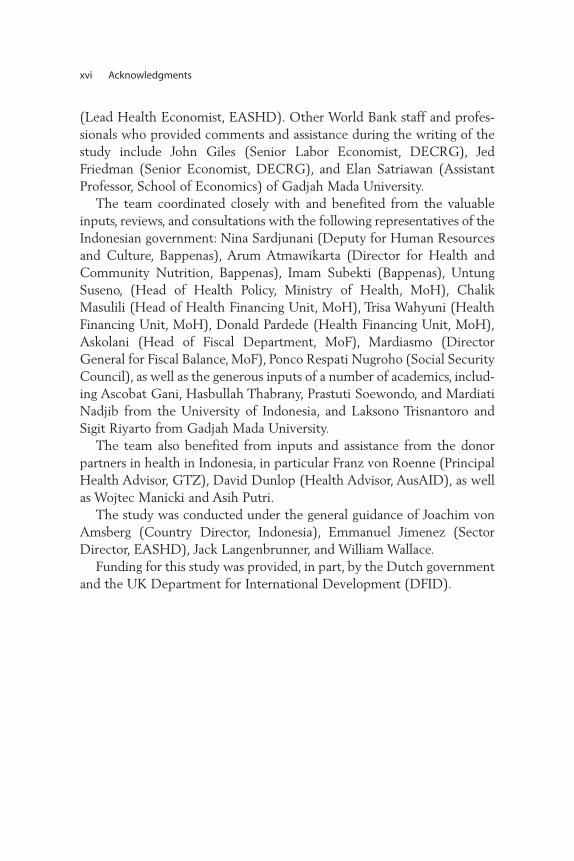
(Lead Health Economist, EASHD). Other World Bank staff and profes-sionals who provided comments and assistance during the writing of thestudy include John Giles (Senior Labor Economist, DECRG), JedFriedman (Senior Economist, DECRG), and Elan Satriawan (AssistantProfessor, School of Economics) of Gadjah Mada University.
The team coordinated closely with and benefited from the valuableinputs, reviews, and consultations with the following representatives of theIndonesian government: Nina Sardjunani (Deputy for Human Resourcesand Culture, Bappenas), Arum Atmawikarta (Director for Health andCommunity Nutrition, Bappenas), Imam Subekti (Bappenas), UntungSuseno, (Head of Health Policy, Ministry of Health, MoH), ChalikMasulili (Head of Health Financing Unit, MoH), Trisa Wahyuni (HealthFinancing Unit, MoH), Donald Pardede (Health Financing Unit, MoH),Askolani (Head of Fiscal Department, MoF), Mardiasmo (DirectorGeneral for Fiscal Balance, MoF), Ponco Respati Nugroho (Social SecurityCouncil), as well as the generous inputs of a number of academics, includ-ing Ascobat Gani, Hasbullah Thabrany, Prastuti Soewondo, and MardiatiNadjib from the University of Indonesia, and Laksono Trisnantoro andSigit Riyarto from Gadjah Mada University.
The team also benefited from inputs and assistance from the donorpartners in health in Indonesia, in particular Franz von Roenne (PrincipalHealth Advisor, GTZ), David Dunlop (Health Advisor, AusAID), as wellas Wojtec Manicki and Asih Putri.
The study was conducted under the general guidance of Joachim vonAmsberg (Country Director, Indonesia), Emmanuel Jimenez (SectorDirector, EASHD), Jack Langenbrunner, and William Wallace.
Funding for this study was provided, in part, by the Dutch governmentand the UK Department for International Development (DFID).
xvi Acknowledgments

xvii
Askes Asuransi Kesehatan (Health Insurance)
Askeskin Asuransi Kesehatan Masyarakat Miskin(Health Insurance for Poor Population)
BBP Basic Benefits Package
BDD Bidan di Desa (Village Midwife)
BKKBN Badan Koordinasi Keluarga Berencana Nasional(Family Planning Coordination Agency)
BPS Badan Pusat Statistik (Statistics Indonesia)
CBHI community-based health insurance
DAK Dana Alokasi Khusus (Special Allocation Fund)
DAU Dana Alokasi Unum (General Allocation Fund)
DepKes Departemen Kesehatan (Ministry of Health)
DHS Demographic and Health Survey
DRG Diagnosis-Related Group
EAP East Asia and Pacific
GDP gross domestic product
HDNHE Human Development Network, Health and Education
HI health insurance
Abbreviations and Acronyms

HIV/AIDS human immunodeficiency virus/acquired immune deficiency syndrome
HMO health maintenance organization
IFLS Indonesia Family Life Survey
IMF International Monetary Fund
IMR infant mortality rate
Jamkesmas Jaminan Kesehatan Masyarakat (Health InsuranceScheme for the Population)
Jamsostek Jaminan Sosial Tenaga Kerja (Workforce Social Security)
JPKG Jaminan Pemeliharaan Kesehatan untuk Keluarga Miskin(Health Insurance Scheme for Poor Families)
JPKM Jaminan Pemeliharaan Kesehatan Masyarakat(Community Health Insurance Scheme)
MHI mandatory health insurance
MMR maternal mortality rate
MoH Ministry of Health
NCD noncommunicable disease
NHA National Health Accounts
NHS national health service
OECD Organisation for Economic Co-operation and Development
OOP out of pocket
PODES Potensi Desa (Survey of Village Potential)
PT Perseroan Terbatas (Company)
Puskabangkes Pusat Kajian Pembangunan Kesehatan (Center forHealth Policy Development and Analysis)
Puskesmas Pusat Kesehatan Masyarakat (health center at subdistrict)
PVHI private voluntary health insurance
Renstra Rencana Strategi (Strategic Planning)
Rp Rupia
RPJM Rencana Pembangunan Jangka Menengah(Medium-Term Development Plan)
RS Rumah Sakit (hospital)
Sakernas Survei Tenaga Kerja Nasional (National Labor Force Survey)
xviii Abbreviations and Acronyms

SHI social health insurance
SIKD Sistem Informasi Keuangan Daerah (Local GovernmentExpenditure Database)
SKRT Survei Kesehatan Rumah Tangga (National HouseholdHealth Survey)
Surkesnas Survei Kesehatan Nasional (National Health Survey)
Susenas Survei Sosial Ekonomi Nasional (National SocioeconomicSurvey)
U5MR under-5 mortality rate
UC universal coverage
UNFPA United Nations Population Fund
WDI World Development Indicators
Abbreviations and Acronyms xix


xxi
In 2004, the Indonesian government made a commitment to provide itsentire population with health insurance coverage through a mandatorypublic health insurance scheme. It has moved boldly and has already pro-vided coverage to an estimated 76.4 million poor and near poor, fundedthrough the public budget. Nevertheless, more than half the populationstill lacks health insurance coverage, and the full fiscal impacts of the gov-ernment’s program for the poor have not been fully assessed or felt. Inaddition, significant deficiencies in the efficiency and equity of the cur-rent health system, unless addressed, will exacerbate cost pressures andcould preclude the effective implementation of universal coverage (UC)and the desired result of improvements in population health outcomesand financial protection.
For Indonesia to achieve UC, systems’ performance must be improvedand key policy choices about the configuration of the health financingsystem must be made. Indonesia’s health system performs well withrespect to some health outcomes and financial protection, but there ispotential for significant improvement. High-level political decisions arenecessary on critical elements of the health financing reform package. Thekey transitional questions to get there include the following:
Overview

• What benefits can be afforded and what will their impacts on healthoutcomes and financial protection be?
• How will the more than 50 percent of those currently without cover-age be insured?
• How will medical care providers be paid to ensure access, efficiency,and quality?
• What will be the most streamlined and efficient administrativestructure?
• How will the current supply constraints be addressed to ensure avail-ability of promised services?
• How will revenues be raised to finance the system, including the pro-gram for the poor and other currently uninsured groups that may re-quire government subsidization, such as the more than 60 millioninformal sector workers, the 85 percent of workers in firms of fewerthan five employees, and the 70 percent of the population living in ru-ral areas?
While Indonesia is modernizing and further developing its health sys-tem with major reforms such as decentralization and the implementationof UC, the demographic, nutritional, and epidemiological transitions willhave major implications for the design and costs of these reforms. Anaging population will create additional demand for infrastructure (morehospitals), health workers (more specialists and care givers), and old agesocial security. At the same time, a diminishing employment base, charac-terized by stagnant movement into the formal sector, will exacerbate costpressures. There are large emerging differences in the progress of thesetransitions across Indonesia; eastern Indonesian provinces remain at theinitial stages of the transition with continuing high levels of communica-ble disease and child mortality, while provinces in Java and Bali havehigher levels of noncommunicable diseases.
On the positive side, Indonesia’s economic growth has been robustsince the financial crisis in 1997–98, and the country appears well posi-tioned to weather the current financial crisis, although the effects onfuture economic growth are still uncertain. However, poverty ratesremain high for a lower-middle-income country, despite significantimprovements since 1997–98, and with a looming potential crisis, povertyrates are a major concern. Moreover, some 50 percent of the populationremain classified as poor or near poor, leaving a very large part of the cit-izenry vulnerable to both economic and health shocks, which can be cat-astrophic and push households into poverty. In addition, labor market
xxii Overview

dynamics are important when developing a road map to universal coveragehealth insurance—for example, the large proportion of informality in thelabor market complicates the use of worker-based contributions tofinance the system.
The rationale for this health financing study is to provide real-time, evidence-based inputs to the government of Indonesia’s comprehensiveHealth Sector Review and to assist the government in the developmentand implementation of its universal health insurance program. The inten-tion is to assist the government by assembling both the Indonesia-specificand global evidence bases, with an explicit focus on the development andimplementation of policy options to achieve universal health insurancecoverage to improve the health outcomes and financial protection of theIndonesian people.
This study focuses on the key health financing functions of revenuecollection, risk pooling, and purchasing and their respective objectives of(i) equitably and efficiently raising sustainable revenues to support UC;(ii) pooling risks in an efficient and equitable manner to ensure financialprotection for the Indonesian population; and (iii) purchasing services inan allocatively and technically efficient manner. The study develops thecurrent Indonesian health policy baseline predicated on the strengths andweaknesses of the current system and future epidemiological and socioe-conomic trends, and provides a comprehensive framework that enumer-ates the key reform issues requiring resolution. It provides an analyticalpolicy framework based on the global “good practice” evidence base aswell as some rudimentary costed options for the transition to universalcoverage. Finally, it discusses the necessary future delivery system, publichealth, and demand-side reforms.
Health financing since decentralization has become more compli-cated, and health service delivery appears to be worsening, in large partas a result of governance issues. The national health system has notadapted to decentralized realities, nor has the decision to go to manda-tory universal health insurance led to additional restructuring. The sys-tem remains publicly focused and continues to be based on theprinciples and features of Alma Ata (universal access to public primarycare), although half of all health spending is private, largely out-of-pocket (OOP), and almost half of all those who are ill actually seekhealth services from private providers.
Government ability at all levels to make direct payments in the formof salaries and capital expenditures, as well as to provide additional cov-erage, is contingent on government fiscal capacity. Such fiscal capacity
Overview xxiii
depends heavily on both local revenue-raising capacities and on the flowof funds through the intergovernmental fiscal systems in which somefunds are earmarked by central-level government, while others are not,and formulas used for redistributing funds from central to local govern-ments often do not reflect local need and local fiscal capacity.
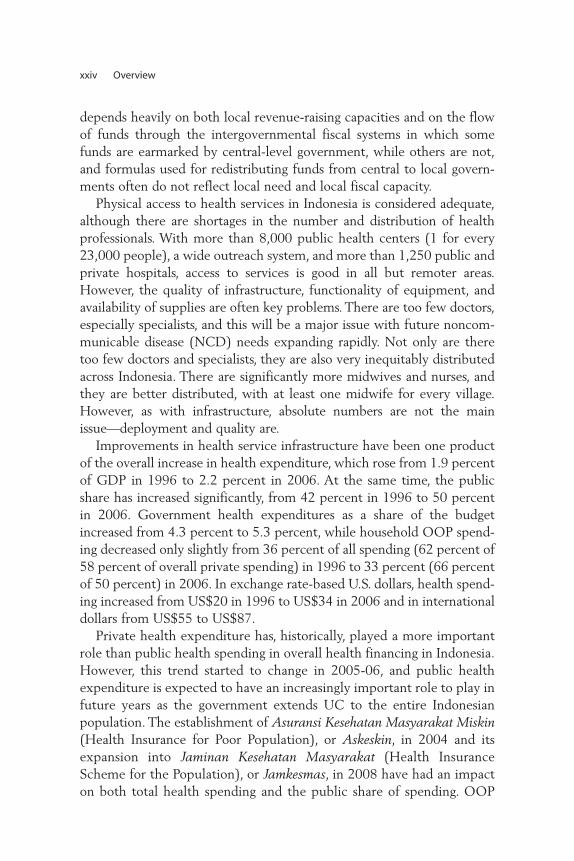
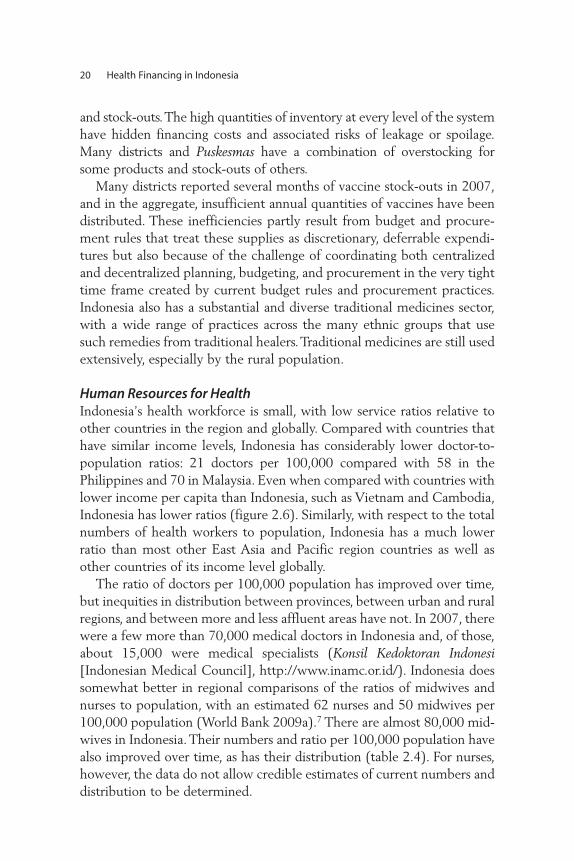
Physical access to health services in Indonesia is considered adequate,although there are shortages in the number and distribution of healthprofessionals. With more than 8,000 public health centers (1 for every23,000 people), a wide outreach system, and more than 1,250 public andprivate hospitals, access to services is good in all but remoter areas.However, the quality of infrastructure, functionality of equipment, andavailability of supplies are often key problems. There are too few doctors,especially specialists, and this will be a major issue with future noncom-municable disease (NCD) needs expanding rapidly. Not only are theretoo few doctors and specialists, they are also very inequitably distributedacross Indonesia. There are significantly more midwives and nurses, andthey are better distributed, with at least one midwife for every village.However, as with infrastructure, absolute numbers are not the mainissue—deployment and quality are.
Improvements in health service infrastructure have been one productof the overall increase in health expenditure, which rose from 1.9 percentof GDP in 1996 to 2.2 percent in 2006. At the same time, the publicshare has increased significantly, from 42 percent in 1996 to 50 percentin 2006. Government health expenditures as a share of the budgetincreased from 4.3 percent to 5.3 percent, while household OOP spend-ing decreased only slightly from 36 percent of all spending (62 percent of58 percent of overall private spending) in 1996 to 33 percent (66 percentof 50 percent) in 2006. In exchange rate-based U.S. dollars, health spend-ing increased from US$20 in 1996 to US$34 in 2006 and in internationaldollars from US$55 to US$87.
Private health expenditure has, historically, played a more importantrole than public health spending in overall health financing in Indonesia.However, this trend started to change in 2005-06, and public healthexpenditure is expected to have an increasingly important role to play infuture years as the government extends UC to the entire Indonesianpopulation. The establishment of Asuransi Kesehatan Masyarakat Miskin(Health Insurance for Poor Population), or Askeskin, in 2004 and itsexpansion into Jaminan Kesehatan Masyarakat (Health InsuranceScheme for the Population), or Jamkesmas, in 2008 have had an impacton both total health spending and the public share of spending. OOP
xxiv Overview

payments still constitute a sizeable share of health spending, however,and the challenge for the government is to channel these expendituresinto risk-pooling mechanisms to effectively provide protection againstcatastrophic health spending.
Despite this historical dependence on private health spending, privatevoluntary health insurance is not well developed in Indonesia. Each ofthe three major existing health financing programs is publicly owned.Civil servants and their dependents are covered under the Askes program,which is administered by a for-profit state enterprise, P.T Askes. Askeskinwas originally designed to cover the poor but was expanded throughJamkesmas to also cover the near poor. It was originally administered byP.T. Askes but in 2008 the Ministry of Health (MoH) took over most ofthe major administrative functions, including provider payment.Jamsostek is similar to a classic social insurance program for private sectoremployees in firms with 10 or more employees and is also administeredby a for-profit state enterprise. Employers are at liberty to opt out,either by self-insuring or by purchasing private insurance for theiremployees. Both P.T. Askes and P.T. Jamsostek also sell private commer-cial policies.
Three possible approaches, based on Indonesia’s existing health financ-ing programs, the current policy debate, and the 2004 Social Security Lawhave been identified as viable UC options. The three options would allresult in universal coverage, and would all have sufficiently large numbersof enrollees for effective risk pooling. Irrespective of the approach chosen,however, crucial decisions regarding the benefits package, cost sharing, pay-ment and contracting arrangements, and modalities to address supply-sideconstraints need to be made. The three approaches follow.
• The first approach approximates a National Health Service like thosein Sri Lanka and Malaysia, and involves expanding the general revenue-financed Jamkesmas program for the poor and near poor tocover the entire population.
• The second approach approximates the “new” national Social HealthInsurance (SHI) model (now called Mandatory Health Insurance[MHI]), in which the MHI system is funded through both wage-basedcontributions for public and private sector workers (and retirees) andgovernment general revenue contributions for the poor and other dis-advantaged groups.
• The third approach, which could be considered a variant of the first optionor a combination of the first and second options, provides coverage for the
Overview xxv

poor and other disadvantaged groups through a government-financedsystem, with others covered through multiple MHI funds, each financedon a contributory basis.
Clearly, whichever option is chosen, the movement to universal cover-age will have a sizeable impact on Indonesia’s health spending. Microanalyses of current program costs and utilization patterns after the intro-duction of Askeskin/Jamkesmas allow crude projections of future costs. Forexample, crude estimates of future Jamkesmas costs range from 20 percentof current Jamkesmas spending to a sixfold increase, depending on the cov-erage expansion scenario and health inflation assumptions chosen.
If expansion is financed through government spending, significantnew demands will be made for available fiscal space in the budget to beallocated to health. The cost analysis included in this report, albeitcrude, shows the importance for Indonesia to start addressing theabove-mentioned weaknesses in the system and to develop the informa-tion necessary to conduct more sophisticated projections in the future, andthe need for the reform process to address broader health system issues inaddition to the financing changes. If, as a result of UC, Indonesia’s healthspending increases to the levels of comparable income countries—and itimplements policies to ensure efficiency and to control costs—healthspending in 2040 could be on the order of 6 percent of GDP comparedwith just over 2 percent currently. If efficiency and cost control are notaddressed, and Indonesia faces cost pressures similar to those faced in thepast by industrial countries, health spending could be on the order of10 percent of GDP.
One way of assessing the availability of fiscal space for health is toexamine the alternatives for increasing the sources of government financ-ing for health (which include potential de facto increases achievedthrough efficiency gains in existing health and other public spending).These alternatives include the following:
• favorable macroeconomic conditions such as economic growth and in-creases in overall government revenue that, in turn, lead to increases ingovernment spending for health;
• a reprioritization of health within the government budget; • an increase in health-specific foreign aid and grants; • an increase in other health-specific resources, for example, through ear-
marked taxation or the introduction of premiums for mandatory healthinsurance; and an increase in the efficiency of government health outlays.
xxvi Overview

Of the above-mentioned alternatives, the first two are largely outsidethe domain of the health sector itself. The remaining three are more inthe direct domain of the health sector and merit particular attention,given that they provide the potential for resources that are sector specific.
Indonesia has established the broad legislative base for moving forwardto UC, and the Social Security Council has been focusing on specificimplementation issues. There have also been a number of studies by thegovernment, donors, and other stakeholders that provide relevant contri-butions for decision making as the country proceeds with the develop-ment and implementation of the reform. While all these efforts are usefulfor planting individual trees in the complex forest of health care reform,what has not been evident to date is the final configuration for populat-ing the forest and the road map to eventually get there. In short, the gov-ernment needs to decide on the final UC system and then carefully layout the transition steps.
In developing such major policies, Indonesia, like most other coun-tries, lacks critical information—about both policy specifications anddata—for informed decision making. In addition, big picture policychoices on the ultimate UC system and transition steps can only bemade in tandem with specific policy choices on more micro issues, suchas the groups eligible for coverage by each program, targeting mecha-nisms, contribution requirements (for individuals, firms, and govern-ments), provider payment mechanisms and levels, and the futuremacroeconomic environment. Rational policy choices need to be basedon both the quantitative and qualitative impacts of such policies on,among other things, health outcomes, financial protection, consumerresponsiveness, access, equity, efficiency, costs (public and private), andmacroeconomic sustainability.
Based on global experience, the following critical policy issues shouldform the framework for the implementation of universal coverage:
1. Further development is needed on such data for decision making asNational Health Accounts updates; claims data from the existing pro-grams; and cost, equity, and benefit incidence analyses to evaluate pol-icy options. It is crucial to give high priority to developing the actuarialbaselines of the current and proposed future health insurance pro-grams and getting better estimates of the behavioral responses of bothconsumers and suppliers to changes in insurance coverage. Included inthese analyses should be assessments of the current Basic BenefitsPackages (BBPs), as measured by both cost-effectiveness and financial
Overview xxvii

protection against excessive OOP spending, to enable rational choicesof the BBP(s) under the UC reform.
2. The initial assessments of supply-side constraints with respect to bothhuman resources and physical infrastructure highlighted a number ofimportant areas where inefficiencies need to be addressed as well asareas that will come under more pressure given the underlying demo-graphic, nutritional, and epidemiological realities.
3. Building on the pharmaceutical sector assessment and the initial iden-tification of potential opportunities in expending mandatory healthinsurance, the government is encouraged to further evaluate pharma-ceutical sector policies and needed changes to aid implementation ofthe UC reform.
4. The ongoing decentralization and UC reforms necessitate clarifyingthe future role of the MoH with respect to public health and its remain-ing stewardship and financing functions with respect to the publicinsurance system. Within its broader stewardship role, assessing theeffects of policies in other sectors (such as water and education) onhealth must also be a high priority, as is assessing the need for addi-tional demand-side policies such as conditional cash transfers.
5. Once decisions have been made regarding the financing options underthe road map to UC, it is essential to develop, experiment with, andevaluate the impact of alternative provider payment mechanisms oncosts, quality, and access.
6. The range of necessary administrative structures to implement thereform needs to be determined, including assessing administrativecosts and developing systems to ensure quality, assess efficiency, andevaluate the reform’s impacts.
7. The rich local experiences in providing health insurance coverage shouldbe carefully assessed because these natural experiments are an importantsource of information for the national-level UC reform effort.
8. Attaining UC is highly likely to require large increases in governmentexpenditures, no matter which option is chosen. Thus, continuing atten-tion to evaluating Indonesia’s future macro situation, including com-peting priorities in light of the current global financial and economiccrises, is important, as is assessing the need for changes in the currentintergovernmental fiscal structure.
Successful implementation of the UC reform will require carefullysequenced implementation of targeted, effective, and fiscally soundpolicies. The Social Security Council and the MoH have taken important
xxviii Overview
first steps, but more is needed. The Medium-Term Development Plan(RPJM), the Ministry of Health’s own internal planning efforts in develop-ing the next Rencana Strategi (Strategic Plan), or Renstra, and the poten-tially large and possibly unaffordable (in the short run because of thecurrent global economic crisis) expenditure implications of expandinghealth insurance to some 76 million poor and near poor, make this an idealtime to refocus efforts on the comprehensive set of policies needed toeffectively implement the UC reform.
Overview xxix


1
Indonesia is at a critical stage in the development and modernization ofits health system. The government of Indonesia has made majorimprovements over the past four decades, but struggles to maintain andcontinue to improve important health outcomes for the poor andachieve the Millennium Development Goals. Nevertheless, some keyhealth indicators show significant progress. Infant and child (under five)mortality rates have fallen by half since the early 1990s, although thespeed of the decline appears to have slowed since 2002 (table 1.1).Maternal mortality rates show a declining trend, but remain among thehighest in East Asia. Indonesia’s population program is one of the world’smost successful: fertility rates have declined impressively since the 1970sand continue to fall. Previously declining malnutrition rates amongyoung children have, however, stagnated. The slowing down of progressmay be explained by a poorly functioning health system as well as bynew and ongoing challenges posed by demographic, epidemiological, andnutrition transitions, which require new policy directions, a reconfiguredand better performing health system, and long-term sustainable financing.
Indonesia is also transitioning through two major reforms: (i) the decen-tralization reform of 2001, and (ii) the implementation of universal healthinsurance coverage (UC). Indonesia’s political system has undergone a
C H A P T E R 1
Introduction
profound transformation, from a centralized authoritarian regime to adecentralized democratic polity. Despite initial turbulence, a sense of polit-ical stability has grown as the democratic process has matured andachieved wider acceptance. Decentralization, while still far from complete,has devolved substantial funds and authority to local governments, andnew forms of decentralized participation in policy making have been cre-ated (World Bank 2008a). Indonesia’s growing economy, political stability,and decentralization prospects now allow it to think expansively abouthealth care.
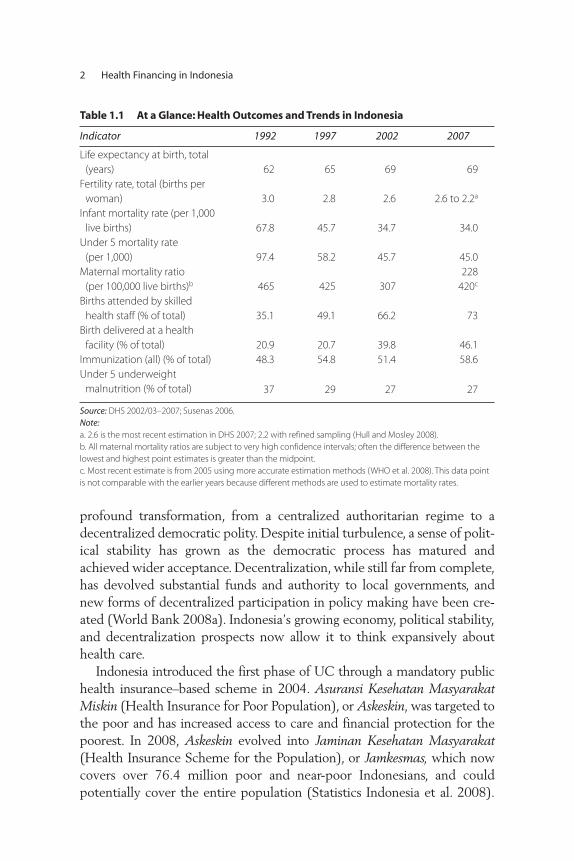
Indonesia introduced the first phase of UC through a mandatory publichealth insurance–based scheme in 2004. Asuransi Kesehatan MasyarakatMiskin (Health Insurance for Poor Population), or Askeskin, was targeted tothe poor and has increased access to care and financial protection for thepoorest. In 2008, Askeskin evolved into Jaminan Kesehatan Masyarakat(Health Insurance Scheme for the Population), or Jamkesmas, which nowcovers over 76.4 million poor and near-poor Indonesians, and couldpotentially cover the entire population (Statistics Indonesia et al. 2008).
2 Health Financing in Indonesia
Table 1.1 At a Glance: Health Outcomes and Trends in Indonesia
Indicator 1992 1997 2002 2007
Life expectancy at birth, total
(years) 62 65 69 69
Fertility rate, total (births per
woman) 3.0 2.8 2.6 2.6 to 2.2a
Infant mortality rate (per 1,000
live births) 67.8 45.7 34.7 34.0
Under 5 mortality rate
(per 1,000) 97.4 58.2 45.7 45.0
Maternal mortality ratio
(per 100,000 live births)b 465 425 307
228
420c
Births attended by skilled
health staff (% of total) 35.1 49.1 66.2 73
Birth delivered at a health
facility (% of total) 20.9 20.7 39.8 46.1
Immunization (all) (% of total) 48.3 54.8 51.4 58.6
Under 5 underweight
malnutrition (% of total) 37 29 27 27
Source: DHS 2002/03–2007; Susenas 2006.
Note:a. 2.6 is the most recent estimation in DHS 2007; 2.2 with refined sampling (Hull and Mosley 2008).
b. All maternal mortality ratios are subject to very high confidence intervals; often the difference between the
lowest and highest point estimates is greater than the midpoint.
c. Most recent estimate is from 2005 using more accurate estimation methods (WHO et al. 2008). This data point
is not comparable with the earlier years because different methods are used to estimate mortality rates.

A number of design and targeting issues have led to a much larger expen-diture level than foreseen; budgets have tripled since the start of the pro-gram and continue to increase. This raises fundamental fiscal questionsregarding the equity, affordability, and sustainability of the proposed newhealth insurance system.
The current health system suffers from inefficiencies; large geographic,urban-rural, and poor-nonpoor inequalities; and overall low quality ofservice provision. Although substantial progress was made in increasingaccess to health services, the performance of the current health system isinefficient and inequitable with respect to improving health outcomes andensuring financial protection against impoverishment for the Indonesianpopulation. Utilization of health services in Indonesia declined in the late1990s after the financial crisis and has not rebounded to earlier levels.Self-treatment is very high, with more than half of the population con-tinuing to self-treat instead of seeking care when ill. Public and overallhealth spending increased substantially in recent years, but remain lowby international standards and continue to be inequitably distributedamong, and within, provinces (World Bank 2008c). Medical doctors arein short supply, not well distributed, and are often absent from publicfacilities during working hours, tending to their private clinics instead(World Bank 2009b).
Overshadowing the government’s health development agenda is thepotential impact of the global financial crisis on the government’s abilityto create the fiscal space to increase expenditures on health. It is too earlyto assess the impacts on Indonesia’s future growth prospects of the recentglobal financial crisis. Precrisis and current indications suggest, however,that the country’s macroeconomic fundamentals are relatively robust, andthe financial sector is resilient. Nevertheless, the likelihood of a negativeimpact of the crisis on the Indonesian macroeconomy and on growth pro-jections cannot be discounted, especially if export demand, foreign invest-ment, and capital inflows are adversely affected (World Bank 2008b).
Rationale for a Health Financing Study
The government of Indonesia is in the process of undertaking a comprehen-sive health sector review that includes the health financing system. The gov-ernment’s aim is to obtain advice for the development of its Medium-TermDevelopment Plan 2009–2014 (Rencana Pembangunan Jangka Menengah).In addition to health financing, the government-led review aims to addresshuman resources for health, public health, service delivery system issues,
Introduction 3

pharmaceuticals, physical infrastructure and overall health system organiza-tion, and management and accountability issues. The main rationale for thepresent health financing study is to assist the government-led review byassembling the evidence base to inform the government’s health sectorreform agenda and provide options to achieve universal coverage.
The health financing functions of revenue collection, risk pooling, andpurchasing have not been adequately assessed in the rich Indonesianhealth policy research literature. For example, there is a paucity of actu-arial and economic assessments of the costs of UC, and the developmentand implementation of modern incentive-based medical care providerpayment systems is in its infancy. This study focuses on the financingfunctions and their respective objectives of (i) equitably and efficientlyraising sustainable revenues to support UC, (ii) pooling risks in an effi-cient and equitable manner to ensure financial protection for theIndonesian population, and (iii) purchasing services in an allocatively andtechnically efficient manner.
This assessment provides an analytical policy framework based on theglobal good practices evidence base as well as on some rudimentarycosted options for the transition to UC, including the necessary futuredelivery system and demand-side reforms. The study also builds on ear-lier sector analyses of Indonesia’s postcrisis decentralization strategy thatwere undertaken in 2002 (World Bank 2002) and the 2008 IndonesiaHealth Public Expenditure Review (World Bank 2008c). More detailedregional comparisons are provided in a World Bank study of the healthfinancing challenges in the East Asia and Pacific region (Langenbrunnerand Somanathan forthcoming).
Objectives
The reform experience in Indonesia is an important addition to the globalevidence base because of the “big bang” nature of both the decentraliza-tion and financing reforms as well as the need to document the cost,equity, financial protection, and outcome impacts of scaling up to UC ina developing country. Moreover, Indonesia, like the Philippines, Thailand,and Turkey, faces the considerable challenge of a middle-income countrystriving to achieve UC by scaling up a series of fragmented programs cov-ering different population subgroups into one universal mandatory healthinsurance program for its entire population.
The specific objectives of this report are to provide a freestandingassessment of the critical challenges, knowledge gaps, and potential policy
4 Health Financing in Indonesia

options for the government to implement UC, while at the same timecontributing to the government’s comprehensive health sector review.This will be accomplished by
• assessing in detail the performance of the current health financing sys-tem in Indonesia and highlighting the strengths and weaknesses of itspublic and private systems and proposed reforms;
• analyzing the impacts of the critical interactive underlying factorsaffecting health financing, including epidemiologic, demographic, andnutrition trends; health and related (education, for instance) systemsconfigurations and policies; current and future economic trends; anddecentralization issues; all in the context of the underlying political,institutional, and geographic realities of Indonesia;
• addressing the implementation and financing challenges broughtabout by the passage of Social Security Law No. 40/2004 introducingUC through a mandatory national health insurance scheme;
• focusing on the need for additional policies to effectively protecthouseholds from falling into poverty because of catastrophic healthevents and thus ensuring equity; and
• providing recommendations on how to proceed in addressing spe-cific unresolved policy and technical issues needed for informed decision making.
Methodology and Scope
This work is closely coordinated with counterparts from the governmentof Indonesia and other development partners. It builds upon and updatesearlier reviews and strategic work by the government, the World Bank,the Indonesian health policy community, and other donors. The scope ofthe review is national. A systematic review, synthesis, and analysis of exist-ing data, documents, and reviews across the sector was undertaken as theprincipal study methodology for this assessment. New data were col-lected, including district-level expenditures, household expenditures,health insurance coverage and claims information; and preliminary actu-arial estimates were developed. Consultations and interviews with keystakeholders and academics were used to fill other knowledge gaps and tohighlight areas for more in-depth analyses.
More specifically, this health financing review includes analyses of awide range of available data. These data relate to macroeconomic indica-tors; demographic data; health expenditures and utilization; existing
Introduction 5

household survey results (Susenas); the Ministry of Finance’s SistemInformasi Keuangan Daerah (Local Government Expenditure Database);Demographic and Health Survey results (DHS); the Indonesian FamilyLife Survey; the Governance and Decentralization Survey; infrastructurecensuses such as Potensi Desa (Survey of Village Potential); and interna-tional comparisons based on the World Health Organization’s (WHO)National Health Accounts database and the World Bank’s World Develop - ment Indicators.
Structure and Outline of the Review
This health financing review is structured around the topic areas and pol-icy questions identified and agreed upon in broad stakeholders’ discussions.These discussions were formalized in two seminars: (i) the senior policyseminar on Disease Control Priorities and Health System Strengthening, heldin Bandung, Indonesia, June 10–12, 2007; and (ii) the high-level health con-ference Health Systems: How to Achieve Results held in Nusa Dua, Bali,Indonesia, August 27–29, 2007. In addition, numerous consultations withthe government of Indonesia and key donor partners were held around spe-cific areas over the past three years, including a consultation on the draftfinal version of this study on January 30, 2009.
Using available information, analyses, and actions taken to date by thegovernment, this study encompasses five key tasks: (i) to assess the under-lying demographic, epidemiological, economic, geographic, and politicalfactors underpinning current and future reform efforts; (ii) to analyze thestrengths and weaknesses of the current Indonesian health system in thecontext of the basic health system objectives of maximizing health out-comes, ensuring financial protection, and being responsive to consumersin an equitable, efficient, and sustainable manner; (iii) to assess efforts todate in expanding health insurance coverage in Indonesia; (iv) to collatethese efforts with the policy questions above; and (v) to provide recom-mendations on possible next steps, including policy analyses, optionsdevelopment, actuarial analyses, and transition steps germane to the nextfive-year planning cycle and movement to UC.
The study is organized as follows:
• Chapter 1 provides a brief background to, and the rationale for, thestudy as well as the objectives and methodology.
• Chapter 2 provides a brief overview of the socioeconomic and healthsystems context as it pertains to health financing.
6 Health Financing in Indonesia

• Chapter 3 describes Indonesia’s current health financing programsaccording to the classic health financing functions of revenue collec-tion, risk pooling, and purchasing, and analyzes Indonesia’s healthspending trends.
• Chapter 4 assesses the performance of the health system as measuredby health outcomes, health spending, financial protection, equity,and allocative and technical efficiency, and summarizes its strengthsand weaknesses.
• Chapter 5 discusses the health financing reform options under con-sideration and analytical efforts to date in answering the key policyquestions outlined above; highlights remaining unresolved issues; andproposes a health policy framework for dealing with these issuesbased on global experience and Indonesia’s ongoing reform processes.
• Chapter 6 discusses options for finding the needed resources to financeuniversal coverage.
• Chapter 7 concludes this study by providing suggestions on the nextsteps in the government of Indonesia’s transition to universal healthinsurance coverage.
Introduction 7


9
Although Indonesia’s population growth has slowed considerably since the1960s, there will be close to 275 million Indonesians by 2025. Changes indisease patterns will have serious consequences for the type of health careneeded and the fact that more women are joining the workforce willreduce the availability of family members to care for the elderly. Thischapter provides a brief overview of these socioeconomic issues and thehealth systems context as it pertains to health financing.
Population Dynamics and Demographic Changes
Changes in population numbers and demographics are important becausethey indicate the changing requirements for various types of infrastructureeven if there is little or no change in living standards. With a population ofapproximately 228 million (in 2008), Indonesia is the fourth most popu-lous country in the world. Although population growth is projected todecline significantly from 1.34 percent per year in 2005 to 0.11 percent in2050, Indonesia’s total population will still increase from 206.3 million in2000 to 273.2 million by 2025. This projection is important for policymaking and universal health insurance coverage planning because it illus-trates the future characteristics of the population (table 2.1).
C H A P T E R 2
Socioeconomic and Health Systems Context

10 Health Financing in Indonesia
Table 2.1 Population and Demographic Indicators and Projections for Indonesia(1961–2025)
Indicator 1961 1980 2000 2010 2020 2025
Total population (millions) 97.0 147.5 206.3 233.4 261.0 273.2
Women at reproductive age,
15–49 yrs (millions) 23.7 35.9 57.3 66.8 70.3 70.8
Women at reproductive age,
15–49 yrs (%) 24.4 24.3 27.8 28.6 26.9 25.9
Children age 0–14 yrs
(millions) 41.0 60.0 63.2 60.7 62.4 62.3
Children age 0–14 yrs (%) 42.3 40.7 30.6 26.0 23.9 22.8
Working-age population,
15–64 yrs (millions) 53.4 81.9 133.1 160.2 180.4 187.7
Working-age population,
15–64 yrs (%) 55.1 55.5 64.5 68.6 69.1 68.7
Older population, 65+
(million) 2.6 4.8 9.6 12.4 18.3 23.2
Older population, 65+ (%) 2.7 3.3 4.7 5.3 7.0 8.5
Dependency ratio (young) 76.8 73.3 47.5 37.9 34.6 33.2
Dependency ratio (elderly) 4.9 5.9 7.2 7.7 10.1 12.4
Total dependency ratio (per
100 working age) 81.7 79.2 54.7 45.6 44.7 45.6
Rate of population growth,
%/year, past decade 1.80 2.30 1.40 1.27 1.06 0.92
Number of births (millions) 3.80 5.30 4.10 4.29 4.24 4.18
Number of deaths (millions) 2.20 1.90 1.60 1.47 1.69 1.93
Crude birth rate (per 1,000
population) 43.8 39.9 20.7 18.4 16.3 15.3
Crude death rate (per 1,000
population) 22.7 12.9 7.8 6.3 6.5 7.1
Total fertility rate per
woman — 4.70 2.30 2.15 2.08 2.07
Net reproductive rate per
woman — — — 1.00 0.99 0.98
Infant mortality rate (per
1,000 births) — 109.0 47.0 25.7 17.0 15.5
Life expectancy (years) — 52.2 65.4 69.8 72.8 73.6
Source: Bappenas-BPS-UNFPA 2005, base year 2000.
Note: — = Not available.
Other factors are also important when developing a road map forhealth system reforms and universal health insurance coverage. The averageage at which people will complete education should rise from about 15to about 18 as it has in many Organisation for Economic Co-operationand Development countries. The average age at which retirement occursshould increase—probably to about age 60, but it could go higher by

Socioeconomic and Health Systems Context 11
2025. Average household sizes will probably decrease quite markedly asa result of reductions in total fertility rates and increases in workforcemobility, which will be influenced by increased urbanization. However,the pace of urbanization will not occur uniformly across provinces. Laborforce participation rates for women are likely to increase and, coupledwith falling birth rates, will diminish their numbers and availability asinformal-sector caregivers for increasingly older parents. Growth in the55–74 age group will bring high demand for additional health services,including hospital-based specialist services for noncommunicable diseasesand more social services.
The resulting infrastructure issues will be significant, and will be partic-ularly noticeable with regard to hospitals, health centers, and local primarycare practices. The successful family planning programs that started in the1970s in Indonesia led to smaller families and a decline in the fertility rateto 2.3 children per woman in 2000. The resulting decline in the overall andyouth dependency ratios1 may provide an opportunity for economicgrowth defined as the “demographic bonus” or “demographic dividend” (fig-ure 2.1) if this increasingly large workforce can be productively employed.If not, the demographic dividend could become a “demographic curse” withhigh levels of unemployment and social unrest.
Epidemiological Changes
Accompanying the demographic transition is an epidemiological transi-tion with a rising burden of noncommunicable diseases and injuries. Thetwo main causes of death in Indonesia are currently noncommunicablediseases: cardiovascular diseases and malignant neoplasms. In addition,intentional and nonintentional injuries make up more than 10 percent ofdeaths, and this figure is growing as a result of increased numbers of roadaccidents (WHO 2008a). Risk factors such as tobacco use,2 poor diet andlack of exercise, and traffic accidents are growing in importance and fur-ther contributing to the noncommunicable disease burden.
Although the incidence is declining, communicable diseases remainimportant and make up 43 percent of deaths in Indonesia. Emerging dis-eases, such as avian influenza and HIV/AIDS, also add to the changes indisease patterns. Indonesia has the highest number of avian influenzadeaths worldwide and has one of the highest fatality rates. With theexception of the province of Papua, the HIV/AIDS epidemic in Indonesiais currently concentrated in high-risk subpopulations, such as sex workersand intravenous drug users.

Figure 2.1 Potential Window of Opportunity for Indonesia
Source: Adioetomo 2007.
0
50
100
150
200
250
year
po
pu
lati
on
(mill
ion
s)
persons 65+
working-age
a. Demographic trends, 1950–2050 b. Dependency ratio, 1950–2050
children 0-14
0
10
20
30
40
50
60
70
80
90
19501960197019801990200020102020203020402050
year
19501960197019801990200020102020203020402050
rati
o t
o w
ork
ing
-ag
e p
op
ula
tio
n
young
elderly
window of opportunity
demographic bonus
total
12

Labor Market Situation
Job creation has not kept up with population growth since 2000, with thepercentage of the employed population falling from 63 percent in 2001to 60.9 percent in 2007 (figures 2.2 and 2.3). Although there was a sub-sequent turnaround in total employment in 2007, only some 30 percent
Socioeconomic and Health Systems Context 13
63.0
61.661.3
60.9
59.3 59.4
60.9
57
58
59
60
61
62
63
64
2001 2002 2003 2004 2005 2006 2007year
per
cen
tag
e o
f po
pu
lati
on
em
plo
yed
Figure 2.2 Employment (2001–07)
Source: BPS (Sakernas labor force surveys).
0
10
20
30
40
50
60
19901991
19921993
19941995
19961997
19981999
20002001
20022003
20042005
20062007
per
cen
tag
e o
f to
tal e
mp
loym
ent
year
male = solid linefemale = dotted line
agriculture industryservicesmanufacturing government or defense
Figure 2.3 Employment by Sector and Gender (1990–2007)
Source: BPS (Sakernas labor force surveys).

14 Health Financing in Indonesia
of the labor force works in higher value-added activities, in formal man-ufacturing, or as employees in organized enterprises. Work in formal,organized enterprises is particularly important to future health insurancebecause formal sector employers and employees are more identifiable ascontributors to an insurance scheme.
Another relevant issue from the perspective of increasing healthinsurance coverage using some form of payroll-based premium is thelarge degree of informality in the labor market in Indonesia. Some 60percent of the labor force was composed of informal workers in 2007,with 40 percent of Indonesia’s labor force dependent on low-productivityagricultural activities. Despite several years of economic growth in thecountry, there is only a very weak trend toward increasing formality inthe workforce. As can be seen in figure 2.4, the level of formality hasbarely changed in the past two decades in Indonesia. This persistent levelof informality, however, is observed not only in Indonesia but all acrossAsia and Latin America (Felipe and Hassan 2006).
Indonesia’s Health System
The Ministry of Health (MoH) has overall responsibility for nationalhealth policy and manages and operates teaching-level and specializedhospitals. It recruits and allocates public sector doctors and other key staffand operates the main vertical programs for controlling such diseases astuberculosis, HIV/AIDS, and malaria. The MoH remains responsible for
0
20
40
60
80
100
19901992
19941997
19992001
20032005
2007
year
per
cen
tag
e
Figure 2.4 Growth of Formal Sector Share of Employment in Indonesia(1990–2007)
Source: World Bank staff estimate.

the allocation of key staff to the subnational regions, despite decentraliza-tion. However, while the MoH is responsible for the health system, vari-ous health insurance programs, the private sector, and local governmentsare also important financiers, and in some cases providers, of services,resulting in significant fragmentation of both roles and flows of funds.These issues are discussed in more detail below.
As in many other low- and middle-income countries, most public pro-vision and financing of health care in Indonesia is integrated and man-aged centrally by the MoH. The Ministry of Finance transfers funds tothe MoH based on budget proposals that have been developed based onthe previous year’s budget, rather than needs and demand. In addition,in 2007 the MoH took on the responsibility of reimbursing hospitals forcare provided under the Jamkesmas insurance program for the poor. Theprivate health sector, which provides services to some 40 percent ofthose seeking care, exists in parallel, with little public oversight regard-ing the quality of services, despite such oversight being required by lawas mentioned above.
Decentralization set in motion a significant change in the roles andresponsibilities of various levels of government. Responsibility for imple-mentation of health services was transferred to local governments at thedistrict level, together with almost a quarter million health workers. Therelocation, however, was administrative rather than physical. Althoughdistricts are now responsible for employment, deployment, and payment,regulations regarding authority to make decisions and budgets, and thecapacity to carry them out, do not exist, largely because overall civil serv-ice reforms have stalled (World Bank 2005a).
Since decentralization, province-level health offices have mainly beenresponsible for training and coordination efforts as well as oversight ofprovincial hospitals, but they have limited resource allocation responsibil-ities. In contrast, districts have major responsibilities for delivering healthservices and allocating resources. At the subdistrict level, Puskesmas(health centers) have been the linchpin of basic health services and pri-mary care since the 1970s, while district-level hospitals are the mainproviders of curative care. Curative services are provided by four types ofhospitals ranging from teaching hospitals in the country’s major cities todistrict-level hospitals where all main services are provided and referralsare made for more complicated cases to the higher-level hospitals.3
Public health facilities play an important role as economic enter-prises for local governments. Local governments officially “own” publichealth facilities and hospitals but have never been allocated the
Socioeconomic and Health Systems Context 15

needed resources to manage them. As a result, they rely on central subsi-dies for salaries and operational costs while user fees finance the nonsalarycosts of medical care. In the 1990s, the private sector was encouragedto take on a more important role in delivering health services. This ledto growth in the number of private hospitals and emergency-trainedmidwives,4 which were expected to support themselves by charging feesfor service.
Public hospitals, and later Puskesmas, were encouraged to adopt the self-governing (Swadana) principle, which has led to a greater reliance on userfees. Cost-recovery fees contributed little before decentralization—about15 percent in public health facilities—but their contribution increasedfollowing decentralization. There is a dearth of information regarding theserevenues, but a limited 2006 study reported that 75 percent of revenuesgenerated by Puskesmas and public hospitals went to local governments(Kristiansen and Santoso 2006). Still, little is done to track actual rev-enues of these facilities. A negative result of the focus on revenue raisingis that public health interventions and preventive measures get less atten-tion because they are less profitable.
Health Service Physical InfrastructureAn impressive expansion of public health system infrastructure occurredin the 1970s and 1980s. Construction of the primary health care networkand Puskesmas was financed mainly from the central government budget.Initially, financing came from the Inpres (Presidential Instruction) programand later through the MoH budget (Anggaran Pendapatan dan BelanjaNegara or APBN, the state budget). Central-level funding for Puskesmasconstruction continued after decentralization through the special alloca-tion fund (Dana Alokasi Khusus or DAK) that channeled funds directly tothe district level. The Puskesmas and its network were equipped usingstandards set by the MoH and funded by the central government.
By 2006, Indonesia had established more than 8,000 Puskesmas, ofwhich about 31 percent provide inpatient facilities (MoH 2007a). EachPuskesmas serves about 23,000 people within a service area of 24 squarekilometers (MoH 2007a). Access to public health services has been fur-ther improved with the establishment of about 22,200 health subcenters(Puskesmas Pembantu or Pustu) and about 5,800 mobile health centers.5
The ratio of health subcenters to health centers is about 3:1. Although thenumber of Puskesmas is considered sufficient to meet the establishedstandard of one Puskesmas per 30,000 people, there are disparities amongprovinces and availability is not based on needs assessments.
16 Health Financing in Indonesia

Physical access to services is considered less of a problem than qualityof services in Indonesia. When compared with other countries, however,Indonesia has a very low hospital bed to population ratio (figure 2.5). Thenumber of beds per 1,000 population is, in fact, one of the lowest in theEast Asia and Pacific region, even when compared with much lower-income countries such as Vietnam and the Lao People’s DemocraticRepublic and, on a global scale, Indonesia has significantly fewer bedsthan other countries of a similar income level.
The number of hospitals and hospital beds has grown slowly and hasbarely kept up with population growth. In 1990, there were 404 hospi-tals and about 59,000 beds under the “main system,” consisting of theMoH, plus provinces and districts. In 2005, these numbers rose to 452hospitals (including specialized hospitals) and about 66,700 beds(tables 2.2 and 2.3). These numbers do not include hospitals belongingto the armed forces, the police, or other ministries and state-ownedenterprises, which, although affiliated with state agencies, functionmore like private institutions.
The slow expansion in public hospitals and beds has been partly offsetby an increase in private hospitals. In 1995, there were 329 private hospi-tals with about 33,300 beds, some 33 percent of the total beds, increasingin 2006 to 441 hospitals, including specialized, private hospitals with about43,800 beds, some 37 percent of the total (table 2.3). Private hospitals are,on average, smaller than public hospitals. This difference in size is partlyexplained by the large number of small single-specialty private hospitals,
Socioeconomic and Health Systems Context 17
IndonesiaCambodia
China
Lao PDR
MalaysiaPhilippines
Samoa ThailandVietnam
0
5
10
15
ho
spit
al b
eds
per
1,0
00
10 100 250 1,000 2,500 10,000 25,000GDP per capita in current US$
Figure 2.5 Global Comparison of Hospital Beds to Population Ratio with GDP
Source: World Development Indicators 2007; WHO 2006.
Note: GDP per capita in log scale. Bed and GDP per capita data are for the latest avilable year.

mostly maternity hospitals. However, even among general hospitals, privatehospitals are smaller than public general hospitals, with an average of 99beds and 146 beds, respectively (MoH 2007b).
The Governance and Decentralization Survey 2 (GDS2) conducted bythe World Bank in 2006 found that more than 80 percent of Puskesmashave medicines in stock, an ambulance, and computers (Lewis andPattinasarany 2007). In addition, 90 percent have clean water and, whilealmost all have electricity, only 39 percent have a power generator.Regarding waiting room conditions, almost all have adequate lighting andventilation, but in only 40 percent of the Puskesmas are the examinationrooms closed for privacy and 20 percent do not have a garbage can.
18 Health Financing in Indonesia
Table 2.2 Number of Hospitals by Ownership
Hospital affiliation 1995 1997 2000 2003 2005 2006
Ministry of Health 15 15 14 14 13 13
Province, district, municipal 323 327 328 339 365 377
Armed forces or police 110 111 110 110 110 110
Other ministry or state-
owned enterprise (Badan Usaha Milik Negara or BUMN) 73 69 68 71 71 71
Private 329 351 390 432 436 441
Total 850 873 910 966 995 1,012
Source: MoH 2007b.
Note: Table does not include specialized hospitals, which explains the discrepancy in numbers between table and
the text.
Table 2.3 Number of Beds by Hospital Ownership
Indicator 1995 1997 2000 2003 2005 2006
Ministry of Health 9,023 9,610 9,173 8,858 8,483 8,784
Province, district,
municipal 40,069 40,824 42,109 43,761 46,798 48,209
Armed forces or police 10,752 10,874 10,811 10,718 10,814 10,842
Other ministry or
state-owned enter-
prise (Badan Usaha Milik Negara or BUMN) 7,246 6,881 6,928 6,758 6,827 6,880
Private 33,298 35,697 38,516 42,284 43,364 43,789
Total 100,388 103,886 107,537 112,379 116,286 118,504
Beds per 100,000 51.55 — 52.42 52.62 53.05 53.37
Bed occupancy rate — — — 56 56 59
Source: Indonesia Health Profiles, various years, MoH.
Note: Beds in general hospitals only, not including specialized hospitals.
— = Not available.

A recent physical infrastructure rapid assessment6 shows the data onphysical infrastructure are not very reliable as a result of a failure to main-tain data currency after decentralization as well as inconsistencies withnames, locations, and inventories (GTZ 2009). The sample assessmentfindings highlight a number of issues in medical equipment planning, pro-vision, and use that contribute to inefficiencies. Equipment is often pro-vided through different sources (for example, provinces can provideequipment to Puskesmas without a district’s knowledge and without aneeds assessment); and some Puskesmas are overequipped (or are receiv-ing inappropriate anaesthetics machines and electro-surgery units), whileothers lack equipment. There is little coordination between the equip-ment on hand and technical specialists to operate it.
Several hospitals found a solution to operating sophisticated equip-ment by leasing from private companies, thereby transferring the burdenof complex maintenance and repair services from the hospital manage-ment to the company. Similar schemes were found for laboratories.Although maintenance units were found in all hospitals, staffing and qual-ification levels were mostly inadequate. Outsourcing of maintenanceservices (basic as well as complex services) is used in some instances but,in general, maintenance appears to be a neglected area. There are no clearguidelines or minimum budget figures for maintenance. Managementappears to prefer to invest in new equipment instead, a practice that leadsto significant loss of value and wastage. The present budgeting systemleads health facilities to favor procurement and replacement (oftenfunded from outside sources) over maintenance (funded from internal,limited resources).
PharmaceuticalsAvailability of essential medicines in public primary care appears to bereasonable, but temporary vaccine shortages are widespread. The avail-ability of essential medicines is not systematically monitored, but thereare indications of variable performance across districts. Between 75 and80 percent of districts in Indonesia for which data are available (from theGDS and ad hoc studies) report adequate supplies of essential medicines.However, this achievement has come at an unmeasured cost in highquantities of inventory at multiple levels in the system, losses of date-expired products, and stock-outs. Delays in budget allocation and publicsector procurement for essential medicines and vaccines, combined withvariable efficiency in the buffer stock and the local drug management sys-tem for primary care medicines, are leading to simultaneous overstocking
Socioeconomic and Health Systems Context 19
and stock-outs. The high quantities of inventory at every level of the systemhave hidden financing costs and associated risks of leakage or spoilage.Many districts and Puskesmas have a combination of overstocking forsome products and stock-outs of others.
Many districts reported several months of vaccine stock-outs in 2007,and in the aggregate, insufficient annual quantities of vaccines have beendistributed. These inefficiencies partly result from budget and procure-ment rules that treat these supplies as discretionary, deferrable expendi-tures but also because of the challenge of coordinating both centralizedand decentralized planning, budgeting, and procurement in the very tighttime frame created by current budget rules and procurement practices.Indonesia also has a substantial and diverse traditional medicines sector,with a wide range of practices across the many ethnic groups that usesuch remedies from traditional healers. Traditional medicines are still usedextensively, especially by the rural population.
Human Resources for Health Indonesia’s health workforce is small, with low service ratios relative toother countries in the region and globally. Compared with countries thathave similar income levels, Indonesia has considerably lower doctor-to-population ratios: 21 doctors per 100,000 compared with 58 in thePhilippines and 70 in Malaysia. Even when compared with countries withlower income per capita than Indonesia, such as Vietnam and Cambodia,Indonesia has lower ratios (figure 2.6). Similarly, with respect to the totalnumbers of health workers to population, Indonesia has a much lowerratio than most other East Asia and Pacific region countries as well asother countries of its income level globally.
The ratio of doctors per 100,000 population has improved over time,but inequities in distribution between provinces, between urban and ruralregions, and between more and less affluent areas have not. In 2007, therewere a few more than 70,000 medical doctors in Indonesia and, of those,about 15,000 were medical specialists (Konsil Kedoktoran Indonesi[Indonesian Medical Council], http://www.inamc.or.id/). Indonesia doessomewhat better in regional comparisons of the ratios of midwives andnurses to population, with an estimated 62 nurses and 50 midwives per100,000 population (World Bank 2009a).7 There are almost 80,000 mid-wives in Indonesia. Their numbers and ratio per 100,000 population havealso improved over time, as has their distribution (table 2.4). For nurses,however, the data do not allow credible estimates of current numbers anddistribution to be determined.
20 Health Financing in Indonesia

Cambodia
China
Indonesia
Lao PDR Malaysia
Philippines
SamoaThailand
Vietnam
0
2
4
6
8
do
cto
rs p
er 1
,000
10 100 250 1,000 2,500 10,000 25,000GDP per capita (current US$)
a. Doctor supply vs. income
Cambodia
China
Indonesia
Malaysia
Philippines
Samoa
Thailand
Vietnam
5
15
50
hea
lth
wo
rker
s p
er 1
,000
250 1,000 5,000 25,000GDP per capita (current US$)
b. Health worker supply vs. income
Figure 2.6 Global Comparisons of Doctors and Health Workers to Population Trend Lines (2000–06)
Source: World Development Indicators 2007; WHO 2006.
Note: a. GDP per capita on log scale. Doctor and GDP per capita data are for the latest avilable year. b. GDP per capita on log scale. Health worker and GDP per capita data are for the latest
avilable year.
21

The data for the number and ratio of specialists in Indonesia are verylimited. The most reliable current estimate comes from the number ofspecialist doctors registered with Konsil Kedoktoran Indonesi (15,082), oronly 7 specialists for every 100,000 Indonesians (table 2.5). Even inJakarta, the ratio is only 41 per 100,000 population. In addition, there arealso large differences in the number of specialists between provinces, withthe large majority of specialists, more than 10,000, in Jakarta, Yogyakarta,and West, Central, and East Java.8
Health Services Utilization The utilization9 of health facilities has increased since the 1997 financialand economic crisis, but overall utilization has not been restored to pre-crisis levels. In 2007, 42 percent of those reporting ill sought treatmentfrom an established facility (World Bank 2008c). However, 45 percent ofpeople reported that they relied on self-treatment during their last illness,obtaining medication at pharmacies or drugstores. More than 1 in 10 peo-ple (13 percent) did not seek treatment at all (figure 2.7).
Since 2004, public service utilization has increased, while privateprovider utilization has decreased. Public health service utilization rateshave increased by almost 100 percent since 2004, while private serviceutilization rates have decreased (figure 2.8). This could be the result of asubstitution effect, whereby those previously seeking private health serv-ices are now serviced by public providers.
Health Information System A recent health information system (HIS) assessment indicates thatIndonesia’s national policy on health information systems10 describes the
22 Health Financing in Indonesia
Table 2.4 Ratio of Doctors and Midwives by Region (1996–2006)
Region
Doctors per 100,000 population Midwives per 100,000 population
1996 2006 % change 1996 2006 % change
Java-Bali 16.2 18.5 14.20 27.5 26.1 –5.09
Urban 39.0 34.1 –12.56 23.8 25.1 5.46
Rural 4.4 4.5 2.27 29.5 27.1 –8.14
Outside Java-Bali 14.8 18.1 22.30 46.8 52.8 12.82
Urban 43.2 40.9 –5.32 45.1 45.4 0.67
Rural 7.1 8.3 16.90 46.0 55.1 19.78
Remote 4.7 6.6 40.43 53.4 58.1 0.09
Source: Various years of PODES (Survey of Village Potential).
Note: The number of doctors and midwives was obtained from questions in PODES that asked the head of the
village about the number of doctors living within the boundary of the village.
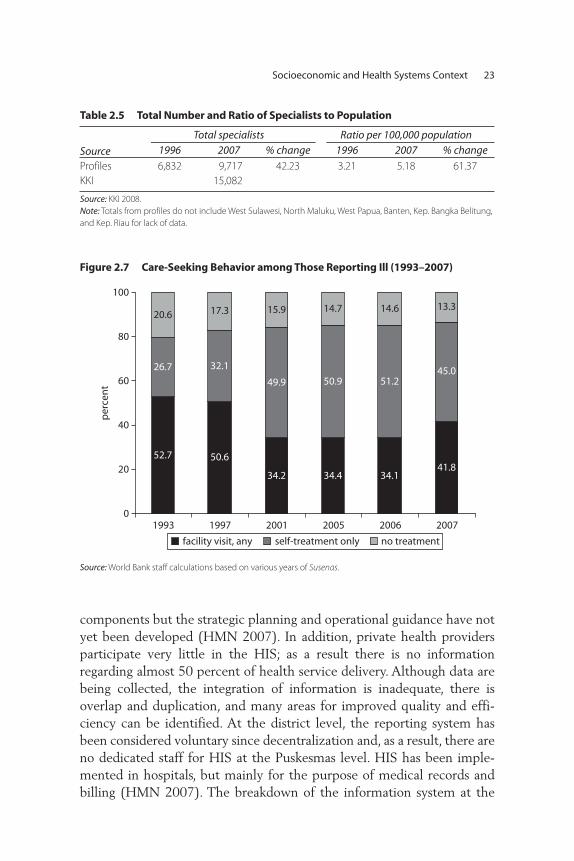
components but the strategic planning and operational guidance have notyet been developed (HMN 2007). In addition, private health providersparticipate very little in the HIS; as a result there is no informationregarding almost 50 percent of health service delivery. Although data arebeing collected, the integration of information is inadequate, there isoverlap and duplication, and many areas for improved quality and effi-ciency can be identified. At the district level, the reporting system hasbeen considered voluntary since decentralization and, as a result, there areno dedicated staff for HIS at the Puskesmas level. HIS has been imple-mented in hospitals, but mainly for the purpose of medical records andbilling (HMN 2007). The breakdown of the information system at the
Socioeconomic and Health Systems Context 23
Table 2.5 Total Number and Ratio of Specialists to Population
Source
Total specialists Ratio per 100,000 population
1996 2007 % change 1996 2007 % change
Profiles 6,832 9,717 42.23 3.21 5.18 61.37
KKI 15,082
Source: KKI 2008.
Note: Totals from profiles do not include West Sulawesi, North Maluku, West Papua, Banten, Kep. Bangka Belitung,
and Kep. Riau for lack of data.
26.7 32.1
49.945.0
20.6 17.3 15.9
50.9 51.2
14.7 14.6 13.3
0
20
40
60
80
100
1993 1997 2001 2005 2006 2007
per
cen
t
52.7 50.641.8
34.2 34.4 34.1
facility visit, any self-treatment only no treatment
Figure 2.7 Care-Seeking Behavior among Those Reporting Ill (1993–2007)
Source: World Bank staff calculations based on various years of Susenas.

decentralized level and the lack of coordination at the national levelexplain the lack of information at the national level since 2001.
Notes
1. The total dependency ratio is defined as the number of children less than15 years old plus the number of persons 65 or older compared with theworking-age population ages 15-64.
2. Some 63 percent of the male population of Indonesia smokes (Barber et al.2008).
3. Hospitals are categorized as (i) class A, averaging about 1,450 beds andoffering a complete range of specialties and advanced forms of treatment;(ii) class B, averaging about 625 beds and providing about 10 specialties,sophisticated X-ray facilities, and a full range of laboratory services; (iii) classC hospitals at the district level, ranging from 50 to 350 beds and providingmost specialties and referring up patients in need of advanced diagnostic andtreatment services; and (iv) class D hospitals, also at the district level, aver-aging about 70 beds and providing only general services.
4. The Bidan Di Desa (BDD) program was started in 1989 with the objective ofaccelerating the reduction of high levels of maternal mortality. An estimated55,000 midwives were trained in one-year courses and deployed to all villagesin Indonesia.
5. Puskesmas Keliling, of which 508 are four-wheeled and about 700 are on boats(MoH 2007a, Health Profile 2005).
24 Health Financing in Indonesia
0
5
10
15
20
19992000
20012002
20032004
20052006
2007
per
cen
t
public privatetraditional self-treatment
Figure 2.8 Choice of Provider (1999–2007)
Source: World Bank staff calculations based on various years of Susenas.

6. This assessment was commissioned and managed by Puskabangkes and theGerman Agency for Technical Cooperation as part of the inputs to theIndonesian government-led Health Sector Review. The objective was to evalu-ate the data and information on physical infrastructure inventories; standardsand guidelines regarding facilities and equipment requirements, includingtheir application; procedures with regard to budgeting and planning; and toconduct an inspection of a sample of buildings and equipment.
7. There are large discrepancies between data sources, preventing a clear pictureof the current number and distribution of nurses from being formed. For moredetails, see World Bank (2009a).
8. Data are not provided in disaggregated form, and it is not possible to character-ize the distribution of specialists across urban, rural, and remote areas.
9. Utilization is measured as the percentage of the population seeking treatmentas a share of total population (not those reporting ill).
10. The national policy on health information systems was established byMinister of Health Decree No. 511/MenKes/SK/V/2002.
Socioeconomic and Health Systems Context 25


27
This chapter provides an overview of the historical evolution of theIndonesian health financing system and assesses the basic financing func-tions of revenue collection, risk pooling, and purchasing of services. Acountry’s health financing functions need to be assessed in the context ofhow well they achieve the basic health system objectives of maximizinghealth outcomes, ensuring financial protection, and promoting consumerresponsiveness in an equitable, efficient, and financially sustainable man-ner. The basic financial and nonfinancial incentives embodied in the spe-cific policies underlying these functions are critical determinants of theoverall performance of the health system.
Health Financing Functions
The three basic functions of any health financing system are revenue col-lection, risk pooling, and purchasing of services. Figure 3.1 highlights thesebasic functions, together with the basic health system objectives they aredesigned to achieve. Countries need to focus not on generic models but onhealth financing functions and objectives and the specific micro and macropolicies needed to achieve them. Revenue collection, public or private,entails collecting sufficient and sustainable revenues in an economically
C H A P T E R 3
Indonesia’s Health Financing System

efficient (so taxes do not distort the economy) and equitable manner to pro-vide individuals with a Basic Benefits Package (BBP) that improves healthoutcomes, provides financial protection, and is responsive to consumers. Theserevenues are then “pooled” to provide people with “insurance” protectionagainst unpredictably large medical care expenses. Covered services arethen purchased efficiently so as to maximize health outcomes, financialprotection, and consumer responsiveness.
Some of these functions for specific groups (for example, higherincome earners) and types of services can be accomplished through pri-vate or public financing arrangements. There are no one-size-fits-all solu-tions, and generic models such as social health insurance (SHI), nationalhealth services (NHS), and private voluntary health insurance (PVHI)are, individually, extremely limited in providing the specific policy direc-tion needed to achieve the health financing and health system goals. Mostcountries’ health financing systems represent combinations of these mod-els. In fact, the “new” SHI model, generally known as mandatory healthinsurance, explicitly recognizes this fact by being characterized as a modelin which the poor are covered through the general government budget(an NHS characteristic), while other groups are financed through manda-tory individual contributions, employer contributions, or both (an SHIcharacteristic). In some countries, higher-income individuals opt out touse higher-quality or higher-amenity private services, which, in effect,allows scarce public funds to be concentrated on the poor through uni-versal coverage. Getting this balance right is difficult because it requires
28 Health Financing in Indonesia
health financingfunctions
health financingobjectives
revenue collection
pooling
purchasing
raise sufficient and sustainable revenues in anefficient and equitable manner to provideindividuals with a basic package of essential servicesthat improves health outcomes and providesfinancial protection and consumer satisfaction
manage these revenues to equitably and efficientlycreate insurance pools
ensure the purchase of health services in anallocatively and technically efficient manner
Figure 3.1 Health Financing Functions and Objectives
Source: Gottret and Schieber 2006.
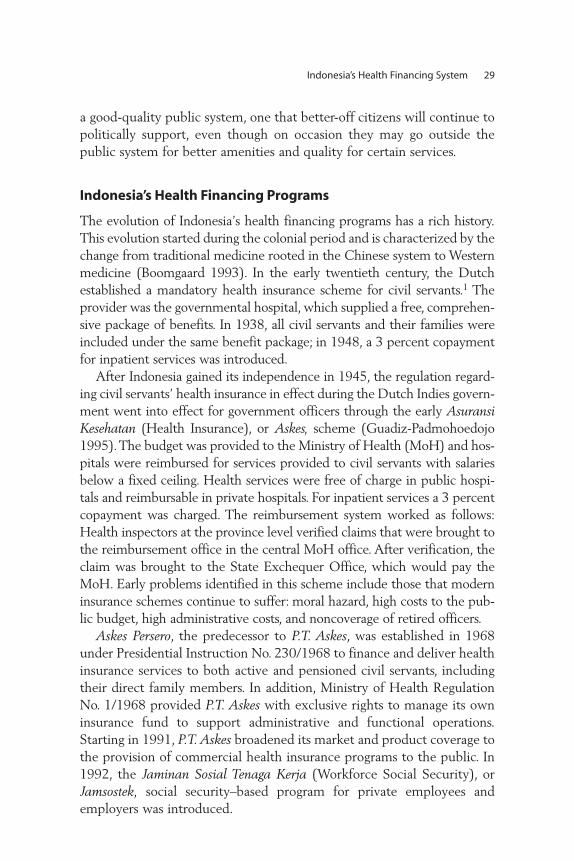
a good-quality public system, one that better-off citizens will continue topolitically support, even though on occasion they may go outside thepublic system for better amenities and quality for certain services.
Indonesia’s Health Financing Programs
The evolution of Indonesia’s health financing programs has a rich history.This evolution started during the colonial period and is characterized by thechange from traditional medicine rooted in the Chinese system to Westernmedicine (Boomgaard 1993). In the early twentieth century, the Dutchestablished a mandatory health insurance scheme for civil servants.1 Theprovider was the governmental hospital, which supplied a free, comprehen-sive package of benefits. In 1938, all civil servants and their families wereincluded under the same benefit package; in 1948, a 3 percent copaymentfor inpatient services was introduced.
After Indonesia gained its independence in 1945, the regulation regard-ing civil servants’ health insurance in effect during the Dutch Indies govern-ment went into effect for government officers through the early AsuransiKesehatan (Health Insurance), or Askes, scheme (Guadiz-Padmohoedojo1995). The budget was provided to the Ministry of Health (MoH) and hos-pitals were reimbursed for services provided to civil servants with salariesbelow a fixed ceiling. Health services were free of charge in public hospi-tals and reimbursable in private hospitals. For inpatient services a 3 percentcopayment was charged. The reimbursement system worked as follows:Health inspectors at the province level verified claims that were brought tothe reimbursement office in the central MoH office. After verification, theclaim was brought to the State Exchequer Office, which would pay theMoH. Early problems identified in this scheme include those that moderninsurance schemes continue to suffer: moral hazard, high costs to the pub-lic budget, high administrative costs, and noncoverage of retired officers.
Askes Persero, the predecessor to P.T. Askes, was established in 1968under Presidential Instruction No. 230/1968 to finance and deliver healthinsurance services to both active and pensioned civil servants, includingtheir direct family members. In addition, Ministry of Health RegulationNo. 1/1968 provided P.T. Askes with exclusive rights to manage its owninsurance fund to support administrative and functional operations.Starting in 1991, P.T. Askes broadened its market and product coverage tothe provision of commercial health insurance programs to the public. In1992, the Jaminan Sosial Tenaga Kerja (Workforce Social Security), orJamsostek, social security–based program for private employees andemployers was introduced.
Indonesia’s Health Financing System 29

In response to the financial and economic crisis of 1997–98, newemphasis was placed on pro-poor financing and a number of efforts wereundertaken to deal with the severe circumstances. Donor fundingincreased sharply in 1998–99 so that the overall level of public fundingremained close to its levels of the early to mid-1990s. The government ofIndonesia developed several targeted programs to cushion the economicshocks of the crisis on the poor and other vulnerable groups. These pro-grams are collectively referred to as the Jaring Pengaman Sosial (SocialSafety Net) or JPS programs (table 3.1). JPS schemes included workfare,subsidized rice sales, targeted scholarships, health subsidies, and villageblock grants. Moreover, over this period, the MoH was involved inencouraging various community-based and voluntary initiatives, includingthe promotion of Village Community Development (PembangunanKesehatan Masyarakat Desa) and community-managed health care basedon the American health maintenance organization model (JaminanPemeliharaan Kesehatan Masyarakat, or JPKM).
30 Health Financing in Indonesia
Table 3.1 Overview of Social Health Insurance Landmarks in Indonesia
Year Initiative
1968 Health insurance for civil servants – Askes1974–90 Promotion and experiments in community-based health insurance (CBHI) –
Dana Sehat1992 Social security for private sector employees – Jamsostek, JPKM (HMOs), and CBHI
1997 Financial crisis
1998 MoH attempt to mandate HMOs fails
1999 JPS (Social Safety Net): financial assistance for the poor, ADB loan
2000 Comprehensive review of health insurance and amendment of constitution to
prescribe the rights to health care
2001 Decentralization law implemented
2001 Comprehensive review of social security system
2002 Amendment of constitution on the right to social security; President establishes
a task force on social security
2003 Parliament initiates a bill on National Social Health Insurance (June)
Task force finishes drafting bill on National Social Security including health,
occupational health, provident fund and pension, and death benefits
(December)
2004 Bill on National Social Security enacted (October 19)
2005 Preparation for extension of insurance coverage to 36.4 million poor people
2008 MoH covers 76.4 million poor and near poor through Askeskin/Jamkesmasprograms; National Social Security Council established (October 2008)
Source: Adapted from presentation at Bandung Policy Seminar, April 2007, by Prof. Hasbullah Thabrany.
Note: ADB = Asian Development Bank.

The platform for universal coverage was established in 2004 with theintroduction of a new health program for the poor, Asuransi KesehatanMasyarakat Miskin (Health Insurance for Poor Population) or Askeskin,which was designed to increase access to, and the quality of, health serv-ices for the poor. The program had two components: (i) operational fundsprovided to Puskesmas in the form of capitation payments; and (ii) a fee-for-service health insurance scheme, covering third-class hospital beds andreimbursed through P.T. Askes. The program differed from the previousprograms for the poor in two major ways: (i) rather than being a purelygovernment-run program, it provided a block grant to P.T. Askes, whichthen targeted the poor with Askeskin cards and refunded hospital claims;and (ii) the beneficiary cards in this program were individually targetedrather than household cards as in previous programs. Initially there were36.1 million target beneficiaries; however, the target was soon expanded toinclude more than 76 million individuals in 2008 under the current pro-gram called Jaminan Kesehatan Masyarakat (Health Insurance Scheme forPopulation), or Jamkesmas. The Jamkesmas program is being implementedthroughout the country and will serve as one of the key building blocks ofthe government’s proposed universal coverage scheme, which is designedto synchronize the multiple health insurance schemes.
Health financing in Indonesia is complicated by decentralizationbecause direct payments of salaries and capital costs by all levels of gov-ernment clearly impact the hospital reimbursement schedules used byinsurers. Governments’ ability to make such payments and to provideadditional coverage (see local experiments discussed in chapter 5) areheavily contingent on their fiscal capacity. Such fiscal capacity depends onboth local revenue-raising capacity and the flow of funds through theintergovernmental fiscal systems in which some funds are earmarked bycentral-level government, while others are not, and formulas used forredistributing funds from central to local governments often do notreflect local need and fiscal capacity.
Although the concept at first appears simple,2 districts are responsi-ble for implementing health services. The complexity of the flows offunds—some targeted to health, others not; some payments made throughinsurance organizations, and others made directly to public providers(hospitals, Puskesmas, and personnel)—make for an intricate, inequitable,inefficient, and fragmented set of financing flows (World Bank 2008c).Moreover, recent studies also indicate that many poor districts are receivingmuch higher levels of funding than previously, but have been unable tospend these funds because of local absorptive capacity constraints. In
Indonesia’s Health Financing System 31

other cases, despite increased district spending, little effective povertyreduction has occurred in some of the poorest districts (Fengler andHofman 2007).
Table 3.1 summarizes the major evolutionary changes in social healthinsurance starting with the introduction of health insurance for civil ser-vants in 1968.
As of mid-2009, it is difficult to get a clear picture of the extent ofcoverage. Reliable data on the numbers of people with formal healthinsurance coverage are lacking. Figure 3.2, using 2007 Survei Sosial EkonomiNasional (National Socioeconomic Survey), or Susenas, survey data, indi-cates that in 2006 only some 26 percent of the Indonesian population wascovered, largely through the Jamkesmas program for the poor.
Indonesia’s Health Insurance Providers
In general, health insurance participation remains low in Indonesia(figure 3.3a). Participation increased markedly in 2008 compared withthe early stagnant rate of about 20 percent, but current schemes stillcovered less than half the population.
Recent increases in coverage are mostly attributed to the introduc-tion of the Askeskin/Jamkesmas health insurance scheme for the poor,discussed in more detail below. The other main schemes, Askes (mostly
32 Health Financing in Indonesia
Jamsostek 2.4%
Jamkesmas 14.3%
Askes 6.0%other 3.9%
not insured 73.9%
Figure 3.2 Insurance Coverage Status of the Indonesian Population
Source: Susenas 2007.

a. Participation over Time
5.0 5.4 6.0
6.0 5.7
8.3
15.0 14.40.5
2.5
8.6 8.5
0.8 2.6
3.5 3.9 3.5
3.4 2.9
0.7
0.7 1.0
2.4
per
cen
t
per
cen
t
0
5
10
15
20
25
30
b. Participation by Quintile
3.38.0
16.6
25.619.5 13.9
9.2
3.51.6 3.2
3.1
8.3
1.40.4
6.00.7
0.20.7
0.91.5
1.1
1.2
1.01.1
1.0
0
5
10
15
20
25
30
35
40
2003 2004 2005 2006 2007 poorest 2 3 4 richestquintile
2.7 2.7
Askes health card Jamsostekself-insured or other JPKM
Askes health card Jamsostekself-insured or other JPKM
Figure 3.3 Insurance Participation
Sources: a. Susenas 2003–07; b. Susenas, 2007.
33

civil servants) and Jamsostek (mostly formal sector workers), only coverabout 6.0 and 2.0 percent of the population, respectively, while privateinsurance companies and other schemes cover another 3 percent.3
Coverage by these programs has not changed much over the pastdecades. Community health insurance schemes are so small they can-not be included as a separate category in figure 3.3b. Analyzing partic-ipation by income quintile, it becomes clear that the poor are the mainbeneficiaries of the Askeskin and Jamkesmas systems, while individualsin richer quintiles are mostly covered by the civil service (includingmilitary) schemes or by Jamsostek.
The government estimated that, in 2008, formal health insurance cov-ered approximately 48 percent of the population, largely by the expan-sion of Jamkesmas from 36 million people to 76.4 million (figure 3.4).4
The bulk of those covered would be the poor and near poor throughJamkesmas and civil servants through P.T. Askes. While Jamsostek currentlycovers about 4.1 million workers and dependents or some 2 percent of thepopulation, recent ILO and ADB studies suggest that if the entire fullyemployed workforce and dependents were covered, Jamsostek coveragecould increase to 40–50 percent of the population. Jamsostek’s low cover-age rate is a result of firm-size limitations (only firms with 10 or moreemployees are required to participate) as well as an opt-out provision forfirms self-insuring or providing PVHI. Indonesia also faces the classic prob-lem of enrolling its more than 60 million informal sector workers in itsextant schemes as well as under its planned universal coverage (ILO 2003;ADB 2007).5
Table 3.2 describes in detail the three major health financing programs—Askes, Jamsostek, and Askeskin/Jamkesmas—including their eligibilityrequirements, benefits, financing, and provider payment arrangements.Indonesia confronts many of the same problems faced by other developingcountries attempting to move to universal coverage, as it begins to expandand consolidate a set of fragmented health financing programs, establish astandard package of benefits, impose unified and pay-for-performanceprovider payment mechanisms, and establish a “level playing field” forthe participation of both public and private sector providers. Each ofthese areas is discussed in turn.
Eligibility CriteriaEach of the three major health financing programs has a particular con-stituency and its own set of eligibility criteria. Civil servants and theirdependents are covered under the Askes program, which is admin istered
34 Health Financing in Indonesia
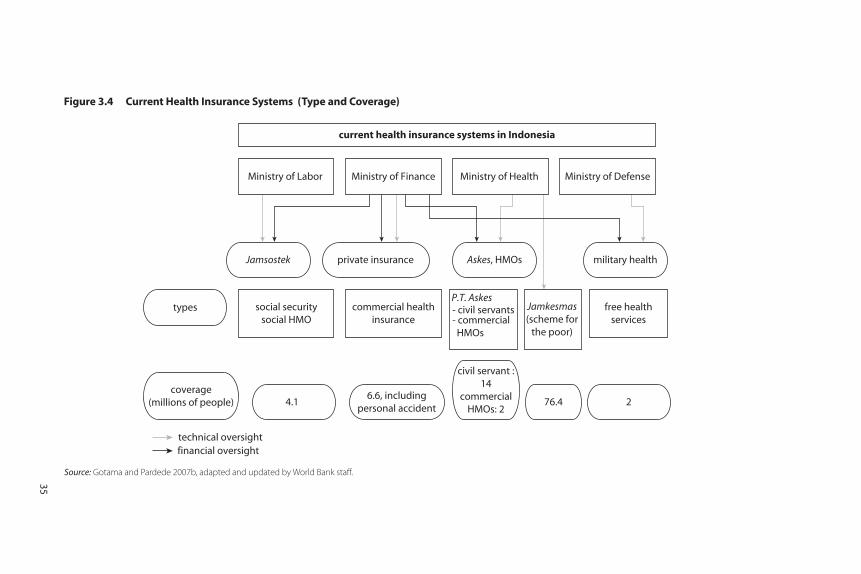
current health insurance systems in Indonesia
Ministry of Labor Ministry of Finance Ministry of Health Ministry of Defense
Jamsostek private insurance Askes, HMOs military health
types social securitysocial HMO
commercial healthinsurance
P.T. Askes- civil servants- commercial HMOs
Jamkesmas(scheme for
the poor)
free healthservices
coverage(millions of people) 4.1
6.6, includingpersonal accident
civil servant :14
commercialHMOs: 2
76.4 2
technical oversight financial oversight
Figure 3.4 Current Health Insurance Systems (Type and Coverage)
Source: Gotama and Pardede 2007b, adapted and updated by World Bank staff.
35

Table 3.2 Comparisons of Features of Health Financing Programs
Characteristics Askes Jamsostek
Private health insurance and
self-insured JPKMCommunity
basedAskeskin/
Jamkesmas
1. Scheme nature1.1 Participation Compulsory Compulsory,
opt-out option
for employers
that could provide
better benefit
plans
Fringe benefit Voluntary Voluntary Social insurance
1.2 Model Social health
insurance
Social health
insurance
Private voluntary
health insurance
or self insurance
Managed-care
model
Various
community-
based health
insurance
schemes
Closest to social
health insurance
1.3 Covered population
Active civil
servants and their
dependents
(spouse and up
to the third child),
civil service
retirees, and military
Private formal
sector employees
and their
dependents and
provision for
informal workers
(latter was never
implemented)
Private formal
employees
and their
dependents
Informal sector,
civil servants, and
military for their
uncovered
dependents
Informal sector Identified poor
and near poor,
based on
individual and
household
targeting
1.4 Coverage 14 million (Askes)
(Susenas: 14
million – 2007)
4.1 million
(Jamsostek 2009)
6.6 million
(Susenas 2006)
540,000 Estimated
440,000
(Susenas 2006)
76.4 million
36

37
2. Benefit package
2.1 Ambulatory services
Public only Public and
private, or
private only
Private; in some
areas where
private not
available, public
Mostly public, in
few cases
private
Public only Public
2.2 Inpatient services Public only Public and private
contracted, or
private only
Private; public in
some areas
where private
not available
Mostly public Usually not
covered; public
only
Public, and also
private facilities
2.3 Choice of provider
Limited to public
provider, registration
required
Registration
required
Free, or
registration
required
Registration
required
Registration
required
Registration
required
2.4 Conditions included
Comprehensive
package
Comprehensive
package
Comprehensive
package
Comprehensive
package
Limited package,
inpatient not
included in the
benefit
Comprehensive
package
2.5 Conditions excluded
None Conditions: health
conditions directly
caused by natural
disaster,
self-inflicted, and
extreme sports
Vary by plan Vary by plan Specialist
ambulatory
and inpatient
services
None
2.6 Maternity benefits
Yes, packaged
payment for
normal delivery
Yes, packaged
payment for
normal delivery
Yes Yes Yes, for the
maternity
scheme
Yes
(continued)

38
2.7 Annual physicalcheck-ups
Yes Yes Yes No No No
2.8 Prevention and health promotion
Yes Yes Yes Yes Yes Yes
2.9 Services not covered
Cosmetic surgery,
physical check-ups,
alternative
medicine, dental
prostheses,
fertility treatment,
nonbasic
immunization
General check-up,
cancer treatment,
heart surgery, renal
dialysis, and
lifelong treatment
for congenital
diseases,
prostheses,
nonbasic
immunization,
transplantation,
fertility treatment
Vary by plan Cosmetic surgery,
physical check-
ups, alternative
medicine, dental
prostheses,
fertility
treatment
Specialist and
inpatient
services
Cosmetic surgery,
physical
check-ups,
alternative
medicine, dental
prostheses,
fertility
treatment
3. Financing3.1 Source of funds Member
contribution 2%
basic salary +
government 2%
basic salary; no limit
Single: 3% basic
salary; members
with dependents:
6% salary; limit to
Rp 1 million
(US$110)
Payroll, vary by
plan
Premium, vary by
plan
Member
contribution
Tax-based.
“Premium”
Rp 6,000/capita
Table 3.2 Comparisons of Features of Health Financing Programs (Continued)
Characteristics Askes Jamsostek
Private health insurance and
self-insured JPKMCommunity
basedAskeskin/
Jamkesmas

3.2 Financing body Ministry of Finance Employers (100%) Individuals and
companies
Badan Pelaksana(Bapel; Executing
agencies – HMO
type)
Individual Ministry of
Finance
3.3 Payment mechanism
Primary care:
capitation
Secondary: fee
schedule
Primary care:
capitation
Secondary:
capitation and
fee schedule
Varies by plan
Primary: fee for
service,
capitation,
Secondary: fee for
service
Primary care:
capitation
Secondary: fee
schedule
Primary care:
reimbursement
Primary care:
capitation
Secondary:
negotiated fee
with limit
3.4 Cost sharing Yes, if members want
to upgrade class or
branded drugs out
of formulary
None Varies by plan Yes None None
4. Management4.1 Financial
management; Carrier
P.T. Askes, a
state-owned
company
P.T. Jamsostek, a
state-owned
company
Various private
health insurance
companies
Badan Pelaksana(Bapel or
executing
agencies)
Cooperation,
community
organizations
Currently
government
4.2 Status For profit For profit For profit Not for profit Not for profit Government
Sources: Gotama and Pardede 2007a; Jamsostek 2008; MoH 2009; PT ASKES 2004, 2006; Susenas various years; Thabrany 2003; Thabrany et al. 2003.
39

by a for-profit state enterprise, P.T. Askes. Askeskin/Jamkesmas was orig-inally designed to cover the poor but was expanded to cover the nearpoor. It was originally administered by P.T. Askes but in 2008 the MoHtook over most of the major administrative functions, including providerpayment. Jamsostek is similar to a classic social insurance program for pri-vate sector employees in firms with 10 or more employees and is alsoadministered by a for-profit state enterprise. Employers can opt out,either by self-insuring or by purchasing private insurance for theiremployees. Both P.T. Askes and Jamsostek also sell private commercialpolicies. Two key problem areas that result from these arrangements isthat the Jamsostek opt-out and firm-size restrictions result in only about15 percent of formal sector workers being covered; and although informalsector workers have the right to purchase insurance, few do; thus,Indonesia’s informal sector is largely uncovered.
Basic Benefits PackagesThe BBPs across the three programs, while extensive, vary somewhat.Jamsostek does not cover certain high-cost treatments. There are some dif-ferences in drug benefits (for example, different formularies, genericrequirements under Jamkesmas) and differences in whether services canbe obtained from largely public (Askes and Askeskin/Jamkesmas) versusprivate providers (Jamsostek).
Financing ArrangementsRevenue generation efforts differ significantly across programs.Jamsostek is funded by a 3 percent (6 percent for families) payroll con-tribution (up to a Rp 1 million [US$110] per month ceiling) paid bythe employer. Askes is funded by a 2 percent premium paid by govern-ment employees and matched by a 2 percent payment by the govern-ment. Askeskin/Jamkesmas is funded through general revenues. Thesearrangements on the revenue side coupled with benefit package differ-ences (including restrictions on the use of private providers underAskes and Askeskin/Jamkesmas) have resulted in significant differencesin expenditures under the different programs, including significantout-of-pocket (OOP) costs for Jamsostek and Askes (estimated at 40percent) program beneficiaries. Continuing large OOP payments sug-gest that the level of financial protection provided by those insurancefunds may be limited.
40 Health Financing in Indonesia

Provider Payment and Contracting MechanismsAs with revenue raising, provider payment and contracting mechanismsvary among insurers and medical care providers. Jamsostek has contractswith public and private providers; it reimburses for primary care on a cap-itation basis and for inpatient care using capitation and fee-for-service.Askes uses a capitation mechanism for primary care and fee schedulesfor inpatient care. Askeskin/Jamkesmas provides capitation payments toPuskesmas based on the number of poor in the catchment area for pri-mary care, and pays public hospitals on a fee-for-service basis. Whilevarious aspects of the American managed care model have beenadopted in principle, payment methods used by the different programsdo not embody the efficiency and quality incentives inherent in mod-ern pay-for-performance systems increasingly being used globally.
Private voluntary health insurance (PVHI) is not well developed inIndonesia. There are 64 commercial insurance companies selling insur-ance policies covering about 4–5 million people with an average of fewerthan 100,000 members per insurer. The role of PVHI in a universalmandatory public system is an area in which the government needs tomake some important policy decisions, for example, whether PVHI canfill in the cost sharing in the public programs. Health insurance regulationis, therefore, an area needing careful examination and coordination dur-ing the transition to universal coverage (Mukti and Riyarto 2008).
An ADB study (2007) further highlights some fundamental spendingdifferences between Askes, Askeskin/Jamkesmas, and commerciallyinsured individuals. The current Askes health program covers catastrophichealth expenditures, but many program participants go outside the pro-gram, particularly for outpatient medical care. Table 3.3 shows the break-down of claims costs between primary, secondary, and hospital care forcivil servants, the poor, and members of commercial funds. Expenses forcivil servants for primary health care are a far smaller percentage of civilservants’ total health care services than for the commercially insured orthe poor. This shows the extent to which civil servants are going outsidethe program for primary health care.
Not surprisingly, hospital care accounts for a higher percentage of thepoor’s total spending on health than it does for the other two groups, andsecondary care accounts for a lower percentage. Indonesia has lower ratiosof doctors to population in rural and remote areas, so the poor must relyon hospitals for services that might otherwise be provided by general prac-titioners in urban areas (Wiener 2007). As Indonesia moves to universal
Indonesia’s Health Financing System 41

coverage, it will need to better understand these differences and makedecisions on key insurance parameters such as the BBPs, cost sharing,choice of providers, and pharmaceutical policies if it decides to move to astandard set of benefits for the whole population.
Indonesia’s Health Spending Trends
Indonesia’s health spending levels and trends are contained inIndonesia’s National Health Accounts (NHA; WHO 2008b). Figures 3.5and 3.6 show the flow of funds from public and private financing agents,respectively, to financing sources to service providers. The fragmentationand complexity of Indonesia’s health financing system is again apparent.Table 3.4 displays the trends in Indonesia’s nominal and real total, public,and private health spending based on WHO’s NHA database from 1996through 2006.
The overall trends show an increase in health expenditure as a percent-age of GDP from 1.9 percent in 1996 to 2.2 percent in 2006. The public
42 Health Financing in Indonesia
Table 3.3 Covered Health Care Expenditures
Service level and beneficiary groupAmount
(millions of rupiah) Percentage
Primary health care serviceCivil servants 92,431 4.85
Commercial 79,851 23.19
Poor 798,323 23.96
Total 970,605 17.39
Secondary health care serviceCivil servants 781,576 41.02
Commercial 93,240 27.08
Poor 395,623 11.88
Total 1,270,439 22.76
Hospital care serviceCivil servants 1,031,420 54.13
Commercial 171,239 49.73
Poor 2,137,331 64.16
Total 3,339,990 59.85
Total health care serviceCivil servants 1,905,427
Commercial 344,330
Poor 3,331,277
Total 5,581,034
Source: Adapted from Wiener (2007).

agents docs/source funds providers
cen
tral
reg
ion
alp
rovi
nci
alsu
b-
dis
tric
tlo
cal
dis
tric
t
other ministries ordepartments (incl.
BKKBN)
MoF
MoH
budget
other dinas
BKKBN
PHO
other dinas
DHO
UPT (vert)
MoH
BKKBN
other departments
APBD II
APBD I
APBPD
APBPP
DIPDA/DIKDA
PAD
DIPDA/DIKDA
state budget (APBN)
PAD
other dinas
UPT vert
RSUD
dinkes (PHO)
other dinas
UPT
RSUD
DHO
puskesmaspolindes
village midwife
DAU/DBH/DAK
DAU
or DBH
ministryfund
balancing fund
disaster (062)
other expenditure (069)
Figure 3.5 Public Flows of Funds
Source: MoH, CHR-UI, and WHO 2008.
Note: BKKBN: National Family Planning Agency (Badan Koordinator Keluarga Berencana Nasional), Mof: Ministry of Finance; APBN: State budget (Anggaran Pendapatan dan Belanja Negara);
APBD: Regional government budget (Anggaran Pendapatan dan Belanja Daerah); APBPP: State budget for central government (Anggaran Pendapatan dan Belanja Pemerintah Pusat); APBPD:
State budget for sub-national level (Anggaran Pendapatan dan Belanja Pemerintah Daerah); UPT (vert): Vertical technical service unit (Unit Pelaksana Teknis); PHO: Provincial Health Office
(Dinas Kesehatan Tingkat Propinsi); DAU: General allocation fund (Dana Alokasi Umum); DAK: Special allocation fund (Dana Alokasi Khusus); DBH: Grant allocation fund (Dana Bantuan Hibah);
DIPDA: Local development budget (Daftar Isian Khusus Daerah); DIKDA: Local routine budget (Daftar Isian Kegiatan Daerah); PAD: Local-owned revenue (Pendapatan Asli Daerah); RSUD:
Province or district general hospital (Rumah Sakit Umum Daerah); DHO: District Health Office (Dinas Kesehatan Tingkat Kabupaten/Kota); Dinas: Provincial subproject management;
Puskesmas: Health center at subdistrict (Pusat Kesehatan Masyarakat); Polindes: Village maternity clinics (Poli Bersalin Desa)
43

share increased significantly from 42 percent in 1996 to 50 percent in2006. Government health expenditures as a share of the budget increasedfrom 4.3 percent to 5.3 percent, while household OOP spending decreasedonly slightly from 36 percent of all spending (62 percent of 58 percent ofoverall private spending) in 1996 to 33 percent (66 percent of 50 per-cent) in 2006. In exchange rate–based U.S. dollars, health spending percapita increased from US$20 in 1996 to US$34 in 2006 and in interna-tional dollars from US$55 to US$87. Time series trends are analyzed infurther detail, in both real and nominal terms, below.
Total, public, total private, and OOP private health spending allincreased during the 11-year period 1996–2006. Total health expendi-ture increased almost sevenfold, from under Rp 10 trillion in 1996 tojust over Rp 70 trillion in 2006 (figure 3.7). Private health expenditureremained greater than public health expenditure during the period,until 2006 when public health spending marginally surpassed privatehealth expenditure. OOP payments remained on a par with publichealth expenditure up to 2004. In the subsequent two years, however,public health expenditure increased by 85 percent, far higher than theincrease in OOP spending.
Increased public expenditure on health since 2004 has changed thepublic, total private, and OOP private shares in total health spendingin Indonesia. From 1996 through 2004, private health expenditure was
44 Health Financing in Indonesia
private facilities• hospital• clinics• general practices• pharmacyother donors or
agencies
government
• health center• hospital
health office• province• district
philanthropic or NGO,(national, international)
APBD
OOP pad(local
revenue)
off budgetOOP
company• private company• state-owned company
community or familyor individual
social insurance orJPKM or healthfinancing institutionsfor health fund orhealth insurance
Figure 3.6 Private Flows of Funds
Source: MoH, CHR-UI, and WHO 2008.
Note: APBD: Regional government budget (Anggaran Pendapatan dan Belanja Daerah); OOP: Out of pocket;
PAD: Local-owned revenue (Pendapatan Asli Daerah).

Table 3.4 Health Spending (1996–2006)
Selected ratio indicators 1996 1997 1998 1999 2000 2001 2002 2003 2004 2005 2006
1. Expenditure ratios
Total expenditure on health (THE)
as % of GDP 1.9 1.8 2.0 2.1 1.7 1.8 1.8 2.2 2.1 2.1 2.2
Financing agents measurementGeneral government expenditure
on health (GGHE) as % of THE 41.9 40.7 40.6 42.0 38.5 42.2 41.2 42.0 40.1 46.7 50.4
Private sector expenditure on
health (PvtHE) as % of THE 58.1 59.3 59.4 58.0 61.5 57.8 58.8 58.0 59.9 53.3 49.6
GGHE as % of GGE 4.3 3.3 3.4 3.7 3.8 3.6 4.2 4.8 4.5 5.1 5.3
Social security funds as % of GGHE 9.3 11.9 8.3 6.7 7.4 10.5 3.4 4.8 4.8 20.7 20.0
Private households OOP payments
as % of PvtHE 62.0 62.2 63.4 60.6 63.3 66.1 65.8 69.7 69.2 66.4 66.3
Prepaid and risk-pooling plans as
% of PvtHE 7.6 7.7 7.8 8.5 8.4 7.1 9.2 9.1 8.7 9.7 9.7
Financing sources measurement
External resources on health as %
of THE 1.4 5.2 11.5 11.6 10.8 4.4 3.3 3.5 3.0 4.6 2.3
2. Selected per capita indicators
Total expenditure on health per
capita at exchange rate 20 18 8 13 12 13 16 24 24 26 34
Total expenditure on health per
capita at international dollar rate 55 56 52 55 48 52 56 73 74 78 87
GGHE per capita at exchange rate 8 7 3 5 5 6 7 10 10 12 17
GGHE per capita at international
dollar rate 23 23 21 23 19 22 23 31 30 36 44
Source: WHO National Health Accounts database, September 2008.
45

the largest share of total health spending and averaged 58 percent overthis period (figure 3.8). However, by 2006, public and private sharesof total health expenditure had equalized at 50 percent. Trends in theshare of total health expenditure composed of OOP private paymentsclosely followed trends in the public share of total health expenditureuntil 2004, after which the share of OOP spending dropped relative topublic and private shares of total health expenditure, falling to 33 percentin 2006.
Total health spending averaged 2 percent of GDP over the 11-yearperiod 1996–2006 and reached a high of 2.2 percent in 2003 and2006 (figure 3.9). The share of total health spending in GDP fell by0.4 percentage points from 1999 to 2000, and averaged only 1.8 percentof GDP over the period 2000–02, increasing again in 2003 to 2.2 percent. Calculating the nominal elasticity of health spending relativeto GDP for this period shows that total health spending increased 5 percent per year faster than GDP (nominal elasticity of 1.05), pub-lic spending on health increased 11 percent faster (nominal elasticityof 1.11), and private health spending increased at the same rate asGDP (nominal elasticity of 1.0).
Per capita total, public, total private, and OOP private health expendi-ture all fell in 1998, reflecting the economic and financial crisis that
46 Health Financing in Indonesia
0
10
20
30
40
50
60
70
80
1996 1997 1998 1999 2000 2001 2002 2003 2004 2005 2006year
hea
lth
exp
end
itu
re (t
rilli
on
rup
iah
)
total expenditure on health
general government expenditure on health
private health expenditure
out-of-pocket spending
Figure 3.7 Trends in Nominal Health Spending (1996–2006)
Source: WHO National Health Accounts database, September 2008.

engulfed the country in 1997 (figure 3.10). The decrease in total percapita health expenditure was dramatic, falling from US$18 in 1997 toUS$8 in 1998. Although this figure rose again in 1999 to US$13, it didnot surpass its precrisis level until 2003 when total health expenditureper capita reached US$24. The trends for total, public, total private, and
Indonesia’s Health Financing System 47
0
0.5
1.0
1.5
2.0
2.5
% G
DP
1996 1997 1998 1999 2000 2001 2002 2003 2004 2005 2006year
publictotal total private out-of-pocket private
Figure 3.9 Spending Components as Share of GDP (1996–2006)
Source: WHO National Health Accounts database, September 2008.
0
10
20
30
40
50
60
70
shar
e o
f to
tal h
ealt
h e
xpen
dit
ure
(%)
1996 1997 1998 1999 2000 2001 2002 2003 2004 2005 2006year
public private out-of-pocket private
Figure 3.8 Public, Total Private, and OOP Private Shares of Total Health Spending(1996–2006)
Source: WHO National Health Accounts database, September 2008.

OOP private spending are similar over the period until 2004, whengovernment spending accelerated. Total health spending per capita ininternational dollars also fell in response to the financial crisis, fromUS$56 in 1997 to US$52 in 1998, but rose again in 1999 to US$55 andreached a high of US$87 in 2006 (figure 3.11). Again, the trends aresimilar for the different components until 2005 and 2006.
In contrast to nominal total health expenditure, real total healthexpenditure did not rise consistently during the period 1996–2006(figure 3.12). Significant increases occurred only after 2002, indicatingthat much of the rise in nominal health expenditures was mainly dueto price increases. This is confirmed by the steady increase of the GDPdeflator over the same period (figure 3.13).
Overall, these trends show that private health expenditure has, histor-ically, played a more important role than public health spending in over-all health financing in Indonesia. However, this trend started to change inthe period 2005–06, and it is expected that public health expenditurewill have an increasingly important role to play in subsequent years giventhe government’s plan to extend universal health care coverage to theentire Indonesian population through a mandatory public health insur-ance program. The establishment of Askeskin in 2004 had an impacton both total health spending and the public share of spending. OOPpayments still constitute a sizeable share of health spending, however,and the challenge for the government is to channel these expenditures
48 Health Financing in Indonesia
0
5
10
15
20
25
30
35
40
exp
end
itu
re p
er c
apit
a (U
S$)
1996 1997 1998 1999 2000 2001 2002 2003 2004 2005 2006year
publictotal total private out-of-pocket private
Figure 3.10 Health Spending per Capita in Exchange Rate–Based US$ (1996–2006)
Source: WHO National Health Accounts database, September 2008.

into risk-pooling mechanisms to effectively provide protection againstcatastrophic health spending.
Another critical area of expenditure performance is pharmaceuticals,which account for over one-third of all health spending (Hawkins2008). The pharmaceutical market was valued at about US$2.7 billion
Indonesia’s Health Financing System 49
0
20
40
60
80
100
hea
lth
exp
end
itu
re p
er c
apit
a (in
tern
atio
nal
$)
1996 1997 1998 1999 2000 2001 2002 2003 2004 2005 2006year
publictotal total private out-of-pocket private
Figure 3.11 Health Spending per Capita in International Dollars (1996–2006)
Source: WHO National Health Accounts database, September 2008.
0
10
20
30
40
50
hea
lth
exp
end
itu
re (m
illio
n ru
pia
h)
1996 1997 1998 1999 2000 2001 2002 2003 2004 2005 2006year
publictotal total private out-of-pocket private
Figure 3.12 Real Health Spending (1996–2006)
Source: WHO National Health Accounts database, September 2008.
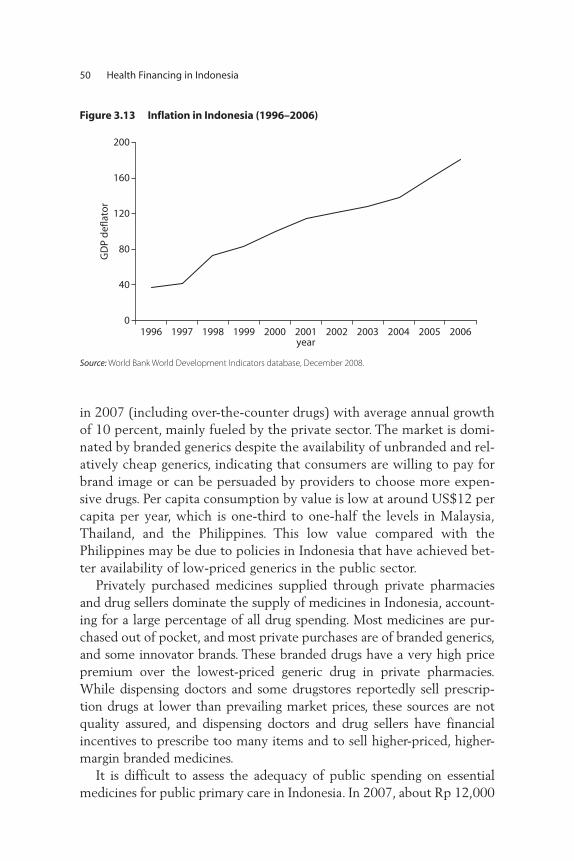
in 2007 (including over-the-counter drugs) with average annual growthof 10 percent, mainly fueled by the private sector. The market is domi-nated by branded generics despite the availability of unbranded and rel-atively cheap generics, indicating that consumers are willing to pay forbrand image or can be persuaded by providers to choose more expen-sive drugs. Per capita consumption by value is low at around US$12 percapita per year, which is one-third to one-half the levels in Malaysia,Thailand, and the Philippines. This low value compared with thePhilippines may be due to policies in Indonesia that have achieved bet-ter availability of low-priced generics in the public sector.
Privately purchased medicines supplied through private pharmaciesand drug sellers dominate the supply of medicines in Indonesia, account-ing for a large percentage of all drug spending. Most medicines are pur-chased out of pocket, and most private purchases are of branded generics,and some innovator brands. These branded drugs have a very high pricepremium over the lowest-priced generic drug in private pharmacies.While dispensing doctors and some drugstores reportedly sell prescrip-tion drugs at lower than prevailing market prices, these sources are notquality assured, and dispensing doctors and drug sellers have financialincentives to prescribe too many items and to sell higher-priced, higher-margin branded medicines.
It is difficult to assess the adequacy of public spending on essentialmedicines for public primary care in Indonesia. In 2007, about Rp 12,000
50 Health Financing in Indonesia
0
40
80
120
160
200
GD
P d
efla
tor
1996 1997 1998 1999 2000 2001 2002 2003 2004 2005 2006year
Figure 3.13 Inflation in Indonesia (1996–2006)
Source: World Bank World Development Indicators database, December 2008.

(approximately US$1.32) per capita was spent from all public sourceson essential drug list (EDL) drugs for primary care. Almost half of thiscame from the central government budget. District spending varieswidely. For budget allocation purposes, the MoH advocates that pri-mary care essential medicine spending should be based on the WHOindicative target of US$2 per capita per year. The appropriate figure forIndonesia could, however, be higher or lower and will differ among dis-tricts because of differences between the EDL and prices assumed byWHO, differences in local morbidity, differences in doctors’ prescribingpractices compared with recommended guidelines, and differences inthe share of patients who obtain primary health care from the privatesector or self-medicate.
The rapid escalation of public spending on hospital drugs under theAskeskin program since 2006–07 is widely acknowledged to have beendriven substantially by poor control of membership, lack of control ofoutside-formulary prescribing, and lack of fraud control. The 40–45percent share of Askeskin expenditure on medicines is not necessarilyinappropriate. A relatively high share is to be expected, given that salaryand capital costs are largely financed from supply-side budget spending.A rising share of spending on medicines has been experienced in the earlyyears of health insurance schemes for the poor in other countries (asinsurees and providers become more familiar with the benefits package).As a result, it is too soon to assess the impact of the more stringent con-trol measures put in place in the 2008 guidelines for Jamkesmas.
Notes
1. Staats Regeling 1/1934 governed the insurance scheme and specified thatparticipation was limited to public servants holding European status orequivalent.
2. There are three main funding sources from the central level to the district,two of which involve direct funding of the district (DAU and DAK), and oneindirect via the provincial level (Dekon). In addition, the district has its ownfunding, the PAD (locally generated revenues).
3. There are some inconsistencies in the Jamsostek data as reported by differentsources. For example, ADB reports 1.3 percent of the population covered(circa 2005), which is consistent with the ILO’s (circa 2000) figure of 1.4percent and similar to Jamsostek’s 2009 figure of 1.7 percent (4.1 millionpeople), while Susenas reports 2.4 percent (circa 2007). Some of the differ-ences may be due to the different years reported. While these are significantdifferences in percentage terms for Jamsostek’s gross coverage numbers, the
Indonesia’s Health Financing System 51

key issue is that very small percentages of the Indonesian workforce (of some105 million) and population (225 plus million) are covered through thecurrent social health insurance system for formal sector workers. These dis-crepancies highlight the need for much better information for decisionmaking, which is discussed in chapters 5 and 7.
4. At the time of writing, no household data were available to verify coverage.
5. The Jamsostek law envisioned inclusion of informal workers, but the provisionwas never implemented.
52 Health Financing in Indonesia

53
This chapter provides an assessment of the performance of the Indonesianhealth financing system. Performance is generally assessed against themajor goals of health policy: (i) maximizing health outcomes and respon-siveness to consumers; (ii) minimizing costs subject to the attainment ofthese outcomes, or using the optimal mix of inputs to achieve these out-comes; and (iii) pursuing equity in both financial protection against unpre-dictable, catastrophic medical care costs and access to health services.1 Thethree major functions of health financing—revenue raising, pooling, andpurchasing—have implications for each of these three goals. This chapterthus examines how the health financing system has helped or impeded theachievement of these three major goals.
Much of the analysis in this section consists of comparisons betweenthe average level of key health indicators in Indonesia and the averagelevel of these indicators in comparator countries. Indonesia is a lower-middle-income country with relatively good economic growth prospects.Its neighbors include Malaysia, the Philippines, Thailand, and Vietnam, alllower-middle- or upper-middle-income countries that have experiencedrapid economic growth in recent years. It is therefore appropriate tobenchmark Indonesia’s performance against that of comparable middle-income countries. Global regression lines are used to establish an expected
C H A P T E R 4
Assessment of Health FinancingPerformance

level for a health system indicator given the level of one or more of itsapparent determinants, such as health spending or income per capita. Theregression lines fitted to the international data simply reflect the averagebehavior of outcome variables for comparable countries; they do not indi-cate the correct or desirable level of the outcome variables.
Health Outcomes
Indonesia has experienced a doubling of life expectancy from 34 years in the1940s to almost 69 in 2006. On average, life expectancy in Indonesia hasbeen growing at a relatively high rate of 1.05 percent per year over the past66 years, higher than the rates of growth of life expectancy in Sri Lanka andThailand. In 2006, however, Indonesia’s life expectancy of 68.2 years waslower than that in comparator countries (except for India). Figure 4.1 plotslife expectancy over the period 1960–2006 for China, India, Indonesia, SriLanka, Thailand, and Vietnam. Indonesia’s life expectancy grew faster thanthat of most of its comparators, except for Vietnam, until about the mid-1980s when the rate of improvement in the indicator slowed.
Income tends to be a strong predictor of population health out-comes, and one way to assess country performance is to examine lifeexpectancy relative to income. Figure 4.1 shows life expectancy ratesamong comparators but does not recognize the fact that the six coun-
54 Health Financing in Indonesia
IndonesiaChina
Thailand
VietnamIndia
Sri Lanka
40
50
60
70
80
life
exp
ecta
ncy
(yea
rs)
1955 1960 1965 1970 1975 1980 1985 1990 1995 2000 2005 2010year
Figure 4.1 Life Expectancy in Selected Comparators (1960–2006)
Source: WDI.
Note: y-axis log scale.
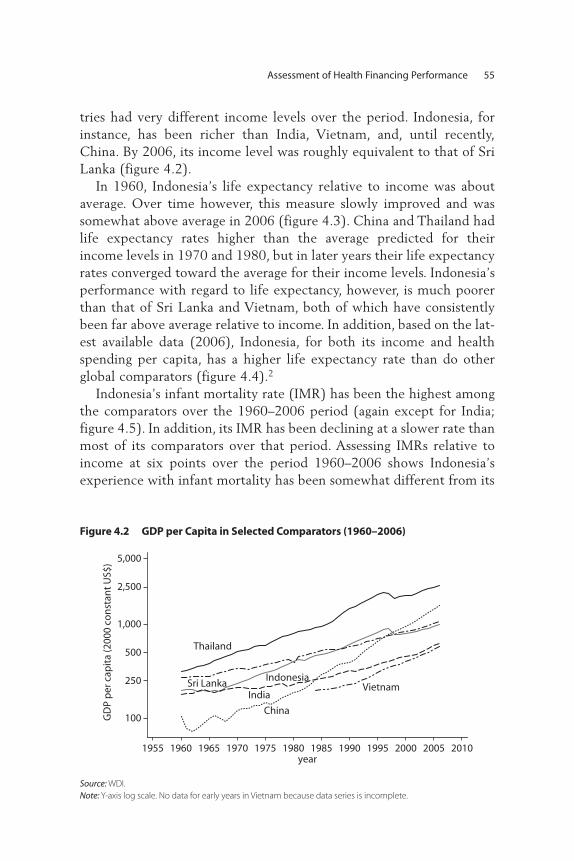
tries had very different income levels over the period. Indonesia, forinstance, has been richer than India, Vietnam, and, until recently,China. By 2006, its income level was roughly equivalent to that of SriLanka (figure 4.2).
In 1960, Indonesia’s life expectancy relative to income was aboutaverage. Over time however, this measure slowly improved and wassomewhat above average in 2006 (figure 4.3). China and Thailand hadlife expectancy rates higher than the average predicted for theirincome levels in 1970 and 1980, but in later years their life expectancyrates converged toward the average for their income levels. Indonesia’sperformance with regard to life expectancy, however, is much poorerthan that of Sri Lanka and Vietnam, both of which have consistentlybeen far above average relative to income. In addition, based on the lat-est available data (2006), Indonesia, for both its income and healthspending per capita, has a higher life expectancy rate than do otherglobal comparators (figure 4.4).2
Indonesia’s infant mortality rate (IMR) has been the highest amongthe comparators over the 1960–2006 period (again except for India;figure 4.5). In addition, its IMR has been declining at a slower rate thanmost of its comparators over that period. Assessing IMRs relative toincome at six points over the period 1960–2006 shows Indonesia’sexperience with infant mortality has been somewhat different from its
Assessment of Health Financing Performance 55
IndonesiaSri Lanka
Thailand
India
China
Vietnam
100
250
500
1,000
2,500
5,000
GD
P p
er c
apit
a (2
000
con
stan
t U
S$)
1955 1960 1965 1970 1975 1980 1985 1990 1995 2000 2005 2010year
Figure 4.2 GDP per Capita in Selected Comparators (1960–2006)
Source: WDI.
Note: Y-axis log scale. No data for early years in Vietnam because data series is incomplete.

China
Indonesia
Sri Lanka
Thailand
30
40
50
60
70
80lif
e ex
pec
tan
cy (y
ears
)
30
40
50
60
70
80
life
exp
ecta
ncy
(yea
rs)
30
40
50
60
70
80
life
exp
ecta
ncy
(yea
rs)
30
40
50
60
70
80lif
e ex
pec
tan
cy (y
ears
)
30
40
50
60
70
80
life
exp
ecta
ncy
(yea
rs)
30
40
50
60
70
80
life
exp
ecta
ncy
(yea
rs)
250 1,000 10,000 50,000GDP per capita (constant US$)
250 1,000 10,000 50,000GDP per capita (constant US$)
250 1,000 10,000 50,000GDP per capita (constant US$)
250 1,000 10,000 50,000GDP per capita (constant US$)
250 1,000 10,000 50,000GDP per capita (constant US$)
250 1,000 10,000 50,000GDP per capita (constant US$)
1960
China
Indonesia
India
Sri Lanka
Thailand
1970
China
IndonesiaIndia
Sri Lanka
Thailand
1980
China
IndonesiaIndia
Sri Lanka
Thailand
1990
China
IndonesiaIndia
Sri Lanka
ThailandVietnam
2000
China
IndonesiaIndia
Sri Lanka
ThailandVietnam
2006
India
Vietnam
Figure 4.3 Life Expectancy versus Income (1960–2006)
Source: WDI.
Note: Both axes log scale.
56

experience with life expectancy rates (figure 4.6). With the exceptionof 1990, Indonesia’s IMR has been better than would be expected rela-tive to its income level; the rate has not been falling as quickly as it hasin Sri Lanka, Thailand, and Vietnam. Controlling for both income andhealth spending, Indonesia’s IMR is slightly better than that of its globalincome comparators but significantly better for its level of healthspending (figure 4.7). This is not surprising given that Indonesia’s healthspending is low for its income level.
Assessment of Health Financing Performance 57
ChinaIndonesia
CambodiaLao PDR
Malaysia
Philippines
Thailand
Vietnam
Samoa
below average above average
bel
ow
ave
rag
eab
ove
ave
rag
e
life
exp
ecta
ncy
rela
tive
to
inco
me
life expectancy relative to health spending per capita
Figure 4.4 Global Comparisons of Life Expectancy versus Income and Health Spending
Source: WDI; WHO NHA database http://www.who.int/nha/country/idn/en/.
Indonesia
China
Sri Lanka
Vietnam
Thailand
India
5
25
100
250
infa
nt
mo
rtal
ity
(per
1,0
00 li
ve b
irth
s)
1955 1960 1965 1970 1975 1980 1985 1990 1995 2000 2005 2010year
Figure 4.5 Infant Mortality Rates in Selected Comparators (1960–2006)
Source: WDI.
Note: Y-axis log scale. Early data for China not available because of incomplete data series.

IndonesiaIndia
Sri LankaThailand
infa
nt
mo
rtal
ity
(per
1,0
00liv
e b
irth
s)
250 1,000 10,000 50,000
1960
China
IndonesiaIndia
Sri LankaThailand
5
25
100
250
infa
nt
mo
rtal
ity
(per
1,0
00liv
e b
irth
s)
5
25
100
250
1970
ChinaIndonesia
India
Sri LankaThailand
1980
ChinaIndonesia
India
Sri Lanka Thailand
Vietnam
GDP per capita (constant US$)
250 1,000 10,000 50,000GDP per capita (constant US$)
infa
nt
mo
rtal
ity
(per
1,0
00liv
e b
irth
s)
250 1,000 10,000 50,000
5
25
100
250
infa
nt
mo
rtal
ity
(per
1,0
00liv
e b
irth
s)
5
25
100
250
GDP per capita (constant US$)
250 1,000 10,000 50,000GDP per capita (constant US$)
infa
nt
mo
rtal
ity
(per
1,0
00liv
e b
irth
s)
250 1,000 10,000 50,000
5
25
100
250
infa
nt
mo
rtal
ity
(per
1,0
00liv
e b
irth
s)
5
25
100
250
GDP per capita (constant US$)
250 1,000 10,000 50,000GDP per capita (constant US$)
1990
China
IndonesiaIndia
Sri LankaThailand
Vietnam
2000
ChinaIndonesia
India
Sri LankaThailand
Vietnam
2006
Figure 4.6 Infant Mortality versus Income (1960–2006)
Source: WDI.
Note: Both axes log scale.
58

Indonesia’s performance on other key health outcomes, such as mater-nal mortality and child malnutrition, has been relatively poor. Its maternalmortality ratio (MMR)—often considered to be one of the best indicatorsof the performance of a health system—was an estimated 420 per 100,000for 2005 (WHO, UNFPA, UNICEF, and World Bank 2008c). At such alevel, Indonesia’s MMR is very high and progress in reducing the rate slow.3
Figure 4.8 shows that, in 2005, holding both income and health spendingconstant, Indonesia performed worse with respect to maternal mortalitythan other East Asia and Pacific region (EAP) and global comparators.
One potential explanation for this difference in performance is thatreductions in maternal mortality are more reliant on direct health systeminputs than are infant mortality and life expectancy. Improvements ininfant mortality rates and life expectancy at birth are likely to be drivenby a range of factors, such as income levels, improved water and sanita-tion, and maternal education, as well as health system inputs. Reductionsin maternal mortality, however, are directly reliant on health systeminputs such as access to basic curative care services and the availability ofbackup Cesarean section capacity when needed.
Overall population and female education levels have been found to beimportant factors in explaining levels within, and differences in, healthoutcomes between countries. Figure 4.9 shows that Indonesia has signifi-cantly higher levels of female literacy than do other countries of its incomelevel. This may partially explain Indonesia’s relatively good performanceon some health outcome indicators despite its relatively low levels ofhealth (physical and human) infrastructure and health spending.
Assessment of Health Financing Performance 59
ChinaIndonesiaCambodia
Lao PDR
MalaysiaPhilippines
Thailand
Vietnam
Samoa
below average above average
bel
ow
ave
rag
eab
ove
ave
rag
e
IMR
rela
tive
to
inco
me
IMR relative to health spending per capita
Figure 4.7 Global Comparisons of Infant Mortality versus Income and Health Spending
Source: WDI; WHO NHA database http://www.who.int/nha/country/idn/en/.

Health Spending
Health system performance is difficult to measure because of the complexinteractions among numerous health- and nonhealth-related factors.Nevertheless, some (noncausal) perceptions can be formed of the perform-ance of Indonesia globally relative to the basic health system objectives ofhealth outcomes, financial protection, and consumer responsiveness byevaluating Indonesia’s health outcome measures against its health spendinglevels and comparing the results to those of other countries. This sectioncompares Indonesia’s total, public, and private health spending levels withother comparable-income countries. Figures 4.10 and 4.11 indicate thattotal health expenditures as a share of GDP and per capita total health
60 Health Financing in Indonesia
China
Indonesia
Cambodia
Lao PDR Malaysia
PhilippinesThailand
Vietnam
bel
ow
ave
rag
e
below average
abo
ve a
vera
ge
above average
MM
R re
lati
ve t
o in
com
e
MMR relative to health spending per capita
Figure 4.8 Global Comparisons of Maternal Mortality versus Income and Health Spending
Source: WDI; WHO NHA database http://www.who.int/nha/country/idn/en/.
Indonesia
Cambodia Lao PDR
Philippines Samoa
China MalaysiaThailand
20
40
60
80
100
120
fem
ale
liter
acy
rate
(%)
10 100 250 1,000 2,500 10,000 25,000
GDP per capita (current US$)
Figure 4.9 Female Literacy and Income
Source: WDI; WHO NHA database http://www.who.int/nha/country/idn/en/.
Note: x-axis log scale. Female literacy rate and GDP per capita data are for latest available year.

Assessment of Health Financing Performance 61
China
Indonesia
Cambodia
Lao PDR
MalaysiaPhilippinesThailand
VietnamSamoa
0
5
10
15
20
tota
l hea
lth
sp
end
ing
(% G
DP)
100 250 1,000 10,000 25,000GDP per capita (current US$)
Figure 4.10 Total Health Expenditure as Share of GDP versus Income per Capita (2006)
Source: WDI; WHO NHA database http://www.who.int/nha/country/idn/en/.
Note: x-axis log scale.
China
IndonesiaCambodia
Lao PDR
Malaysia
PhilippinesThailandVietnam
Samoa
10
34
100
1,000
tota
l hea
lth
sp
end
ing
per
cap
ita
(US$
)
100 250 1,000 10,000 25,000
GDP per capita (current US$)
Figure 4.11 Total Health Expenditure per Capita versus Income per Capita (2006)
Source: WDI; WHO NHA database http://www.who.int/nha/country/idn/en/.
Note: Both axes log scale.
spending are well below the levels that would be expected for a countrywith Indonesia’s income level.
In contrast to the previous measures, Indonesia’s public share of totalhealth expenditure is about average for a country of its income level(figure 4.12). As a consequence, it is not surprising that public spend-ing on health care, whether measured as a share of GDP (figure 4.13),in per capita terms (figure 4.14), or as a share of overall governmentspending (figure 4.15), is also below the expected level, judging byregression lines relating these three measures of public spending toincome per capita. This may suggest that public spending on health carehas not been as high a priority in Indonesia as it has been in some other

62 Health Financing in Indonesia
China
Indonesia
CambodiaLao PDR
MalaysiaPhilippines
Thailand
Vietnam
Samoa
20
40
60
80
100
go
vern
men
t h
ealt
h s
pen
din
g(%
to
tal h
ealt
h s
pen
din
g)
10 100 250 1,000 1,0000 25,000GDP per capita (current US$)
Figure 4.12 Public Expenditure as Share of Total Health Expenditure versus Income per Capita (2006)
Source: WDI; WHO NHA database http://www.who.int/nha/country/idn/en/.
Note: x-axis log scale.
IndonesiaCambodia
China
Lao PDR
MalaysiaPhilippines
Samoa
ThailandVietnam
5
10
15
go
vern
men
t h
ealt
h s
pen
din
g (%
GD
P)
10 100 250 1,000 2,500 10,000 25,000
GDP per capita ( current US$)
Figure 4.13 Public Expenditure on Health as Share of GDP versus Income per Capita (2006)
Source: WDI; WHO NHA database http://www.who.int/nha/country/idn/en/.
Note: Both axes log scale.
middle-income countries. It also complements the findings, shown infigure 4.16, that out-of-pocket (OOP) spending, a measure of financialprotection, is slightly worse than average compared with comparableincome countries.
While it is not possible to directly relate Indonesia’s macro spendingperformance to the health outcomes previously discussed, it is plausible toargue that its mixed health outcomes may, in part, be due to insufficient,inequitable, or inefficient spending on health. The following sectionson technical and allocative efficiency explore this issue in more detail.This is followed by an assessment of the performance of Indonesia’s

health system with respect to the equity and financial protection dimen-sions of performance.
Efficiency
Efficiency is typically defined as maximizing outputs from inputs, and isprimarily related to the purchasing function of health financing. Allocativeefficiency is achieved when available financing is directed toward a mix ofinterventions that has the greatest marginal impact on health outcomes.
Assessment of Health Financing Performance 63
Cambodia
China
Indonesia
Lao PDR
Malaysia
Philippines
SamoaThailand
Vietnam10
34
100
1,000
pu
blic
hea
lth
sp
end
ing
per
cap
ita
100 250 1,000 10,000 25,000GDP per capita (current US$)
Figure 4.14 Public Expenditure on Health per Capita versus Income per Capita (2006)
Source: WDI; WHO NHA database http://www.who.int/nha/country/idn/en/.
Note: Both axes log scale.
Figure 4.15 Public Expenditure on Health as Share of Total Government Expenditure versus Income per Capita (2006)
Source: WDI; WHO NHA database http://www.who.int/nha/country/idn/en/.
Note: X-axis log scale.
China
Indonesia
Cambodia
Lao PDR
MalaysiaPhilippines
Thailand
Vietnam
Samoa
0
10
20
30
go
vern
men
t h
ealt
h s
pen
din
g(%
to
tal g
ove
rnm
ent
bu
dg
et)
10 100 250 1,000 10,000 25,000
GDP per capita (current US$)

Technical efficiency is achieved when health financing is allocated so thatit maximizes outcomes given the resources it uses (staff, equipment, andpurchases of goods and services), or minimizes the use of those resourcesgiven what it produces. Allocative and technical efficiency together areoften referred to as economic efficiency. Efficiency can be defined at a microlevel (for example, at the level of health facilities) or at a more macro level(for example, at the level of a subnational or national health system).Inefficiencies can also arise in how revenues are collected and pooled.This section examines these issues.
Allocative EfficiencyIn practice, allocating health care resources to the most cost-effective setof interventions is regarded as a means to improving allocative efficiency(Liu 2003). The Disease Control Priorities Project (Jamison et al. 2006)provides evidence on the cost-effectiveness of health interventions, whichindicates that preventive and public health interventions are generallymore cost-effective than curative care interventions. Thus, it is arguedthat allocative efficiency can be achieved by shifting resources towardgreater provision of preventive and public health services relative to cur-ative, mostly hospital-based, services. In the absence of detailed informa-tion on the actual benefits covered under Indonesia’s health programs andthe cost-effectiveness of the package of interventions that is delivered atthe country level, the ratio of hospital to nonhospital costs is used as acrude proxy for allocative efficiency (Kutzin 1995).
64 Health Financing in Indonesia
Source: WDI; WHO NHA database http://www.who.int/nha/country/idn/en/.
Note: x-axis log scale.
Figure 4.16 Out-of-Pocket Spending as Share of Total Health Spending versus Income per Capita
Indonesia
Cambodia
China
Lao PDR
Malaysia
Philippines
Samoa
Thailand
Vietnam
0
20
40
60
80
ou
t-o
f-p
ock
et h
ealt
h s
pen
din
g(%
to
tal h
ealt
h s
pen
din
g)
10 100 250 1,000 10,000 25,000GDP per capita ( current US$)

It is clear that, regardless of any methodological differences in how theestimates were derived, Indonesia spends relatively little on hospital carecompared with other countries in the region. Table 4.1 shows the shareaccounted for by hospitals and nonhospital provision in total curative andpreventive care spending in the EAP region. The estimates are fromNational Health Accounts (NHA) data for all of the countries in theregion with the exception of Indonesia, for which the shares are WorldBank estimates.
Information on the relative shares of hospital and nonhospital expen-ditures does not, however, provide sufficient evidence to make conclu-sions about the level of allocative efficiency in Indonesia. For example,some of the best health outcomes in EAP are found in countries with rel-atively high shares of hospital spending, such as Malaysia, Hong Kong(China), and Sri Lanka, as shown in table 4.1. A second problem withassessing allocative efficiency using cost-effectiveness criteria is that itassumes that maximizing health outcomes is the only objective of ahealth system. As discussed above, health systems have multiple objec-tives. The government of Indonesia’s goal is not only to maximize healthoutcomes, but also to provide insurance against financial catastrophe asso-ciated with health care costs.
Assessment of Health Financing Performance 65
Table 4.1 Hospital and Nonhospital Care: Share of Total Public Health Expenditures in Asian and Pacific Countries (Various Years)
Economy Hospital (%) Nonhospital (%)
Bangladesh 32 68
Nepal 35 65
Indonesia 38 62
Korea, Republic of 43 57
Tonga 48 52
Australia 50 50
Japan 55 45
Taiwan, China 64 36
Malaysia 71 29
China 75 25
Hong Kong, China 77 23
Vietnam 79 21
Sri Lanka 83 17
Thailand 88 12
Mongolia 89 11
Sources: Fernando 2008; Indonesia – World Bank staff calculations.

Technical EfficiencyIn Organisation for Economic Co-operation and Development (OECD)countries, measurement of technical efficiency is well developed and hasled to a large body of evidence on the efficiency and productivity ofhealth service delivery in these countries (Hollingsworth 2008). In low-and middle-income countries, technical efficiency is measured using basicmethods such as ratios of inputs and service indicators, and unit costs.Such micro-level measures, even when available, can lead to an incom-plete characterization of efficiency because they tend not to control forquality of health care and differences in input costs resulting from cost-of-living differences (for example, rural-urban differences in costs that areunrelated to the health system itself).
In Indonesia, measurement of technical efficiency is particularly lim-ited because there are no unit-cost data. In the absence of better data, thischapter analyzes bed-occupancy and case-flow data in public hospitals toexamine differentials in public hospital performance across Indonesianprovinces. Figure 4.17, based on a characterization of hospital efficiencyintroduced in the mid-1980s and used widely since (Pabon Lasso 1986),shows the average bed-occupancy rate (the percentage of beds occupiedon average over the year) and average case-flow (the number of cases perbed per year) in each of Indonesia’s 30 provinces.4
66 Health Financing in Indonesia
Figure 4.17 Variations in Hospital Efficiency across Indonesian Provinces
NAD
Sumut
Sumbar
Riau
Jambi
SumselBengkulu
Lampung
Bangka BelitungDKI Jakarta
JabarJateng DIY
Jatim
Banten
BaliNTB
NTT
KalBarKalseng
Kaltim
Sulut
SultengSulselSulteng Irian Jaya Tengah
Irian Jaya Timur
average bed occupancy
aver
age
case
flo
w
Kalteng
Maluku
Irian Jaya Barat
0
20
40
60
80
100
0 10 20 30 40 50 60 70 80 90 100bed-occupancy rate (percent)
case
flo
w (c
ases
per
bed
per
yea
r)
A: high case flow low occupancy
C: high case flow high occupancy
B: low case flow low occupancy
D: low case flow high occupancy
Source: MoH 2006.

It is clear that there are large differentials in the performance of pub-lic hospitals across Indonesia; however, a better understanding of thesedifferentials in performance is needed. The vertical and horizontal lines infigure 4.17 show the national average bed-occupancy rate and nationalaverage case flow, respectively. The plane is divided into four zones byvertical and horizontal lines that cut through the mean values of theoccupancy rate and case flow, respectively. Hospitals in regions that fall inZone C (high occupancy and high case flow relative to the mean), forexample Nusa Tenggara Timur (NTT), are said to be more efficient thanhospitals in the other three zones.
Average hospital case flow in Indonesia is comparable to the globalaverage, but average bed-occupancy rates in Indonesia are well below theglobal average. Figure 4.18 provides the same characterization of hospitalefficiency for Indonesia and a sample of other countries in the region andin OECD as figure 4.17 presents for the Indonesian provinces. Indonesia
Assessment of Health Financing Performance 67
Figure 4.18 Relative Hospital Efficiency in Indonesia and Other Countries
AusA
B
C
Cdn
CN
CZ
F
D
G
HKHIdn
Irl
I
J
Rok
LMys
M
MngNl
N
PS
ECh
Tw
T
Tk
UK
US
V
average bed occupancy
aver
age
case
flo
w
0
20
40
60
80
100
0 10 20 30 40 50 60 70 80 90 100
bed-occupancy rate (percent)
case
flo
w (c
ases
per
bed
per
yea
r)
A: high case flow low occupancy
C: high case flow high occupancy
B: low case flow low occupancy
D: low case flow high occupancy
Sources: OECD member countries’ data from OECD (2008). Other countries’ data from different sources—China:
China Statistical Yearbook; Hong Kong, China: Census & Statistics Department, Department of Health, Hospital
Authority, Thematic Household Survey; Indonesia: Indonesia Health Profile; Malaysia: Health Facts and MoH
Annual Report; Mongolia: Health Indicators, National Center for Health Development; Taiwan, China: Health and
National Health Insurance Annual Statistics, Department of Health; Thailand: Health Workforce Survey, Bureau of
Policy and Strategy, Ministry of Public Health Thailand.
Note: A = Austria; AUS = Australia; B = Belgium; C = Cambodia; CDN = Canada; CH = Switzerland; CN = China;
CZ = Czech Republic; D = Germany; E = Spain; F = France; G = Greece; H = Hungary; HK = Hong Kong (China);
I = Italy; IDN = Indonesia; IRL = Ireland; J = Japan; L = Luxembourg; M = Mexico; MNG = Mongolia; MYS =
Malaysia; N = Norway; NL = the Netherlands; P = Portugal; ROK = Republic of Korea; S = Slovak Republic; T =
Thailand; TK= Turkey; TW = Taiwan (China); UK = United Kingdom; US = United States; V = Vietnam. Data reflect
latest available year (2003–06).
lies in Zone B and is most comparable to Turkey in this diagrammatic rep-resentation of facility efficiency. Although this comparison is relativelysimplistic and does not take into account variations in quality and casemix, it does provide crude evidence that health facility efficiency can beimproved in Indonesia.
The significant variation in health outputs across districts in Indonesiasuggests that there may be lessons to be learned from better-performingdistricts. Figure 4.19 presents a comparison of DPT3 (three doses of thediphtheria, pertussis, tetanus vaccine) immunization and skilled birthattendance rates for a selected range of districts. The figure shows thatperformance varies widely between districts. For example, the districts ofKediri and Padang have almost 100 percent skilled birth attendance,which puts these districts on par with some of the best-performing coun-tries in the world. By contrast, skilled birth attendance is below 40 per-cent in Wonosobo and Nias Selatan, which is comparable to relativelypoor, even fragile, states.
Underlying these differentials in facility efficiency (figure 4.17) andoverall performance in output (figure 4.19) are variations in the organiza-tion and management of health facilities and staff incentives at the districtlevel. Many districts in Indonesia have taken the opportunity provided tothem by decentralization to increase performance monitoring andimprove the incentives offered to health professionals and managers. It isimportant to gain a better understanding of the factors that drive the per-formance of the better performing districts. Therefore, a closer study of theimpact of these district-level improvements on performance is needed.
Macro-Level Measures of EfficiencyGiven the complexities of health systems, it is not easy to aggregate micro-performance measures to macro levels or to readily estimate macro-outcome performance directly. Macro-level measures of health systemefficiency can be misleading given that they assume that health expendi-ture is a causal factor underlying health system outcomes. Health out-comes are clearly a function of many other factors—education, water andsanitation, housing, and income, to name a few—making the attribution ofcausality to health expenditures alone difficult.5 Ideally, a mix of macro-and micro-level indicators should be examined to assess the potential forimprovement of efficiency-related problems in any health system.
Effective coverage rates for given levels of health resources can be atracer for estimating macro-level health system efficiency problems.Effective coverage—defined as the proportion of the population with a
68 Health Financing in Indonesia

Figure 4.19 Comparison with Selected Countries of Indonesian Districts’ Attainment of DPT3 Immunization and Skilled Birth Attendance (2005)
Sources: Susenas; WDI.
Note: DPT3 = Three doses of diphtheria, pertussis, tetanus vaccine. Kab. = province; Kota = city.
Kab. Tana Toraja
Kab. Ciamis
Kab. Morowali
Kab. Subang
Kab. Parigi Moutong
Kab. Bombana
Kab. Madiun
Kota Ambon
Kab. Lombok Barat
Kab. Konawe Selatan
KotaSingkawang
Kab. Bangka Tengah
Bangladesh
Japan
Nepal
Papua New Guinea
Somalia
Timor-LesteIndia
Niger
Pakistan
Chad
Turkey
Uganda
Vietnam
0
20
40
60
80
100
per
cen
t
Indonesia other countries
Kota Kediri
Kab. Kediri
Kab. Bantul
Kab. Barito Selatan
Kab. Hulu Sungai Utara
Kab. Nias Selatan
Kota PadangPanjang
Kab. Semarang
Kab. Kuningan
Kab. Barru
Kab. Purbalingga
Kab. Wonosobo Burundi
Cambodia
Senegal
Ukraine
Bhutan
China
Ethiopia
Tanzania
0
20
40
60
80
100
per
cen
t
Indonesia other countries
a. DPT3 immunization b. Skilled birth attendance
69

given health care need who receive quality care—is a more direct outputmeasure of a health system (Shengelia et al. 2005). Health care needsmay be defined on the basis of population characteristics (for example,the need for immunization among children) or by the presence of a dis-ease or health problem for which an effective intervention is available.
DPT3 immunization coverage, for instance, is often considered to be agood indicator of the coverage of a health system. Table 4.2 lists severalcountries that spent less on health care than did Indonesia but attainedhigher DPT3 coverage rates. While table 4.2 does not show that Nepal’shealth system is more efficient than Indonesia’s—a more composite meas-ure of effective coverage would be needed to reach such a conclusion—itdoes suggest that there might be some efficiency-related problems inIndonesia that merit further study given its poor performance on a keyhealth system metric such as DPT3 immunization and considering thenet health resource envelope at its disposal.
Sri Lanka is often presented as an example of a country that hasattained good health outcomes with relatively low levels of resources.This outcome is at least partly due to the underlying efficiency of itshealth system (box 4.1). Because it is also one of the few developingcountries for which analysis of costs and efficiency has been attempted inany significant way, the Sri Lankan case is used for comparison here.
Financial Protection and Equity in Financing and Delivery of Health Care
This section presents evidence on financial protection and equity inIndonesia, and compares Indonesia’s performance with other countries in
70 Health Financing in Indonesia
Table 4.2 Selected Countries with Lower Health Spending Than Indonesia but Higher DPT3 Coverage Rates (2005)
Country
Total health expenditure
per capita (US$)DPT3 immunization
coverage (%)
Indonesia 26 70Uganda 22 84
Rwanda 19 95
Tajikistan 18 85
Tanzania 17 90
Nepal 16 75
Pakistan 15 80
Bangladesh 12 88
Sources: WHO NHA database; WDI.

Assessment of Health Financing Performance 71
Box 4.1
Health System Efficiency in Sri Lanka
Sri Lanka is one of the best-performing countries with regard to population health
indicators relative to its resources. The figure shows the attainment of child mor-
tality and maternal mortality relative to income and total health expenditure in
Sri Lanka and Indonesia (and other countries, not visible) in 2005. Sri Lanka is
clearly one of the most positive outliers, while Indonesia is above average for
child mortality but not for maternal mortality.
FIGURE: Sri Lanka’s Child and Maternal Mortality Relative to Income and Total Health Spending
Source: WDI.
Although population health outcomes are also a function of nonhealth
system–related factors such as education, in Sri Lanka’s case there is some evi-
dence that part of its good performance in health may be due to the fact that its
health system has been relatively efficient. Its expansion of health coverage after
1960 occurred during a period when government health spending as a share of
GDP actually declined.
With regard to some traditional efficiency indicators, Sri Lanka has relatively low
cost ratios to GDP per capita for inpatient and outpatient care, has high productivity
of human resources in the health sector, as well as high case-flow rates and a low
(continued)
Indonesia
Sri Lanka
–3
–2
–1
0
1
2
3
per
form
ance
rela
tive
to to
tal h
ealt
h s
pen
din
g
–3 –2 –1 0 1 2 3performance relative to income
Child mortality
Indonesia
Sri Lanka
abov
e av
erag
eb
elo
w a
vera
ge
abov
e av
erag
eb
elo
w a
vera
ge
above average below average above average below average–3
–2
–1
0
1
2
3
per
form
ance
rela
tive
to to
tal h
ealt
h s
pen
din
g
–3 –2 –1 0 1 2 3performance relative to income
Maternal mortality

the EAP region. Two important goals of health policy are to (i) providefinancial protection, especially to poor households, from high or pro-longed expenditure on health care; and (ii) improve equity in the financ-ing and delivery of health and, thus, improve the distribution of healthoutcomes. Using the OOP spending share of total health spending as acrude measure of financial protection, Indonesia provides less financialprotection than do other comparable income countries.
Financial ProtectionDirect OOP payments constitute a large share of the financing of healthcare in Indonesia and are potentially a significant burden on poor house-holds.6 This is also the case in many other low- and middle-income coun-tries in the EAP region and globally. Nevertheless, OOP payments forhealth care account for only about 1.7 percent of an average household’sbudget in Indonesia (figure 4.20). Elsewhere in the EAP region, the OOPshare of the household budget averages around 2 percent only in coun-tries such as Malaysia, Sri Lanka, and Thailand where there is universalcoverage for health care.
The gap in the OOP share of the total household budget between richand poor households narrowed between 2001 and 2006 (figure 4.20) asa result of a slight rise in the OOP shares for the two poorest quintilesand a more significant reduction for the richer quintiles. These trendsmay be explained by the recent policy change to promote financial pro-tection for the poor through the Askeskin/Jamkesmas program. Theincrease in OOP payments by the poor may be related to higher levelsof utilization resulting from the introduction of this, or local, healthinsurance mechanisms. Households that would have forgone care in thepast may now be seeking care at health facilities because they now owna health card. However, the health card does not cover all costs of
72 Health Financing in Indonesia
Box 4.1 (Continued)
average length of stay in hospital. The health care delivery modality in the country
is oriented toward the use of hospitals for providing both inpatient and outpatient
primary care and there is some evidence that this has been more cost effective
than the use of stand-alone primary care facilities, possibly because of
economies of scale.
Source: Rannan-Eliya and Sikurajapathy 2008.

treatment, particularly drug costs if the drugs are not available in thefacility itself, which may have led to increased OOP costs among theseincome groups. At the same time the richer quintiles may be benefitingfrom the targeting of the health card to the poor and thus are seeing adecline in their OOP spending.7
OOP Payments and Financial CatastropheCatastrophic payments for health care are defined as OOP payments inexcess of a substantial proportion of the household budget, usually 10–40percent (Van Doorslaer et al. 2006; Xu et al. 2003). Ideally, longitudinaldata would be used to estimate the extent to which the purchase of med-ical care in response to illness shocks has a catastrophic impact on house-hold spending. The effects can be short term if health care is financed bycutting back on current consumption, or long term, if it is financedthrough savings, the sale of assets, or credit. In the absence of panel data,an approximation of the disruptive effect is made. Table 4.3 shows theincidence and distribution of the catastrophic impact of health care pay-ments on Indonesian households in 2001 and 2006.8 The incidence is rel-atively low in Indonesia, and has declined over time.
In 2001, 2.6 percent of households incurred health care payments inexcess of 15 percent of their total household budget; by 2006, this ratiohad declined to 1.2 percent. Coming as no surprise, the incidence of
Assessment of Health Financing Performance 73
0
0.5
1.0
1.5
2.0
2.5
3.0
2001 2006
ou
t-o
f-p
ock
et s
har
e o
f to
tal
ho
use
ho
ld s
pen
din
g (%
)
poorest quintile 2nd 3rd 4th richest quintile
Figure 4.20 OOP Share of Total Household Budget by Consumption-Based Quintile (2001 and 2006)
Source: Analysis carried out for this report by Gadjah Mada University, Yogyakarta.

catastrophic payments is higher when compared with the nonfood house-hold budget, with 8.3 percent of households incurring health care pay-ments in excess of 15 percent of their nonfood budget in 2001, decliningto 3.7 percent in 2006. It is clear that, once basic food needs have beenmet, health care accounts for a large fraction of the remaining familyresources for a substantial fraction of the population. The positive con-centration indexes in table 4.3 indicate that richer households are morelikely to incur catastrophic spending than poorer households.
By regional standards, the incidence of catastrophic health spending islow in Indonesia, and its performance relative to other countries hasimproved over time (figure 4.21). The proportion of households incur-ring catastrophic payments for health care is highest in Bangladesh,Vietnam, China, and India, all of which, like Indonesia, lack universal cov-erage. In Vietnam, for instance, OOP payments for health care exceed 25percent of the nonfood budget for 15 percent of households. By contrast,Indonesia is in the same group as Malaysia, Sri Lanka, Thailand, and thePhilippines, where OOP payments exceed 25 percent of the nonfoodbudget for only 5 percent or less of all households. Generally, if the inci-dence of catastrophic spending is high, the OOP share of total healthspending will be high. The relatively low incidence of catastrophic spend-ing in Indonesia is surprising given that OOP spending accounts forone-third of total health spending in Indonesia.
74 Health Financing in Indonesia
Table 4.3 Incidence (Headcount) of Catastrophic OOP Payments for Health Care on Total Household Spending (2001 and 2006)
2001 2006
Threshold (percent) Threshold (percent)
5 10 15 25 5 10 15 25
Of total household spendingHeadcount (%) 9.57 4.43 2.59 1.13 6.07 2.24 1.24 —
Concentration
index of headcount 0.01 0.20 0.30 0.47 0.12 0.27 0.37 —
Rank-weighted
headcount (%) 8.63 3.54 1.81 0.59 5.32 1.62 0.78 —
Of nonfood household spendingHeadcount (%) 20.21 12.33 8.28 4.40 18.42 7.00 3.73 1.55
Concentration
index of headcount 0.00 0.03 0.08 0.18 –0.10 0.00 0.09 0.26
Rank-weighted
headcount (%) 20.30 11.90 7.60 3.60 20.31 7.01 3.38 1.14
Source: Analysis carried out for this report by Gadjah Mada University, Yogyakarta.
Note: — = Not available.

OOP Payments and ImpoverishmentIn Indonesia, the risk of impoverishment because of OOP payments aloneis only moderate. In 2006, 69.8 percent of the population fell below the$2.15/day poverty line. When the poverty headcount was recalculated onthe basis of household resources minus payments for health care, theheadcount rose to 70.6 percent, barely 1 percentage point more. Thisimplies that less than 1 percent of the population fall below the$2.15/day threshold when health care payments are subtracted fromtheir household budgets. Table 4.4 shows the impact on the povertyheadcount of household OOP payments for health for Indonesia andother EAP countries. The increased share of the population falling belowthe $2.15/day line is higher in Vietnam (4.5 percent), Bangladesh (3.6percent), and China (1.8 percent), but is lower in Malaysia and Thailand.
Not only do OOP payments account for a relatively low share of thehousehold budget in Indonesia, but the incidence of catastrophic OOPexpenses and the risk of impoverishment as a result of health care pay-ments are also relatively low. For instance, Indonesia relies on OOP financ-ing only slightly less than China does, yet the incidence of catastrophic
Assessment of Health Financing Performance 75
Figure 4.21 Incidence of Catastrophic Payments Defined Relative to Total and Nonfood Expenditures
0
2
4
6
8
10
12
14
16
18
Malaysia
(1999)
Taiwan (2
000)
Indonesia
(2006)
Thailand (2
002)
Hong Kong (Chin
a) (2000)
Sri Lanka (1
997)
Philippin
es (1999)
Indonesia
(2001)
Korea Rep. o
f (2000)
Nepal (1996)
India (2
000)
China (2
000)
Bangladesh (2
000)
Vietnam
(1998)
% o
f ho
use
ho
lds
exce
edin
g t
hre
sho
ld
greater than 25 percent of nonfood expenditures
greater than 10 percent of total expenditures
Source: Van Doorslaer et al. 2007; analysis carried out for this report by Gadjah Mada University, Yogyakarta.

payments and risk of impoverishment are much higher in China.Furthermore, although the proportion of the population at risk of extremepoverty in Indonesia was of a similar size to that in Bangladesh and India,the proportion counted below the extreme poverty threshold after takingaccount of health payments in Indonesia was much lower.
Askeskin/Jamkesmas, the health insurance scheme targeted to the poor,is one possible explanation for the improvement in financial protection inIndonesia despite the high levels of poverty and reliance on OOP financ-ing. As described in chapter 3, the program has been in place since 2004,and has been expanded gradually. Although some systematic evaluationsof the program have been carried out, no firm evidence confirms that theprogram has had a significant impact on financial protection. Analyses ofhousehold data and expenditures do, however, appear to demonstratesupport for this hypothesis.
A second possible explanation for the low incidence of catastrophicspending is that a large proportion of Indonesian households forgo carebecause of their inability to meet the large OOP costs. A substantialbody of evidence from Indonesia and elsewhere suggests that OOPpayments deter use of services, with differential effects on utilizationrates by the poor compared with the rich (Gertler, Locay, and Sanderson1987; Gertler and van der Gaag 1990; Mocan, Tecan, and Zax 2004).Uncertainties about obtaining appropriate and quality services and thehigh levels of absenteeism of medical providers, especially in ruralareas, may lead to some households forgoing care, so contributing tolow spending levels. A fourth explanation is cultural—people perceive
76 Health Financing in Indonesia
Table 4.4 Impact of OOP Health Care Payments on Poverty Headcounts (% Change)
CountryContribution of OOP
to headcount at $1.08/dayContribution of OOP
to headcount at $2.15/day
Malaysia (1999) 0.05 0.25
Thailand (2002) 0.17 0.69
Sri Lanka (1997) 0.31 1.68
Philippines (1999) 0.59 1.05
Indonesia (2006) 1.07 0.79Vietnam (1998) 1.08 4.45
Indonesia (2001) 1.18 1.05
Nepal (1996) 2.24 1.26
China (2000) 2.57 1.84
India (2000) 3.70 2.05
Bangladesh (2000) 3.77 3.55
Sources: Van Doorslaer et al. 2006; analysis carried out for this report by Gadjah Mada University, Yogyakarta;
Harbianto and Hariyadi 2008; Bank staff analysis.

serious and life-threatening illnesses as natural and do not feel the needto prolong life.
Nevertheless, the Indonesia Poverty Assessment states that illness andrelated costs are the second most important causal factor for impoverish-ment (World Bank 2007a). In addition, health shocks have a significantimpact on households, not only because of the large OOP payments asso-ciated with the treatment of the illness itself, but because of lost incomewhen a working member of the family falls ill. Households cope with cat-astrophic payments for health care by depleting their savings, selling offtheir assets, and reducing their consumption of food. Health care may beforgone early on in the illness, leading to more acute, costly care beingneeded later on.
Equity in Financing of Health CareGreater equity in health care financing is a relevant health system goalbecause it has implications for the distribution of both health andincome. The distribution of health may be affected through financial dis-incentives for the utilization of health care. This would be the case if largeOOP payments result in high levels of forgone care, as discussed above.The distribution of income may be altered by taxes and social insurancecontributions if, for instance, the rich pay disproportionately more of thetaxes that are used to finance health care.
In Indonesia, direct taxes and social insurance contributions are highlyprogressive, and indirect taxes and OOP payments moderately so. Therichest two quintiles account for a disproportionately large share of taxand social insurance payments relative to their ability to pay (table 4.5).Underlying this highly progressive distribution is the fact that direct taxes
Assessment of Health Financing Performance 77
Table 4.5 Quintile Shares of Ability to Pay and Sources of Financing for HealthCare (2001 and 2006) (percent)
Ability to pay Direct taxes
Indirect taxes
Social insurance
OOP payments
Quintile 2001 2006 2001 2006 2001 2006 2001 2006 2001 2006
Poorest 20% 9 8 5 3 8 7 1 1 5 6
2nd 12 12 7 5 12 11 4 3 8 10
3rd 16 16 13 11 16 16 9 10 12 14
4th 23 23 23 19 23 23 23 22 22 22
Richest 20% 40 40 52 62 41 44 63 65 53 48
Sources: 2001 – O’Donnell et al. 2008; 2006 – Harbianto and Hariyadi 2008; Bank staff analysis.
Note: Totals may not add to 100 percent because of rounding.

and social insurance contributions are paid predominantly by skilled,formal sector employees who are relatively better off than the rest of thepopulation. By contrast, indirect taxes are less progressive than direct taxesbecause they are levied on a range of goods and services that are purchasedby a broader group in the population. The rich also make more directOOP payments for health care relative to their ability to pay comparedwith the poor. As discussed in the earlier section, OOP payments are morelikely to be incurred by richer groups in the population who can alsoafford to pay for more expensive, private sector care.
Indonesia shows progressivity in all of the major financing sources, as domost low- and middle-income countries in the EAP region. Figure 4.22also shows the following: tax financing is highly progressive, a reflectionof the narrow tax base in many of these countries; direct taxes are moreprogressive than indirect taxes; social insurance is progressive becausecoverage of social insurance programs is limited to skilled, professionalgroups; direct OOP payments are progressive in Indonesia, and again inmost low- and middle-income countries with the exception of China,because the rich tend to spend proportionately more on health care thando the poor.
Equity in Use of Health ServicesWhen direct OOP payments for health care account for a large share ofhealth financing, as is the case in many low- and middle-income countrieslike Indonesia, the distribution of financing also affects the distribution ofhealth care use. In these settings, equity in financing and utilization needto be examined together. Utilization rates of health care are an importantproxy for measuring the equitable distribution of the use of health serv-ices. Equitable utilization of health care is measured as the share of thepopulation in each quintile that used a particular service during the pastyear (for inpatient care), or the past two weeks (for outpatient and ambu-latory care).
Utilization rates for both public and private sector services inIndonesia increased across all income groups between 2001 and 2007.This is clear from figures 4.23 and 4.24, which show mean utilizationrates in 2001 and 2007 by quintile for public and private services, respec-tively. Notably, the rate of increase in utilization rates was higher for thepoorest quintile than for the richest quintile for all types of public sectorservices. In particular, the poorest quintile’s utilization of public hospitalinpatient services quadrupled during this period, compared with a moremoderate increase of approximately 50 percent for the richest quintile.
78 Health Financing in Indonesia

–0.4
–0.3
–0.2
–0.1
0
0.1
0.2
0.3
0.4
0.5
0.6
0.7
Bangladesh(1999–2000)
Hong Kong(China)
(1999–2000) Taiwan(2000)
China(2000)
Indonesia(2001)
Indonesia(2006)
Japan(1998)
Korea, Rep. of(2000)
Nepal(1996)
Philippines(1999)
Sri Lanka(1996–97)
Thailand(2002)
Kak
wan
i in
dex
direct taxes indirect taxes social insurance direct payments total payment
Figure 4.22 Kakwani Indexes for Finance Sources
Source: O’Donnell et al. 2008; Harbianto and Hariyadi 2002; Bank staff analysis.
Note: The Kakwani index is a summary measure that indicates whether the rich contribute more than the poor in both absolute terms and relative terms. A positive Kakwani index implies
that the share of payments made by the rich is greater than their share of total ability to pay, or progressivity. A zero value implies proportionality, and a negative value implies a regressive
distribution. This figure provides the Kakwani indexes for the different sources of financing in Indonesia and EAP.
79

80 Health Financing in Indonesia
0
2
4
6
8
10
12
2001 2007 2001 2007 2001 2007
hospital inpatient hospital outpatient ambulatory care
mea
n u
tiliz
atio
n ra
te (%
)
poorest quintile 2nd 3rd 4th richest quintile population average
Figure 4.23 Utilization Rates of Public Sector Facilities (2001 and 2007)
Source: Harbianto and Hariyadi 2008; Bank staff analysis.
Figure 4.24 Utilization Rates of Private Sector Facilities (2001 and 2007)
0
2
4
6
8
10
12
14
16
mea
n u
tilli
zati
on
rate
(%)
poorest quintile 2nd 3rd 4th richest quintile total
hospital inpatient hospital outpatient ambulatory care
2001 2007 2001 2007 2001 2007
Source: Harbianto and Hariyadi 2008; Bank staff analysis.
Despite these increases, the socioeconomic gradient in use of public hos-pital services continues to favor the rich, while the gradient for use ofambulatory care services favors the poor. Use of private hospital servicesdid not change much, but use of private sector ambulatory care servicesincreased significantly, particularly by the poor.

Distribution of Public Subsidies for Health CareEnsuring that public spending on health care and other services is pro-poor is an important health system objective. Underlying the objective isthe contention that distributional concerns, to a large extent, justify pub-lic spending on health care. Results from benefit incidence analyses car-ried out in 2001 and 2006 are presented in this section.9
In general, public subsidies for health are not pro-poor in Indonesia.The poorest quintile of the population received less than 10 percent of allhospital subsidies in 2001 and 2006. Subsidies for nonhospital care weredistributed roughly proportionately in 2001, although not in 2006. Thetop two quintiles or the richest 40 percent of the population received65–70 percent of all hospital subsidies in 2001, although this declinedslightly to about 60 percent in 2007. The decline in the share attributa-ble to the richest two quintiles was due to a slight increase in the shareaccounted for by the middle quintiles. There was no improvement for thepoorest quintile.
Compared with other countries in the EAP region, Indonesia has oneof the least pro-poor distributions of public subsidies for health care.Figure 4.25 shows the share of total public hospital inpatient subsidiesaccounted for by the poorest quintile in a range of EAP countries. Inboth 2001 and 2006, Indonesia had a relatively small share of subsidiesgoing to the poorest groups and was comparable to a few provinces inChina. By contrast, in Hong Kong (China), Sri Lanka, Thailand, andMalaysia, the poorest quintile of the population accounted for over 20percent of the hospital inpatient subsidies. Public subsidies for health
Assessment of Health Financing Performance 81
Table 4.6 Benefit Incidence Analysis: Distribution of Public Health Subsidies by Income Quintile (2001 and 2006) (percent)
Household consumption
Hospital inpatient care
Hospital outpatient care
Nonhospital care
Indicator 2001 2006 2001 2006 2001 2006 2001 2006Poorest quintile 8 5 8 8 7 11 20 10
2nd 13 9 10 13 11 13 20 14
3rd 16 13 15 17 14 17 20 17
4th 22 21 30 25 26 23 26 23
Richest quintile 41 51 37 37 42 36 15 37
Concentration
index 0.3212 0.4497 0.3159 0.2980 0.3260 0.2605 –0.0241 0.2660
Sources: 2001– O’Donnell et al. 2008; 2006 – Harbianto and Hariyadi 2008; Bank staff analysis.

82 Health Financing in Indonesia
care are generally inequality-reducing in almost all countries in the EAPregion, including Indonesia (O’Donnell et al. 2008). Nevertheless, inIndonesia, this has been less a consequence of public spending policiesthemselves than the result of the high inequity in living standards over-all. Comparing concentration indexes across countries (not presentedhere) confirms the finding that public health subsidies are not pro-poorin Indonesia.
Equity in Health OutcomesIndonesia is characterized by large socioeconomic and geographic dispari-ties in health outcomes. While health outcomes could very well improveover time, if distributional issues in the health sector are not addressed thepoor will be left behind (Gwatkin and Guillot 2000). Many countries inthe EAP region, including Indonesia, that have made significant progresstoward achieving the Millennium Development Goals are still character-ized by large income inequalities in the use of services. Figure 4.26 showsthe large variations in the IMR and child mortality rate (U5MR) betweenIndonesian provinces. For example, in East Nusa Tenggara the combinedIMR and U5MR is 80, while it is less than 40 in Bali.
0
5
10
15
20
25
30
35
40
45
Shanxi pro
vince
(Chin
a) 2003
Heilongjia
ng (Chin
a) 2003
Zhejiang (C
hina) 2
003
Gansu (C
hina) 2
003
Indonesia
2001
Indonesia
2006
India 1996
Mongolia
Bangladesh 2000
Vietnam
2003
Malaysia
1996
Thailand 2002
Sri Lanka 2004
Hong Kong (Chin
a) 2002
po
ore
st q
uin
tile
sh
are
of s
ub
sid
y (%
)
Figure 4.25 Poorest Quintile Share of Public Hospital Inpatient Subsidies in EAPRegion
Sources: O’Donnell et al. 2008; Harbianto and Hariyadi 2008; Bank staff analysis.

Figure 4.26 Comparison of IMR and U5MR between Provinces (2007)
0
20
40
60
80
100
120
dea
ths
for e
very
1,0
00 li
ve b
irth
s
DKI Jakarta
East Kalim
antan
North SulawesEast
Java
DI Aceh
Bangka Belitung
Jam
biRiau
West
Java
South Sum
atra
South SulawesiLam
pungBante
nRiau Is
lands
West
Kalimanta
n
West
Sumatra
South-e
ast Sulawesi
West
PapuaPapua
Bengkulu
North Sum
atra
Central S
ulawesiGoro
ntalo
North M
aluku
South Kalim
antan
East Nusa
Tenggara
West
Nusa Te
nggaraM
aluku
West
Sulawesi
Bali
Central K
alimanta
n
Central J
ava
DI Yogyakarta
infant mortality child mortality
Source: DHS 2007.
83

84 Health Financing in Indonesia
Quality of Health Services
The responsiveness of health care is one important goal of the health sys-tem. Consumer dissatisfaction with health service is one of the main rea-sons for low health service utilization in Indonesia. Its measurement canbe based on consumers’ experiences with various aspects of health serv-ice, or their subjective level of satisfaction with various features of care,or expectations of care. The first of these three measures is considered toprovide relatively objective descriptions.
The Ministry of Health published the 2004 Survei Kesehatan Nasional(National Health Survey), or Surkesnas, report on responsiveness based onpatient experiences with seven aspects of care for outpatient settings, andeight aspects for inpatient (figure 4.27). The common aspects between out-patient and inpatient are waiting time, hospitality, information availability,involvement in decision making, private consultation, freedom of choice,and cleanliness; ease of family visit is unique to inpatient settings. Theaspect rated worst for both outpatient (33 percent) and inpatient services(30 percent) is the involvement of patients in decision making for theirtreatment. Second worst for outpatient is private consultation with healthproviders, while freedom of choice ranks second for inpatient services. Atthe other end of the scale, hospitality fares better, with only 14 percent of
Figure 4.27 Percentage of Dissatisfaction with Various Aspects of Service
18.3
26.8
27.3
32.8
24.1
13.6
26.1
11.6
21.7
27.9
25.6
29.7
24.2
17.2
21.7
0 5 10 15 20 25 30 35
family visit
cleanliness
freedom of choice
private consultation
involvement indecision making
information availability
hospitality
waiting time
percent
outpatient inpatient
Source: Surkesnas (National Health Survey) 2004.

outpatient respondents rating it unsatisfactory; for inpatients, family visitsrecorded a dissatisfaction rating of only 12 percent. Dissatisfaction ratesbased on experience are actually only slightly different from thosebased on subjective measurements from surveys, such as Susenas and theGovernance and Decentralization Survey 2 (GDS2).
GDS2, which did not distinguish between outpatient and inpatientservices, found that waiting times have a significant negative effect onconsumer satisfaction (figure 4.28). Conversely, availability of familyplanning services, including contraceptives, showed a significantly positivecorrelation. Also in GDS2, public health facilities received less favorableresponses compared with private ones, with fewer households visitingpublic health facilities expressing satisfaction compared to those visitingprivate health facilities (GDS2 2006).
The Indonesia Family Life Survey (IFLS) is, to date, the only sourceof information on the quality of health providers. The survey measurestechnical capacity of different types of health providers using clinicalcase scenarios. There was a 10-year gap between the quality measure-ments in IFLS 1997 and the most recent, in 2007. The IFLS 1997, ingeneral, suggested low knowledge of health providers in the case scenar-ios tested (figure 4.29). Private nurses, at times the sole provider inremote areas and mostly used by the indigent population, performedpoorly. Regional discrepancies in accessing quality care are shown by the
Assessment of Health Financing Performance 85
Figure 4.28 Outpatient and Inpatient Satisfaction Levels
Source: Lewis and Pattinasarany 2007.
58.1
65.259.7
32.2 31.3 32.3
7.73.3
7.21.2 0.2 0.90.9 0.0 0.0
0
10
20
30
40
50
60
70
GDS2 (N=7,916) Susenas-inpatient(N=19,294)
Susenas-outpatient(N=2,657)
per
cen
t
satisfied somewhat satisfied somewhat unsatisfied
unsatisfied no response

86 Health Financing in Indonesia
Comparison of standardized quality scores for Java-Baliand outer Java-Bali Indonesia, by clinical setting, 1997
–0.6 –0.4 –0.2 0 0.2 0.4 0.6
private nurses
private midwives
public auxiliary health centers
public health centers
private medical doctors
private nurses
private midwives
public auxiliary health centers
public health centers
private medical doctors
ou
ter J
ava-
Bal
iJa
va-B
ali
quality (standard deviation units)
child curative care adult curative care prenatal care
Figure 4.29 Quality of Care Comparisons
Source: Indonesian Family Life Survey 1997.
Note: Java-Bali is defined as provinces in Java-Bali. Outer Java-Bali is defined as provinces in Sumatera, Kalimantan,
and the eastern islands. Adults are defined as age 15 and older.
differences in performance of heath providers from Java-Bali and thosefrom Outer Java-Bali (Barber, Gertler, and Harimurti 2007). Preliminaryresults from an analysis10 of the 2007 IFLS show only slight improve-ments in quality of services, predominantly among private providers anddoctors. Nurses and midwives, although showing some improvement,continue to perform poorly.
The Current Health Policy Reform Baseline: Strengths and Weaknesses
Reforms should be predicated on building on the strengths of the currentsystem and dealing with its weaknesses in the context of expected future

demographic, epidemiological, and economic changes. The basic strengthsand weaknesses of the system define the current health policy reformbaseline. The preceding analyses provide a basis for enumerating thesestrengths and weaknesses and they are classified in the following discus-sion into management, governance, and underlying conditions; deliverysystem; and health financing issues.
Management, Governance, and Underlying Conditions
Strengths
• Through decentralization and democratization, many of the decisionsconcerning the health sector have been transferred to the district level,where governments can, in principle, more flexibly react to local cir-cumstances and demands.
• Health insurance programs covering civil servants and formal sectorworkers have been in place for many years.
• Framework legislation was passed in 2004 to achieve universal coverage.• The government is committed to reforming the system and has pro-
vided insurance coverage for the poor and near poor, funded throughthe budget.
• Dependency ratios for the next 25 years are favorable, giving Indone-sia the opportunity to capitalize on its potential “demographic bonus.”
• Educational and literacy levels are high relative to comparable-incomecountries.
• Despite the current global financial crisis, the future economic picturefor Indonesia is favorable.
Weaknesses
• The demographic, epidemiological, and nutrition transitions, and theattendant aging population, will place significant pressures on futurehealth care costs and delivery system needs.
• Such pressures will be exacerbated by increases in the labor force par-ticipation rates of women, which will result in a diminishing supply ofinformal sector care givers for the rapidly growing elderly population.
• Overall management of the health sector is highly fragmented acrossseveral ministries and among different levels of government.
• There are significant geographic and income disparities in availability,utilization, spending, and outcomes, and targeting has been a problem.
Assessment of Health Financing Performance 87

• The movement toward universal coverage has been challenging becauseof a lack of data for decision making, lack of actuarial studies of boththe existing baseline programs and universal coverage options, changesin direction about the final configuration of the system, and the needto coordinate the universal coverage effort with other envisionedhealth system and public health reforms.
• Significant improvements can be made with respect to both the costsand quality of pharmaceuticals, which account for some one-third ofhealth spending and a large percentage of OOP costs.
Delivery System
Strengths
• An extensive primary health care infrastructure makes physical accessavailable to most of the population.
• Utilization differentials between the poor and nonpoor have beennarrowing.
• Health worker densities per 100,000 population have improved.• Pharmaceuticals and supplies are generally available.
Weaknesses
• Certain critical health outcomes, such as maternal mortality, are poor,and improvements in others have stagnated.
• The health system is highly fragmented and underfunded, limitedwith respect to insurance coverage, and replete with allocative andtechnical inefficiencies resulting from, and in, low productivity.
• Compared with other similar income countries, the levels of bothphysical and human resources are low, and there are major shortagesof physician specialists.
• Given its geography, Indonesia is severely challenged to provide accessin rural areas, where some 70 percent of its population resides.
• The system is characterized by poor quality and inefficient servicedelivery—lack of professionalism (noncompliance with good practiceprotocols and high absenteeism), uneven deployment, and low moti-vation in the health workforce.
• Poor quality of care results in high levels of self-treatment.• Dual practice of public physicians impacts public sector access, effi-
ciency, and overall health system and OOP costs.
88 Health Financing in Indonesia

• There is a heavy reliance on the private sector for provision of healthservices without adequate oversight or quality assurance.
• Hospital occupancy rates are low—about 60 percent in 2006—andthere are large regional differences in hospital efficiency.
• There is little planning focused on overall needs and joint public-private sector capacity development.
Health Financing
Strengths
• For its income and health spending levels, which are low relative tocomparable-income countries, Indonesia does well in infant mortalityand life expectancy.
• Financial protection is relatively good with OOP payments constitut-ing a small part of household income, the poor spending proportion-ately less of their household incomes than the rich on health care, anda relatively small proportion of both the poor and nonpoor being driveninto poverty by catastrophic medical care expenditures.
• Equity in financing is relatively good because Indonesia’s health financ-ing sources—general taxes and social health insurance premiums—areprogressive.
• Consumers are generally satisfied with their freedom of choice.
Weaknesses
• Over half the population has no formal health insurance coverage.• Public subsidies for health care are not pro-poor with the richest one-
fifth of the population accounting for 40 percent or more of publichealth subsidies.
• The large number of informal sector workers (at least 60 million), thelarge rural population (some 70 percent of the population), and thefact that 85 percent of workers are employed by firms with fewer thanfive workers (World Bank forthcoming), pose major challenges in design-ing a contributory-based mandatory health insurance system.
• The current rules, enforcement, governance, and financing arrange-ments for Jamsostek limit risk pooling and insurance coveragethrough private sector financing for the large majority of formal sec-tor employees.
Assessment of Health Financing Performance 89

• Both Askes and Jamsostek enrollees face high OOP costs as a result ofvarious program design issues, limiting their financial protection.
• Little is known about the costs, impacts, and targeting effectiveness ofAskeskin/Jamkesmas.
• Provider payment systems are fragmented, and Indonesia lacks state-of-the-art, pay-for-performance systems needed to promote efficiencyand quality.
• Supply-side subsidies to public providers and lack of movement towardgreater autonomy preclude establishing a level playing field for publicand private providers to compete.
• Comprehensive fiscal sustainability and actuarial analyses of Jamkesmas,as well as universal coverage options, have not been undertaken.
A discussion of the processes and approaches for advancing Indonesia’shealth sector reform efforts to address these systemic issues follows inchapter 5.
Notes
1. This is based on the framework often used to assess performance ofOrganisation for Economic Co-operation and Development countries, and isdescribed in Hurst (2002).
2. This assessment is based on regression lines fitted to the international data.The comparisons use quadrant charts showing two sets of deviations fromregression lines simultaneously: (i) deviations from a regression line associ-ated with a specific indicator of health status to GDP per capita acrosscountries, and (ii) deviations from a regression line relating the same indi-cator of health status to health expenditure per capita across countries.This approach to comparing outcomes across countries makes it possible toallow simultaneously for the effects of both national income and healthspending.
3. The most recent data available are based on the new round of estimates for2005, which applied a more accurate estimation method for maternal deaths.As a result of more accurate recording of all pregnancy-related deaths, mostcountries saw an increase in their maternal MMR. Indonesia’s latest and mostaccurate estimate is 420 maternal deaths per 100,000 live births (WHO,UNFPA, UNICEF, and World Bank 2008). To be precise, with any MMR esti-mate there are high levels of uncertainty; for Indonesia, 420 per 100,000 isthe point estimate; 240 per 100,000 is the lower limit and 600 per 100,000the upper margin. Indonesia’s MMR is very high in regional comparisons.
4. Not including Gorontalo, North Maluku, and East Papua.
90 Health Financing in Indonesia

5. See ADB (2007) for a critical overview of methods for measuring macro-levelhealth system efficiency.
6. If payments for health are large relative to household resources, the disrup-tion to material living standards could be substantial and may be consideredcatastrophic.
7. A study of the targeting effectiveness of the Askeskin program in 2006 (Aranand Juwono 2006) found some leakage in health card distribution to thericher quintiles.
8. The catastrophic headcount is defined as the percentage of households incur-ring catastrophic payments relative to a predefined threshold. In this analysis,two thresholds are used: one is in relation to total household spending, andthe other in relation to household spending excluding food spending. The lat-ter is included to examine the extent to which payments for health care area significant burden on households once the biggest necessity—food—has beenexcluded. Thus, the catastrophic headcount could be measured as the per-centage of households for which health care payments account for more than15 percent of total household spending, or for more than 15 percent (or somehigher threshold) of nonfood household spending. The concentration index ofthe headcount measures the distribution of catastrophic payments amongrich and poor households. A key question here is as follows: do the poor beara disproportionate share of the incidence of catastrophic payments for healthcare compared with the rich? A positive index means that the incidence ofcatastrophic spending increases with household income, or that the rich aremore likely than the poor to incur catastrophic payments for health. A thirdmeasure, the rank-weighted headcount, reflects both the incidence and thedistribution of the catastrophic payments. If the likelihood of incurring cata-strophic payments is primarily concentrated among the rich, then the rank-weighted will be lower than the unweighted headcount.
9. For this analysis, the concentration index (Wagstaff and Paci 1991) provides asummary index of this comparison that is negative if the poor generallyreceive a disproportionate (to population) share of the subsidy. A negativeconcentration index indicates that the subsidy helps close the absolute gap inliving standards between the rich and the poor.
10. Analysis of the IFLS is ongoing. Results were not available at the time thischapter was written, but will be published in a forthcoming Health LaborForce Study by the World Bank.
Assessment of Health Financing Performance 91


93
Indonesia is one of a small number of middle-income countries to leg-islatively commit to providing universal health insurance coverage to itspopulation through a mandatory public health insurance scheme. LawNo. 40/2004 established the National Social Security System (GTZ2006). Coverage for the poor will be financed by the government andfinancing for the remainder of the population will be through a contrib-utory scheme. The legislation envisages the involvement of the existinghealth insurance carriers (including P.T. Askes and P.T. Jamsostek), pro-vided they convert to nonprofit status by October 2009. There is alsoprovision for local governments to opt out and establish their own “com-parable” systems. Figure 5.1 provides a graphic depiction of the plannedtransition from existing programs to the mandatory universal system.
This legislation, similar to most such framework laws, contains fewspecifics with regard to critical aspects of the new system, including tim-ing; transitional arrangements; exact roles of existing insurance entities; theexact form and governance structure of the ultimately unified nationalhealth insurer; breadth and depth of benefits covered (and their inherentaffordability and trade-offs between health outcomes and financial protec-tion), including copayments and residual public health functions of theMinistry of Health (MoH); contracting arrangements, provider payment
C H A P T E R 5
Key Policy Issues, Options, and Costs

mechanisms, and whether global expenditure caps will be employed andwhether extra billing of patients by medical care providers will be allowed;contribution levels; enrollment, premium levels, and methods for collectingpremiums from difficult-to-reach groups such as informal sector workers;and the role of private voluntary health insurance. There is also a provisionallowing local governments to opt out and establish their own comparablesystems, but the opt-out criteria are not specified.
This chapter, therefore, attempts to provide an appropriate structuredapproach for analyzing and costing the health insurance (HI) implemen-tation options for the National Social Security System in the context of
• the goals of health financing systems with respect to revenue collec-tion, risk pooling, and purchasing;
• the global evidence base on large-scale health financing reforms; • Indonesia’s socioeconomic realities; • the key policy issues that need to be addressed;• a framework for analyzing major health insurance reforms; and • the design elements and costing of the major transition options.
94 Health Financing in Indonesia
Organization and management
- each single existing carrier follow its own regulation- for-profit entities
PT. PT. PT. PT.
branch branch branch
branch branch branch branch branch
branch
president
5 years
PT PT PT PT
national social security council
PT
board board board board board
nationalsocial
securitycarriers
- national social security council directs main policy- national social security carriers implement the program, not for profit- synchronization of multiple schemes
j
a
m
s
o
s
t
e
k
a
s
k
e
s
t
a
s
p
e
n
a
s
a
b
r
i
j
a
m
s
o
s
t
e
k
a
s
k
e
s
t
a
s
p
e
n
a
s
a
b
r
i
i
n
f
o
r
m
a
l
Figure 5.1 Indonesia’s Transition to Universal Coverage under National Social Security Law No. 40/2004
Source: Ida Bagus Indra Gotama and Donald Pardede of the MoH.
Note: PT = Company ( Perseroan Terbatas).

Mandatory Health Insurance (MHI) Goals
The ultimate purpose of the reform is to improve health outcomes; provideIndonesians with financial protection from impoverishment resultingfrom large, unexpected health care costs; and ensure responsiveness of thesystem to consumers. The underlying incentives built into the healthfinancing reform will impact almost all aspects of system performance.Final system design and transition options need to be developed in thiscontext. Figure 5.2 summarizes these key goals, the importance of thedesign of the Basic Benefits Package (BBP) in achieving these goals, andsome of the specific criteria justifying public financing of MHI.
The revenue collection, risk-pooling, and purchasing arrangementsof current systems need to be analyzed and those for transitional pro-grams and for the final system need to be carefully designed. Revenuesneed to be raised and pooled equitably and efficiently, with an afford-able BBP that maximizes health outcomes and ensures financial pro-tection and consumer responsiveness. There will be difficult trade-offsbetween breadth and depth of coverage, which will have importantimplications for equity, financial protection, health outcomes, andcosts. Purchasing and contracting arrangements must be technicallyand allocatively efficient and, along with revenue collection efforts,will determine both the affordability and long-term financial sustain-ability of the program.
Key Policy Issues, Options, and Costs 95
financing functions• collection• pooling• purchasing
sustainableequitableefficient
affordable
health outcomesfinancial protection
consumer responsiveness
basic benefitspackage
public BBP criteria• cost-effectiveness• externalities• public goods• catastrophic costs• poverty• equity• rule of rescue• political
Figure 5.2 Health Financing Functions and the Importance of the Basic BenefitsPackage
Source: Gottret and Schieber 2006; Musgrove 1996; WHO 2000.
96 Health Financing in Indonesia
Because Indonesia has decided to move to a publicly funded MHIsystem, most of the rationales for public financing as shown in figure 5.2have been explicitly adopted by the government of Indonesia.Nevertheless, affordability considerations will place limits on the specificservices included in the BBP and there is a need to coordinate the financ-ing of public health services, which are the responsibility of the MoH,with the specific primary care and other personal health care servicescovered through the health insurance system. This issue needs carefulhandling because it is an area that has often created coordination prob-lems in other MHI systems (Gottret and Schieber 2006). Indonesia atpresent does not face a serious overall health expenditure problem.However, unless it adopts incentives-based provider payment mecha-nisms and overall expenditure caps, it is likely to face the cost-escalationpressures found in most mature health systems as it expands to univer-sal coverage (UC) and reduces its supply constraints.
The Global Evidence Base on Good Practices in Major MHI Reforms
Three recent World Bank studies provide guidance on the enabling condi-tions for successful health financing reforms. One study, GoverningMandatory Health Insurance: Lessons from Experience (Savedoff and Gottret2008), provides guidance from four case studies (Chile, Colombia, Estonia,and the Netherlands) on the types of governance arrangements needed foreffective management of MHI systems. Good Practices in Health Financing:Lessons from Low- and Middle-Income Countries (Gottret, Schieber, andWaters 2008) analyzes nine good practice cases of major HI expansions(Chile, Colombia, Costa Rica, Estonia, the Kyrgyz Republic, Sri Lanka,Thailand, Tunisia, and Vietnam) and their common enabling factors, whileHealth Financing Revisited (Gottret and Schieber 2006) discusses theenabling conditions for successful national health service (NHS), socialhealth insurance (SHI), community-based health insurance (CBHI), andprivate voluntary health insurance (PVHI) reforms.
Governing Mandatory Health Insurance responds to the lack of infor-mation concerning the key governance factors that affect the operationalimpact of MHI funds. For example, while a good deal of material coversissues such as setting premiums, benefits, and coverage rules, very littleaddresses such governance issues as supervisory boards, regulations,auditing, and accountability. These latter factors influence performancesignificantly and allow for dynamic self-correction. The study lays out in

detail the major factors underlying coherent governance and accounta-bility (table 5.1).
The study details good practices for implementing these governanceand accountability principles based on the case studies and other globalexperience. It also makes some interesting observations on the focus ofgovernance arrangements based on whether MHI schemes have a unitaryfund or multiple competing funds, and on appropriate roles for medicalcare providers:
• Number of insurers. With multiple and competing insurers, externaloversight mechanisms can pay less attention to efficiency and manage-ment, and focus more on consumer protection, inclusiveness, and pre-serving competition through antitrust actions. By contrast, countrieswith a single health insurer need external oversight mechanisms thatmake the insurer accountable for integrity, quality, and productivity.
Key Policy Issues, Options, and Costs 97
Table 5.1 Governance Factors
Dimension Features
Coherent decision-making
structures
1. Responsibility for MHI objectives must correspond with
decision-making power and capacity in each institution
involved in the management of the system.
2. All MHI entities have routine risk assessment and
management strategies in place.
3. The costs of regulating and administering MHI
institutions are reasonable and appropriate.
Stakeholder participation 4. Stakeholders have effective representation in the
governing bodies of MHI entities.
Transparency and information 5. The objectives of MHI are formally and clearly defined.
6. MHI relies upon an explicit and appropriately designed
institutional and legal framework.
7. Clear information, disclosure, and transparency rules are
in place.
8. MHI entities are subject to minimum requirements with
regard to protecting the insured.
Supervision and regulation 9. Rules on compliance, enforcement, and sanctions for
MHI supervision are clearly defined.
10. Financial management rules for MHI entities are clearly
defined and enforced.
11. The MHI system has structures for ongoing supervision
and monitoring in place.
Consistency and stability 12. The main qualities of the MHI system are stable.
Source: Savedoff and Gottret 2008.

• Provider-payer relationship. The effect of including providers’ represen-tatives in decision-making bodies will depend on whether this relation-ship is antagonistic or collaborative. When providers are directemployees of insurers, negotiations and oversight need to address civilservice and labor regulation issues; countries with independentproviders need governance mechanisms for transparent negotiationsover prices and payment mechanisms.
Good Practices in Health Financing: Lessons from Low- and Middle-Income Countries (Gottret, Schieber, and Waters 2008) identifies 15enabling factors derived from the nine good practice cases, which spannedthe range from SHI reforms to NHS models. These factors are consistentwith those in a previous Bank study that identified the key enabling fac-tors in high-income countries (Gottret and Schieber 2006). The 15enabling conditions for good practice reforms are grouped into threebroad categories: institutional and societal factors, policy factors, andimplementation factors (figure 5.3). While some of these conditions arepresent in Indonesia, others are not. Assuming Indonesia favorably weath-ers the current global financial crisis, it would appear that economicprospects are good. However, other important areas need to be more fullydeveloped, including information systems, evidence-based policy making,
98 Health Financing in Indonesia
institutional and societal factors
• strong and sustained economic growth
• long-term political stability and sustained political commitment
• strong institutional and policy environment
• high levels of population education
implementation factors
• coverage changes accompanied by carefully sequenced health service delivery and provider payment reforms• good information systems and evidence-based decision making• strong stakeholder support• efficiency gains and copayments used as financing mechanisms• flexibility and midcourse corrections
policy factors
• commitment to equity and solidarity
• health coverage and financing mandates
• financial resources committed to health, including private financing
• consolidation of risk pools
• limits to decentralization
• primary care focus
Figure 5.3 Enabling Factors in Health Financing Reforms
Source: Gottret, Schieber, and Waters 2008.

use of efficiency gains and copayments, and recognition of limits todecentralization.
Health Financing Revisited (Gottret and Schieber 2006) identifies theenabling factors for successful implementation of all types of health insur-ance reforms. For successful implementation of contributory SHI systems(figure 5.4), this study highlights the importance of a large formalemployment sector and concentrated urban populations—neither ofwhich are found in Indonesia—as well as administrative capacity, whichmay be lacking to some degree in Indonesia’s current insurance system,particularly in areas such as provider payment.
Socioeconomic and Institutional Realities Affecting the Design of Policy Options
In light of the above policy issues and global experience, it is apparent thatin scaling up to achieve UC through a mandatory contributory health insur-ance system, some important underlying factors need to be taken intoaccount in designing policy options. These factors relate both to the under-lying socioeconomic conditions and characteristics of the insured anduninsured and to existing public and private health insurance programs.
Key Policy Issues, Options, and Costs 99
• A growing economy and level of income able to absorb new contributions
• A large payroll contribution base and thus a small informal sector
• Concentrated beneficiary population and ncreasing urbanization
• A competitive economy able to absorb increased effective wages arising from increased contributions
• Administrative capacity to manage rather complex insurance funds and issues such as management of reserves, cost containment, contracting, and others
• Supervisory capacity to overcome some of the market failures, such as moral hazard and risk selection, as well as other important matters such as governance and sustainability
• Political consensus and will
Figure 5.4 Enabling Conditions for Social Health Insurance
Source: Gottret and Schieber 2006.

Table 5.2 provides a useful template for decision makers as they deter-mine how to identify uncovered and covered groups by their income andemployment status; seek contributions from individuals and employers;and decide which groups to finance or subsidize from the governmentbudget, be they the poor and disadvantaged or small employers with lim-ited ability to pay. It is critical for Indonesian policy makers to understandthe numbers of currently insured and uninsured, based on their healthstatus, employment status, ability-to-pay status, and geographic locationto effectively design and cost transition policies. High levels of informal-ity, a large rural population, large numbers of self-employed and workersin small firms, and significant numbers of poor and near poor in Indonesia(table 5.2) will pose serious challenges to developing a large contributorybase and to ensuring delivery capacity in rural areas in the country’shighly supply-constrained health system.
A detailed breakdown of both the insured and uninsured by theiremployment status, health risk status, location, income level, and familycharacteristics is needed to cost reform options. For example, detailedanalyses of the 2007 Susenas data (figure 5.5) provide information about
100 Health Financing in Indonesia
Table 5.2 Population Employment Composition (percent of population 15 and older)
Employment status Total
Lowincome
Middleincome
Highincome Poor Nonpoor
Employed 64.98 12.13 39.20 13.66 9.56 55.42
Establishing new
business 0.19 0.03 0.11 0.05 0.02 0.17
Education 7.43 0.74 4.24 2.45 0.71 6.72
Housekeeping 18.67 3.47 11.31 3.89 2.95 15.72
Others 5.49 1.30 3.27 0.92 1.08 4.41
Formal 42.53 3.81 23.97 14.75 3.51 39.02
Informal 57.47 14.86 36.34 6.27 11.20 46.27
Self-employed 21.75 3.62 14.42 3.71 3.04 18.71
Self-employed as
temporary workers 16.86 4.17 10.62 2.08 2.93 13.93
Employer 3.21 0.22 1.61 1.38 0.18 3.03
Employee 32.66 2.83 18.20 11.64 2.73 29.94
Unpaid and casual
workers 25.51 7.84 15.47 2.21 5.84 19.68
Farmers 38.82 12.56 23.96 2.30 9.04 29.78
Source: Susenas February 2007, modified from Hsiao (2008).
Note: Categories do not always add to 100 percent; categories are not mutually exclusive.

the income status of the insured and uninsured. Appendix 1 provides aneconometric analysis of the health care utilization differences betweenthe insured and uninsured.
These data have clear implications for the transition path to UC:
• The large level of informality (60 percent of the labor force or morethan 60 million people) makes it difficult to identify and obtain con-tributions from this segment of the population.
• Based on the government’s definition of poverty, about 70 millionpeople are poor or near poor, necessitating government financing for asubstantial proportion of the population.
• Using a higher US$2/day definition of poverty, over 50 percent of thepopulation (more than 100 million people) could be defined as poor.
• Some 70 percent of the population lives in rural areas, and the geogra-phy (7,000 inhabited islands) makes it difficult to achieve scale andscope economies in service availability.
Key Policy Issues, Options, and Costs 101
0
10
20
30
40
50
per
cen
tag
e o
f gro
up
0
10
20
30
40
50
per
cen
tag
e o
f gro
up
0
10
20
30
40
50
per
cen
tag
e o
f gro
up
0
10
20
30
40
50
per
cen
tag
e o
f gro
up
poorest 2nd 3rd 4th richestexpenditure quintiles
poorest 2nd 3rd 4th richestexpenditure quintiles
poorest 2nd 3rd 4th richestexpenditure quintiles
poorest 2nd 3rd 4th richestexpenditure quintiles
a. No insurance (74% of population) b. Askeskin/Jamkesmas (14% of population)
c. Askes and Jamsostek (8% of population) d. Other (4% of population)
Figure 5.5 Distribution of Insurance Coverage by Income Quintile for DifferentPrograms
Source: Susenas 2007.
• The unemployment rate is relatively high at 8.4 percent (BPS 2008),again necessitating government financing support for this group.
• Some 85 percent of all workers are in firms of fewer than five workersand 38 percent are in firms of only one worker. This raises serious con-cerns about obtaining employer contributions from these entities.
Key Policy Questions for Major MHI Expansion
Broadly speaking, an evaluation of the impact of a major HI expansionshould be based on the following three scenarios:
• An accurate picture of the current health system (the baseline) isneeded, including data on health spending, insurance coverage, andavailability and use of services.
• Projections of the future health system, starting from the baseline andassuming no reform, are needed so that policy makers can understandthe need for reform and its design aspects.
• Projections of the future system after the reform are needed so thatpolicy makers and the public can understand the likely effects of thereform.1
Basic Benefits PackageThe BBP and cost-containment mechanisms are two of the most criticaloperational factors in achieving the desired goals for a health system. Allgovernments face difficult trade-offs between consumer expectations andaffordability, and potential trade-offs between health outcomes and finan-cial protection, and between equity and efficiency, and must also dealwith political-economic realities such as ensuring adequate quality so thatthe better-off also use and politically support the system.2 The BBP is oneof the critical features that will (along with demand-side and providerpayment factors) determine the outcomes of a HI system.
In designing the implementation of MHI in Indonesia, the followingfactors must be considered as part of the BBP development process3:
• Development of criteria for prioritizing elements of the BBP• Strategies for reaching consensus on those element (with the medical
profession, with members of society, with interest groups)• Dealing with services not included in the package• Evaluation of the health and financial protection impacts of the package• An approach for the transition process
102 Health Financing in Indonesia

• A framework for providing the package;• Determining the cost of the package;• Determining how to finance the basic package;• Defining the beneficiaries of public subsidies; and• Development of methods for channeling public subsidies.4
Provider Payment SystemGiven Indonesia’s current system, a further critical element is the methodfor paying providers. The methods by which providers are paid and thelevels of payment have important implications for costs, quality, andaccess (Langenbrunner and Somanathan forthcoming). Indonesia lacksthe pay-for-performance systems and contracting arrangements found inmost developed, and an increasing number of developing, countries. Indesigning and implementing new provider payment systems, the follow-ing tasks should be undertaken:
• Define the services covered (the BBP).• Obtain service unit cost information.• Define an efficient level of service provision costs.• Set payment levels to cover costs of efficient provision.• Evaluate administrative costs of options, including costs to other payers,
providers, and consumers.• Choose payment method(s) that may vary by provider type.• Develop contracts among payers, providers, and consumers.• Develop management information and quality monitoring systems at
payer and provider levels.• Provide appropriate training for payer and facility personnel and provide
information to consumers on how to use the new system.• Develop a regulatory structure, including an appeals process.• Demonstrate and evaluate the payment system in sample facilities,
practice settings, and geographic areas.• Modify the payment system and implement it countrywide.• Undertake any necessary complementary delivery system restructuring
and manpower training reforms.• Monitor cost, quality, and access, and revise the payment system
periodically.
Figure 5.6 provides an example of the types of payment systems thatare consistent with different health system organizational arrangements.Each arrangement has positive and negative incentive effects with respect
Key Policy Issues, Options, and Costs 103

104 Health Financing in Indonesia
less feasible
independentMD practicesand hospitals
primary caregroup
practices
continuum of organization
hospitalsystems
integrateddeliverysystems
more feasible
global paymentper enrollee
global DRG case rate,hospital and postacute care
con
tin
uu
m o
f pay
men
t b
un
dlin
g
global DRG case rate,hospital only
global fee forprimary care
blended FFS/medical fee
FFS
Figure 5.6 Provider Payment Mechanisms and Health System Organization
Source: Guterman et al. 2009.
Note: DRG = Diagnosis-related group; FFS = fee for service.
to costs, quality, and access. In addition to the payment method used, thelevels of payment are also critical. In practice, most of the more advancedsystems are combinations of the base payment mechanisms designed tomaximize the strengths of the arrangements used while mitigating theiroverall weaknesses.
Indonesia is in the early stages of developing its policies on providerpayments, designing its payment mechanisms, and implementing them aspart of the health financing reform. This is an important but, thus far, neg-lected area of reform. The existing system relies on various combinationsof primary care capitation, salary, and fee-for-service insurance reimburse-ment mechanisms. While Indonesia is to be applauded for its ongoingefforts to develop a diagnosis-related group system for paying hospitals,many countries have found that such systems often need to be accompa-nied by additional efforts to transfer risk to providers, including expenditurelimits, a single payer, and various managed-care elements such as selectivecontracting, various utilization management techniques, and withholdingpayments for penalties and bonuses.
Opt-Out ProvisionsAnother complexity arising from Law No. 40/2004 is an allowance forlocal governments to opt out of the national system so long as they

provide comparable coverage. Such opt-outs could exist side-by-side withany of the above national system models as well as the options forIndonesia discussed below.5 A review of the local schemes (Gani, Tilden,and Dunlop forthcoming) observes that there are two types of health riskprotection plans developed by subnational governments: health insuranceand generalized subsidy (free health care). The MoH recorded 36 localhealth insurance schemes in mid-2007, while 60 districts implementedfree health care. These local schemes vary widely in organizational struc-ture, funds flows and management, provider network and payment, andmember criteria. Gani, Tilden, and Dunlop also note that, in general, thetechnical capacity of these schemes and the oversight capacity of localgovernments are weak, and both the legal basis for these schemes to oper-ate and technical standards need to be established.
It is important for policy makers to continue to document and evaluatethese local pilot opt-out projects. Information relevant for national pro-grams can be acquired, including how local programs are structured andfinanced (such as through local and individual contributions), how medicalcare providers are paid, and their successes and failures. While the publicfinance literature provides a strong basis for local allocational decisions, crit-ical national issues of equity, redistribution, and sustainability must beaddressed, in addition to issues regarding local capacity. Are local opt-outsviable only for rich areas? How can such opt-out possibilities be structuredso that rich areas also continue to support the national system and thenation’s poor? How can poorer localities be guaranteed the fiscal capacityto fund local systems to meet at least the minimum national standards,given their potentially greater health needs? In sum, local opt-outs havestrong advantages but also raise important equity and financing issues if UCis to be provided through a uniform national mandated set of benefits.
Private Voluntary Health Insurance While the government of Indonesia has mandated a public UC system,PVHI may still have an important role. If opt-outs are allowed, as they arenow for Jamsostek, employers must be compelled to live up to their socialresponsibilities and to provide and purchase PVHI efficiently. The adverseselection and moral hazard issues associated with PVHI mean that thegovernment must have an effective regulatory framework in place to bothprotect consumers and create an operating environment that allows sur-vival of the insurance industry. Another important issue is whether sup-plementary PVHI policies designed to cover the expenses of cost sharingrequired in the public system will be regulated. If such policies are
Key Policy Issues, Options, and Costs 105

106 Health Financing in Indonesia
permitted (they are not allowed in some Canadian provinces), overall pub-lic expenditures will be higher because individuals will use more publicservices if they have their cost-sharing requirements essentially eliminated.These are all issues the Social Security Council6 needs to address.
Pharmaceuticals ReformAnother key area of reform, the subject of a World Bank policy note, concerns the transitional risks and potential opportunities with respect topharmaceuticals (Hawkins et al. 2009). The study discusses risks andopportunities both under existing programs and under the Law No.40/2004. The P.T. Askes system for managing drug expenditure has manygood practice features: (i) a formulary based on independent, scientificadvice; (ii) priorities linked to budget availability; (iii) prescribing protocolsfor high-cost drugs; (iv) competition to obtain discounted prices for drugslisted in its Daftar Dan Plafon Harga Obat (drugs price list); (v) publicationof the price list; and (vi) paying pharmacists fixed fees and declining mar-gins instead of a percentage mark-up. P.T. Askes uses about 25 percent of itshealth expenditure for drugs, and has brought this percentage down overtime. The similar figure for Jamsostek is about 40 percent. Jamkesmas paysprices similar to those paid by Askes for the drugs it purchases but offers itsmembers very little choice (unbranded generics only for items in its formu-lary), and it has no capacity to control off-formulary prescribing or to mon-itor the availability of discounted drugs to its members.
In the medium to long term, methods of paying hospitals should bedeveloped to include the costs of drugs in the price for inpatient servicesand most outpatient services. Those methods should be accompanied bymeasures to encourage hospital managers to adopt and implement formu-laries, to strengthen their influence on what drugs their doctors prescribeand how they prescribe them, and to procure drugs at lower prices.The changing burden of disease in Indonesia—with increases in non-communicable diseases such as diabetes, and in cardiovascular disease riskfactors—makes this an important public health issue. An incrementalapproach to expanding and managing outpatients’ benefits would makesense to ensure fiscal sustainability, beginning with high-burden condi-tions and risk factors amenable to low-cost prevention and treatment. Useof treatment protocols, including drugs, by SHI carriers is one means ofmanaging this expenditure, and is already in use to some extent by Askesand Jamsostek. But as the caseload of patients with chronic diseasesincreases in primary care, this approach becomes costly and complex tomonitor, and complementary approaches are needed (such as using
primary care provider payment and contracting, prescriber monitoringand feedback, and use of pharmaceutical benefits management services).
It is desirable to have a single drug formulary as part of the benefitspackage for the implementation of Law No. 40/2004. Decisions will needto be made about how each SHI carrier will set reimbursement rates formedicines, how much choice of product they will allow, and how theywill deal with prescribing outside the formulary. One option would be toscale up on a nationwide basis the approach used by Askes. Anotheroption, if there are multiple funds, would be to allow each health insur-ance fund to develop its own system of setting reimbursement prices.There are trade-offs: multiple formularies and reimbursement priceschedules for different insurers creates complexity for health careproviders and increases control and monitoring costs.
In concept, a single national system for establishing the formulary andsetting drug reimbursement rates is potentially more efficient, and couldachieve greater downward pressure on drug prices. The governance,transparency, and administrative efficiency of the system would be cru-cial, however, and there are practical and political considerations in acountry as large and diverse as Indonesia. Such a system would becomethe focus of very strong lobbying from diverse industry interests. Thechallenge of controlling fraud, monitoring availability of reimbursabledrugs, and monitoring and managing out-of-formulary prescribing for amuch-expanded scheme is enormous. It takes several years of develop-ment and capacity building to get such a system working. Simpler, lesssophisticated control mechanisms would be needed while this type ofsystem is developed.
Many high-income countries with universal health insurance usenational price regulation to set standard prices that their health insurancefunds use as the basis for reimbursing prescription drugs. There has beena global trend toward including the cost of drugs in an overall price percase or global budget payment for hospitals. This makes the hospital man-agement responsible for controlling the prescription and prices of medi-cines. It also requires a change of mind-set among hospital managers, fromseeing pharmacy as a profit center to seeing it as a cost center. It wouldrequire an increase in medicines management and purchasing capacity inhospitals. If medicines and supplies purchasing agencies (or contractedprivate logistics agents) are established, public hospitals would be able tobenefit from large volume procurement. The transition to these newmethods of payment would also require support for hospital managers toreview the way they contract with retail pharmacies in hospital sites to
Key Policy Issues, Options, and Costs 107

serve their patients. Clearly, there is a large agenda here that needs to beaddressed by the Social Security Council.
An Operational Analytical Framework for Addressing Issues
Table 5.3 provides a detailed framework for describing options for theexpansion of health insurance coverage in Indonesia.7 Across the top ofthe table are listed three possible reform scenarios discussed in detail
108 Health Financing in Indonesia
Table 5.3 Framework for Describing Major Features of HI Reform Proposals
Element
Option 1Jamkesmas
for all
Option 2Single-fund
MHI
Option 3Multiple-fund
MHI
1. Eligible groupsUniversal coverage
Single risk pool
Multiple risk pools – risk adjustment
Definition of eligibility unit
Targeting mechanisms
Current public programs changed or
expanded
Uncovered groups
2. Benefits coveredStandard national BBP
Multiple BBPs
Positive-negative lists
Copayments and cost sharing
Other limits on benefits
Extra billing
3. FinancingPremiums
• Rating basis: risk vs. community
• Individuals
• Employers; opt outs
• Provincial and local governments
Subsidies and incentives
• Poor and near poor
• Informal sector workers
• Small employers and other employers
• Other
National revenues including earmarked
revenues
Provincial and local contributions
(continued)

Key Policy Issues, Options, and Costs 109
Table 5.3 Framework for Describing Major Features of HI Reform Proposals (Continued)
Element
Option 1Jamkesmas
for all
Option 2Single-fund
MHI
Option 3Multiple-fund
MHI
Provider payment mechanisms
• Methods
• Payment levels
• Levels of risk sharing
• Selective contracting
• Scope
Global expenditure caps
Fiscal sustainability criteria
4. Key implementation steps and datesNumber of years for transition to UC
Phase-in schedule
5. Other key elements of reformOversight and governance roles of national,
provincial, and local governments
Roles of MoH, other agencies, and current
public insurers
Changes to intergovernmental fiscal
structures and flows
Participation of private providers
Quality assurance: measures and
administration (public, independent
agency, self-regulation)
Efficiency measures
Provincial and local employer opt outs
Role and regulation of PVHI
Expansions and changes in delivery system
including supply-side subsidies to public
providers
Other demand-side measures such as
conditional cash transfers
Source: Adapted from Collins, Davis, and Kriss 2007; Collins et al. 2007; and Davis, Collins, and Kriss 2007.
below. This framework defines the key building blocks for the UC policyoptions, which will also determine costs, sustainability, equity, efficiency,health outcomes, and financial protection impacts of the policies chosen.The Social Security Council and key policy makers need to address eachof these issues in designing and costing the various UC reform options.Table 5.4 lays out the types of cost and coverage impact analyses thatneed to be undertaken in assessing the effects of the different options on

the key financing entities of the national government, provincial and localgovernments, private employers, and households.
This discussion is meant to be illustrative of both the manifold aspectsof comprehensive health insurance reform and the kinds of impact evalu-ations on costs, access, equity, and numbers of uninsured that should be
110 Health Financing in Indonesia
Table 5.4 Framework for Assessing Cost and Coverage Impacts of UC Options
Indicator2008
(baseline) 2010 2015 2020UC target
year
1. Number of uninsured
(millions)
2. Change in numbers of
uninsured newly covered
3. Net costs of newly covered
uninsured from previous
cited year (millions of Rp)
• Total
• National government
• Provincial governments
• Local governments
• Private employers
• Households
4. National health expenditure
• Total
• Share of GDP
• Public share
• Out-of-pocket as a share of
total
• Percentage annual changes
from previous cited year in
nominal and real terms
– Total
– Per capita
5. Change in national health
expenditure from previous
cited year (millions of Rp)
• Total
• National government
• Provincial governments
• Local governments
• Private employers
• Households
6. Equity: change in average
household health spending
by annual income quintile
Source: Modified from Collins et al. 2007.

undertaken. As the government develops and implements its MHI system,these issues need to be considered in the design, evaluation, and costingstages of the policy options.
Design and Costing of MHI in Indonesia
Designing and costing each transition option and the final UC configurationdepend on existing institutional arrangements, administrative capacity, andpolitical economy and macroeconomic considerations. Such efforts alsorequire demographic, socioeconomic, and cost information, all of whichneed to be analyzed through appropriate public health, actuarial, economic,political, and sociological lenses.
Current RealitiesIn addition to the socioeconomic realities previously discussed, the designand costing of the transition to steady-state UC as well as the long-termcosts and sustainability of the system will be heavily influenced by thecurrent baseline public insurance programs. Chapter 3 provided the latestavailable information on program enrollment and the targeted 76 millionpoor and near poor who were covered by Jamkesmas in 2008. Of the48 percent of the population with HI coverage in 2008, some three-quarters (in principle, the poor and near poor) were covered throughJamkesmas, financed by general revenues from the central governmentbudget, while Askes, Jamsostek, and PVHI covered the remaining 25 percentof those with insurance.
Specific design features of the existing health insurance programscould have important implications for the transition to UC for theremaining nonpoor segments of the population:
• Because of firm size restrictions, wage ceilings, and opt-out provisions,the current social insurance program, Jamsostek, only covers about 15 percent of all formal sector workers, that is, some 4.1 million work-ers and dependents. The International Labour Organization and AsianDevelopment Bank estimate that as many as 100 million people couldbe covered through this contributory system if these restrictions arelifted (ILO 2003; ADB 2007).
• While the BBPs among the three major existing programs are similar(table 3.2), Jamsostek does not cover certain catastrophic conditions,and Askes and Jamkesmas require beneficiaries to use public facilities.In addition, extra billing is rampant in both Askes and Jamkesmas,denying beneficiaries effective financial protection and failing to curbprivate health spending.
Key Policy Issues, Options, and Costs 111

• Modern provider payment and purchasing mechanisms are largely absent, and public supply-side subsidies for capital expenditures andstaff salaries in public hospitals preclude both the effective use ofprovider payment incentives to encourage efficient individualprovider behavior and the creation of a level playing field between thepublic and private sectors.
• The complex intergovernmental fiscal situation and the inequities andinefficiencies in the Dana Alokasi Unum (general allocation fund), orDAU, and Dana Alokasi Khusus (special allocation fund), or DAK, mech-anisms, along with the vague language in Law No. 40/2004 concerninglocal and regional contributions, make designing financing options thatrequire local contributions a serious challenge.
Practical Issues in Options DevelopmentIn developing practical options for the implementation of UC, two criti-cal areas need to be addressed: (i) the ultimate steady-state system envis-aged needs to be defined, and (ii) the transition steps to get to the steadystate system need to be enumerated. Figure 5.7 displays the transitionsteps that most developing countries have followed as they moved towardUC. In most ways, Indonesia represents a typical middle-income countrywith a fragmented system composed of social health insurance programsfor public and private sector workers and government funding for thepoor and disadvantaged. The question is, where will Indonesia wind up?
112 Health Financing in Indonesia
Low-incomecountries
Middle-incomecountries
High-incomecountries
Patient out-of-pocket
Socialinsurance
Governmentbudget
Communityfinancing
Private insurance
Patient out-of-pocket
Socialinsurance
Governmentbudget
Patientout-of-pocket
National healthservice
Mandatory healthInsurance
Private insurance
Government budget,ministry of health
Figure 5.7 Evolution of Health Financing Systems
Source: Authors.

Reform OptionsThe Social Security Law, as enacted, appears to envision a single nationalmandatory health insurance system based on social health insurance andequity principles—contributions from the employed and governmentcontributions for the poor and others unable to pay (GTZ 2008;Thabrany 2005; World Bank 2008c; ILO 2003). Existing public healthinsurance programs would convert to nonprofit entities and be absorbedinto the administrative structure of the MHI system. There are, however,various possible permutations of this approach, including having a singlenational MHI system based on multiple programs for different groups, asis the case in the Philippines, Thailand, and Turkey. 8
Several challenging policy decisions are embedded in a multiple pro-gram approach. Will there be multiple public or private (or both publicand private) HI mechanisms with a separate program run by the govern-ment for the poor and perhaps informal sector workers? Will benefits bestandardized across these programs? Will beneficiaries have access to thesame range of public and private providers? Will extra billing by certainproviders (for example, private providers) be allowed? How will financ-ing work? Will there be cross-subsidies among programs based on bothdifferential risks and ability to pay? How will the government create anequitable reimbursement program between public and private providerswhen public providers receive significant supply-side subsidies in theform of general budget contributions for salaries and capital costs inde-pendent of the HI reimbursement systems? Could there be an employermandate for all private employers to purchase private health insurancepolicies for their employees and dependents?
Another fundamentally different approach to MHI (albeit consistentwith the recent creation and expansion of Jamkesmas), which might wellrequire new legislation, is to extend Jamkesmas to the entire population,in effect creating an Indonesian NHS as in Sri Lanka and Malaysia. AnNHS system pools population health risks at the national level, with thesystem financed by the general budget. Whether this NHS-type approachor a single- or multiple-fund MHI approach is chosen will depend onpolitical economy considerations, and ideally on which approach can bestachieve sustainable, equitable, and affordable improvements in healthoutcomes, financial protection, and consumer responsiveness.
Based on deliberations of the Social Security Council, as well as theperspectives of key high-level policy makers, there appear to be two basiccompeting long-term visions under serious consideration, in addition toa willingness to allow local experiments (opt-outs) in health insurance
Key Policy Issues, Options, and Costs 113

coverage to continue. Although much of the focus has been on a singlefund MHI system, given the potential transition paths as well as the factthat several regional partners have adopted a multiple program approach,a third option embodying this approach is also presented.
Option One: Jamkesmas for All (An Indonesian National HealthService). The first approach approximates an NHS like those in Sri Lankaand Malaysia. It reflects the fact that over half the Indonesian popula-tion are poor or near poor, and thus have very limited ability to pay. It alsorecognizes the inherent difficulty of identifying the more than 60 percentof workers who are in the informal sector and having them pay premi-ums. By covering formal sector workers through general revenues, firmsmight be more competitive because their 3–6 percent payroll contribu-tions would be eliminated or could be replaced by more efficient andequitable taxes.
Option Two: A Single Integrated MHI Fund. This approach approxi-mates the new national SHI model (now called MHI), in which MHIwould be funded through both wage-based contributions (perhaps sharedbetween employer and employee) for public and private sector workers(and retirees) and general revenue contributions by the government forthe poor and other disadvantaged groups. Under this approach therewould be a single standardized national HI fund (although multiple fundscould be established, as in Germany or Japan). The government wouldneed to decide if informal sector workers would be covered like the poor(as in Thailand) or whether mechanisms can be developed to effectivelyidentify them and have them contribute some share of their earnings.
Option Three: Universal Coverage through an MHI System. Thisapproach could be conceived of as a variant of Option Two or a combina-tion of Options One and Two. Such a system would incorporate a singleset of rules applying to multiple SHI and NHS-type programs. Existingprograms would be scaled up to include the entire population. All the poorand other disadvantaged groups would be covered through Jamkesmas. Allprivate sector workers would be covered through Jamsostek (possiblythough elimination of the opt-out, employer size, and wage ceiling restric-tions and adding requirements to cover retirees). Civil servants and civilservice retirees would be covered through Askes (or the Askes programcould be folded into Jamsostek, or conversely).9 A decision would need tobe made about how to handle informal sector workers. The three programs
114 Health Financing in Indonesia

would have separate administrative structures but would operate underthe same set of rules concerning issues such as benefits, contracting forservices, and provider payment. Cross-subsidies across programs might berequired on the financing side.10
The three options would all result in UC and all would have sufficientlylarge numbers of enrollees for effective risk pooling. Efficiency, equity, andfinancial sustainability are major issues under all the options and theirachievement will depend on the extent of the BBP, cost sharing, paymentand contracting arrangements, and gradual elimination of supply-side dis-tortions. Option Three would probably have higher administrative costsand might require risk-adjusted transfers, but in certain respects is a lessdrastic change from the current system.11 However, depending on the howdiligently the “single set of rules” is implemented, it could also lead toinequalities across programs. The Philippines, Thailand, and Turkey have allimplemented UC systems like this and all have encountered such prob-lems. However, from a political economy perspective, they found thisroute the most practical way to move to UC. Treatment of informal sectorworkers is a major issue in all three countries. While Turkey and thePhilippines are attempting to make informal sector workers pay premi-ums, Thailand decided to cover them through general revenues because ofthe difficulties discussed above. Provider payment reforms and differencesin benefits are still issues, as are differential copayments, access to privateproviders for certain programs, and extra billing. All these issues are alsogermane to Options One and Two, although having a single uniformnational program makes it easier to use the full market clout of the publicHI program to deal with medical care providers.
Transition OptionsGiven the complexities and realities of health reform, complete zero-basedoverhauls of health financing systems are rare; virtually all policy makersfocus on transitioning existing systems to fulfill their collective policychoices through incremental change. All three of the major existing pro-grams in Indonesia pool revenues and provide coverage against catastrophicmedical expenses, although, because of benefit limitations, wage ceilings oncontributions, extra billing in Jamsostek, and limited formularies and prohi-bitions on private provider use in Askes, enrollees in these programs facesignificant out-of-pocket payments. As discussed above, in 2008 some45 percent of the population was covered through these (and othersmaller) public programs and another 3 percent of the population had pri-vate insurance. Some 52 percent of the population lacks formal coverage.
Key Policy Issues, Options, and Costs 115

Thus, policy makers need to choose the specific configuration for theUC system described in Law No. 40/2004, and then develop options tophase up coverage through existing or new transition programs. Accordingto 2006 figures, 74 percent of the population (about 50 percent accordingto MoH 2008 estimates), are not yet covered, but who they are, whetherthey are informally employed or not at all, where they are, and what theirfamily circumstances are, are not known. This information is critical forestimating the costs and likely outcomes of UC.
With regard to transition, the government has significantly expandedJamkesmas, which is commendable on equity grounds and is compatiblewith all three options. An expansion of Jamsostek through eliminatingthe firm size limitation, opt-out provision, and raising or eliminating thewage ceiling would be a logical way to improve risk pooling for thosewho can afford to contribute without large government subsidies.12 Suchan expansion would also be consistent with Options Two and Three. TheILO study (2003) suggested that up to 100 million people (full-timeworkers and dependents) might be covered through this type of expan-sion, which would reduce the numbers of uninsured in Indonesia by25–30 percentage points. The issue of full-time informal sector workersis, as discussed above, a major policy dilemma under all options exceptOption One. There are clearly also issues regarding the possible need forpublic subsidies for small firms (fewer than five workers), which cur-rently employ 85 percent of the workforce.
Issues in CostingCosting out the broad options described above requires precise informationon eligibility criteria, benefits covered; cost sharing, financing, and premiumarrangements; provider payment and contracting mechanisms; and thebehavioral responses of consumers and suppliers. Equally critical is assess-ing the baseline costs of the current programs, but this will be challengingfor a number of reasons: unit cost information is lacking; detailed utilizationinformation is lacking; there is a lack of clarity on the BBPs; and informa-tion on Jamkesmas generally reflects budgeted payments, not the true costsof the program because in the past, hospitals were not paid or paid late. Inaddition, there is no relationship between actual costs of services providedin Puskesmas to Jamkesmas beneficiaries and the Rp 1,000 monthly capita-tion payment, which is based on number of program-eligible people in thecatchment area. Payments by all three programs are based on out-of-datefee schedules and much of the actual costs of care in public facilities is offset through supply-side subsidies to providers in the form of salaries paid
116 Health Financing in Indonesia

to public sector employees and government-financed capital expendi-tures. Jamkesmas and Askes beneficiaries often face large out-of-pocketcosts for out-of-plan provider use and other program limitations. Thereare also serious supply constraints because of geography, and limitednumbers of physicians and specialists, in particular, which result in lowutilization levels.13
Obtaining appropriate data, including claims data, to do actuarial cost-ing studies has also been difficult. Several studies have attempted to assessthe actuarial costs of coverage expansions to achieve UC. One study esti-mated that to cover actual costs for Askeskin, premiums should be on theorder of Rp 8,500, 60 percent above the current levels (Hasbullah 2007).
A second study, which assessed willingness to pay for the SocialSecurity BBP, showed a willingness to pay between Rp 3,500 to Rp13,500 depending on the BBP (Mukti and Riyarto 2008). Another studyof scaling up the existing programs to achieve UC with a standard BBPshowed that the true premium costs for the poor would triple as theyapproached the actuarial costs of civil servants, and that public expendi-tures would increase from 0.7 percent of GDP in 2010 to 2.9 percent in2025 (ADB 2007).
A study by Soewondo (2008) in one Jamsostek office found that it wasdifficult to estimate utilization rates because enrollees could be registeredin one Jamsostek district by their employer but be managed by another dis-trict office if they sought care in facilities in that district. Furthermore, itwas not possible to analyze outpatient utilization in Puskesmas and privateclinics by detailed patient characteristics because data were submitted onan aggregate basis. However, information on inpatient and outpatient hos-pital claims costs for users of services could be assessed by age, sex, anddiagnosis because claims were submitted by hospitals on an individualpatient basis. The study found that average claim costs for outpatient carevaried by hospital, from Rp 62,970/visit in Tarakan to Rp 153,181/visit inRS Islam Jakarta, with an overall average for the five hospitals studied ofRp 130,163. Average claim costs for hospital inpatients varied from Rp70,857/admission in RS Tarakan to Rp 787,600/admission in IslamJakarta, with an overall average of Rp 698,218. Hospital costs also variedby age, gender, and diagnosis. This study highlights the importance of usingclaims data to track utilization and costs and also made some importantrecommendations for improvements in Jamsostek’s claims processing sys-tems. Such improvements would aid Jamsostek in improving the quality ofcare through utilization management techniques, and in controlling costsby denying payments for medically unnecessary services. This information
Key Policy Issues, Options, and Costs 117

could also be used to undertake the actuarial assessments of Jamsostek forthe various transition options.
Two studies by the World Bank provided estimates of increased costsresulting from changing demographics. One of these studies also providedestimates of the increased utilization that would take place if all the unin-sured were covered by Jamkesmas. The Choi et al. (2007) study on theimpact of the demographic transition in East and Central Java found thatbetween 2005 and 2020, under two scenarios of changing disease preva-lence, private outpatient and inpatient hospital spending would increaseby 84–124 percent, while public spending on infrastructure would needto increase by 51 percent in real terms by 2020. These estimates do notreflect the recent increases in Jamkesmas coverage and thus understatethe increased demand resulting from increased insurance coverage.
The second study (Walker 2008) of the impact of demographic changesand the expansion of Jamkesmas to the currently uninsured populationindicates that changing demographics alone will increase demand for bothoutpatient and inpatient services, as shown in figure 5.8. It estimatedincreases of 33 percent for outpatient and 30 percent for inpatient servicesin 2025, and if Jamkesmas coverage is extended to the entire population aswell, there will be a 79 percent increase in outpatient utilization and a 134percent increase in inpatient utilization by 2025, given existing supply con-straints and utilization differentials between the insured and uninsured.14
The Walker (2008) study also shows the potential large increases incosts under alternative scenarios of expanding Jamkesmas coverage to theentire currently uninsured population by 2015. As in all the studies above,using program costs based on 2006 Askeskin claims data yields estimatesof the true costs of Askeskin/Jamkesmas coverage that are significantlyhigher than the current amounts budgeted by the government, in this caseseveral times the current budgeting levels. Under Walker’s first baselinescenario, the assumption is that there is no increase in Jamkesmas coverage,and there is no excess hospital inflation or utilization growth, and hospitalfacilities continue to grow at 2001–06 historical rates. By 2025, total pro-gram costs would increase from Rp 9,046,798 to Rp 11,153,012, anincrease of less than 20 percent.
Under the more expansive scenario of expanding Jamkesmas to 180million people by 2010 and the entire uninsured population by 2015,spending would increase from Rp 19,127,097 to Rp 127,041,905, amore than sixfold increase. This assumes growth in hospital services of2 percent per year higher than historical trends; excess health care inflationof 6 percent for hospital inpatient services; 5 percent for hospital outpatient
118 Health Financing in Indonesia

2025 (demographics alone)
2007
2025 (demographics+insurance inducement)
0
2
4
6
ou
tpat
ien
t vi
sits
(mill
ion
)
inp
atie
nt
bed
-day
s (m
illio
n)
8
0
2
4
6
8
0–45–9
10–1415–1920–2425–2930–3435–3940–4445–4950–5455–5960–6465–6970–74
75+age category
0–45–9
10–1415–1920–2425–2930–3435–3940–4445–4950–5455–5960–6465–6970–74
75+
age category
a. Outpatient utilization
2025 (demographics+insurance inducement)
2007
2025 (demographics alone)
b. Inpatient utilization
Figure 5.8 Projected Changes in Utilization Caused by Demographics and Expansion of Jamkesmas to the Entire Population in 2025
Source: Author’s calculations.
119

services and Puskesmas inpatient costs and capitation rates; and 10 percentfor drug costs; and newly insured individuals using services at the same rateas currently insured individuals based on the Susenas 2007 data. Slowerexpansion of Jamkesmas will result in cost increases falling between theseextremes (Walker 2008). Clearly, the movement to UC will have sizeableimpacts on Indonesia’s health spending. If the expansion is financedthrough the government budget, there will also be significant new demandsfor available fiscal space in the budget to be allocated to health. To theextent such expansions are financed from employer and worker contribu-tions, these demands on the budget would be attenuated, although con-cerns would then shift to employment and competitiveness effects.
All of these studies suffer from lack of appropriate cost information aswell as information on potential case-mix differences between currentlyinsured and uninsured populations. There is also a dearth of informationon demand response. Appendix 1 contains the preliminary analysis using2007 Susenas data of differential utilization rates based on insurance cov-erage status, which was used to obtain the estimates above. In developingand evaluating various transition and steady-state growth options, goodcost information is absolutely essential, as are definitions of the detailedfeatures of the options. Obtaining such information needs to be a highpriority for the Social Security Council, MoH, Ministry of Finance,Jamsostek, and P.T. Askes.
In addition to developing baseline estimates of the actuarial soundnessof the existing programs, it will be important to develop realistic assump-tions about the expenditure growth that will occur when the coverageexpansions have been completed and the system reaches a steady state. Arecent study of rising public health spending across all Organisation forEconomic Co-operation and Development (OECD) countries between1981 and 2002 found that, while on average public spending on healthhad increased at 3.6 percent per year, two-thirds of the increase could beattributed to rising GDP per capita, over one-quarter could be attributedto a combination of changing medical technology and the so-called rela-tive price effect (that is, the tendency for the price of health care to risemore rapidly than general inflation through time because health sectorproductivity tends to rise more slowly than overall productivity), whileless than 10 percent of the annual increase could be attributed to demo-graphic change (OECD 2008a).
Figure 5.9 provides a crude example of the types of analyses thatneed to be undertaken. In the absence of good actuarial projections, it
120 Health Financing in Indonesia

is assumed that Indonesia reaches its steady state of UC in 2015 and isspending 5 percent of its GDP on health, slightly less than the averagefor other comparable lower-middle-income countries. Two scenariosare posited for the future. One assumes that Indonesia continues itshistoric low rate of increase of health spending based on its 1.05 elas-ticity. The second scenario assumes that Indonesia, once it achievesUC, will face the same cost pressures as the mature OECD health sys-tems, in which health spending has been increasing 29 percent a yearfaster than GDP.
As can be seen in figure 5.9, if Indonesia implements policies toensure efficiency and to control costs and follows its historical trends,health spending in 2040 will be about 6 percent of GDP. If it doesnot, and faces the same cost pressures as OECD countries, healthspending will be almost 10 percent of GDP. The illustrative point isthat developing effective policies that not only control costs, but alsoensure health outcomes and financial protection (areas not dealt within this example), is a critical determinant of whether Indonesia willbe able to afford UC. Currently, Indonesia is spending only a littlemore than 2 percent of its GDP on health. Can it afford a fivefoldincrease? Chapter 6 looks at various means by which Indonesia couldfind the necessary resources to finance its proposed expansion to uni-versal coverage.
Key Policy Issues, Options, and Costs 121
2005
tota
l hea
lth
exp
endi
ture
(%G
DP)
2
4
6
8
10
2010
transition period
OECD elasticity (1.29)
current Indonesion elasticity (1.29)
2015 2020year
2025 2030 2035 2040
Figure 5.9 Possible Future Scenarios for Health Expenditure (% of GDP)
Source: Authors.
Note: Assuming nominal GDP growth of 10 percent per year, 2015–40.

Notes
1. See Nichols (1995).
2. Although some countries, such as Sri Lanka, have effectively engineered theirsystems so that many of the better-off opt out of the public system, largely forbetter amenities, democratic grassroots support for the system ensures its con-tinuity by the government (Rannan-Eliya and Sikurajapathy 2008).
3. See Mukti and Riyarto (2008) for comparisons of the P.T. Askes BBP with theBBPs in several neighboring countries. Also see Langenbrunner andSomanathan (forthcoming) for a discussion of BBPs throughout the region.
4. Adapted from Hsiao (2008).
5. See, for example, Gani, Tilden, and Dunlop (forthcoming).
6. The government body designated with the task of developing the details ofhealth reform.
7. This framework is based on studies by the Commonwealth Fund (Collins,Davis, and Kriss 2007; Collins et al. 2007; and Davis, Collins, and Kriss 2007)that lay out the key policy issues and impact analyses that need to be consid-ered in major health reform legislation.
8. GTZ (2008) discusses a multiple fund option.
9. One administrative option under consideration is to have Askes administer allhealth insurance programs and Jamsostek administer all retirement programs.
10. Obviously, the two SHI programs could also be integrated into one along withthe other smaller military and Jaminan Pemeliharaan Kesehatan untuk KeluargaMiskin (Health Insurance Scheme for Poor Families), or JPKG, programs. Thekey here, as in Option Two, is the separation of the contributory groups fromthe government-supported ones. One could also refine Options Two and Threefurther by having the MoH cover all preventive and primary care servicesthrough general revenues, while curative secondary and tertiary care would becovered through the insurance programs. This is a question of benefit packagedefinition.
11. Multiple-fund SHI systems have generally been shown to have higher admin-istrative costs than single funds or NHS approaches. See Poullier (1992).
12. Some subsidies might be needed for small employers and firms and employeesin very low wage industries.
13. See studies by Hasbullah (2007) and Mukti and Riyarto (2008), which suggestthat Askeskin premiums should be far higher than the current Rp 5,000 permonth established by the government.
14. Appendix 1 to this book contains the probit regressions based on 2007Susenas data used to estimate increased utilization caused by moving fromuninsured to insured status.
122 Health Financing in Indonesia

123
Some of the proposed options for attaining universal coverage are likelyto require large increases in government expenditure for health.1 Thischapter outlines a framework within which options and alternatives tocreate fiscal space for financing planned increases in health coverage inIndonesia can be assessed. Can the Indonesian government increasehealth spending in the short to medium term to meet the needs of uni-versal coverage? If so, what are some options and experiences from othercountries that could be considered?
Finding additional government resources—fiscal space—requires anassessment of a government’s ability to increase spending for a desired pur-pose without jeopardizing its long-term financial solvency (Heller 2005).Although fiscal space is usually assessed in aggregate, that is, withoutregard to a specific sector, the analytical framework within which fiscalspace is assessed can be adjusted to take into account the prospects forincreasing government spending specifically for health. One way of assess-ing fiscal space for health is to examine the different options for addingnew sources of government financing as well as increasing the impact ofcurrent sources through efficiency gains in existing public spending onhealth. These include
C H A P T E R 6
Policy Options: Finding Resourcesfor Health

• Favorable macroeconomic conditions such as economic growth andincreases in overall government revenue that, in turn, lead to increasesin government spending for health;
• A reprioritization of health within the government budget; • An increase in health-specific foreign aid and grants; • An increase in other health-specific resources, for example, through ear-
marked taxation or the introduction of premiums for mandatoryhealth insurance; and
• An increase in the efficiency of government health outlays.
Favorable Macroeconomic Conditions
The first two of the above-mentioned options are largely outside thedomain of the health sector itself; they involve general macroeconomicpolicies and conditions as well as cross-sectoral political and economictrade-offs. Nevertheless, although exogenous to the health sector, itremains important to analyze the implications for government healthspending of changes in the generalized macroeconomic and political envi-ronment within which the sector operates. The remaining three optionsare more in the direct domain of the health sector and merit particularattention given that they provide the potential for resources that are sec-tor specific. See box 6.1 for a visual representation of the dimensions offiscal space.
One of the strongest predictors of fiscal space and of rising governmentexpenditure (including for health) is national income. Among other fac-tors, economic growth is associated with higher revenue generation—bothin levels and as a percentage of the economy—and this tends to be associ-ated with higher government spending. Indonesia’s economic growthrecord is fairly robust. In 2007, Indonesia’s GDP grew at a healthy rate of6.3 percent (World Bank 2008a). Following significant setbacks faced dur-ing the economic crisis period of 1997–2000, the country recovered well,posting GDP growth rates in the range of 4–6 percent per year since theturn of the millennium.
Before the global economic meltdown that began in 2008, Indonesia’smacroeconomic prospects appeared to be strong. Although it is difficult topredict the precise impact of the recent downturn, the likelihood of a neg-ative impact on the Indonesian macroeconomy and on growth projectionscannot be discounted, especially if export demand, foreign investment, andcapital inflows are adversely affected (IMF 2008). As shown in figure 6.1,the IMF predicts a slowdown of economic growth to about 5.5 percent in
124 Health Financing in Indonesia

2009, recovering to precrisis forecasted levels only in 2013. Given the pre-vious discussion, any slowdown in macroeconomic growth is likely to posesignificant risks to fiscal space by potentially slowing down increases inboth overall government spending and government spending on health.
The impact of economic growth on government spending on health,although important, is not only a product of increased availability ofrevenues but of other factors as well. Across countries, the elasticity of
Policy Options: Finding Resources for Health 125
Box 6.1
Visualizing Fiscal Space for Health: Hypothetical Scenariofor Indonesia
One useful means of visualizing fiscal space for health is to use a “spider plot.” As
can be seen in the figure below, there are five different axes, each representing a
different means by which government spending on health could potentially
increase. The figure shows the percentage increase in real government health
spending relative to that in a given base year via each of the different options. The
figure shows a hypothetical scenario for Indonesia in which a 4 percent increase in
real government health spending can be expected from the appropriate macro-
economic conditions (for example, as a result of economic growth). Similarly, a
5 percent increase could come from the reprioritization of government programs
and a 1 percent increase from sector-specific sources such as the introduction of
earmarked taxes for health.
Source: Author.
favorable macroeconomic conditions
reprioritization
sector-specific foreign aidother sector-specific resources
efficiency
12345678
fiscal space for health(increase as % of government health spending)

government health spending to GDP tends to be greater than one, mean-ing that government health spending tends to rise at a faster rate than therate of growth of GDP. There are multiple reasons why such a trend isobserved, including a change in societal preferences in favor of governmentprovision of social services generally. Based on an analysis of trend data forthe period 1995–2006, the nominal elasticity of total health spending forIndonesia was 1.05, and of public health spending was 1.11. 2
Figure 6.2 shows trends over the period 1979–2007 in central govern-ment health spending and, following decentralization, total governmenthealth spending. Although not readily apparent from the figure, govern-ment health spending has tended to increase as a share of GDP inIndonesia over time across both series. Although part of the responsive-ness of nominal health expenditures to nominal GDP may also be a resultof differential price changes in health versus prices for the overall econ-omy, analysis of the health component of the consumer price index forIndonesia for 1996–2005 suggests that both the health price index andthe general price index grew at the same average annual rate of about 15percent over this period (World Bank 2009a).
Government health spending could potentially rise from 0.99 percentof GDP in 2007 to 1.07 percent of GDP in 2013 if the elasticity of gov-ernment health spending to GDP in Indonesia remains at its level of1995–2006, 1.11, and if the economy grows at the rates recently pro-jected by the IMF. Table 6.1 reports the projected trends for governmenthealth spending, in levels and as a percentage of GDP, using the IMF
126 Health Financing in Indonesia
precrisis forecast
postcrisis forecast
4
5
6
7
8re
al G
DP
gro
wth
rate
(per
cen
t p
er y
ear)
2003 2005 2007 2009 2011 2013year
Figure 6.1 Revised Economic Growth Forecast for Indonesia (2008–13)
Source: IMF 2008.

growth and nominal GDP forecasts for Indonesia through 2013. As canbe seen in the table, based on economic growth–related projections,Indonesia nominal health spending levels will more than double over theperiod 2007–13, underscoring the importance of economic growth forgenerating fiscal space for health.
Reprioritizing the Health Budget
A second source of fiscal space for health in Indonesia could be a reprior-itization of health within the budget. Several factors indicate that healthis accorded a relatively low priority in the budget. WHO estimates thatthe Indonesian government allocated about 5.3 percent of its budget tohealth in 2006.3 This rate is far lower than the average for the East Asiaand Pacific (EAP) region as well as the average for lower-middle-incomecountries generally, with countries in both of these groups spending aboutdouble that amount—about 10 percent on average—on health as a shareof the government budget in 2006.
Lower budgetary allocations need not necessarily be a constraint tohealth care provision, especially if lower expenditure amounts are offsetby higher levels of efficiency as in some countries. However, as discussedabove, this does not appear to be the case for Indonesia. One indicationof the low priority accorded to health in Indonesia comes from compar-ing total government expenditure as a share of revenues with governmenthealth expenditure as a share of revenues (figure 6.3). Indonesia’s overall
Policy Options: Finding Resources for Health 127
GDP
central government
government (PER)
250
1,000
5,000
50,000
1,250,000
GD
P an
d g
ove
rnm
ent
hea
lth
spen
din
g (b
illio
n ru
pia
h)
1979 1984 1989 1994 1999 2004 2007year
decentralization
Figure 6.2 Long-term Trends in Government Health Spending in Indonesia(1979–2007)
Source: WDI; WHO-SEARO 2006.
Note: PER = Public expenditure review.

Table 6.1 Government Health Expenditure: Actual (2004–07) and Projected (2008–13)
Indicator 2004 2005 2006 2007 2008 2009 2010 2011 2012 2013
Nominal GDP (trillion rupiah) 2,296 2,774 3,339 3,957 4,608 5,287 6,012 6,775 7,590 8,481
Government health expenditure
(trillion rupiah) 16.7 19.1 31.2 39.0 46.1 53.7 61.8 70.5 80.0 90.4
Government health expenditure
(% GDP) 0.73 0.69 0.93 0.99 1.00 1.02 1.03 1.04 1.05 1.07
Sources: IMF 2008 and WB staff estimates.
128
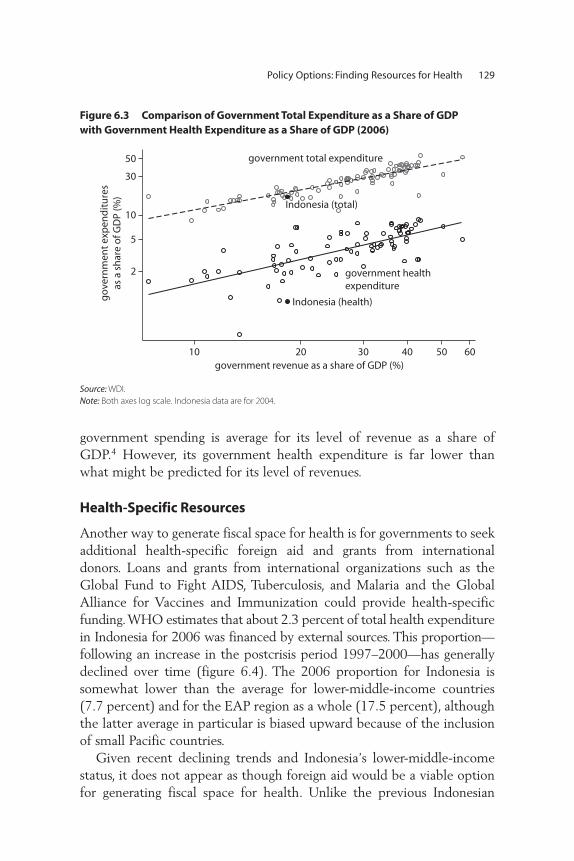
government spending is average for its level of revenue as a share ofGDP.4 However, its government health expenditure is far lower thanwhat might be predicted for its level of revenues.
Health-Specific Resources
Another way to generate fiscal space for health is for governments to seekadditional health-specific foreign aid and grants from internationaldonors. Loans and grants from international organizations such as theGlobal Fund to Fight AIDS, Tuberculosis, and Malaria and the GlobalAlliance for Vaccines and Immunization could provide health-specificfunding. WHO estimates that about 2.3 percent of total health expenditurein Indonesia for 2006 was financed by external sources. This proportion—following an increase in the postcrisis period 1997–2000—has generallydeclined over time (figure 6.4). The 2006 proportion for Indonesia issomewhat lower than the average for lower-middle-income countries(7.7 percent) and for the EAP region as a whole (17.5 percent), althoughthe latter average in particular is biased upward because of the inclusionof small Pacific countries.
Given recent declining trends and Indonesia’s lower-middle-incomestatus, it does not appear as though foreign aid would be a viable optionfor generating fiscal space for health. Unlike the previous Indonesian
Policy Options: Finding Resources for Health 129
Indonesia (total)
Indonesia (health)
government healthexpenditure
government total expenditure
2
5
10
30
50
go
vern
men
t ex
pen
dit
ure
sas
a s
har
e o
f GD
P (%
)
10 20 30 40 50 60government revenue as a share of GDP (%)
Figure 6.3 Comparison of Government Total Expenditure as a Share of GDP with Government Health Expenditure as a Share of GDP (2006)
Source: WDI.
Note: Both axes log scale. Indonesia data are for 2004.
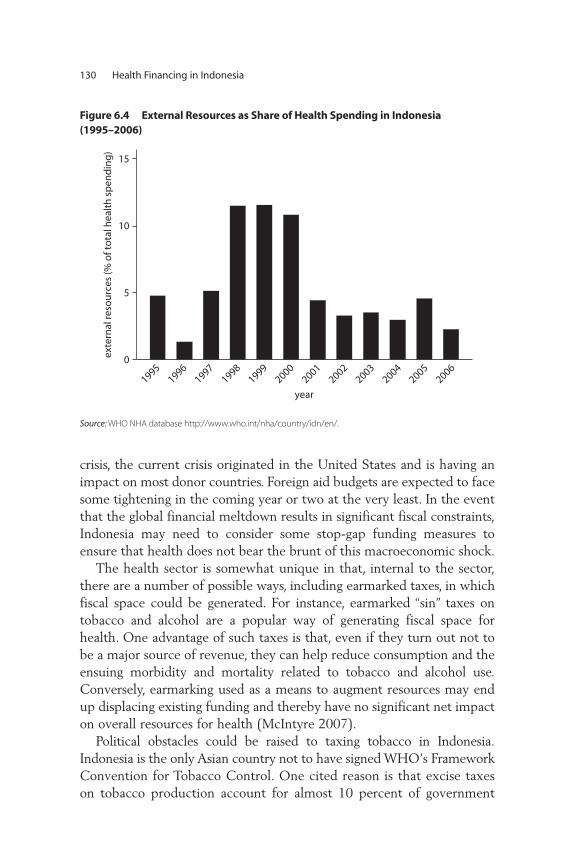
crisis, the current crisis originated in the United States and is having animpact on most donor countries. Foreign aid budgets are expected to facesome tightening in the coming year or two at the very least. In the eventthat the global financial meltdown results in significant fiscal constraints,Indonesia may need to consider some stop-gap funding measures toensure that health does not bear the brunt of this macroeconomic shock.
The health sector is somewhat unique in that, internal to the sector,there are a number of possible ways, including earmarked taxes, in whichfiscal space could be generated. For instance, earmarked “sin” taxes ontobacco and alcohol are a popular way of generating fiscal space forhealth. One advantage of such taxes is that, even if they turn out not tobe a major source of revenue, they can help reduce consumption and theensuing morbidity and mortality related to tobacco and alcohol use.Conversely, earmarking used as a means to augment resources may endup displacing existing funding and thereby have no significant net impacton overall resources for health (McIntyre 2007).
Political obstacles could be raised to taxing tobacco in Indonesia.Indonesia is the only Asian country not to have signed WHO’s FrameworkConvention for Tobacco Control. One cited reason is that excise taxeson tobacco production account for almost 10 percent of government
130 Health Financing in Indonesia
0
5
10
15
exte
rnal
reso
urc
es (%
of t
ota
l hea
lth
sp
end
ing
)
year1995
19961997
19981999
20002001
20022003
20042005
2006
Figure 6.4 External Resources as Share of Health Spending in Indonesia (1995–2006)
Source: WHO NHA database http://www.who.int/nha/country/idn/en/.

revenues, and estimates indicate that the sector employs almost 7 millionpeople (Economist 2007). Taxes on cigarettes in Indonesia are among thelowest in the region, amounting to only about 31 percent of the price ofcigarettes. Studies have suggested that a 10 percent increase in the price ofcigarettes could lower consumption by 3.5 to 6.1 percent and increasegovernment revenues from cigarette taxation by 6.7 to 9.0 percent(Achadi, Soerodo, and Barber 2005). However, cigarette and alcohol taxa-tion is often regressive and may result in evasion and the development ofunderground markets.
Although economists argue that earmarked taxes are needlessly restric-tive and can lead to sustained over- or underfunding of the activities thatbenefit from the earmarked taxes, they are extremely popular from a polit-ical perspective. Thailand successfully implemented an earmarked tax thatdirectly funds health promotion activities. In 2001, Thailand instituted theThai Health Promotion Foundation (ThaiHealth), funding for whichcomes directly from a 2 percent earmarked tax on tobacco and alcoholconsumption that provides an estimated annual revenue stream of US$50million (WHO-SEARO 2006). Thailand has also steadily increased ciga-rette taxation over the years—from 55 percent in 1993 to 75 percent in2001—leading to declining consumption rates but increased governmentrevenue from tobacco taxes.
Another potential health sector–specific mechanism for generatingfiscal space is the introduction of mandatory universal health insur-ance. This strategy facilitates the “capture” by the public sector of highout-of-pocket payments by collecting the premiums required inmandatory health insurance for nondisadvantaged groups. The basiceconomics behind any insurance mechanism is the idea that individu-als would prefer payment of a predictable (and relatively small) dedi-cated tax or premium to avoid unpredictable (and potentially large)payments when a health or other shock materializes. There is some evi-dence that individuals may be more willing to pay earmarked taxes orpremiums as long as there are clear benefits attached to the paymentof such a tax or premium (Buchanan 1963).5
The successful creation of fiscal space through mandatory health insur-ance is dependent on the size of the population and the ability to enroll thepremium-paying segment of the population. Indonesia’s success in generat-ing fiscal space from mandatory insurance would depend on the extent towhich the remainder of the population can be encouraged to enroll in thenational health insurance program so that some of the additional resourcescollected can be used to subsidize the non-premium-paying population.
Policy Options: Finding Resources for Health 131

A significant issue in Indonesia is the size of the informal sector: atmore than 60 percent of the labor force, it remains large despite periodsof sustained economic growth (Sugiyarto, Oey-Gardiner, and Triaswati2006). With such a large share of employment in the informal sector,enrollment, and thus obtaining premium contributions that would gen-erate fiscal space, is likely to be extremely challenging.
Efficiencies in Health Spending
In addition to increasing budgeted amounts for health, effective fiscalspace might be generated by increasing the efficiency of spending.Improvements in the efficiency of health systems can be an importantsource of fiscal space. Sri Lanka has been able to attain excellent healthoutcomes with relatively low levels of resources, in part because of theunderlying efficiency of its health system (box 4.1).
Following decentralization in 2001, up to one-half of all health expen-diture in Indonesia occurred at the district level. In 2006, the central gov-ernment contributed about 39 percent of all public expenditure onhealth with the provinces contributing the remainder (World Bank2008c). However, district health spending remains, for the most part,nondiscretionary or routine, largely covering the wages of the publicallyemployed health workforce. In addition, some confusion remains aboutaccountability and responsibility of the different levels of government.The clarification of these issues could potentially help improve efficiencyof the health system in Indonesia.
As discussed earlier, outputs vary significantly across districts inIndonesia, suggesting lessons can be learned from better-performing dis-tricts. One possible avenue for improving the effective fiscal space in adecentralized context would be to design interfiscal transfers so they aregeared toward attainment of health outputs and outcomes. Such mecha-nisms have been found to be quite successful in Argentina (see box 6.2)and Rwanda and could be considered in the Indonesian context becauseonly a small percentage of transfers are currently tied to specific sectorsand even those are not tied to attainment of specific outputs or outcomes.
In addition to efficiency gains from better coordination across all levelsof government, several studies have indicated other avenues through whichefficiency gains may be realized in Indonesia. For instance, an IMF analysisargues that Indonesia—by rationalizing its spending and eliminating energysubsidies—could expand overall fiscal space by almost 1.5 percent of GDP.This would entail moving the bulk of expenditure away from its cur-rent categories of personnel, interest payments, subsidies, and government
132 Health Financing in Indonesia

Policy Options: Finding Resources for Health 133
Box 6.2
Designing Interfiscal Transfers to Attain Health Results in Argentina
Argentina’s Plan Nacer was initiated in 2004 to provide coverage for the poor in
provinces located in the northern part of the country. The program is designed to
provincial governments
health servicepurchasing units
certification
fee for servicemedical recordsfor verification
enrollmentin program
choice ofprovider
targetgroup
treatment(output)
healthservice
providers
World Bank
special account administeredby government
capitations paidafter verification of
outputs
60% on numberenrolled in target
group (output)
40% on achievedtracers (output)
auditor
provincial governments
health servicepurchasing units
provision ofdocumentationon enrollmentand service
disbursementtriggered byverification ofoutputs
Argentinegovernment
50%50%
(continued)

apparatus (which allow little room for investment in infrastructure, health,and education; IMF 2008). In addition, the recent Public ExpenditureReview (World Bank 2007b) shows that public health expenditure is dom-inated by spending on salaries of personnel and primarily benefits the richerquintiles: some efficiency gains may be actualized by better targeting andincreasing the discretionary elements of health spending.
Another indication that room for efficiency gains is available comesfrom a study of health worker absenteeism in Indonesia. Based on unan-nounced visits to primary health care facilities in Indonesia, the studyfound a 40 percent absenteeism rate among medical workers(Chaudhury et al. 2006). Absenteeism rates tended to be higher for doc-tors than other types of health workers. Clearly, there is a need to reeval-uate incentives and governance issues related to delivery of healthservices given that—in “real” terms—expenditure outlays may not betranslating effectively into human resource inputs in the health systemin Indonesia.
134 Health Financing in Indonesia
Box 6.2 (Continued)
provide results-based financing to provincial governments based on the number
of enrollees in the program as well as performance on a set of basic health indica-
tors. About 60 percent of interfiscal transfers from the central government to the
provincial governments are based on the number of enrollees and the remaining
40 percent are tied to attainment of 10 tracer indicators, such as immunization
rates and average weight at birth of newborns. Service delivery is contracted out
by the provincial governments to certified public and private providers and
patients are free to choose among the providers. The program finances a condi-
tional matching grant from the central government to provinces, which pays half
the average per capita cost of a basic benefits package covering 80 cost-effective
maternal and child health interventions to uninsured mothers and to children up
to six years old.
The program has built-in incentives for increasing enrollment rates and for
provision of quality care. Capitation-based and unit-costed payments encourage
negotiation with providers and efficiency in delivery of services. Results are inde-
pendently audited and have been encouraging.
Source: Johannes 2007.

Notes
1. This chapter is a summary of World Bank (2009a).
2. The corresponding elasticities with respect to nominal GDP using a globalsample for 2006 were 1.09 for total health spending and 1.21 for governmenthealth spending.
3. WHO (2009) NHA database, http://www.who.int/nha/country/idn/en/.
4. It is also important to note that Indonesia’s overall revenue collection is rela-tively low compared with its income level. See World Bank (2009a).
5. Colombia was able to generate increases in public sector health spending anddeclines in out-of-pocket expenditures when it introduced mandatory healthinsurance in 1993.
Policy Options: Finding Resources for Health 135


137
Indonesia is at a critical crossroads in its quest for universal healthinsurance coverage for its population. Achieving universal coverage hasproven to be a formidable challenge even for high-income countries.Not surprisingly, few developing countries have successfully achieveduniversal coverage with good health outcomes and high levels of finan-cial protection, and have been able to complete and sustain their reforms.Even those that have, such as Thailand, are continually challenged bycost pressures from the demographic, epidemiological, and nutritiontransitions; costly new medical technologies; the inherent market fail-ures in health and insurance systems; and insatiable demand from theirpopulations.
This report attempts to provide substantive guidance to the governmentof Indonesia on how it might proceed with its universal health insurancecoverage reform. The report examines the demographic, epidemiological,socioeconomic, geographical, and political realities in Indonesia; thestrengths and weaknesses of the current Indonesian health system andhealth insurance programs; the global evidence base on “good practice” inhealth financing reform; and Indonesia’s future macroeconomic realities.It attempts to build on the large Indonesia-specific health literature andprovide just-in-time advice on key reform parameters and options for
C H A P T E R 7
Conclusions and Next Steps

consideration by the government and the Social Security Council. Itsfocus is on (i) analytical work through new data collection and analysesand through summarizing previous Indonesian and global experiencesand (ii) providing options for consideration by the political decision mak-ers who are facing major policy issues and information needs in specify-ing both the configuration of the final universal coverage (UC) systemand the transition steps to get there. This chapter summarizes some globalconventional wisdom and raises some of the important issues that needto be comprehensively addressed as the reform process moves forward.
Wisdom from Global Health Financing Reform Efforts
A number of insights have evolved from other countries’ reform “successes”and “failures” that are germane to Indonesia:
• It is much easier to expand coverage and benefits than to reduce them.• When a uniform universal program is created from several existing
programs, the benefits package generally ends up being that of themost generous program.
• Major expansions of coverage should not be undertaken from an inef-ficient base system.
• It is very difficult to finance a reform in the short term through effi-ciency gains.
• Demand-side measures are important but, from an individual’s per-spective, cost is often irrelevant when it comes to health; thus, physi-cians generally determine demand.
• Supply-side (regulatory and reimbursement) measures are absolutelycritical for controlling costs in any pluralistic system.
• Substantial market failures in health care limit the inherent efficienciesunderlying competition, either among insurers or providers, requiringcomplex regulatory mechanisms.
• Major reforms in delivery arrangements and medical practice taketime, particularly if large numbers of physicians and new types ofphysician specialists need to be trained.
• Governments need to consider both private financing and private deliv-ery, given the potential for self-referral by public providers, the abilityfor private insurers and providers to transfer the poorest health risksonto the public system, and the opportunity costs of inefficient pri-vate sector investments (the “medical arms race”) that can result inlost growth and employment.
138 Health Financing in Indonesia
• Rationalization of the health delivery system needs to be an implicit orexplicit aspect of coverage expansion and of regulatory, quality assur-ance, and payment mechanisms (IMF 2007).
Every one of these issues is relevant to Indonesia, which faces a highlyfragmented health insurance system, serious supply-side inefficienciesand constraints, a pluralistic delivery system, and extensive benefits pack-ages that differ across programs. While the focus of this report has beenon health financing, the plethora of other public health and health sys-tems issues must also be addressed in Indonesia’s reform approach. Thegovernment should, through its ongoing policy processes and the devel-opment of its next five-year development plan, ensure a coordinatedfocus on the full range of health reform issues and carefully coordinatethe work of the Social Security Council with the health policy processesof other public agencies at all levels of government.
The Way Forward
Indonesia has established the broad legislative base for moving forward toUC, and the Social Security Council has been focusing on specific imple-mentation issues. In fact, Law 40/2004 requires that a Law on SocialSecurity Administering Bodies and implementing regulations of theSocial Security Law be drafted and ratified by October 18, 2009. In par-ticular, the Coordinating Ministry of Social Welfare has devoted substan-tial efforts to develop draft laws in a number of critical reform areasincluding the following:
• Draft Law for the Social Security Administering Bodies (Carriers),which clarifies roles and functions of existing social security carriersand is the legal basis for those organizations to operate under the socialsecurity reform
• Draft Government Regulation for Social Security Beneficiaries, whichfocuses on identification of beneficiaries, targeting mechanisms, eligi-bility criteria, and beneficiary registration, as well as premiums andcontributions
• Draft Concept for Presidential Regulation for the National Health Insur-ance Program, which addresses beneficiary coverage issues, including theBBP and uncovered formal and informal sector workers; premium set-ting; and contribution levels and shares among employees, employers,and levels of government.
Conclusions and Next Steps 139

These efforts, the details of which are displayed on the CoordinatingMinistry of Social Welfare Web site, all are addressing, at various levels ofdetail, many of the key issues raised in chapter 5.1 While they representa serious effort to move the health insurance reform forward, there is stilla great deal of work that needs to be undertaken in an integrated andappropriately sequenced manner. This includes further development ofpolicy details in many critical areas and analytical studies of program andadministrative costs, health outcomes, financial protection, equity, effi-ciency, and sustainability impacts of alternative policy options. Furtherwork is also needed to refine the ultimate vision, as well as the transitionsteps and timing.
In addition, a number of studies undertaken by the government,donors, and other stakeholders provide relevant contributions for decisionmaking as the government proceeds with the development and imple-mentation of the reform. While all these efforts are useful for plantingindividual trees in the complex forest of health care reform, what has notbeen evident to date is the final configuration for populating the forestand the road map for planting the trees to eventually get there. In short,the government needs to decide on the final national health insurancesystem that it has in mind, then carefully lay out the transition steps.
In developing such major policies, Indonesia, like most other countries,lacks critical information—about policy design, implementation details,and data—needed for informed decision making. In addition, big picturepolicy choices on the ultimate national health insurance system and tran-sition steps can only be made in tandem with specific policy choices onmore micro issues, such as the groups eligible for coverage by each pro-gram, targeting mechanisms, contribution requirements (for individuals,firms, and governments), provider payment mechanisms and levels, andthe future macroeconomic environment. Rational policy choices need tobe based on both the quantitative and qualitative impacts of such policieson, among other things, health outcomes, financial protection, consumerresponsiveness, access, equity, efficiency, costs (public and private), andmacroeconomic sustainability.
Based on global experience, the following critical policy issues shouldform the framework for the implementation of universal coverage:
1. Further development is needed on such data for decision making asNational Health Accounts updates; insurance claims information; andcost, equity, and benefit incidence analyses to evaluate policy options.It is crucial to give high priority to developing the actuarial baselines
140 Health Financing in Indonesia
of the current and proposed future health insurance programs and get-ting better estimates of the behavioral responses of both consumersand suppliers to changes in insurance coverage. Included in theseanalyses should be assessments of the current Basic Benefits Packages(BBPs) as well as the proposal of the Social Security Council, as meas-ured by both cost-effectiveness and financial protection against exces-sive out-of-pocket spending, to enable rational choices of the BBP(s)under the national health insurance reform.
2. The initial assessments of supply-side constraints on both humanresources and physical infrastructure highlighted a number of impor-tant areas where inefficiencies need to be addressed as well as areasthat will come under more pressure given the underlying demographic,nutritional, and epidemiological realities.
3. Building on the pharmaceutical sector assessment and the initial iden-tification of potential opportunities in expanding mandatory healthinsurance, the government is encouraged to further evaluate pharma-ceutical sector policies and needed changes to aid implementation ofthe national health insurance reform.
4. The ongoing decentralization and health insurance reforms necessitateclarifying the residual roles of the Ministry of Health (MoH) withrespect to public health and its remaining stewardship and financingfunctions with respect to the public insurance system. Within itsbroader stewardship role, it should make assessing the effects of poli-cies in other sectors (such as water and education) on health a highpriority, as well as assessing the need for additional demand-side poli-cies such as conditional cash transfers.
5. Once decisions about financing options have been made under theroad map to universal health insurance coverage, it is essential todevelop, experiment with, and evaluate the impacts of alternativeprovider payment mechanisms on costs, quality, and access.
6. The range of necessary administrative structures to implement thereform needs to be further developed, including assessing administra-tive costs and developing systems to ensure quality, measure efficiency,and evaluate the reform’s impacts.
7. The rich local experiences in providing health insurance coverageshould be carefully assessed because these natural experiments are animportant source of information for the national-level health insur-ance reform effort.
8. Attaining universal health insurance coverage is highly likely to requirelarge increases in government expenditures, no matter which option is
Conclusions and Next Steps 141

chosen. Thus, continuing attention to evaluating Indonesia’s futuremacro situation, including competing priorities in light of the currentglobal financial and economic crises, is important, as is assessing theneed for changes in the current intergovernmental fiscal structure.
The Five-Year Rencana Pembangunan Jangka Menengah (Medium-TermDevelopment Plan), or RPJM, and the Social Security Council processshould be structured to address these and other related issues. To tacklethese numerous issues, Indonesia (as other countries have done) may needto establish additional specific working groups to address these differenttopical areas with the council providing overall management of the wholeset of issues, including coordination across government agencies, dealingwith the interaction effects across policies and costing issues, and manag-ing partner stakeholders such as donors and the private sector. By way ofexample, President Clinton’s Health Reform Task Force was composed of24 different working groups, each group dealing with one health reformarea (for example, financing, Basic Benefits Packages, malpractice insur-ance, health workforce, mental health, cost containment). To date,although as discussed above the council has completed important basicinstitutional studies, this comprehensive approach, along with much of theneeded technical input (internal and external), has been lacking.
Conclusion
Indonesia is one of the few developing countries to pass legislation andbegin phasing in UC, first by covering all the poor and near poor. Whilethe government is strongly commended for its pro-poor and humandevelopment policy focus, successful implementation of the UC reformwill require carefully sequenced implementation of targeted, effective,and fiscally sound policies. To date, this has not been the case, in partbecause of the lack of underlying data, but also because a carefullysequenced comprehensive set of policies that go well beyond an expan-sion of health insurance coverage for the poor needs to be developed.
The council and the MoH have taken important first steps. The RPJM;the MoH’s own internal planning efforts in developing the next RencanaStrategi (Strategic Plan), or Renstra; and the potentially large and possiblyunaffordable (in the short run because of the current global economic cri-sis) expenditure implications of expanding health insurance to some 76million poor and near poor, make this an ideal time to refocus efforts on
142 Health Financing in Indonesia

the comprehensive set of policies needed to effectively implement theUC reform.
With new data becoming available (insurance claims informationbased on actual utilization from existing carriers), the availability of bothinternal and external technical support, and the development of the newRPJM, this would be an ideal time to adjust the health reform process.Given the current economic crisis and the upcoming presidential elec-tion, much of this analysis could be initiated now with some completedfor use by the incoming administration. Other more complex issues, suchas the development, testing, and implementation of new provider pay-ment systems, are long-term endeavors and should be initiated as soon asfeasible, possibly in conjunction with local experiments as pilot projects.
Note
1. See, for example, Coordinating Ministry of Social Welfare, Draft Concept ofthe Presidential Regulation for the National Health Protection Program, EarlyDiscussion 2007-2008, Compilation of Papers Deputy of Social Protectionand Community Settlement in collaboration with GTZ-GVG SHI, Jakarta,November 2008.
Conclusions and Next Steps 143

145
The work in this appendix is based on the 2007 Susenas survey of285,000 households. It analyzes the differences in inpatient and outpa-tient utilization rates by socioeconomic characteristics (for example, age,income, urban-rural residence) and insurance coverage status. The probitanalysis provides crude estimates of the likely behavioral-demandresponse on utilization that would result from increased insurance cover-age and changing socioeconomic conditions in Indonesia.
Empirical evidence, as well as basic economics, suggests that utilizationrates would probably be higher among those who are insured than amongthose who are not. Analysis of Susenas data from 2007 provides somesupport for this insurance-inducement effect on utilization rates. As table1A.1 shows, outpatient utilization rates in the month preceding the sur-vey for those who had any insurance averaged 17.3 percent, comparedwith 12.4 percent for those who had no insurance. The inducement waseven higher for those covered by Jamkesmas, who reported outpatientutilization rates of around 18.2 percent. Similar patterns were observedfor inpatient utilization rates, with those having insurance reporting morethan double the utilization rates of those without insurance.
A P P E N D I X 1
Probit Analysis of Demand Inducement from Insurance Coverage and Socioeconomic Changes

Table 1A.1 Utilization Rates by Insurance Status
Outpatient utilization,past month (percent)
Outpatient visits,past month
Inpatient utilization,past year (percent)
Average length of stay per admission, past year (days)
Agecategory
No insurance
Any insurance Jamkesmas
No insurance
Any insurance Jamkesmas
No insurance
Any insurance Jamkesmas
No insurance
Any insurance Jamkesmas
0–4 22.9 28.5 29.4 1.5 1.5 1.6 2.3 5.0 4.2 4.9 6.3 6.5
5–9 11.9 16.0 16.2 1.5 1.5 1.5 0.9 2.1 1.8 6.1 6.1 7.1
10–14 7.3 10.7 11.2 1.5 1.5 1.6 0.7 1.8 1.6 5.1 6.7 6.4
15–19 5.8 8.4 8.7 1.6 1.6 1.6 0.9 2.0 1.9 5.9 7.8 8.5
20–24 6.9 10.4 10.9 1.6 1.6 1.7 1.5 3.4 3.0 4.7 8.1 8.0
25–29 8.1 12.2 13.0 1.6 1.6 1.6 1.6 3.6 3.0 5.1 7.1 7.1
30–34 9.4 13.6 14.8 1.6 1.6 1.8 1.5 3.8 3.1 5.3 6.0 6.9
35–39 11.0 15.2 16.3 1.7 1.7 1.8 1.4 3.3 3.1 5.4 7.5 7.8
40–44 12.6 16.6 17.8 1.7 1.7 1.8 1.2 3.0 2.8 8.0 8.1 8.3
45–49 14.2 18.8 21.3 1.8 1.9 1.9 1.4 3.8 3.8 7.9 9.3 8.7
50–54 16.1 21.6 23.4 1.8 1.8 1.8 1.8 4.1 3.7 8.0 8.7 8.3
55–59 17.6 24.6 25.3 1.8 1.9 1.9 2.1 4.7 3.9 6.4 11.0 12.7
60–64 20.6 27.0 27.0 1.9 2.0 2.1 2.4 4.9 4.1 7.5 8.3 8.4
65–69 22.3 30.6 29.2 1.8 1.9 1.9 2.7 5.9 4.8 6.7 11.6 11.4
70–74 25.1 34.2 33.4 1.9 2.0 2.0 2.8 6.0 4.5 9.2 10.5 11.0
75+ 24.9 34.4 32.6 1.9 2.1 2.1 3.3 6.8 5.9 8.0 9.0 8.0
Total 12.4 17.3 18.2 1.7 1.7 1.8 1.5 3.5 3.1 6.1 8.0 8.2
Source: Susenas 2007.
146

Appendix 1 147
Clearly, the utilization pattern differences reported in table 1A.1 arenot all due to insurance inducement alone, especially if the characteristicsof the people who did and did not have insurance were significantly dif-ferent. It could be that those with insurance tended to have poorer healthstatus (or were relatively better-off formal sector employees and civil ser-vants). Or differences in the age, education, and income profiles of thosewith and without insurance might explain some of the differences in uti-lization rates across the different insurance coverage subgroups. One wayto separate these effects is to measure the impact of insurance coverageon utilization, controlling for some of these other determinants, such aseducation, income, rural-urban residence, and age. The results of thisexercise are reported in table 1A.2.
By taking other determinants into account, the basic pattern of differ-ences in utilization rates observed in table 1A.1 remains, but the magni-tudes are different, and there are differences related to the type ofinsurance coverage (for example, Jamkesmas vs. Askes/Jamsostek vs. otherinsurance). Controlling for other determinants, those who had any insur-ance had outpatient utilization rates in the previous month that were4.7 percent higher than those who had no insurance. Those withJamkesmas had outpatient utilization rates about 2.5 percent higher thanthose without insurance. Similarly, inpatient utilization rates in the previ-ous year were about 1.6 percent higher for those with any insurance,whereas for those with Jamkesmas coverage, the inpatient utilization rateswere about 1.0 percent higher.
By relying, in part, on these estimates, Walker (2008) projects the fol-lowing increases in utilization resulting from both demographic andinsurance coverage effects, assuming the entire uninsured population iscovered by Jamkesmas by 2015:
• Outpatient: 33.4 percent increase from demographics alone, 79.4 per-cent increase from demographic changes together with insuranceinducement.
• Inpatient: 30.4 percent increase from demographics alone, 133.9 per-cent from demographic changes together with insurance inducement.

148
Table 1A.2 Probit Analysis of Utilization Differentials by Insurance Status and Socioeconomic Factors
Outpatient utilization (past month) Inpatient utilization (past year)
Insurance status Model I Model II Model I Model II
Insurance coverage(Base = no insurance)
Any insurance 0.047**(0.001) 0.016**(0.000)
Askes/Jamsostek 0.061**T(0.001) 0.021**(0.000)
Jamkesmas 0.025**(0.002) 0.010**(0.000)
Other insurance 0.041**(0.002) 0.018**(0.001)
Age category(Base = 0–4 years)
5–9 years –0.081**(0.001) –0.081**(0.002) –0.014**(0.000) –0.014**(0.000)
10–14 year –0.102**(0.002) –0.102**(0.001) –0.015**(0.000) –0.015**(0.000)
15–19 years –0.107**(0.001) –0.108**(0.001) –0.015**(0.000) –0.015**(0.000)
20–24 years –0.099**(0.001) –0.100**(0.001) –0.012**(0.000) –0.012**(0.000)
25–29 years –0.092**(0.001) –0.093**(0.001) –0.011**(0.001) –0.011**(0.0004)
30–34 years –0.084**(0.002) –0.086**(0.001) –0.011**(0.000) –0.011**(0.0004)
35–39 years –0.076**(0.002) –0.077**(0.002) –0.012**(0.000) –0.012**(0.000)
40–44 years –0.069**(0.002) –0.070**(0.002) –0.012**(0.000) –0.012**(0.000)
45–49 years –0.061**(0.002) –0.062**(0.002) –0.011**(0.000) –0.011**(0.000)
50–54 years –0.051**(0.002) –0.051**(0.002) –0.009**(0.001) –0.009**(0.000)
55–59 years –0.041**(0.002) –0.041**(0.002) –0.008**(0.001) –0.008**(0.001)

60–64 years –0.027**(0.003) –0.027**(0.003) –0.006**(0.001) –0.006**(0.001)
65–69 years –0.015**(0.003) –0.015**(0.003) –0.004**(0.001) –0.004**(0.001)
70–74 years 0.002**(0.004) 0.001**(0.004) –0.003**(0.001) –0.003**(0.001)
75+ years — 0.001**(0.004) — —
Urban(Base = rural) –0.014**(0.001) –0.013**(0.001) 0.001**(0.000) 0.001**(0.003)
Education Years of schooling –0.003**(0.000) –0.002**(0.000) 0.0001**(0.000) 0.0003**(0.000)
Males(Base = females) –0.004**(0.000) –0.004**(0.001) –0.003**(0.000) –0.004**(0.0003)
Economic status(Base = poorest quintile)
Second quintile 0.023**(0.001) 0.024**(0.001) 0.005**(0.000) 0.006**(0.000)
Third quintile 0.043**(0.002) 0.045**(0.002) 0.012**(0.000) 0.013**(0.000)
Fourth quintile 0.059**(0.002) 0.063**(0.002) 0.017**(0.000) 0.018**(0.001)
Richest quintile 0.065**(0.002) 0.072**(0.002) 0.023**(0.000) 0.024**(0.001)
Pseudo R-squared 0.04 0.04 0.05 0.05
N 1,050,792 1,050,792 1,050,792 1,050,792
Source: Susenas 2007.
Note: — = No data available. Standard error in parentheses.
** = significant at the 10 percent level.
149


151
Acemoglu, D., and S. Johnson. 2007. “Disease and Development: The Effect ofLife Expectancy on Economic Growth.” Journal of Political Economy 115 (6):925–85.
Achadi, A., W. Soerojo, and S. Barber. 2005. “The Relevance and Prospects ofAdvancing Tobacco Control in Indonesia.” Health Policy 72 (3): 333–49.
ADB (Asian Development Bank). 2007. “Preparatory Studies on National SocialSecurity System in Indonesia.” Asian Development Bank, Manila.
Adeyi, O., O. Smith, and S. Robles. 2007. Public Policy and the Challenge of ChronicNoncommunicable Diseases. Washington, DC: World Bank.
Adioetomo, Sri Moertiningsih. 2007. “Population Projection, Demographic Bonusand its Impact on Free Basic Education in Indonesia.” Consultant report,World Bank, Jakarta.
Aran, M., and M. Juwono. 2006. “Benefit Incidence of Health Expenditures inDecentralized Indonesia.” Background Paper for “Making the New IndonesiaWork for the Poor.” World Bank, Jakarta.
Askes. 2006. “ASKESKIN Expenditures Report 2006.” P.T. Askes, Indonesia.
Bappenas-BPS-UNFPA. 2005. Proyeksi Penduduk Indonesia 2000–2025.(Indonesian Population Projection). Jakarta.
Barber, S. L., S. M. Adioetomo, A. Ahsan, and D. Setyonaluri. 2008. TobaccoEconomics in Indonesia. Paris: International Union Against Tuberculosis andLung Disease.
Bibliography

Barber, S. L., P. Gertler, and P. Harimurti. 2007. “Differences in Access to High-Quality Outpatient Care in Indonesia.” Health Affairs 26 (3): w352–66.
Bender, K., E. Feess, J. Holst, J. Knoess, A. A. Oka Mahendra, M. W. Manicki, A. Eka Putri, H.-J. Rösner, T. Schramm, S. Soejitno, P. Suder, F. Tibitanzl, I. Vernekohl, F. von Roenne, and S. Zimpel. 2008. “Options for Social ProtectionReform in Indonesia.” Bappenas/GTZ. Jakarta: PT Gradasi.
Boomgaard, P. 1993. “The Development of Colonial Health Care in Java: AnExploratory Introduction.” Bijdragen tot de Taal-, Land- en Volkenkunde[Contributions to the Linguistics, Geography and Ethnology (of thecolonies)] 149 (1): 77–93.
———. 1996. “Dutch Medicine in Asia, 1600–1900.” In Warm Climates andWestern Medicine: The Emergence of Tropical Medicine, 1500-1900, ed. D.Arnold. Amsterdam: Rodopi.
BPS (Badan Pusat Statistik [Statistics Indonesia]). 2008. Employment Statisticsonline report. August 2008. http://www.bps.go.id/sector/employ/tables.shtml.
Brody, J. A., M. D. Grant, L. J Frateschi, S. C. Miller, and H. Zhang. 2000.“Reproductive Longevity and Increased Life Expectancy.” Age and Aging 29(1): 75–8.
Buchanan, J. M. 1963. “The Economics of Earmarked Taxes.” Journal of PoliticalEconomy 71: 457–69.
Chaudhury, N., J. Hammer, M. Kremer, K. Muralidharan, and F. H. Rogers. 2006.“Missing in Action: Teacher and Health Worker Absence in DevelopingCountries.” Journal of Economic Perspectives 20 (1): 91–116.
Choi, Y., J. Friedman, P. Heywood, and S. Kosen. 2007. “Forecasting Health CareDemand in a Middle-Income Country: Disease Transitions in East and CentralJava, Indonesia.” Research Working Paper, World Bank, Washington, DC.
Collins, S. R., K. Davis, and J. L. Kriss. 2007. “An Analysis of Leading CongressionalHealth Care Bills, 2005–2007: Part I, Insurance Coverage.” CommonwealthFund, New York.
Collins, S. R., C. Schoen, K. Davis, A. Gauthier, and S. C. Schoenbaum. 2007. “ARoadmap to Health Insurance for All: Principles for Reform.”Commonwealth Fund, New York.
Coordinating Ministry of Social Welfare. 2008. “Draft Concept of the PresidentialRegulation for the National Health Protection Program, Early Discussion2007–2008.” Compilation of Papers of Deputy of Social Protection andCommunity Settlement in collaboration with GTZ-GVG SHI, Jakarta.
Davis, K., S. R. Collins, and J. L. Kriss. 2007. “An Analysis of Leading CongressionalHealth Care Bills, 2005–2007: Part II, Quality and Efficiency.”Commonwealth Fund, New York.
The Economist. 2007. “Can’t Kick the Habit; Smoking in Asia.” Sept. 22.
152 Bibliography

Felipe, J., and R. Hasan, eds. 2006. Labor Markets in Asia: Issues and Perspectives.New York: Palgrave Macmillan.
Fengler, W., and B. Hofman. 2007. “Managing Indonesia’s Rapid Decentralization:Achievements and Challenges.” World Bank, Jakarta.
Fernando, T. 2008. “Provisional Data Tabulations from APNHAN-RCHSP JointAsia-Pacific Health Accounts Data Compilation, Revision October 21, 2008.”Institute for Health Policy, Colombo, Indonesia.
Gani, A., H. Thabrany, Pujianto, F. Yanuar, T. Tachman, A. Sirergar, H. Wahyu, S. Soerachmad, Widyastuti, Yulherin, and Nurbaiti. Forthcoming. “GoodPractice of Local Health Financing Schemes in Indonesia: Its Contributiontoward Universal Coverage of Health Insurance.” AusAID, Jakarta.
Gani, A., R. Tilden, and D. Dunlop. Forthcoming. “‘JKJ’ Insurance Scheme inJembrana District: Does It Promote Equity?” ADB, Manila.
Gertler, P., L. Locay, and W. Sanderson. 1987. “Are User Fees Regressive? TheWelfare Implications of Health Care Financing Proposals in Peru.” Journal ofEconometrics 36 (1): 67–88.
Gertler, P., and J. Van der Gaag. 1990. The Willingness to Pay for Medical Care:Evidence from Two Developing Countries. Baltimore, MD: Johns HopkinsUniversity Press.
Gotama, Ida Bagus, and Donald Pardede. 2007a. “The New Agenda for Askeskin:The Most Expansive Initiative.” Presentation at the Regional Health InsuranceMeeting, Bali, May 1.
———. 2007b. “Opportunities and Challenges in the Implementation of SocialHealth Insurance as a Part of the National Social Security Program.” Presentedat the International Decentralization in Health Sector Conference, Denpasar,Bali, August 7–10.
Gottret, P., and G. Schieber. 2006. Health Financing Revisited: A Practitioner’sGuide. Washington, DC: World Bank.
Gottret, P., G. J. Schieber, and H. R. Waters, eds. 2008. Good Practices in HealthFinancing: Lessons from Reforms in Low- and Middle-Income Countries.Washington, DC: World Bank.
Government of Indonesia. 2007. “Health Financing and Security Action Plan2005–2009.” Ministry of Health, Jakarta.
Government of Indonesia/World Bank/AusAID/GTZ/ADB. 2008. “BackgroundPaper on the Indonesian Health System in Support of the Government ofIndonesia Health Sector Review (Final Draft).” Jakarta.
GTZ (German Agency for Technical Cooperation). 2006. “Social Security SystemReform in Indonesia [Law No. 40 Year 2004 Concerning National SocialSecurity System Following the Ruling of Constitutional Court].” Handbook.Menkokesra (Coordinating Ministry for People’s Welfare), Jakarta
Bibliography 153

———. 2008. “Options for Social Protection Reform in Indonesia.” GTZ, Jakarta.
———. 2009. “DRAFT Assessment of Indonesia’s Health Physical Infrastructure;Presentation of Preliminary Findings.” PowerPoint presentation, Jakarta.
Guadiz-Padmohoedojo, L. 1995. Historical Development. PT Askes Indonesia, 2ndedition. Jakarta.
Guterman, S., K. Davis, S. C. Schoenbaum, and A. Shih. 2009. “Using MedicarePayment Policy to Transform the Health System: A Framework for ImprovingPerformance.” Health Affairs Web Exclusive (January 27, 2009): 238–50.
Gwatkin, D., and M. Guillot. 2000. The Burden of Disease among the Global Poor:The Current Situation, Future Trends and Implications for Strategy. Washington,DC: World Bank.
Harbianto, Deni, and Ki Hariyadi. 2008. “Updated Equitap Analysis.” ConsultantReport for the World Bank, Jakarta.
Hasbullah, R. 2007. “Premium Calculation for Health Insurance Based onASKESKIN Program Year 2007.” A Report for the Center for HealthFinancing and Risk Protection, MoH, Jakarta.
Hawkins, L. “Background Report on Pharmaceutical Sector Governance andFinancial Assessment.” Consultant report, World Bank, Jakarta.
Hawkins, L., P. Harimurti, C. Rokx, and P. Marzoeki. 2009. “Policy Note onPharmaceutical Sector in Indonesia.” World Bank, Jakarta.
Hill, Kenneth, K. Thomas, C. AbouZahr, N. Walker, L. Say, M. Inoue, and E.Suzuki. 2008. “Estimates of Maternal Mortality Worldwide between 1990 and2005: An Assessment of Available Data.” The Lancet 370: 1311–19.
Heller, P. 2005. “Understanding Fiscal Space.” Policy Discussion Paper No.PDP/05/4, International Monetary Fund, Washington, DC.
HMN (Health Metrics Network). 2007. “Indonesia Health Information SystemReview and Assessment.” Draft consultancy report, MoH, BKKBN, BPS,MoHA, Jakarta.
Hollingsworth, B. 2008. “The Measurement of Efficiency and Productivity ofHealth Care Service Delivery.” Health Economics 17 (10): 1107–28.
Hsiao, B. 2008. “World Bank Institute Senior Policy Seminar, Health Financing inTurkey.” Ankara, Turkey May 28–30.
Hull, T., and H. Mosley. 2008. “Revitalization of Family Planning in Indonesia.”Draft consultancy report, BKKBN, Jakarta.
Hurst, J. 2002. “Performance Measurement and Improvement in OECD HealthSystems: Overview of Issues and Challenges.” In ‘Measuring Up.’ ImprovingHealth System Performance in OECD Countries, ed. P.C. Smith. Paris:Organisation for Economic Co-operation and Development.
ILO (International Labor Organization). 2003. Social Security and Coverage forAll: Restructuring the Social Security Scheme in Indonesia – Issues and Options.International Labour Office: Jakarta.
154 Bibliography

IMF (International Monetary Fund). 2007. “Turkey: Improving the Efficiency andEffectiveness of Government Health Expenditure.” Unpublished, IMF,Washington, DC.
———. 2008. Indonesia: 2008 Article IV Consultation—Staff Report. Washington,DC: International Monetary Fund.
Jamison, D., J. Breman, A. Measham, G. Alleyne, M. Claeson, D. Evans, P. Jha, A.Mills, and P. Musgrove, eds. 2006. Disease Control Priorities in DevelopingCountries, Second Edition. Washington, DC: World Bank and New York:Oxford University Press.
Jamsostek. 2008. “Manuals for Members Health Insurance JPK.”
Johannes, L. 2007. “Output-based Aid in Health: The Argentine Maternal-ChildHealth Insurance Program.” OBApproaches Note No. 13, Global Partnershipon Output-Based Aid, World Bank, Washington, DC.
Kosen, S., and D. Dunlop. Forthcoming. “Indonesian Mortality RegistrationSystem Strengthening, Project Working Paper 2, 2008.” National Institute forResearch and Development, MOH, and AusAID, Jakarta.
Kristiansen, S., and P. Santoso. 2006. “Surviving Decentralisation? Impacts ofRegional Autonomy on Health Service Provision in Indonesia.” Health Policy77 (3): 247–59.
Kruse I., M. Pradhan, and R. Sparrow. Forthcoming. “Health Spending andDecentralization in Indonesia.”
Kutzin, J. ed. 1995. “The Consequences of Health Financing Change: AFramework for Analysis.” Unpublished draft report, World HealthOrganization, Geneva.
Langenbrunner, J., C. Cashin, and S. O’Dougherty. Forthcoming. “How to Do It:Manuals for Designing and Implementing a Health Care Provider PaymentSystem.”World Bank, Washington, DC.
Langenbrunner, J., and A. Somanathan. Forthcoming. “Health Financing Note:East Asia Pacific Region.” World Bank, Washington, DC.
Lewis, B. 2005. “Indonesian Local Government Spending, Taxing and Saving: AnExplanation of Pre and Post Decentralization Fiscal Outcomes.” AsianEconomic Journal 19 (3): 291–317.
Lewis, B., and D. Pattinasarany. 2007. “Citizen Satisfaction with Local Health andEducation Services in Indonesia.” Presentation at the DecentralizationSupport Facility, Jakarta, September 20, 2007.
Liu, X. 2003. Policy Tools for Allocative Efficiency of Health Services. Geneva: WorldHealth Organization.
McIntyre, D. 2007. “Learning from Experience: Health Care Financing inLow- and Middle-Income Countries.” Global Forum for Health Research,Geneva.
Bibliography 155
Miller, D. 2004. “Decentralization in Indonesia’s Health Sector: An Update;Essential Public Health Functions: Prevention, Control and Surveillance ofInfectious Diseases.” Consultant report, World Bank, Jakarta.
Mocan, H. N., E. Tekin, and J. S. Zax. 2004. “The Demand for Medical Care inUrban China.” World Development 32 (2): 289–304.
MoH (Ministry of Health). 2004. “National Household Health Survey (SKRT)2004.” Litbangkes (National Institute of Health Research and Development),Jakarta.
———. 2007. “Indonesia’s Hospital Statistics, Series I-IV” Medical ServiceInformation Unit, Jakarta.
———. 2007a. “Indonesian Health Profiles.” Ministry of Health, Jakarta.http://www.depkes.go.id/downloads/publikasi/Profil%20Kesehatan%20Indonesia%202007.pdf.
———. 2007b. “Seri I - Hospital Activity Report.” Hospital Information Unit, DGMedical Service, MoH, Jakarta.
———. 2008. “Program Implementation Manuals for JAMKESMAS Program.”Ministry of Health, Jakarta, Indonesia, updated January 2009.
MoH, CHR-UI, and WHO (Ministry of Health, Faculty of Public Health(University of Indonesia), and World Health Organization). 2008. “TheIndonesian National Health Account 2002 – 2004.” Center for HealthFinancing and Health Security, Ministry of Health. Jakarta.
MoH and Statistics Indonesia. 2006. “Risk Behavior and HIV Prevalence in TanahPapua 2006: Results of the IBBS 2006 in Tanah Papua.” Jakarta.
Mukti, A., and S. Riyarto. 2008. “Assessment and Review for PT Askes.” WorldBank, Jakarta.
Musgrove, P. 1996. “Public and Private Roles in Health.” Discussion paper No.339, World Bank, Washington, DC.
Newby, L., R.-L. Kolehmainen-Aitken, S. Chandrawila, and B. Wasisto. 2004. “TheContent and Uses of Health Laws: An Overview of Selected InternationalModels and Lessons Learned for Possible Application in Indonesia.”Consultant report for Management Sciences for Health (MSH), Jakarta.
Nichols, L. 1995. “Numerical Estimates and the Policy Debate.” Health Affairs 14(1): 56–9.
O’Donnell, O., E. van Doorslaer, R. P. Rannan-Eliya, A. Somanathan, S. Adhikari,B. Akkazieva, D. Harbianto, et al. 2008. “Who Pays for Health Care in Asia?”Journal of Health Economics 27 (2): 460–75.
OECD (Organisation for Economic Co-operation and Development). 2008a.OECD Health Data 2008: Statistics and Indicators for 30 Countries. Paris:OECD.
156 Bibliography
———. 2008b. OECD Reviews of Health Systems: Turkey. Paris: OECD.
Pabon Lasso, H. 1986. “Evaluating Hospital Performance through SimultaneousApplication of Several Indicators.” Bulletin of the Pan American HealthOrganization 20 (4): 341–57.
Parliamentary Commission X. 2008. “Report by Medical Education WorkingGroup.” Jakarta.
Poullier, J. P. 1992. “Administrative Costs in Selected Industrialized Countries.”Health Care Financing Review 13 (4): 167–72.
P.T. Askes. 2004. “ASKES in Statistics.” PT ASKES, Jakarta, Indonesia.
———. 2006. “Manuals for Members, ASKES Social Health Insurance,” 3rdEdition. PT ASKES, Jakarta, Indonesia.
Rannan-Eliya, R. P., and L. Sikurajapathy. 2008. “Sri Lanka: ‘Good Practice’ inExpanding Health Care Coverage.” In Good Practices in Health Financing, eds.P. Gottret, G. Schieber, and H. Waters. Washington, DC: World Bank.
Sahn, D., and D. Younger. 2000. “Expenditure Incidence in Africa: MicroeconomicEvidence.” Fiscal Studies 21 (3): 321–48.
Savedoff, W. 2007. “What Should a Country Spend on Health Care?” HealthAffairs 26 (4): 962–70.
Savedoff, W., and P. Gottret, eds. 2008. Governing Mandatory Health Insurance:Learning from Experience. Washington, DC: World Bank.
Shengelia, B., A. Tandon, O. B. Adams, and C. J. L. Murray. 2005. “Access,Utilization, Quality, and Effective Coverage: An Integrated ConceptualFramework and Measurement Strategy.” Social Science and Medicine 61 (1):97–109.
Soewondo, P. 2008. “Health Insurance Claim Data Collection and Processing.”Consultant report for World Bank, Jakarta.
Statistics Indonesia, National Family Planning Coordinating Board, Ministry ofHealth, and Macro International. 2008. “Indonesia Demographic and HealthSurvey 2007: Preliminary Report.” Statistics Indonesia, Jakarta, and MacroInternational, Calverton, MD.
Sugiyarto, G., M. Oey-Gardiner, and N. Triaswati. 2006. “Labor Markets inIndonesia: Key Challenges and Policy Issues.” In Labor Markets in Asia: Issuesand Perspectives, eds. J. Felipe and R. Hasan. New York: Palgrave Macmillan forthe Asian Development Bank.
Thabrany, H. 2003. “Indonesia’s National Social Security System: An AcademicPaper.” School of Public Health, Universitas Indonesia, Jakarta.
———. 2005. “Brief History of Health Insurance Development in Indonesia.” InSocial Health Insurance: Selected Case Studies from Asia and the Pacific. Manila:World Health Organization, Western Pacific Region Office.
Bibliography 157
Thabrany, H., A. Gani, Pujianto, L. Mayanda, Mahlil, and B. S. Budi. 2003. “SocialHealth Insurance in Indonesia: Current Status and the Plan for NationalHealth Insurance.” Working paper presented at Social Health InsuranceWorkshop, WHO-SEARO, New Delhi, March 13–15.
Van de Walle, D. 1995. “The Distribution of Subsidies through Public HealthServices in Indonesia, 1978–87.” In Public Spending and the Poor: Theory andEvidence, eds. D. van de Walle and K. Nead. Baltimore: Johns HopkinsUniversity Press.
Van Doorslaer, E., O. O’Donnell, R. P. Rannan-Eliya, A. Somanathan, S. R.Adhikari, C. C. Garg, D. Harbianto, A. N. Herrin, M. N. Huq, and S.Ibragimova. 2006. “Effect of Payments for Health Care on Poverty Estimatesin 11 Countries in Asia: An Analysis of Household Survey Data.” Lancet 368(9544): 1357–64.
Van Doorslaer, E., O. O’Donnell, R. P. Rannan-Eliya, A. Somanathan. S. R. Adhikari,C. C. Garg, D. Harbianto, A. N. Herrin, M. N. Huq, S. Ibragimova, A. Karan, T. J. Lee, G. M. Leung, J. F. Lu, C. W. Ng, B. R. Pande, R. Racelis, S. Tao, K. Tin,K. Tisayaticom, L. Trisnantoro, C. Vasavid, and Y. Zhao. 2007. “CatastrophicPayments for Health Care in Asia.” Health Economics 16 (11): 1159–84.
Wagstaff, A., P. Paci, and E. Van Doorslaer. 1991. “On the Measurement ofInequalities in Health.” Social Science and Medicine 33 (5): 545–57.
Walker, B. 2008. “Towards Universal Health Insurance for Indonesian People.”Preliminary Consultant Report, World Bank, Jakarta.
WHO (World Health Organization). 2000. The World Health Report 2000. HealthSystems: Improving Performance. Geneva: World Health Organization.
———. 2006. Working Together for Health: The World Health Report 2006. Geneva:World Health Organization.
———. 2008a. The Global Burden of Disease: 2004 Update. Geneva: World HealthOrganization.
———. 2008b. The World Health Report 2008: Primary Health Care–Now MoreThan Ever. Geneva: World Health Organization.
———. 2008c. World Health Organization. National Health Accounts Database.http://www.who.int/nha/country/idn/en/.
WHO, UNICEF, UNFPA, and World Bank. 2008. Maternal Mortality in 2005.Geneva: World Health Organization.
WHO-SEARO. 2006. “Regional Strategy for Health Promotion: Follow-up ofSixth Global Conference on Health Promotion: Health Promotion andDedicated Taxes.” World Health Organization South-East Asia RegionalOffice, New Delhi.
Wiener, M. 2007. “Estimated Cost of Pensions, Old-Age Savings, and HealthInsurance under the National Social Security System Law.” In “Preparatory
158 Bibliography

Studies on National Social Security System in Indonesia.” Asian DevelopmentBank, Manila.
World Bank. 2002. “Indonesia Health Strategy in a Post-Crisis, DecentralizingIndonesia.” Report No. 12834-IND, World Bank, Washington, DC.
———. 2005a. “Civil Service Reforms at the Regional Level: Opportunities andConstraints.” World Bank, Jakarta.
———. 2005b. “Indonesia Fuel Subsidy Reallocation.” Poverty and Social ImpactAnalysis for the Second Development Policy Loan, World Bank, Jakarta.
———. 2006. “Making Services Work for the Poor: Nine Case Studies fromIndonesia.” World Bank, Jakarta.
———. 2007a. “Making the New Indonesia Work for the Poor.” World BankOffice, Jakarta.
———. 2007b. Spending for Development: Making the Most of Indonesia’s NewOpportunities. Indonesia Public Expenditure Review. Washington, DC: WorldBank.
———. 2008a. “Enhancing Government Effectiveness in a Democratic andDecentralized Indonesia.” Indonesia 2008 Development Policy Review. EAP-PREM, World Bank, Jakarta.
———. 2008b. “Indonesia Quarterly Economic Update: Battening Down theHatches.” World Bank, Jakarta.
———. 2008c. “Investing in Indonesia’s Health: Challenges and Opportunities forFuture Public Spending.” Health Public Expenditure Review 2008. WorldBank, Jakarta.
———. 2009a. “Giving More Weight to Health: Assessing Fiscal Space for Healthin Indonesia.” World Bank, Jakarta.
———. 2009b. “Indonesia’s Doctors, Midwives, and Nurses: Current Stock,Increasing Needs, Future Challenges and Options.” Report No. 46815, WorldBank, Jakarta.
———. Various years. World Development Indicators. Washington, DC: WorldBank.
———. Forthcoming. “Report on the Study of Small Loans in Indonesia.” WorldBank, Jakarta.
Xu, K., D. B. Evans, K. Kawabata, R. Zeramdini, J. Klavus, and C. Murray. 2003.“Household Catastrophic Health Expenditure: A Multicountry Analysis.”Lancet 362 (9378): 111–7.
Bibliography 159


161
A
absenteeism of health workers, 134administration, 122n9, 141, xxviiiagriculture, 13fallocative efficiency, 63–65ambulatory care, 37t, 80fArgentina, interfiscal transfers, 133b–134bAskes, 29, 111, xxv
comparison with other schemes, 36t–39tcoverage, 32f, 33f, 34
by income, 101ffunding of, 40provider payment and contracting, 41utilization rates, 148t
Askes Persero, 29Askeskin, 2, 40, 76, xxv
comparison with other schemes, 36t–39t
coverage, 34, 101ffunding of, 40health cards, 31, 91n7impact on health spending, 48–49pharmaceutical spending, 51potential cost increase under expansion
scenarios, 118provider payment and contracting, 41
Asuransi Kesehatan (Health Insurance). See Askes
Asuransi Kesehatan Masyarakat Miskin(Health Insurance for PoorPopulation). See Askeskin
avian influenza, 11
B
basic benefit package (BPP), 95f, 111–12affordability, 95–96expansion and development process,
102–3willingness to pay for, 117
benchmarking, 53–54benefit packages, 37t–38t, 40Bidan Di Desa (BDD) program, 24n4birth attendance, skilled, 2t, 68, 69fbudget efficiency, 132
C
capitation, 41care quality, 86fcatastrophe spending, 73–74, 74t,
75f, 91n6reasons for low incidences of, 76
Index
Boxes, figures, notes, and tables are indicated by b, f, n, and t respectively.

catastrophic headcount, 91n8check-ups, scheme comparison, 38tchild mortality, 71b, 83fChina, life expectancy rate, 55choice, of providers, 24fcivil servants, 29, 42tColombia, MHI introduction, 135n5community-based financing program,
36t–39tcommunity-based initiatives, 30concentration index, 91n9Concept for Presidential Regulation for the
National Health InsuranceProgram, draft, 139
consumer dissatisfaction, 84–85, 84fcontracting mechanisms, 41–42contributions, 77, 77t, 79fcost data, lack of, 4, 120cost projections, xxvicost sharing, by plan, 39tcosting issues, 116–18, 120–21costs, administrative, 122n11coverage, 32, 111. See also universal
coveragebreakdown of, 32fby employment status, 100, 100tby income and program, 101fby type, 33f, 34, 36teffective, 68, 70estimates of behavioral-demand
response due to increase in, 145expansion cost assessment, 117framework for expanding, 108–11,
108t–109ttransition to UC options, 115–16
curative care, 15, 86f
D
data, 116, xxvii–xxviiiinadequacies of, 23lack of, 120
data collection, 5–6death, causes of, 11decentralization, 1–2, 15, xxiii–xxivdemographic changes, 9–11, 12fdemographic indicators, 10tdependency ratio, 12f, 24n1diphtheria, 68, 69f, 70, 70tdisease burden, change in, 106Disease Control Priorities Project, 64disease patterns, 11
doctors, 3, 20, 21fratio by region, 22tratio of specialists to population, 22, 23t
documentation on good practice, 96–99DPT3 (three doses of the diphtheria,
pertussis, and tetanus vaccine), 68,69f, 70, 70t
drug formularies, 107drug reimbursement rates and pricing, 107
E
economic conditions, favorable, 124–27economic efficiency, 64economic growth, 126f, xxiieducation levels, impact on health, 59efficiency, 63–68, 70
Sri Lanka, 70, 71beligibility criteria, 34, 40employment, 13–14, 13f, 14f
status of covered individuals, 100, 100tepidemiological changes, 11equipment, 19evidence base, good practices in MHI
reform, 96–99exclusions, scheme comparison, 37t
F
facilities. See health facilitiesfamily planning programs, 11fees, 16, 41fertility rate, 2t, 11financial crisis of 1997–98, 30financial crisis, potential impact of, 3financial protection, 70, 72–73financing. See health financingfiscal capacity, 31, xxiii–xxivfiscal space for health, 3, 124, 125b
assessing availability, 123, xxvi–xxviicreating through MHI, 131reprioritizing budget, 127, 129through efficiency, 132
foreign aid, 129–30funds, flow of, 31, 43f, 44f
G
gender, female literacy impact on healthoutcomes, 59
gender, of employed, 13fgenerics, 50geographic issues, 101
162 Index

Good Practices in Health Financing: Lessonsfrom Low- and Middle-IncomeCountries, 98
governance, 96–97, 97tstrengths and weaknesses, 87–88
Governance and Decentralization Survey 2(GDS2), 18, 85
Governing Mandatory Health Insurance,96–97
government. See also decentralization; fiscal space
capacity, xxiii–xxivchoose health insurance system, 140financing sources, 123–24, xxvi–xxviiflow of funds, 43fhealth spending, xxiv, xxviii (See also
public health spending)opt-out option, 93, 94, 104–5, 122n2ownership of health facilities, 15–16
Government Regulation for Social Security Beneficiaries, draft law, 139
grants, 129gross domestic product (GDP)
and number of hospital beds, 17fand supply of health workers, 21fper capita country comparison, 55f
H
health budget, reprioritizing, 127, 129health cards, 33f, 72–73, 91n7health care, 15, 86fhealth care network, construction of, 16health delivery system, strengths and
weaknesses, 88–89health facilities, 15, xxiv. See also hospitals;
public health facilities; Puskesmasefficiency, 66f, 67–68, 67futilization of, 22, 23f
health financing. See also public healthfinancing
health financing functions, 4, 95f, xxiiiHealth Financing Revisited, 99health financing study, 3–4, 6–7health funding, varies by district, 31–32health indicators, 1, 2thealth information system (HIS),
assessment of, 22–23health insurance. See also Askes; coverage;
Jamkesmas; mandatory healthinsurance; private voluntary health
insurance; providers; reforms;Social Health Insurance
current status, 111–12framework for expansion, 108–11,
108t–109treform design and implementation,
xiiischeme comparison, 36t–39tstatus and utilization rates, 145, 146t,
148t–149t (See also health services,utilization)
type and coverage, 35fHealth Insurance for Poor Population, 31Health Insurance Scheme for Population.
See Jamkesmashealth outcomes, 54–55, 57, 59
and health spending, 60–61, 62–63and trends, 2tsocioeconomic and geographic
disparities in, 82, 83fhealth policy, 121, xxvii
data needed for development, 140enabling factors, 98fgoals, 53, 72implementation of UC, 140–42,
xxvii–xxviiireform baseline, 86–90socioeconomic and institutional realities
affecting, 99–102health reform, 1–2, 140, xxii
and demographic factors, 10–11baseline, 86–90enabling conditions for, 98, 98f, 99framework for proposals, 108t–109tlessons learned from other countries,
138–39options, 113–15pharmaceuticals, 106–7
Health Reform Task Force, 142health resources, 129–32health sector review, 3–6health services, 16–19
access to, 16, xxivnot covered under plans, 38tpurchasing of, 28, 28fquality of, 84–86, 84futilization, 22, 25n9
data inadequate, 23decline of, 3differences in, 147, 148t–149tequity in, 78, 80low due to dissatisfaction, 84, 84f
Index 163

projections considering demographicsand coverage increase, 119f, 147
utilization rates, 117by insurance status, 145, 146tpublic and private, 80f
health system, 14–16, xxiiefficiency in Sri Lanka, 71binefficiency and inequality of, 3measuring performance, 60–62organization of, 104f
health workers, 20, 134, xxiv. See alsodoctors
supply versus income, 21fhealth, low priority of, 127, 129HIV/AIDS, 11hospital beds, 18t, 24n3
occupancy rate, 66–67, 66f, 67fto population ratio, 17, 17f
hospital care, 37t, 42t, 117health spending on, 41–42, 65, 65tsatisfaction levels, 84–85, 84f, 85fsubsidies, 81t, 82futilization projections, 147utilization rates, 80f, 146t
hospital case flow, 66–67hospital efficiency, 66f, 67, 67f, 68hospitals, 17, 18t
classified by bed numbers, 24n3drug pricing and prescribing, 106–7public, 15–16
human resources, for health, 20, 22
I
immunization, 2t, 68, 69f, 70, 70timplementation factors, 98fincome, 61f, 64f
and health spending, 62fand life expectancy, 56fand maternal mortality and literacy, 60fand public health spending, 63fas predictor of health, 54–55of those covered by program, 101f
Indonesia, 53Indonesia Family Life Survey (IFLS), 85inequalities, in distribution of health
workers, 20infant mortality rate (IMR), 1, 2t, 59
by province, 83fcountry comparison, 57f, 59fhigh, 55, 57versus income, 58f
inflation, 50f
informal sector, 14, 101, 132treatment of workers under MHI
options, 115infrastructure, for health services, 16–19,
xxivinjuries, 11inpatient services, scheme comparison, 37tinstitutional issues, 98f, 99–102interfiscal transfers, 132, 133b–134binternational organizations, aid of, 129–30interventions, cost-effectiveness of, 64
J
Jaminan Kesehatan Masyarakat (HealthInsurance Scheme for thePopulation). See Jamkesmas
Jaminan Pemeliharaan KesehatanMasyarakat (JPKM), 30, 33f,36t–39t
Jaminan Sosial Tenaga Kerja (WorkforceSocial Security). See Jamsostek
Jamkesmas, 2, 40, 111, xxvcomparison with other schemes, 36t–39tcost projections, xxvicoverage, 32, 32f, 34
by income, 101fof poor, 34
drug spending, 106expansion, 31, 113, 116financial protection improvement, 76health services use increase due to
insurance status, 145, 146tpotential cost increase under expansion
scenarios, 118projected use changes due to
demographics and expansion, 119fprovider payment and contracting, 41utilization rates, 147, 148t
Jamsostek, 29, 40, 111, xxvcomparison with other schemes,
36t–39tcoverage, 32f, 33f, 34, 111
by income, 101fof better off, 34
data inconsistencies, 51n3–52n3drug spending, 106expansion of, 116funding of, 40provider payment and contracting, 41utilization rates, 117, 148t
Jaring Pengaman Sosial (Social Safety Net), 30
164 Index

K
Kakwani index, 79f, 79fn
L
labor market, 13–14leasing, equipment, 19legislation, 93, 94f, 113, 139life expectancy, 2t, 54–55, 59
country comparison, 54fversus income, 56f, 57f
literacy, female, 59, 60floans, 129
M
macroeconomic conditions, 124–27malnutrition rates, 1, 2tmanagement, 39t, 87–88mandatory health insurance (MHI), 29, 93,
xxi, xxvcapture of OOP payments, 131design and costing of, 111–18, 120–21expansion issues, 102–7expansion options, 114–15, 122n10extending Jamkesmas, 113governance factors, 96–97, 97treform based on evidence of good
practices, 96–99system design and transition options,
95–96manufacturing, 13fmaternal mortality rate (MMR), 1, 2t,
59, 60fBDD program, 24n4increase in, 90n3Indonesia and Sri Lanka, 71b
maternity benefits, scheme comparison, 37tmedicine, availability of, 19Medium-Term Development Plan (RPJM),
142methodology, 5–6midwives, 20, 22t, 24n4Ministry of Health (MoH), 14–15, 29, 141,
xxv, xxviiimortality rates, 1, 2t. See also child
mortality; infant mortality rate;maternal mortality rate
N
National Health Services (NHS), 28, 113, xxv
National Health Survey, 84
National Social Security Law No. 40/2004,93, 94f, 113, 139
National Social Security System, 93, 94nurses, 20
O
opt-out option, 93, 94, 104–5, 122n2out-of-pocket (OOP) payments, 40, 46–49,
46f, 47f, 62, xxivand financial catastrophe, 73–74,
74t, 75fand impoverishment, 75–77, 76fas health financing source, 77tdecrease with increase in public health
spending, 44in rich versus poor households, 72,
73f, 78share of health spending, 49f, 64f, 72
outsourcing, maintenance, 19
P
P.T. Askes, 29, 40, xxvdrug spending management, 106program for poor, 31
P.T. Jamsostek, xxvPembangunan Kesehatan Masyarakat
Desa, 30pertussis, 68, 69f, 70, 70tpharmaceutical sector, 19–20, 141, xxviii
reform, 106–7pharmaceuticals, 49–51, 50Plan Nacer, 133b–134bpolicy. See health policypooling revenues, 28, 28fpoor, coverage of, 31, 34, 42tpopulation growth, 9–11, 10tpopulation, employment status of, 13–14,
100, 100tpoverty, 75–77, 76f, 101, xxiiPoverty Assessment, 77prenatal care, 86fprivate health insurance, 36t–39t, xxvprivate health sector, 15, 50private health services, utilization of,
22, 80fprivate health spending, 46–48, 46f, 47f
bigger role than public, 44, xxiv–xxvflow of funds, 44fper capita, 49f
private hospitals, 17, 18tprivate voluntary health insurance (PVHI),
28, 105–6
Index 165

provider payment, 41–42, 112by plan, 39texpanding, designing, and implementing,
103–4, 104fto hospitals for drugs, 106–7
providers, 32, 34, 97–98choice, 24f, 37tquality of, 85
Public Expenditure Review, 134public health care, 15, 22public health financing, 15, 34, xxviii
alternatives, xxvi–xxviiassessment and policy goals, 53enabling factors for reform, 98fequity in, 77–78evolution of, 29–32, 112fexternal sources, 129–30, 130flessons learned from others’ reforms,
138–39models of, 28–29pro-poor emphasis, 30program comparisons, 36t–39treform literature, 96revenue generation, 40sources, 51n2, 77t, 79f
by scheme, 38t–39tnew, 123–24
strengths and weaknesses, 89–90system functions, 27–29, 28f
public health spending, 3, 46f, 60–62, xxviactual and projected, 128tand health outcomes, 60–63and infant and child mortality
outcomes, 71bBPP affordability, 95–96catastrophes, 73–74, 74t, 75fcompared to total spending as share of
GDP, 129fcovered, 42tdecrease in per capita, 47–48differences among programs, 41district level, 132dominated by salaries and benefits to
rich, 134efficiencies in, 132, 134financed externally, 129–30, 130ffiscal space scenario, 125bfuture scenarios, 121, 121fhospital care, 41–42, 65, 65timpacts of UC, 120, 141–42increase in, 44, xxiv–xxvmeasuring total, 61
OOP, 44, 64fper capita, 49f, 63f
versus income per capita, 61fpharmaceuticals, 49–51pro-poor, 81projections, 120, xxvirises faster than GDP and rising trends,
126–27, 127fselected indicators, 45tshare of total government spending,
62f, 63ftotal as share of GDP, 61ftotal, public, private, and OOP, 46–48,
46f, 47f, 48f, 49ftrends, 42, 44, 46–51, 46f
purchasing, health services, 28, 28f, 112Puskesmas (health centers), 15, 16, 18, 19.
See also health facilities; hospitalsPuskesmas Keliling, 24n5
Q
quality, infrastructure and equipment, xxivquality, of care, 86f
R
reform. See health reformRencana Pembangunan Jangka Menengah
(Medium-Term Development Plan,or RPJM), 142
report focus, 137–38report objectives, 4–6resources, for health, 129–32revenue collection, for health financing,
27–28, 28f
S
self-insured, 33f, 36t–39tself-treatment, 3, 22, 23fservices sector, employment, 13fsmoking, 24n2Social Health Insurance (SHI), 28, xxv
contributions, 77, 77t, 79fenabling conditions for, 99flandmarks in, 30t
Social Safety Net, 30Social Security Administering Bodies, draft
law, 139Social Security Law No. 40/2004, 93, 94f,
113, 139Social Security, willingness to pay for, 117socioeconomic issues, 9, 99–102
166 Index

Sri Lanka, health system efficiency, 70, 71bStaats Regeling 1/1934, 51n1subsidies, 2fsubsidy distribution, 81–82, 81t, 91n9supply-side constraints, xxviiiSurvei Kesehatan Nasional (National
Health Survey, or Surkesnas), 84Susenas survey, 145
T
taxation, 77–78, 77t, 79fearmarked and sin, 130–31
technical efficiency, 64, 66–68tetanus, 68, 69f, 70, 70tThailand, life expectancy rate, 55tobacco, 24n2, 130–31
U
unemployment rate, 102uninsured, 32funiversal coverage (UC), 121,
xxv–xxvi, xxviiand current HI features, 111–12demographic factors for, 10–11few countries have achieved, 137framework for assessing cost and
coverage impacts, 110t
government commitment to, xxihealth spending impacts, 120, 141–42,
xxvi, xxviiiimplementation, 112, 112f, xxviii–xxix
and policy development, 142lack of actuarial and economic
assessments, 4through MHI system, 2–3, 114–15transition, 93, 94f, 101–2, xiii
aid of current HI features, 111–12assessing cost and coverage impacts,
110tdata needed, 116key questions for, xxi–xxiioptions, 115–16platform for, 31steps followed by other countries,
112, 112fuser fees, 16, 41
V
vaccine, DPT3, 68, 69f, 70, 70tVillage Community Development, 30
W
Workforce Social Security. See Jamsostekworking groups, 142
Index 167

ECO-AUDIT
Environmental Benefits Statement
The World Bank is committed to preservingendangered forests and natural resources. TheOffice of the Publisher has chosen to printHealth Financing in Indonesia on recycledpaper with 30 percent postconsumer fiber inaccordance with the recommended standardsfor paper usage set by the Green PressInitiative, a nonprofit program supportingpublishers in using fiber that is not sourcedfrom endangered forests. For more informa-tion, visit www.greenpressinitiative.org.
Saved:• 4 trees• 1 million Btu of total
energy• 361 lb. of net
greenhouse gases• 1,738 gal. of waste
water• 106 lb. of solid waste


In 2004, the Indonesian government committed to provide health insurance coverage to
its entire population through a mandatory health insurance program. As of 2008, its public
budget provided coverage for 76.4 million poor and near poor, but more than half of the
population still lacked health insurance. The authors of Health Financing in Indonesia develop
a baseline of current health policies, highlighting their strengths and weaknesses in light of
current epidemiological and socioeconomic trends, and provide a comprehensive framework
for reform in the key fi nancing functions involved in providing universal coverage (UC):
revenue collection, risk pooling, and purchasing.
The book also provides an analytical framework based on global good practices, as well as
rudimentary cost options for the transition to UC. Health Financing in Indonesia will be of
interest to readers working in the areas of health care and public health, social protection, and
social analysis and policy, in Indonesia and in other countries aiming for universal coverage.
ISBN 978-0-8213-8006-2
SKU 18006