health homes - ohiomha.ohio.gov/portals/0/assets/initiatives/healthhomes/ohio-health...to establish...
TRANSCRIPT

3133 East Camelback Road, Suite 300 Phoenix, AZ 85016-4501
Phone 602.264.6382 Fax 602.241.0757
HEALTH HOMES
COST SAVINGS ANNUAL REPORT
January 2015 Final (F3)

Health Services Advisory Group, Inc. - FINAL (F3) - Cost Savings Annual Report Ohio Department of Medicaid January 2015 Page i
CONTENTS 1. Executive Summary ......................................................................................................... 1-1
Background ...................................................................................................................... 1-1
Overview .......................................................................................................................... 1-3
High-level Results ............................................................................................................ 1-4
2. Methodology ..................................................................................................................... 2-1
Time Periods for Evaluation ............................................................................................. 2-1
Treatment and Control Groups ........................................................................................ 2-1
Data Sources ................................................................................................................... 2-2
Levels of Analysis ............................................................................................................ 2-2
Propensity Score-Based Matching Statistical Analysis .................................................... 2-3
Difference-in-Differences Analysis and Cost Savings Calculation ................................. 2-11
3. Results .............................................................................................................................. 3-1
Overview .......................................................................................................................... 3-1
Statewide Cost Savings ................................................................................................... 3-1
Health Home Cost Savings .............................................................................................. 3-2
Additional Levels of Analysis .......................................................................................... 3-14
Robustness Checks ....................................................................................................... 3-14
4. Summary of Findings ....................................................................................................... 4-1
Key Findings .................................................................................................................... 4-1
Limitations and Cautions .................................................................................................. 4-1
Appendix A. Results for Each Level of Analysis ............................................................... A-1
Appendix B. Covariate Balance Assessment ..................................................................... B-1
Appendix C. Propensity Score Models ............................................................................... C-1

Health Services Advisory Group, Inc. - FINAL (F3) - Cost Savings Annual Report Ohio Department of Medicaid January 2015 Page 1-1 1-11-1
1. EXECUTIVE SUMMARY
Background
The Affordable Care Act (ACA) of 2010 created an optional Medicaid State Plan benefit for states
to establish Health Homes. In order to treat the whole person, Health Homes integrate and
coordinate all care for Medicaid consumers living with chronic conditions.
In October of 2012, the Ohio Department of Medicaid (ODM), in conjunction with the Ohio
Department of Mental Health and Addiction Services (ODMHAS), announced the launch of the
Health Homes initiative for Medicaid consumers with severe persistent mental illness (SPMI),
which includes adults with serious mental illness (SMI) and children with serious emotional
disturbance (SED).
The philosophy of Health Homes is to treat each member through an integrated and coordinated
system of service delivery and multi-disciplinary team approach. This approach addresses an
individual’s multiple chronic and complex conditions, and also links him/her to non-clinical
community support systems. Better outcomes are expected as a result of more coordinated care
among clinical specialists and service providers and improved communication between patients
and caregivers. The goals of this initiative are to: improve the integration of physical and
behavioral healthcare; lower the rates of hospital emergency department (ED) use; reduce hospital
admissions and re-admissions; reduce healthcare costs; decrease reliance on long-term care
facilities; improve the experience of care, quality of life, and consumer satisfaction; and improve
health outcomes.
Health Home services include comprehensive care management, care coordination, health
promotion, comprehensive transitional care, individual and family support, and referral to
community and social support services. Six Health Homes participated in Phase I of the initiative,
as listed in Table 1-1 below.
Table 1-1—Participating Health Homes
Health Home Name Health Home Abbreviation
Butler Behavioral Health Services Butler
Harbor Harbor
Family Services of Northwest Ohio1-1
Family Services
Shawnee Mental Health Center Shawnee
Unison Behavioral Health Group Unison
Zepf Center Zepf
1-1 Family Services was added after the initial launch of the Phase I initiative; therefore, Family Services was not included
in this report.

Health Services Advisory Group, Inc. - FINAL (F3) - Cost Savings Annual Report Ohio Department of Medicaid January 2015 Page 1-2 1-21-2
The Health Homes service five counties in Ohio: Butler, Lucas, Adams, Scioto, and Lawrence
counties. Butler, Lucas, and Adams counties are in the West Region, and Scioto and Lawrence
counties are in the Central/Southeast region. Figure 1-1 displays the locations of each Health
Home.
Figure 1-1—Health Homes Locations Map
The Health Homes serving this population are evaluated using both clinical performance measures
and a cost savings calculation. The cost analysis is used as part of the comprehensive evaluation of
the Health Homes. The results of this analysis should assist the ODM in determining whether
Health Homes save money after accounting for program costs. An additional analysis of utilization
rates was conducted as part of the comprehensive Health Home evaluation. The comprehensive
evaluation will serve as ODM’s mechanism for formally evaluating the impact of the Health
Homes. This report provides the findings for the cost analysis performed for the Health Homes.
Harbor Unison
Zepf
Butler
Shawnee

Health Services Advisory Group, Inc. - FINAL (F3) - Cost Savings Annual Report Ohio Department of Medicaid January 2015 Page 1-3 1-31-3
Overview
The cost savings methodology was developed using the approach outlined by ODM in its Health
Home State Plan Amendment submitted to the Centers for Medicare & Medicaid Services
(CMS).1-2
This study evaluated Medicaid costs incurred by Health Home Medicaid members.
ODM’s approach includes comparing changes in per member per month (PMPM) costs over time
for consumers that were enrolled in a Health Home (i.e., the treatment group) versus those that
were not enrolled in a Health Home (i.e., a control group). The comparison of a treatment group to
a control group allows for the calculation of expected costs for the Health Home population absent
the influence of the Health Home initiative. A control group with characteristics similar to the
treatment group was selected using propensity score-based matching. A difference-in-differences
analysis was performed to compare changes in costs from the baseline period (July 1, 2011,
through June 30, 2012) to the remeasurement period (January 1, 2013, through December 31,
2013) for both groups. Please refer to the Methodology section of the report for more detailed
information.
The advantage of this methodology is that it allows for a more precise estimate of the true effect of
the Health Home program by accounting for expected cost changes for Health Home members had
they not been enrolled in the program. This methodology minimizes or eliminates any cost changes
(e.g., reimbursement changes) that the Health Home population would have experienced regardless
of enrollment in the program. For example, if costs before and after Health Home enrollment
showed a 25 percent reduction, one might conclude that the Health Home program reduced costs
by 25 percent. However, this conclusion could be erroneous if, for example, costs generally
declined by 10 percent over that same time period. In this example, the true effect of the Health
Home program leads to a cost reduction of 15 percent (i.e., 25 percent minus 10 percent) rather
than 25 percent. By computing the cost changes for a similar group that was not enrolled in Health
Homes, it is possible to remove the confounding effect of any changes in costs that the Health
Home population would have experienced regardless of program participation.
HSAG evaluated the cost savings of the Health Home program for a variety of levels of analysis.
Table 1-2 depicts the levels of analysis that HSAG incorporated into the evaluation. For more
detailed information about the levels of analysis, please refer to page 2-2 in the Methodology
section.
1-2 Medicaid.gov. Approved Health Home State Plan Amendments. Available at:
http://www.chcs.org/usr_doc/Medicaid_Model_Data_Lab.pdf. Accessed on: January 21, 2014.

Health Services Advisory Group, Inc. - FINAL (F3) - Cost Savings Annual Report Ohio Department of Medicaid January 2015 Page 1-4 1-41-4
Table 1-2—Levels of Analysis Summary
Levels of Analysis Number of
Units
Number of Age (Adults vs. Children) Stratification Units
Number of Community Mental Health Centers (CMHC vs. non-CMHC)
Stratification Units
Total Units
Health Home 5 10 10 25
Health Home Design 2 0 0 2
Region and/or County* 1 2 2 5
Managed Care Plan (MCP)
5 0 0 5
Statewide 1 2 2 5
TOTAL 14 14 14 42
* Two of the units of analysis for the region and/or county analysis only include one Health Home (i.e., Butler County and Adams, Lawrence, and Scioto region); therefore, additional analysis was not required for these counties/regions.
High-level Results
All five of the evaluated Health Homes incurred statistically significant negative cost savings. The
magnitude of the negative cost savings ranged from $322 to $561 PMPM, with a statewide
negative cost savings of $516 PMPM. Table 1-3 displays the total statewide cost savings, in
addition to each Health Home. Forty-two different stratifications were evaluated (e.g., by age,
MCP, Health Home) and none of these subgroups showed an overall cost savings. However, two
Health Homes (Zepf and Shawnee) showed a significant cost savings in the Medical – Mental
Health category of service. The primary driver of the cost increases, ignoring average monthly
Health Home case rates, was found in pharmacy costs. Members in all five Health Homes had
significantly higher pharmaceutical costs than the comparison group, ranging in effect size from
$48 PMPM for Butler to $140 PMPM for Unison.
Table 1-3—Total Cost Savings by Health Home (PMPM)
Health Home Program Effect (Cost Savings)
Butler ($557) *
Harbor ($453) *
Shawnee ($322) *
Unison ($561) *
Zepf ($534) *
Statewide ($516) *
A negative cost savings indicates an increase in cost. N.S. indicates the results were not statistically significant. *Indicates statistical significance at the 95% confidence level or greater.

Health Services Advisory Group, Inc. - FINAL (F3) - Cost Savings Annual Report Ohio Department of Medicaid January 2015 Page 2-1 2-12-1
2. METHODOLOGY
Time Periods for Evaluation
The cost savings analysis compares costs over two time periods, a baseline period and a
remeasurement period. The baseline period was the period prior to Health Home program
implementation. The remeasurement period was used to reassess the treatment and control groups
after program implementation to determine if the Health Home program has successfully reduced
costs for treating its consumers.
The baseline and remeasurement report periods were developed given the following constraints:
1. The transition to Medicaid Information Technology System (MITS) began in August 2011,
which affected dates of service beginning in July 2011. Managed care encounters prior to
the implementation of MITS contain incomplete managed care payment data.
2. The Health Home program was implemented in October 2012.
The baseline period was July 1, 2011, through June 30, 2012. The remeasurement period was
January 1, 2013, through December 31, 2013. The report periods were structured to allow a 3-
month ramp-up period between the start of the Health Home initiative and the beginning of the
remeasurement period. For the treatment group during the remeasurement period, costs were
measured only during the member’s longest Health Home enrollment span. For example, if a
member enrolled in a Health Home on April 1, 2013, and remained enrolled through November 30,
2013, the member’s costs were assessed from April 1, 2013, through November 30, 2013.
Treatment and Control Groups
The treatment group consisted of members that met the following criteria:
Continuously enrolled for 6 months during the remeasurement period in one of the following
Health Homes: Butler, Harbor, Shawnee, Unison, or Zepf. Continuous enrollment was defined
as 6 consecutive months for which a Health Homes services CPT code (S0281) was present. A
1-month gap in the middle of the 6-month span was permitted.
Alive for the duration of the baseline period.
Reside in a Health Home county.2-1
2-1 Health Home counties are: Lucas, Butler, Adams, Scioto, and Lawrence.

Health Services Advisory Group, Inc. - FINAL (F3) - Cost Savings Annual Report Ohio Department of Medicaid January 2015 Page 2-2 2-22-2
The control group consisted of members that met the following criteria:
Continuously enrolled for 6 months in Medicaid during the remeasurement period.
Alive for the duration of the baseline period.
Reside in a Health Home county.
Never enrolled in a Health Home.
Data Sources
HSAG used the following data sources to calculate expected cost savings:
MCP-submitted encounter data
Fee-for-service (FFS) claims data
Medicaid eligibility and managed care enrollment data
Demographic data
Health Home enrollment data
The January vendor files supplied the encounter, claims, eligibility, managed care enrollment, and
demographic data, while the Health Home enrollment data came from the monthly Health Home
enrollment files from ODM.
Data were prepared in accordance with ODM specifications. Final claims were identified using the
adjusted ICN field, and only final claims were included in the analysis. Pharmacy data were de-
duplicated to remove duplicate pharmacy claims. The amount reimbursed field was used to identify
costs for the FFS claims.
Levels of Analysis
Costs savings were calculated for each category of service and overall (i.e., total) for each of the
levels of analysis described below.
Statewide Overall—All members meeting the criteria outlined in the Treatment and Control
Groups section were included in this analysis, and stratified by:
o Age Group.
o CMHC Experience.
Health Homes—Health Home members were assigned to a Health Home based on their longest
continuous enrollment span. Any ties were assigned to the most recent Health Home the
member was enrolled in. Analyses were stratified by:
o Age Group within each Health Home.
o CMHC Experience within each Health Home.
Health Home Design—Health Home design was evaluated as follows:

Health Services Advisory Group, Inc. - FINAL (F3) - Cost Savings Annual Report Ohio Department of Medicaid January 2015 Page 2-3 2-32-3
o Access to pharmacist on-site.
County—Lucas County was evaluated, and separately stratified by:2-2
o Age Group.
o CMHC Experience.
MCP—Members with at least 6 months of continuous enrollment in an MCP during the
remeasurement period were included in this analysis. The treatment group was limited to
members with at least 6 months of continuous MCP enrollment occurring simultaneously with
6 months of continuous Health Home enrollment. This analysis was limited to the following
MCPs: Buckeye, CareSource, Molina, Paramount, and UnitedHealthcare.
The Age Group stratification consisted of two analyses. One analysis limited members to only
those under 18 years of age as of the first day of the remeasurement period, and the second analysis
limited members to those that were 18 years of age or older as of the first day of the
remeasurement period.
The CMHC Experience stratification consisted of two analyses. One analysis limited members to
only those having a CMHC experience (i.e., if they had a claim with a provider type of 84 or a
provider ID of 000000002034042—OHIO DEPT OF MENTAL HLTH-MACSIS) during the
baseline period, and the second analysis limited members to those without a CMHC experience
(i.e., if they had no CMHC claims during the baseline period).
Propensity Score-Based Matching Statistical Analysis
For purposes of determining the expected cost savings, a non-Health Home population with
characteristics similar to the Health Home population was identified. Propensity score-based
matching is a common methodology used to select a control group that is statistically similar to a
treatment group.2-3
This is done through constructing a statistical model that predicts the
probability of an individual being enrolled in the program. The statistical model uses covariates (or
factors) that are intended to predict the likelihood of an individual being enrolled in the Health
Home program.
Additionally, the eligible control group population was subset accordingly for the MCP, age group,
and CMHC experience levels of analysis prior to propensity score matching. For example, the
eligible control group was limited to only Medicaid members younger than 18 years old for the
2-2 A separate analysis was only performed for Lucas County. Additional analyses are not required for Butler County and
Adams, Lawrence, and Scioto Region, since this county and region only contain one Health Home (Butler Health Home
and Shawnee Health Home, respectively). 2-3 Rosenbaum, P.R. and Rubin, D.B. (1985). Constructing a Control Group Using Multivariate Matched Sampling
Methods that Incorporate the Propensity Score. The American Statistician 39:33 – 38; Rosenbaum, Paul R., and Donald
B. Rubin. (1983). The central role of the propensity score in observational studies for causal effects. Biometrika
70(1):41-55.

Health Services Advisory Group, Inc. - FINAL (F3) - Cost Savings Annual Report Ohio Department of Medicaid January 2015 Page 2-4 2-42-4
“Shawnee – Under 18” level of analysis. The following sections describe the methodology for
generating propensity scores, and using those scores in subsequent analyses.
Covariate Identification
In order to help predict enrollment into the Health Home program, demographic and disease
covariates were identified for each member. All covariates were identified during the baseline
period, and were expected to be related to the likelihood of a member being part of the Health
Home population. Table 2-1 provides a list of the demographic and utilization covariates, and the
method that was used to identify each covariate. These covariates provided a starting place for
subsequent analyses. Some covariates were dropped because a given level of analysis failed to
provide sufficient data for a particular covariate.2-4
For instance, no one in the treatment group
under the age of 18 had congestive heart failure or an HIV infection. As a result, those covariates
were excluded from the model for the “Under 18” levels of analysis. Full details on the final list of
covariates used in each regression model can be found in Appendix B.
Table 2-1—Demographic and Utilization Covariates
Covariates Identification Method
Age
Age Member’s date of birth was used to identify the member’s age at the end of the remeasurement period.
Gender
Male
Female Member’s gender in the demographic file.
Race/Ethnicity
White Black Other
Members flagged as “D” or “C” were classified as White. Members flagged as “N” or “B” were classified as Black. All others were classified as Other.
County (County Code)
Butler (09) Lucas (48) Adams (01) Lawrence (44) Scioto (73)
Member’s county of residence as determined by county code.
Member Months
Number of months a member was enrolled in Medicaid.
Eligibility file was used to determine number of months enrolled in Medicaid.
Enrollment
Number of months enrolled in managed care
Medicaid enrollment
Number of months on a waiver Waiver eligibility
2-4 Specifically, binary covariates (e.g., disease covariates or county dummies) were dropped if there were 10 or fewer
Health Home members in the category.

Health Services Advisory Group, Inc. - FINAL (F3) - Cost Savings Annual Report Ohio Department of Medicaid January 2015 Page 2-5 2-52-5
Table 2-1—Demographic and Utilization Covariates
Covariates Identification Method
Number of months part of Covered Families and Children (CFC) population
Member was enrolled in CFC as defined by Aid Categories 4001, 4011, 4012, 4013, 4014, 4015, 4016, 4017, 4018, 4019, 4020, 4021, 4022, 4023, 4024, 4026, 4027.
Number of months part of Aged, Blind, or Disabled (ABD) population
Member was enrolled in ABD as defined by Aid Categories 4002, 4007, 4008, 4009.
Eligibility
Number of months as a dual eligible Member was dual eligible as defined by aid categories 3xxx.
Mental Health
Number of Visits to a Community Mental Health Center
Claims with provider type 84 or provider ID 000000002034042.
Serious and Persistent Mental Illness (SPMI) or Serious Emotional Disturbance (SED) Characteristics
Number of Mental Health Inpatient Admissions
Inpatient admissions (i.e., Claim Type I) with a primary diagnosis of mental health (i.e., anxiety disorders, conduct disorders, depression, mental disorder not otherwise specified as defined in Table 2-2).
Number of Mental Health Emergency Department Visits
Emergency department visit (i.e., defined in Table 2-4) with a primary diagnosis of mental health (i.e., anxiety disorders, conduct disorders, depression, mental disorder not otherwise specified as defined in Table 2-2).
Mental Health Prescriptions
Thirteen or more prescriptions from the following combined drug classes: 1) Psychother, Antidepressants; 2) Psychother, Tranq/Antipsychotic; 3) Antimanic Agents; 4) Anticonvulsant, Benzodiazepine; or 5) Anticonvulsant, Misc.
Note: Demographic covariates were selected for inclusion to capture any systematic correlation with Health Home enrollment status that is not explicitly captured by the disease covariates and eligibility/enrollment indicators included in the model. To the extent that unobserved factors are systematically related to age, race, gender, and geographic location, and also related to the likelihood of enrollment in a Health Home, the inclusion of such demographic factors will help account for these differences. Eligibility/Enrollment and mental health data were included in order to match Health Home members with non-Health Home members on these metrics.
Table 2-2 on the following page lists the disease covariates that were incorporated into the
propensity scoring methodology. Encounter data were used to identify members who had a primary
diagnosis for any of the diseases listed in Table 2-2. Each disease was evaluated separately. For
example, a member diagnosed with both Asthma and Hypertension was flagged as having two
disease covariates.

Health Services Advisory Group, Inc. - FINAL (F3) - Cost Savings Annual Report Ohio Department of Medicaid January 2015 Page 2-6 2-62-6
Table 2-2—Disease Covariates
Asthma Acute bronchitis Autism ADHD
Bipolar disorder Pregnancy Psychotic disorder Hypertension
Coronary atherosclerosis and other heart disease
Diabetes mellitus Other developmental
disorder Substance-related disorders
Developmental disorders Post-traumatic stress
disorder Cardiac dysrhythmias Spondylitis
Blindness and vision defect Thyroid disorders COPD and bronchiectasis Alcohol-related disorders
Obsessive-compulsive disorder
Cystic fibrosis Osteoarthritis Epilepsy
Anxiety disorders Conduct disorders Depression Mental disorder not otherwise specified
Esophageal disorders Congestive heart failure Cancer Other nervous system
disorders
Neoplasms of unspecified nature
Intracranial injury Delirium, dementia, and
amnestic and other cognitive disorders
HIV infection
Note: This list of disease covariates was developed based on an analysis of the common disease categories found for Health Home members. Primary diagnosis codes for Health Home members were grouped using the Clinical Classifications Software (CCS) developed by the Agency for Healthcare Research and Quality (AHRQ). Certain CCS categories were subdivided to capture additional specificity for mental illness diagnoses.
Propensity Score Matching
Propensity scores were derived in order to compare the Health Home and non-Health Home
populations, and reflect the probability that an individual was enrolled in a Health Home. The
propensity scores were then used to match members in the eligible control group with members in
the eligible treatment group.
The covariates previously discussed were used to estimate a propensity score for each member.
Logistic regression was used to calculate the propensity score, which is represented by:
)]...(exp[1
1)1Pr(
22110 ikkii
iXXX
Y
where )1Pr( iY
is the propensity score, the βs are parameters to be estimated, and the Xs are the
covariates.2-5
Propensity scores for the two groups were used to match the populations. A Greedy 5→1 digit
match was used for purposes of matching the populations.2-6
The Greedy 5→1 digit match means
2-5 Linden, A., Adams, J.L., and Roberts, N. (2005). “Using propensity scores to construct comparable control groups for
disease management program evaluation.” Disease Management Health Outcomes. 13(2): 107-115.

Health Services Advisory Group, Inc. - FINAL (F3) - Cost Savings Annual Report Ohio Department of Medicaid January 2015 Page 2-7 2-72-7
that the populations were first matched on the propensity score out to the fifth decimal place. For
those that did not match, the populations were then matched on the propensity score out to the
fourth decimal place. This process continued down to a 1-digit match. The result of this
methodology creates “best” matches first (i.e., matches with the greatest precision in propensity
score) and then matches on successive “next-best” matches. Once a case and control were matched,
the matches were not reconsidered. Therefore, subsequent matches were determined on what was
currently available.
For the statewide level of analysis, 84.6 percent of the eligible treatment group members were
matched with a control case. Appendix C contains detailed results of propensity score matching
for each level of analysis.
Due to small sample sizes in certain subgroups, and the concomitant lack of variation in some of
the covariates, some propensity score matching models failed to converge when all of the initial
covariates were included in the model. To reduce the number of covariates in the propensity score
matching model, while simultaneously keeping those that were more empirically relevant,
backwards stepwise logistic regression was used to identify the maximum number of relevant
covariates that could be retained in the model.
Covariate Balance and Bias Reduction
Selecting a control group that most closely resembles the treatment group by using propensity
scores has been shown to create a “covariate balance” between the two groups.2-7
After the
matching algorithm was applied, the covariates were evaluated to determine that the populations
were matched appropriately, meaning that the propensity scoring and matching process improved
covariate balance and reduced bias as anticipated. The results of the propensity score-based
matching were assessed by calculating standardized bias coefficients and computing the percentage
reduction in bias achieved through the matching process, as outlined below. This bias reduction
represents how much closer the control group is to reflecting the characteristics of the people in the
treatment group as a result of matching. The formula can be used to conclude that matching
reduced bias in the control group by a certain percentage:2-8
𝐵𝑅 = 100 (1 −𝐵1
𝐵0)
Subscript 1 denotes after matching, and subscript 0 denotes before matching.
2-6 Parsons, L.S. (2001). “Reducing Bias in Propensity Score Matched-Pair Sample Using Greedy Matching Techniques.”
Paper 214-26. Proceedings of the Twenty-Sixth Annual SAS Users Group International Conference. Cary (NC): SAS
Institute Inc. 2-7 Parsons, L.S. (2001). “Reducing Bias in Propensity Score Matched-Pair Sample Using Greedy Matching Techniques.”
Paper 214-26. Proceedings of the Twenty-Sixth Annual SAS Users Group International Conference. Cary (NC): SAS
Institute Inc. 2-8 Rosenbaum, P.R. and Rubin, D.B. (1985). Constructing a Control Group Using Multivariate Matched Sampling
Methods that Incorporate the Propensity Score. The American Statistician 39:33 – 38.

Health Services Advisory Group, Inc. - FINAL (F3) - Cost Savings Annual Report Ohio Department of Medicaid January 2015 Page 2-8 2-82-8
Where:
𝐵1 =100(�̅�1𝐶 − �̅�1𝑃)
√(𝑠1𝐶2 + 𝑠1𝑃
2 )2
≡ standardized bias after matching
𝐵0 =100(�̅�0𝐶 − �̅�0𝑃)
√(𝑠0𝐶2 + 𝑠0𝑃
2 )2
≡ standardized bias before matching
The standardized bias for binary data (e.g., gender, each disease covariate) is computed as:
𝐵 =100(𝑝𝐶 − 𝑝𝑃)
√𝑝𝑃(1 − 𝑝𝑃) + 𝑝𝐶(1 − 𝑝𝐶)2
�̅�𝐶 = mean of the control group
�̅�𝑃 = mean of the program (treatment) group
𝑠𝐶2 = variance of the control group
𝑠𝑃2 = variance of the program (treatment) group
𝑝𝐶 = proportion of the covariate in the control group.
𝑝𝑝 = proportion of the covariate in the program (treatment) group.
Balance for each covariate was evaluated by comparing the distributions between the control group
and treatment group using a two-sample t-test or two-proportion z-test. If the resulting p-value was
less than 0.05, then the covariate remained unbalanced.
For the statewide level of analysis, 87.0 percent of the covariates showed a reduction in bias after
matching, and 27.8 percent were balanced after matching. Detailed covariate results for each level
of analysis, including pre- and post-matching averages and frequencies along with bias reduction
and balance, can be found in Appendix B.
If a covariate remained unbalanced after the matching process, that covariate was included in the
difference-in-differences regression model as a control variable. Including the covariate in the
regression explicitly accounts for the differences between treatment and control groups, while
simultaneously controlling for the joint differences captured by the propensity score matching.

Health Services Advisory Group, Inc. - FINAL (F3) - Cost Savings Annual Report Ohio Department of Medicaid January 2015 Page 2-9 2-92-9
Population and Characteristics
Table 2-3 presents characteristics of the population and matched statewide sample.
Table 2-3—Descriptive Statistics of Matched Sample Groups
All Matched Members
Health Home Group
Comparison Group
Covariate Mean Standard Deviation Mean
Standard Deviation Mean
Standard Deviation
Age 31.304 19.537 29.714 19.084 32.894 19.854
Female 0.535 0.499 0.532 0.499 0.538 0.499
White 0.675 0.469 0.658 0.474 0.691 0.462
Black 0.306 0.461 0.324 0.468 0.288 0.453
County: Adams 0.037 0.189 0.037 0.188 0.037 0.190
County: Butler 0.096 0.295 0.073 0.260 0.120 0.325
County: Lawrence 0.078 0.269 0.070 0.255 0.087 0.281
County: Lucas 0.664 0.472 0.701 0.458 0.628 0.483
Medicaid Member Months 11.079 2.631 10.943 2.937 11.215 2.277
MCP Member Months 7.427 5.393 7.607 5.391 7.247 5.389
Dual Eligibility Member Months 0.399 1.931 0.346 1.783 0.453 2.066
Waiver Member Months 0.544 2.449 0.467 2.284 0.622 2.601
ABD Member Months 3.468 5.270 3.287 5.171 3.648 5.361
CFC Member Months 5.688 5.748 5.957 5.781 5.419 5.702
# Mental Health Center Visits 14.483 25.336 15.500 21.736 13.467 28.449
# ED Mental Health Visits 0.074 0.452 0.070 0.474 0.078 0.428
# IP Mental Health Visits 0.026 0.202 0.026 0.223 0.026 0.179
13 or More Mental Health Rx 0.212 0.409 0.204 0.403 0.221 0.415
ADHD 0.173 0.379 0.162 0.368 0.185 0.388
Acute bronchitis 0.082 0.275 0.078 0.268 0.087 0.282
Alcohol-related disorders 0.022 0.146 0.019 0.138 0.024 0.153
Anxiety Disorders 0.099 0.299 0.083 0.275 0.116 0.320
Asthma 0.124 0.329 0.116 0.321 0.131 0.337
Autism 0.008 0.091 0.007 0.085 0.010 0.098
Bipolar Disorder 0.113 0.317 0.107 0.309 0.119 0.324
Blindness and vision defects 0.273 0.446 0.253 0.435 0.293 0.455

Health Services Advisory Group, Inc. - FINAL (F3) - Cost Savings Annual Report Ohio Department of Medicaid January 2015 Page 2-10 2-102-10
Cancer 0.020 0.140 0.017 0.130 0.023 0.149
Cardiac dysrhythmias 0.054 0.226 0.048 0.214 0.059 0.236
Chronic obstructive pulmonary disease and bronchiectasis
0.118 0.323 0.107 0.309 0.130 0.336
Conduct Disorder 0.102 0.303 0.095 0.293 0.110 0.313
Congestive heart failure; nonhypertensive 0.018 0.134 0.016 0.125 0.021 0.143
Coronary atherosclerosis and other heart disease 0.036 0.187 0.033 0.178 0.040 0.195
Cystic fibrosis 0.000 0.013 0.000 0.011 0.000 0.015
Delirium, dementia, and amnestic and other cognitive diseases
0.011 0.104 0.009 0.097 0.012 0.111
Depression 0.313 0.464 0.277 0.447 0.350 0.477
Developmental disorders 0.082 0.274 0.078 0.269 0.085 0.279
Diabetes 0.124 0.330 0.111 0.314 0.138 0.345
Epilepsy; convulsions 0.042 0.201 0.037 0.189 0.047 0.212
Esophageal disorders 0.059 0.236 0.054 0.227 0.065 0.246
Essential hypertension 0.170 0.375 0.152 0.360 0.187 0.390
HIV infection 0.003 0.056 0.003 0.054 0.003 0.059
Intracranial injury 0.012 0.110 0.012 0.107 0.013 0.113
Mental Disorder Not Otherwise Specified (NOS) 0.024 0.152 0.022 0.148 0.025 0.156
Neoplasms of unspecified nature or uncertain behavior
0.083 0.276 0.074 0.262 0.092 0.289
Obsessive-Compulsive Disorders 0.007 0.082 0.006 0.077 0.008 0.087
Osteoarthritis 0.066 0.249 0.060 0.237 0.072 0.259
Other Developmental Disorder 0.028 0.166 0.027 0.163 0.030 0.170
Other nervous system disorders 0.133 0.339 0.117 0.322 0.148 0.355
PTSD 0.031 0.173 0.028 0.166 0.034 0.181
Pregnancy 0.027 0.163 0.025 0.156 0.030 0.170
Psychotic Disorder 0.171 0.377 0.166 0.372 0.176 0.381
Spondylosis; intervertebral disc disorders; other back
0.220 0.414 0.196 0.397 0.244 0.429
Substance-related disorders 0.054 0.225 0.047 0.212 0.060 0.238
Thyroid disorders 0.047 0.211 0.042 0.201 0.051 0.220

Health Services Advisory Group, Inc. - FINAL (F3) - Cost Savings Annual Report Ohio Department of Medicaid January 2015 Page 2-11 2-112-11
Difference-in-Differences Analysis and Cost Savings Calculation
Once the populations were matched, a difference-in-differences analysis was performed to
compare the PMPM costs for the two populations during the baseline period and the
remeasurement period. The difference-in-differences analysis allows for an expected cost for the
treatment group to be calculated by taking into account expected changes in costs without the
Health Home intervention. This is done by subtracting the average change in the control group
from the average change in the treatment group.2-9
This removes biases from the remeasurement
period comparisons due to permanent differences between the two groups. The generic difference-
in-differences model is:
𝑌𝑖𝑡 = 𝛽0 + 𝛽1𝑇𝑖𝑡 + 𝛽2𝑅𝑡 + 𝛿1(𝑅𝑡 ∗ 𝑇𝑖𝑡) + γ𝐃′
𝒊𝒕 + 𝑢𝑖𝑡
where Yit is the outcome of interest for individual i in time period t. Rt is a dummy variable for the
remeasurement time period. The dummy variable Tit identifies the treatment group with a 1 and the
control group with a 0. The vector D’ represents mean-centered observed covariates that remained
unbalanced after the propensity score matching process, and γ is a coefficient vector. The
coefficient, β1, identifies the average difference between the groups prior to the Health Home
intervention. The time period dummy, R, captures factors that would have changed in the absence
of the intervention. The coefficient of interest, 1, multiplies the interaction term, Rt * Tit, which is
the same as the dummy variable equal to one for those observations in the treatment group in the
remeasurement period. The final difference-in-differences estimate is:
�̂�1 = (�̅�𝑇,𝑅 − �̅�T,B) − (�̅�C,R − �̅�C,B) | 𝐃′
The estimate provides the expected cost without the intervention (i.e., expected adjustment factor)
while holding constant all observed covariates in D’. Adding these covariates allowed for a more
precise estimation of the true Health Home program effect by controlling for observed differences
between the comparison and treatment groups. Thus, the cost savings estimates provided in this
report are similar, but not equal to, a simple subtraction on the differences. The overall estimates
take into account the average monthly Health Home case rate program costs; however, the cost
savings estimates for individual categories of service do not account for average monthly Health
Home case rate costs, since average monthly Health Home case rate costs are made at the member
level and not the category of service level.
2-9 Imbens/Woodridge. Difference-in-Differences Estimation. Lecture Notes 10, Summer 2007. Available at:
http://www.nber.org/WNE/lect_10_diffindiffs.pdf. Accessed on: January 21, 2014.

Health Services Advisory Group, Inc. - FINAL (F3) - Cost Savings Annual Report Ohio Department of Medicaid January 2015 Page 2-12 2-122-12
Categories of Service
The difference-in-differences analysis was performed at the category-of-service level. The
following categories of service were evaluated:
Medical (i.e., Professional) – Mental Health
Medical (i.e., Professional) – Non-mental Health
ED
Inpatient
Outpatient
Pharmacy
Other
The ED category of service was identified as outlined in Table 2-4. For the remaining non-ED
claims, category of service was identified by the CDE_CLM_TYPE field in the vendor files, as
depicted in Table 2-5.
Table 2-4—Codes to Identify ED Visits
UB Revenue Codes AND
UB Type of Bill Codes
045x, 0981 013x
OR
CPT Codes AND
Place of Service Codes
10040 – 69979 23
OR
CPT Codes
99281 ‒ 99285

Health Services Advisory Group, Inc. - FINAL (F3) - Cost Savings Annual Report Ohio Department of Medicaid January 2015 Page 2-13 2-132-13
Table 2-5—Categories of Service Identification
Category of Service
CDE_CLM_TYPE Value Additional Codes
Medical – Non-Mental Health M (Professional Claim Type)
All codes occurring on this claim type counted as medical claims, with the exceptions of:
Claim lines containing the Health Home case management CPT code (S0281), which were evaluated separately.
Claims containing codes defined in Table 2-6.
Medical – Mental Health M (Professional Claim Type)
This category was limited to claims containing the codes in Table 2-6. Claim lines containing the Health Home case management CPT code (S0281) were excluded.
Inpatient I (Inpatient Claim Type)
Outpatient O (Outpatient Claim Type)
Pharmacy P and Q (Pharmacy and Compound Pharmacy Claim Types)
Other2-10
Not identified in any of the above CDE_CLM_TYPE, and also not identified as CDE_CLM_TYPE = “D”
Table 2-6 provides the codes to identify the outpatient mental health services.
Table 2-6—Codes to Identify Mental Health Services
Mental Health Service Local Codes
(Prior to June 30, 2012)
CPT Code (July 1, 2012 – December 31,
2012)
CPT Code (January 1,
2013 to Current)
Pharmacologic Management Z1831 90862 90863
Mental Health Assessment (non-physician) Z1832 H0031 H0031
Psychiatric Diagnostic Interview (physician) Z1839 90801 90792
Counseling & Therapy (Ind) Z1833 H0004 H0004
Counseling & Therapy (Grp) Z1834 H0004 H0004
Crisis Intervention Z1837 S9484 S9484
Partial Hospitalization Z1838 S0201 S0201
Community Psychiatric Support Tx (Ind) Z1840 H0036 H0036
Community Psychiatric Support Tx (Grp) Z1841 H0036 H0036
2-10 The other category includes crossover claims and long-term care claims. Dental claims were excluded from the analysis
due to incomplete dental claim data at the time of analysis.

Health Services Advisory Group, Inc. - FINAL (F3) - Cost Savings Annual Report Ohio Department of Medicaid January 2015 Page 2-14 2-142-14
Exclusions
HSAG evaluated medical costs associated with deliveries and women who had a delivery during
the baseline and remeasurement periods. HSAG, in conjunction with ODM, determined that these
members and/or costs did not need to be excluded from the analysis because there were no
substantial differences between the control/treatment groups or between the
treatment/remeasurement periods.
Costs associated with traumatic or related events (i.e., accidents) were removed from the analysis.
Traumatic or related events were identified as outlined in Table 2-7 below. In order to further
reduce undue influence from anomalous data, costs for individual claims were capped at $100,000.
Additionally, prior to construction of the final difference-in-differences regression model, the data
were reviewed for outliers. The data contained outliers exhibiting considerable deviation from the
average, particularly for the levels of analysis that had a relatively small number of eligible
members. For each matched sample, outliers were identified using the studentized residual of a
preliminary regression, and any observation having a studentized residual greater than five in
absolute value was removed from the final estimation.2-11
Table 2-7—Codes Used To Identify Traumatic or Related Events
ICD-9-CM Diagnosis Codes
800-854, 860-871, 874.0-874.59, 885-887, 895-897, 900-915, 918, 920-959, 990-996, E80-E84, E88-E92, E96-E98
2-11 HSAG can provide a complete listing of all outliers upon request.

Health Services Advisory Group, Inc. - FINAL (F3) - Cost Savings Annual Report Ohio Department of Medicaid January 2015 Page 3-1 3-13-1
3. RESULTS
Overview
This section presents the results of the overall cost savings analysis. An evaluation was performed
to compare PMPM costs during the baseline period (July 1, 2011 – June 30, 2012) and the
remeasurement period (January 1, 2013 – December 31, 2013).
The tables below show the statistical significance of results, indicating if the program demonstrated
significant cost savings. Significance thresholds are reported at the 95 percent confidence level.
Some results presented in the tables below may not be statistically significant (i.e., noted with
“N/S”). The lack of significance may be the result of large variance in comparison to the average
Cost Savings, a small sample size, or both.3-1
Statewide Cost Savings
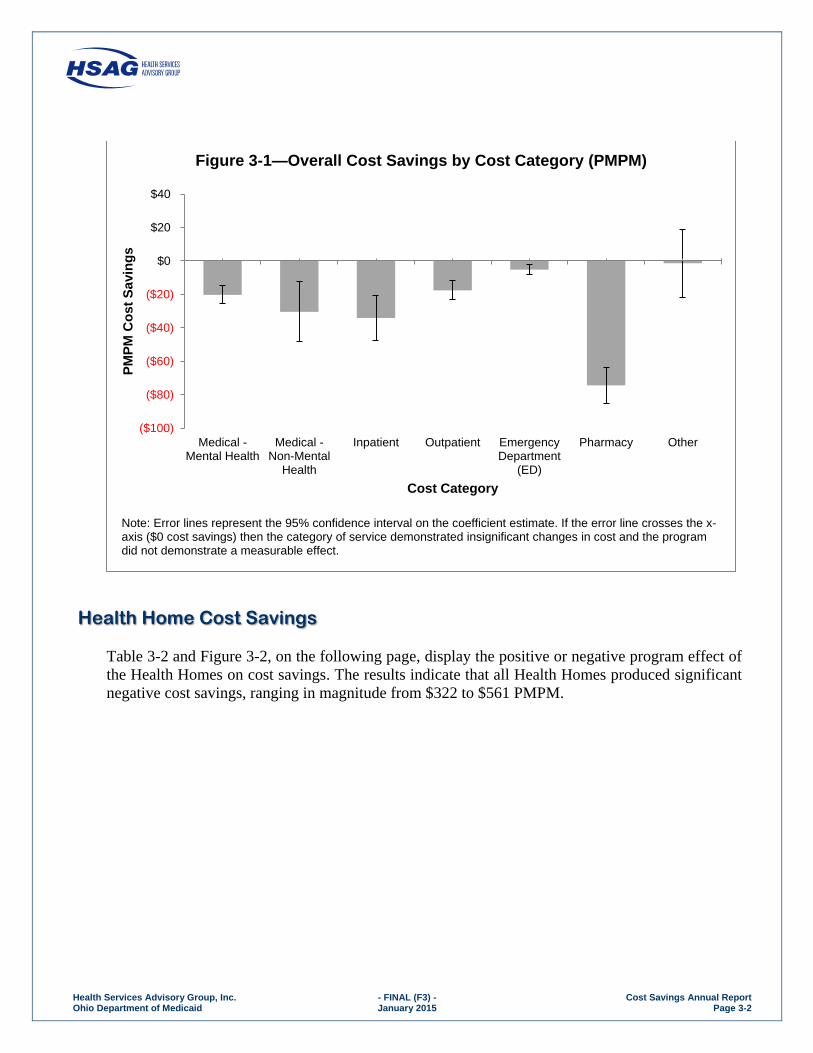
Table 3-1 and Figure 3-1 display the positive or negative program effect of each cost category.
Overall, the statewide negative cost savings were $516 PMPM.
Table 3-1—Overall Cost Savings by Cost Category (PMPM)
Cost Category Program Effect (Cost Savings)
Sample Treatment Group Size
Medical - Mental Health ($20) *
Medical - Non-Mental Health ($30) *
Inpatient ($34) *
Outpatient ($18) *
Emergency Department (ED) ($5) *
Pharmacy ($74) *
Average Health Home Monthly Case Rate ($333) *
Other ($1) N/S
Total ($516) * 8,335
A negative cost savings indicates an increase in cost. N/S indicates the results were not statistically significant. *Indicates statistical significance at the 95% confidence level or greater. Total cost savings may not equal the sum of all cost categories because each cost category and total cost savings are modeled independently.
3-1 The sample treatment group size is included in the tables as a reference.
Health Services Advisory Group, Inc. - FINAL (F3) - Cost Savings Annual Report Ohio Department of Medicaid January 2015 Page 3-2 3-23-2
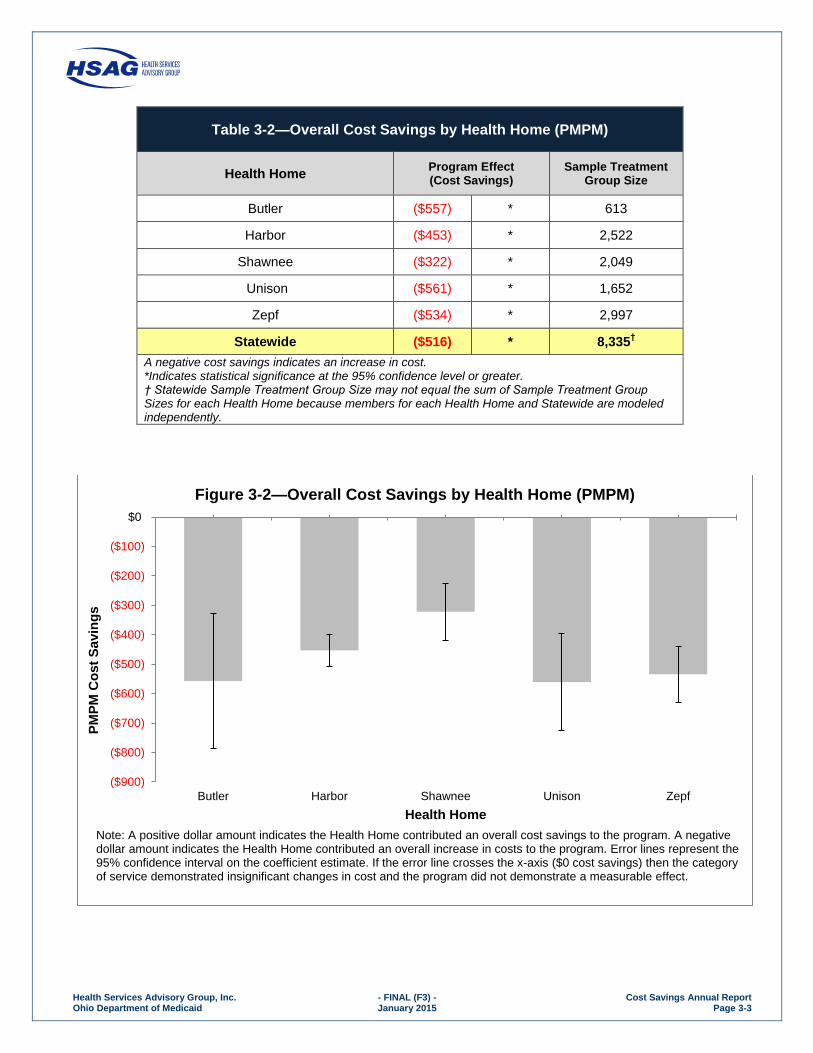
Health Home Cost Savings
Table 3-2 and Figure 3-2, on the following page, display the positive or negative program effect of
the Health Homes on cost savings. The results indicate that all Health Homes produced significant
negative cost savings, ranging in magnitude from $322 to $561 PMPM.
($100)
($80)
($60)
($40)
($20)
$0
$20
$40
Medical -Mental Health
Medical -Non-Mental
Health
Inpatient Outpatient EmergencyDepartment
(ED)
Pharmacy Other
PM
PM
Co
st
Sa
vin
gs
Cost Category
Figure 3-1—Overall Cost Savings by Cost Category (PMPM)
Note: Error lines represent the 95% confidence interval on the coefficient estimate. If the error line crosses the x-axis ($0 cost savings) then the category of service demonstrated insignificant changes in cost and the program did not demonstrate a measurable effect.
Health Services Advisory Group, Inc. - FINAL (F3) - Cost Savings Annual Report Ohio Department of Medicaid January 2015 Page 3-3 3-33-3
Table 3-2—Overall Cost Savings by Health Home (PMPM)
Health Home Program Effect (Cost Savings)
Sample Treatment Group Size
Butler ($557) * 613
Harbor ($453) * 2,522
Shawnee ($322) * 2,049
Unison ($561) * 1,652
Zepf ($534) * 2,997
Statewide ($516) * 8,335†
A negative cost savings indicates an increase in cost. *Indicates statistical significance at the 95% confidence level or greater. † Statewide Sample Treatment Group Size may not equal the sum of Sample Treatment Group Sizes for each Health Home because members for each Health Home and Statewide are modeled independently.
($900)
($800)
($700)
($600)
($500)
($400)
($300)
($200)
($100)
$0
Butler Harbor Shawnee Unison Zepf
PM
PM
Co
st
Sa
vin
gs
Health Home
Figure 3-2—Overall Cost Savings by Health Home (PMPM)
Note: A positive dollar amount indicates the Health Home contributed an overall cost savings to the program. A negative dollar amount indicates the Health Home contributed an overall increase in costs to the program. Error lines represent the 95% confidence interval on the coefficient estimate. If the error line crosses the x-axis ($0 cost savings) then the category of service demonstrated insignificant changes in cost and the program did not demonstrate a measurable effect.

Health Services Advisory Group, Inc. - FINAL (F3) - Cost Savings Annual Report Ohio Department of Medicaid January 2015 Page 3-4 3-43-4
Butler
Table 3-3 and Figure 3-3 present the cost savings for Butler. Overall, Butler produced a negative
cost savings of $557 PMPM.
Table 3-3—Butler Overall Cost Savings by Category of Service (PMPM)
Cost Category Program Effect (Cost Savings)
Sample Treatment Group Size
Medical - Mental Health ($6) N/S
Medical - Non-Mental Health ($40) N/S
Inpatient ($13) N/S
Outpatient ($16) N/S
Emergency Department (ED) ($10) N/S
Pharmacy ($48) N/S
Average Health Home Monthly Case Rate ($369) *
Other $5 N/S
Total ($557) * 613
A negative cost savings indicates an increase in cost. N/S indicates the results were not statistically significant. *Indicates statistical significance at the 95% confidence level or greater. Total cost savings may not equal the sum of all cost categories because each cost category and total cost savings are modeled independently.

Health Services Advisory Group, Inc. - FINAL (F3) - Cost Savings Annual Report Ohio Department of Medicaid January 2015 Page 3-5 3-53-5
($150)
($100)
($50)
$0
$50
$100
Medical -Mental Health
Medical - Non-Mental Health
Inpatient Outpatient EmergencyDepartment
(ED)
Pharmacy Other
PM
PM
Co
st
Sa
vin
gs
Cost Category
Figure 3-3—Butler Overall Cost Savings by Cost Category (PMPM)
Note: Error lines represent the 95% confidence interval on the coefficient estimate. If the error line crosses the x-axis ($0 cost savings) then the category of service demonstrated insignificant changes in cost and the program did not demonstrate a measurable effect.

Health Services Advisory Group, Inc. - FINAL (F3) - Cost Savings Annual Report Ohio Department of Medicaid January 2015 Page 3-6 3-63-6
Harbor
Table 3-4 and Figure 3-4 present the cost savings for Harbor. Overall, Harbor produced a negative
cost savings of $453 PMPM.
Table 3-4—Harbor Overall Cost Savings by Category of Service (PMPM)
Cost Category Program Effect (Cost Savings)
Sample Treatment Group Size
Medical - Mental Health ($38) *
Medical - Non-Mental Health ($16) *
Inpatient ($21) *
Outpatient ($4) N/S
Emergency Department (ED) ($4) *
Pharmacy ($54) *
Average Health Home Monthly Case Rate ($283) *
Other ($5) N/S
Total ($453) * 2,522
A negative cost savings indicates an increase in cost. N/S indicates the results were not statistically significant. *Indicates statistical significance at the 95% confidence level or greater. Total cost savings may not equal the sum of all cost categories because each cost category and total cost savings are modeled independently.

Health Services Advisory Group, Inc. - FINAL (F3) - Cost Savings Annual Report Ohio Department of Medicaid January 2015 Page 3-7 3-73-7
($80)
($70)
($60)
($50)
($40)
($30)
($20)
($10)
$0
$10
Medical -Mental Health
Medical - Non-Mental Health
Inpatient Outpatient EmergencyDepartment
(ED)
Pharmacy Other
PM
PM
Co
st
Sa
vin
gs
Cost Category
Figure 3-4—Harbor Overall Cost Savings by Cost Category (PMPM)
Note: Error lines represent the 95% confidence interval on the coefficient estimate. If the error line crosses the x-axis ($0 cost savings) then the category of service demonstrated insignificant changes in cost and the program did not demonstrate a measurable effect.

Health Services Advisory Group, Inc. - FINAL (F3) - Cost Savings Annual Report Ohio Department of Medicaid January 2015 Page 3-8 3-83-8
Shawnee
Table 3-5 and Figure 3-5 present the cost savings for Shawnee. Overall, Shawnee produced a
negative cost savings of $322 PMPM, but showed significant cost savings in the Medical—Mental
Health category of service.
Table 3-5—Shawnee Overall Cost Savings by Category of Service (PMPM)
Cost Category Program Effect (Cost Savings)
Sample Treatment Group Size
Medical - Mental Health $64 *
Medical - Non-Mental Health ($20) N/S
Inpatient ($19) N/S
Outpatient ($7) N/S
Emergency Department (ED) ($3) N/S
Pharmacy ($51) *
Average Health Home Monthly Case Rate ($326) *
Other $14 N/S
Total ($322) * 2,049
A negative cost savings indicates an increase in cost. N/S indicates the results were not statistically significant. *Indicates statistical significance at the 95% confidence level or greater. Total cost savings may not equal the sum of all cost categories because each cost category and total cost savings are modeled independently.

Health Services Advisory Group, Inc. - FINAL (F3) - Cost Savings Annual Report Ohio Department of Medicaid January 2015 Page 3-9 3-93-9
($100)
($80)
($60)
($40)
($20)
$0
$20
$40
$60
$80
$100
Medical -Mental Health
Medical - Non-Mental Health
Inpatient Outpatient EmergencyDepartment
(ED)
Pharmacy Other
PM
PM
Co
st
Sa
vin
gs
Cost Category
Figure 3-5—Shawnee Overall Cost Savings by Cost Category (PMPM)
Note: Error lines represent the 95% confidence interval on the coefficient estimate. If the error line crosses the x-axis ($0 cost savings) then the category of service demonstrated insignificant changes in cost and the program did not demonstrate a measurable effect.

Health Services Advisory Group, Inc. - FINAL (F3) - Cost Savings Annual Report Ohio Department of Medicaid January 2015 Page 3-10 3-103-10
Unison
Table 3-6 and Figure 3-6 present the cost savings for Unison. Overall, Unison produced a negative
cost savings of $561 PMPM.
Table 3-6—Unison Overall Cost Savings by Category of Service (PMPM)
Cost Category Program Effect (Cost Savings)
Sample Treatment Group Size
Medical - Mental Health ($12) N/S
Medical - Non-Mental Health ($47) N/S
Inpatient ($45) N/S
Outpatient ($18) *
Emergency Department (ED) ($9) N/S
Pharmacy ($140) *
Average Health Home Monthly Case Rate ($296) *
Other $16 N/S
Total ($561) * 1,652
A negative cost savings indicates an increase in cost. N/S indicates the results were not statistically significant. *Indicates statistical significance at the 95% confidence level or greater. Total cost savings may not equal the sum of all cost categories because each cost category and total cost savings are modeled independently.

Health Services Advisory Group, Inc. - FINAL (F3) - Cost Savings Annual Report Ohio Department of Medicaid January 2015 Page 3-11 3-113-11
($200)
($150)
($100)
($50)
$0
$50
$100
$150
Medical -Mental Health
Medical - Non-Mental Health
Inpatient Outpatient EmergencyDepartment
(ED)
Pharmacy Other
PM
PM
Co
st
Sa
vin
gs
Cost Category
Figure 3-6—Unison Overall Cost Savings by Cost Category (PMPM)
Note: Error lines represent the 95% confidence interval on the coefficient estimate. If the error line crosses the x-axis ($0 cost savings) then the category of service demonstrated insignificant changes in cost and the program did not demonstrate a measurable effect.

Health Services Advisory Group, Inc. - FINAL (F3) - Cost Savings Annual Report Ohio Department of Medicaid January 2015 Page 3-12 3-123-12
Zepf
Table 3-7 and Figure 3-7 present the cost savings for Zepf. Overall, Zepf produced a negative cost
savings of $534 PMPM, but showed significant cost savings in the Medical—Mental Health
category of service.
Table 3-7—Zepf Overall Cost Savings by Category of Service (PMPM)
Cost Category Program Effect (Cost Savings)
Sample Treatment Group Size
Medical - Mental Health $24 *
Medical - Non-Mental Health ($25) N/S
Inpatient ($55) *
Outpatient ($12) *
Emergency Department (ED) ($4) N/S
Pharmacy ($83) *
Average Health Home Monthly Case Rate ($397) *
Other $10 N/S
Total ($534) * 2,997
A negative cost savings indicates an increase in cost. N/S indicates the results were not statistically significant. *Indicates statistical significance at the 95% confidence level or greater. Total cost savings may not equal the sum of all cost categories because each cost category and total cost savings are modeled independently.

Health Services Advisory Group, Inc. - FINAL (F3) - Cost Savings Annual Report Ohio Department of Medicaid January 2015 Page 3-13 3-133-13
($120)
($100)
($80)
($60)
($40)
($20)
$0
$20
$40
$60
Medical -Mental Health
Medical - Non-Mental Health
Inpatient Outpatient EmergencyDepartment
(ED)
Pharmacy Other
PM
PM
Co
st
Sa
vin
gs
Cost Category
Figure 3-7—Zepf Overall Cost Savings by Cost Category (PMPM)
Notes : Error lines represent the 95% confidence interval on the coefficient estimate. If the error line crosses the x-axis ($0 cost savings) then the category of service demonstrated insignificant changes in cost and the program did not demonstrate a measurable effect.

Health Services Advisory Group, Inc. - FINAL (F3) - Cost Savings Annual Report Ohio Department of Medicaid January 2015 Page 3-14 3-143-14
Additional Levels of Analysis
A total of 42 levels of analysis were included in the cost savings analysis. The full results from
additional levels of analysis can be found in Appendix A. However, none of these levels of
analysis showed a cost savings; all showed significant overall negative cost savings.
Robustness Checks
In addition to the analysis described above, HSAG conducted a variety of checks to verify that the
results were robust to alternative methods and specifications. HSAG utilized two different sets of
Health Home enrollment criteria to identify treatment group members (requiring 6 months of
continuous enrollment according to Health Home enrollment spans, and the enrollment
requirements outlined in the Methodology section). Results of this analysis are consistent with
those provided in this report. Additionally, HSAG investigated an alternative methodology for
accounting for the costs and member months associated with a “gap month” in enrollment. In the
alternative methodology, neither the costs nor the member months associated with a gap month
were counted toward the PMPM averages. The results under this assumption are consistent with
the findings provided in this report.
In order to rule out the possibility of biased results due to idiosyncrasies in the county-specific
comparison groups, HSAG expanded the eligible control group to Medicaid members residing in
all counties. The negative cost savings from this analysis remained statistically significant.
Average costs for the treatment and control group matched samples were different at baseline. In
order to determine if unmatched differences in costs at baseline contributed to the result, HSAG
analyzed separate propensity score models in which member costs at baseline were added to the
logistic regression model. The purpose of this was to match control group members to treatment
group members not only on the demographic and disease covariates listed previously in Table 2-1
and Table 2-2, but also to match members by costs at baseline. The results did not materially
change when Medicaid costs at baseline were added as covariates to the propensity score model.
As a final check of robustness, tests for outliers were performed. HSAG removed from the final
cost savings calculation members with an absolute studentized residual greater than five. HSAG
tested cost savings results under a variety of methods to identify outliers, which all resulted in a
similar conclusion. Specifically, HSAG tested a number of thresholds for studentized residuals,
ranging from 2 to 50, and using standard thresholds for Cook’s D statistic and leverage (H) to
identify outliers. Under all scenarios, results of these analyses are consistent with those provided in
this report.

Health Services Advisory Group, Inc. - FINAL (F3) - Cost Savings Annual Report Ohio Department of Medicaid January 2015 Page 4-1 4-14-1
4. SUMMARY OF FINDINGS
Key Findings
This analysis resulted in several key findings. First, all five evaluated Health Homes produced
statistically significant negative cost savings, with an overall statewide negative cost savings of
$516 PMPM. The average monthly Health Home case rate was $333 PMPM; thus, the Health
Homes overall produced a negative cost savings greater than the average monthly Health Home
case rate.
The negative cost savings produced by the individual Health Homes range from $322 to $561
PMPM. Forty-two different stratifications were evaluated (e.g., by age, managed care plan, Health
Home) and none of these subgroups showed an overall cost savings. However, two Health Homes
(Zepf and Shawnee) showed a significant cost savings in one category of service (Medical –
Mental Health). The primary driver of the cost increases, ignoring average monthly Health Home
case rates, is found in pharmacy costs. Members in all five Health Homes had significantly higher
pharmaceutical costs than the comparison group, ranging from $48 PMPM for Butler to $140
PMPM for Unison.
The overall findings described above are corroborated by the additional stratifications. The failure
to find consistent statistically significant cost savings among the other stratifications reinforces the
primary conclusions described above. Despite the prevalence of significant negative cost savings
overall and across the majority of cost categories, some stratifications demonstrated significant
cost savings in the Medical – Mental Health category. However, these cost savings were more than
offset through the average monthly Health Home case rate and significant negative cost savings
among the other categories of service.
Limitations and Cautions
The findings presented in the Cost Savings Annual Report are subject to some limitations in study
design, analysis, and interpretation. These limitations should be considered carefully when
interpreting or generalizing the findings presented. These limitations are discussed below.
Research Scope
This analysis of the Health Home program does not account for any improvement in utilization
rates, outcomes, or quality of life. As mentioned in the Executive Summary on page 1-2, an
analysis of utilization rates was conducted as part of the comprehensive Health Home evaluation.
Additionally, results of this analysis do not forecast future trends in Medicaid costs for Health
Home members.

Health Services Advisory Group, Inc. - FINAL (F3) - Cost Savings Annual Report Ohio Department of Medicaid January 2015 Page 4-2 4-24-2
Sample Size
While the sample size was sufficient to study the statewide population, caution should be exercised
when interpreting results for some of the most specific levels of analysis. In general, results
generated for levels of analysis with fewer than roughly 500 members in either the control or
treatment group should be viewed with caution.
Health Home Enrollment
The Health Home enrollment data contain both Health Home enrollment spans (i.e., start and end
dates of Health Home enrollment) and information on the payment of the average monthly Health
Home case rate for each member every month. These two sources of enrollment information are
poorly aligned; there are many member months for which the Health Home enrollment spans
indicate that a member is enrolled for a given month, but there is no Health Home services
payment for that member during the month. Given that the Health Home services payment
indicates that a Health Home performed services and received payment for the month, enrollment
criteria were based on the average monthly Health Home case rates. However, it is possible that
Health Homes members’ received some Health Home services/benefits during months in which the
member was enrolled according to the spans data, but did not have a Health Home service
payment. That is, the nature of the mismatch in enrollment data is unclear. As a robustness check
on the results, HSAG performed the cost savings analysis using different Health Home enrollment
criteria for the treatment group, including calculating the six months of enrollment using the Health
Home enrollment spans as opposed to the average monthly Health Home case rates. This change to
the enrollment criteria did not materially change the results.
Comparison Group
In a randomized study with a large sample size, the comparison group is virtually identical to the
treatment group and an analysis of such a study will provide unbiased estimates of outcomes for
both groups. Because this analysis is an observational study in which the treatment group is
selected based on medical care needs and population characteristics, there are inherent differences
between the treatment group and potential comparison group. A valid comparison group must be
constructed in order to account for these differences. Propensity score matching is a technique used
to build a comparison group that has characteristics similar to the treatment group. One caveat of
this approach is that the eligible comparison group (i.e., pre-matching group) must include
members with characteristics similar to the treatment group. If the members of the eligible
comparison group are fundamentally different from the treatment group, propensity score matching
cannot be used to build an appropriate comparison group. For example, if all of the Medicaid
members with SPMI in the five Health Home counties were enrolled in a Health Home, leaving no
unenrolled members in those counties, propensity score matching would not produce a usable
comparison group. HSAG took several steps to investigate the appropriateness of the eligible
comparison group. First, HSAG reviewed the covariate balance after the matching process for an
improvement in the balance of key covariates, particularly those related to mental health disorders.
In addition, HSAG ran the analysis without the Health Home county requirement, thus expanding
the eligible comparison group population to the entire state. The results were similar to the results
obtained by limiting the comparison group to Health Home counties.

Health Services Advisory Group, Inc. - FINAL (F3) - Cost Savings Annual Report Ohio Department of Medicaid January 2015 Page 4-3 4-34-3
Time Frame
The baseline and remeasurement periods for this analysis were both one year. Any Health Homes
effects on cost savings that require longer than one year to materialize are not captured in this
study. Additionally, the remeasurement period ends fifteen months after the start of the Health
Home program. It is possible that measurable cost savings will not be realized in that time frame.
As an observational study, this analysis does not predict future cost savings; therefore, continued
analysis involving later time frames will be required to address this concern.
Cost Data
This study is concerned exclusively with Medicaid cost savings. Costs incurred by other entities,
such as the state mental hospital and Medicare, are not represented in this study. Thus, the results
of this study should not be used to infer overall cost savings, which may differ from the Medicaid
cost savings.

Health Services Advisory Group, Inc. - FINAL (F3) - Cost Savings Annual Report Ohio Department of Medicaid January 2015 Page A-1 11
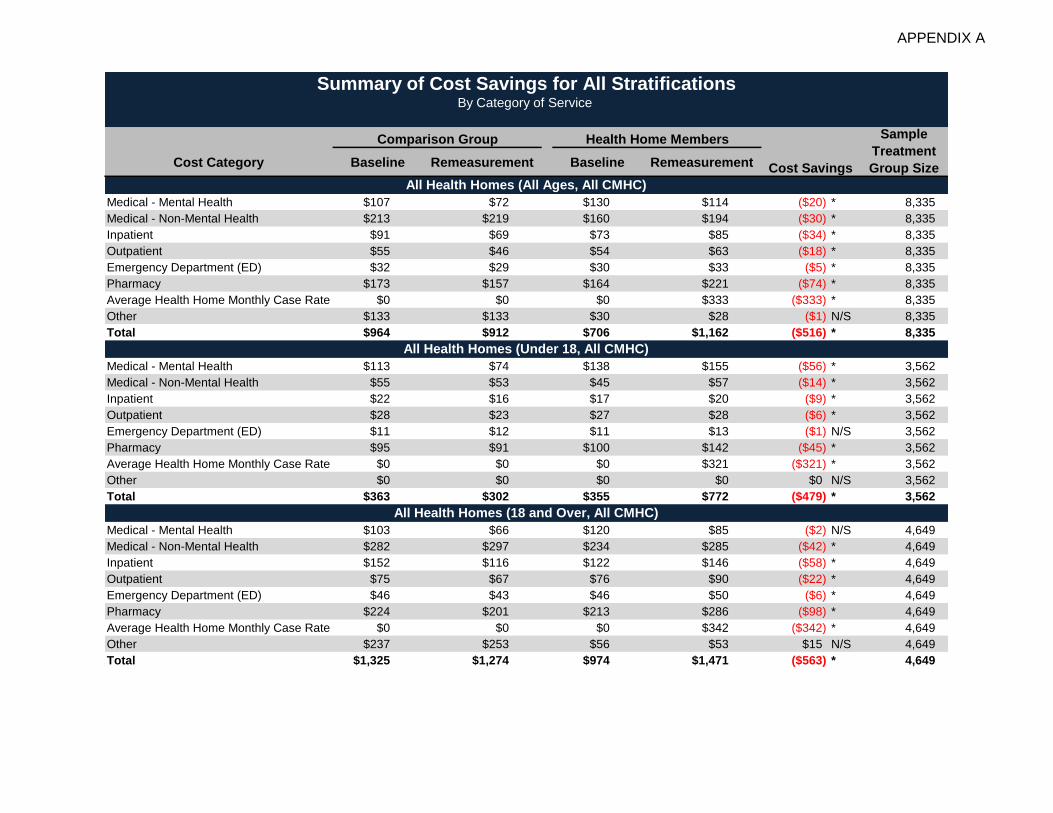
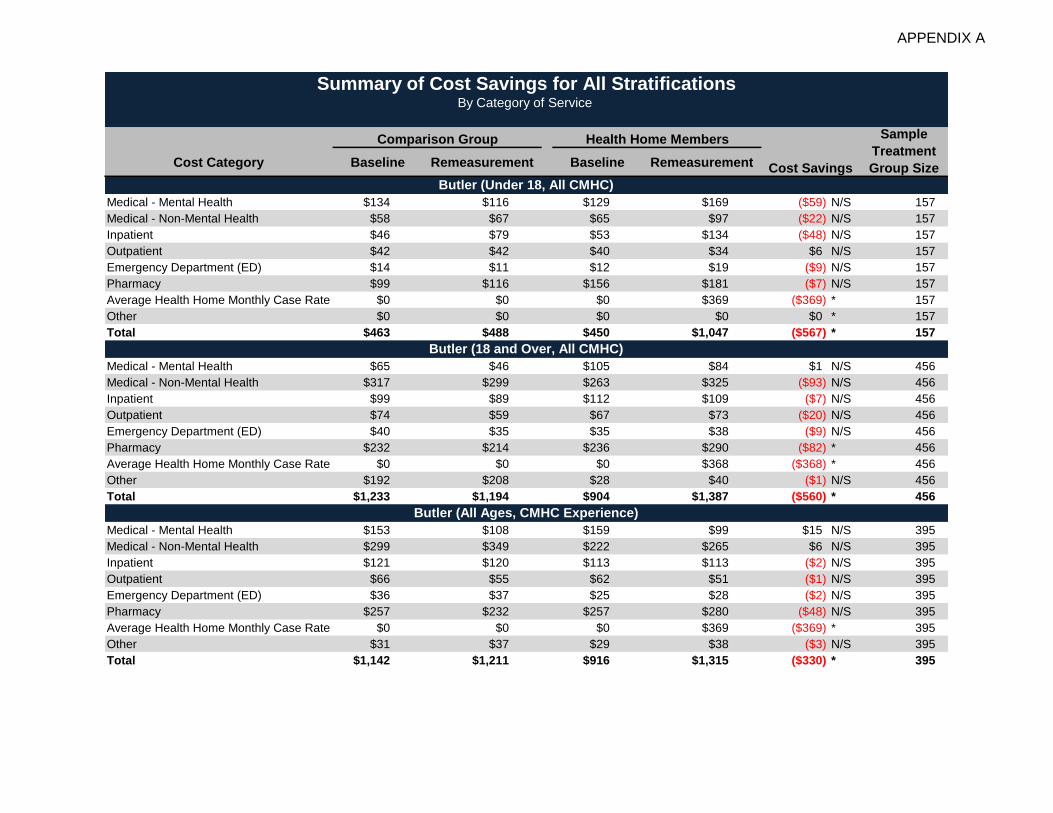
APPENDIX A. RESULTS FOR EACH LEVEL OF ANALYSIS
This section provides the detailed cost savings results for each level of analysis. Results were
stratified by the following levels of analysis for each category of service:
Statewide Overall
o Age Group.
o CMHC Experience.
Five Health Homes
o Age Group within each Health Home.
o CMHC Experience within each Health Home.
Health Home Design
o Access to pharmacist on-site.
County
o Lucas County.
o Age Group within Lucas County.
o CMHC Experience within Lucas County.
Five MCPs
The tables in this section show cost savings for the baseline comparison group, remeasurement
comparison group, baseline Health Home treatment group, and remeasurement Health Home
treatment group.
Please note, readers are cautioned that naïve comparisons of the baseline and remeasurement costs
for treatment and comparison group members will differ from the model estimated impact. This
difference happens because the naïve comparison is based on the observed data, which includes
random fluctuations in costs due to uncontrolled trends in costs across patient mixes. In contrast,
the model estimated impacts are based on the expected difference in costs, after controlling for
mean-centered observed covariates that remained unbalanced after the propensity score matching
process.
APPENDIX A
Cost Category Baseline Remeasurement Baseline Remeasurement
Medical - Mental Health $107 $72 $130 $114 ($20) * 8,335
Medical - Non-Mental Health $213 $219 $160 $194 ($30) * 8,335
Inpatient $91 $69 $73 $85 ($34) * 8,335
Outpatient $55 $46 $54 $63 ($18) * 8,335
Emergency Department (ED) $32 $29 $30 $33 ($5) * 8,335
Pharmacy $173 $157 $164 $221 ($74) * 8,335
Average Health Home Monthly Case Rate $0 $0 $0 $333 ($333) * 8,335
Other $133 $133 $30 $28 ($1) N/S 8,335
Total $964 $912 $706 $1,162 ($516) * 8,335
Medical - Mental Health $113 $74 $138 $155 ($56) * 3,562
Medical - Non-Mental Health $55 $53 $45 $57 ($14) * 3,562
Inpatient $22 $16 $17 $20 ($9) * 3,562
Outpatient $28 $23 $27 $28 ($6) * 3,562
Emergency Department (ED) $11 $12 $11 $13 ($1) N/S 3,562
Pharmacy $95 $91 $100 $142 ($45) * 3,562
Average Health Home Monthly Case Rate $0 $0 $0 $321 ($321) * 3,562
Other $0 $0 $0 $0 $0 N/S 3,562
Total $363 $302 $355 $772 ($479) * 3,562
Medical - Mental Health $103 $66 $120 $85 ($2) N/S 4,649
Medical - Non-Mental Health $282 $297 $234 $285 ($42) * 4,649
Inpatient $152 $116 $122 $146 ($58) * 4,649
Outpatient $75 $67 $76 $90 ($22) * 4,649
Emergency Department (ED) $46 $43 $46 $50 ($6) * 4,649
Pharmacy $224 $201 $213 $286 ($98) * 4,649
Average Health Home Monthly Case Rate $0 $0 $0 $342 ($342) * 4,649
Other $237 $253 $56 $53 $15 N/S 4,649
Total $1,325 $1,274 $974 $1,471 ($563) * 4,649
Comparison Group
Summary of Cost Savings for All StratificationsBy Category of Service
Sample
Treatment
Group Size
All Health Homes (Under 18, All CMHC)
Cost Savings
All Health Homes (All Ages, All CMHC)
All Health Homes (18 and Over, All CMHC)
Health Home Members

APPENDIX A
Cost Category Baseline Remeasurement Baseline Remeasurement
Comparison Group
Summary of Cost Savings for All StratificationsBy Category of Service
Sample
Treatment
Group SizeCost Savings
Health Home Members
Medical - Mental Health $142 $93 $155 $110 ($4) N/S 5,212
Medical - Non-Mental Health $178 $176 $162 $193 ($32) * 5,212
Inpatient $83 $63 $64 $65 ($21) * 5,212
Outpatient $51 $42 $49 $48 ($8) * 5,212
Emergency Department (ED) $34 $30 $29 $29 ($4) N/S 5,212
Pharmacy $169 $142 $160 $212 ($79) * 5,212
Average Health Home Monthly Case Rate $0 $0 $0 $331 ($331) * 5,212
Other $27 $28 $24 $24 $1 N/S 5,212
Total $883 $799 $719 $1,112 ($477) * 5,212
Medical - Mental Health $0 $6 $0 $125 ($118) * 2,141
Medical - Non-Mental Health $120 $127 $96 $148 ($45) * 2,141
Inpatient $59 $51 $57 $103 ($48) * 2,141
Outpatient $56 $42 $50 $79 ($41) * 2,141
Emergency Department (ED) $26 $22 $29 $38 ($13) * 2,141
Pharmacy $88 $79 $81 $186 ($111) * 2,141
Average Health Home Monthly Case Rate $0 $0 $0 $334 ($333) * 2,141
Other $54 $56 $19 $16 $2 N/S 2,141
Total $454 $470 $361 $1,083 ($697) * 2,141
Medical - Mental Health $66 $53 $108 $98 ($6) N/S 613
Medical - Non-Mental Health $196 $210 $186 $235 ($40) N/S 613
Inpatient $131 $135 $110 $127 ($13) N/S 613
Outpatient $68 $54 $60 $63 ($16) N/S 613
Emergency Department (ED) $33 $30 $29 $35 ($10) N/S 613
Pharmacy $188 $185 $208 $246 ($48) N/S 613
Average Health Home Monthly Case Rate $0 $0 $0 $369 ($369) * 613
Other $116 $133 $21 $30 $5 N/S 613
Total $1,078 $1,067 $783 $1,300 ($557) * 613
All Health Homes (All Ages, CMHC Experience)
All Health Homes (All Ages, No CMHC Experience)
Butler (All Ages, All CMHC)
APPENDIX A
Cost Category Baseline Remeasurement Baseline Remeasurement
Comparison Group
Summary of Cost Savings for All StratificationsBy Category of Service
Sample
Treatment
Group SizeCost Savings
Health Home Members
Medical - Mental Health $134 $116 $129 $169 ($59) N/S 157
Medical - Non-Mental Health $58 $67 $65 $97 ($22) N/S 157
Inpatient $46 $79 $53 $134 ($48) N/S 157
Outpatient $42 $42 $40 $34 $6 N/S 157
Emergency Department (ED) $14 $11 $12 $19 ($9) N/S 157
Pharmacy $99 $116 $156 $181 ($7) N/S 157
Average Health Home Monthly Case Rate $0 $0 $0 $369 ($369) * 157
Other $0 $0 $0 $0 $0 * 157
Total $463 $488 $450 $1,047 ($567) * 157
Medical - Mental Health $65 $46 $105 $84 $1 N/S 456
Medical - Non-Mental Health $317 $299 $263 $325 ($93) N/S 456
Inpatient $99 $89 $112 $109 ($7) N/S 456
Outpatient $74 $59 $67 $73 ($20) N/S 456
Emergency Department (ED) $40 $35 $35 $38 ($9) N/S 456
Pharmacy $232 $214 $236 $290 ($82) * 456
Average Health Home Monthly Case Rate $0 $0 $0 $368 ($368) * 456
Other $192 $208 $28 $40 ($1) N/S 456
Total $1,233 $1,194 $904 $1,387 ($560) * 456
Medical - Mental Health $153 $108 $159 $99 $15 N/S 395
Medical - Non-Mental Health $299 $349 $222 $265 $6 N/S 395
Inpatient $121 $120 $113 $113 ($2) N/S 395
Outpatient $66 $55 $62 $51 ($1) N/S 395
Emergency Department (ED) $36 $37 $25 $28 ($2) N/S 395
Pharmacy $257 $232 $257 $280 ($48) N/S 395
Average Health Home Monthly Case Rate $0 $0 $0 $369 ($369) * 395
Other $31 $37 $29 $38 ($3) N/S 395
Total $1,142 $1,211 $916 $1,315 ($330) * 395
Butler (Under 18, All CMHC)
Butler (18 and Over, All CMHC)
Butler (All Ages, CMHC Experience)

APPENDIX A
Cost Category Baseline Remeasurement Baseline Remeasurement
Comparison Group
Summary of Cost Savings for All StratificationsBy Category of Service
Sample
Treatment
Group SizeCost Savings
Health Home Members
Medical - Mental Health $0 $6 $1 $99 ($91) * 218
Medical - Non-Mental Health $108 $105 $103 $205 ($107) * 218
Inpatient $87 $79 $82 $133 ($64) N/S 218
Outpatient $75 $52 $56 $85 ($50) * 218
Emergency Department (ED) $27 $24 $35 $42 ($11) N/S 218
Pharmacy $116 $137 $126 $219 ($84) N/S 218
Average Health Home Monthly Case Rate $0 $0 $0 $369 ($369) * 218
Other $142 $157 $3 $16 ($11) N/S 218
Total $611 $621 $447 $1,228 ($799) * 218
Medical - Mental Health $125 $91 $173 $175 ($38) * 2,522
Medical - Non-Mental Health $110 $115 $75 $96 ($16) * 2,522
Inpatient $61 $42 $38 $40 ($21) * 2,522
Outpatient $42 $36 $42 $40 ($4) N/S 2,522
Emergency Department (ED) $21 $19 $19 $22 ($4) * 2,522
Pharmacy $143 $138 $128 $176 ($54) * 2,522
Average Health Home Monthly Case Rate $0 $0 $0 $284 ($283) * 2,522
Other $15 $11 $3 $5 ($5) N/S 2,522
Total $613 $550 $505 $890 ($453) * 2,522
Medical - Mental Health $127 $88 $160 $189 ($69) * 2,015
Medical - Non-Mental Health $63 $59 $45 $56 ($14) * 2,015
Inpatient $26 $19 $17 $19 ($9) N/S 2,015
Outpatient $35 $28 $31 $29 ($5) N/S 2,015
Emergency Department (ED) $12 $11 $11 $11 ($1) N/S 2,015
Pharmacy $109 $106 $99 $143 ($47) * 2,015
Average Health Home Monthly Case Rate $0 $0 $0 $283 ($283) * 2,015
Other $0 $0 $0 $0 ($0) N/S 2,015
Total $408 $349 $377 $760 ($443) * 2,015
Harbor (All Ages, All CMHC)
Harbor (Under 18, All CMHC)
Butler (All Ages, No CMHC Experience)

APPENDIX A
Cost Category Baseline Remeasurement Baseline Remeasurement
Comparison Group
Summary of Cost Savings for All StratificationsBy Category of Service
Sample
Treatment
Group SizeCost Savings
Health Home Members
Medical - Mental Health $156 $89 $207 $117 $20 N/S 500
Medical - Non-Mental Health $302 $325 $209 $287 ($62) N/S 500
Inpatient $171 $93 $138 $173 ($108) * 500
Outpatient $70 $62 $89 $99 ($18) N/S 500
Emergency Department (ED) $50 $49 $59 $69 ($12) N/S 500
Pharmacy $240 $195 $244 $319 ($124) * 500
Average Health Home Monthly Case Rate $0 $0 $0 $284 ($284) * 500
Other $147 $111 $30 $46 ($53) N/S 500
Total $1,500 $1,325 $1,087 $1,544 ($650) * 500
Medical - Mental Health $198 $136 $215 $182 ($29) * 1,849
Medical - Non-Mental Health $88 $95 $78 $97 ($12) N/S 1,849
Inpatient $47 $40 $44 $43 ($7) N/S 1,849
Outpatient $38 $31 $44 $40 ($3) N/S 1,849
Emergency Department (ED) $20 $19 $19 $21 ($3) N/S 1,849
Pharmacy $158 $146 $153 $199 ($58) * 1,849
Average Health Home Monthly Case Rate $0 $0 $0 $283 ($283) * 1,849
Other $7 $7 $4 $5 ($1) N/S 1,849
Total $619 $547 $599 $917 ($389) * 1,849
Medical - Mental Health $0 $5 $0 $150 ($145) * 649
Medical - Non-Mental Health $66 $61 $43 $82 ($41) * 649
Inpatient $43 $18 $15 $35 ($44) * 649
Outpatient $38 $27 $27 $42 ($25) * 649
Emergency Department (ED) $20 $21 $19 $24 ($3) N/S 649
Pharmacy $52 $52 $40 $110 ($70) * 649
Average Health Home Monthly Case Rate $0 $0 $0 $285 ($285) * 649
Other $3 $4 $2 $4 ($0) N/S 649
Total $277 $237 $171 $790 ($654) * 649
Harbor (18 and Over, All CMHC)
Harbor (All Ages, CMHC Experience)
Harbor (All Ages, No CMHC Experience)

APPENDIX A
Cost Category Baseline Remeasurement Baseline Remeasurement
Comparison Group
Summary of Cost Savings for All StratificationsBy Category of Service
Sample
Treatment
Group SizeCost Savings
Health Home Members
Medical - Mental Health $95 $69 $127 $34 $64 * 2,049
Medical - Non-Mental Health $246 $263 $216 $248 ($20) N/S 2,049
Inpatient $86 $60 $66 $59 ($19) N/S 2,049
Outpatient $60 $54 $68 $69 ($7) N/S 2,049
Emergency Department (ED) $31 $28 $28 $29 ($3) N/S 2,049
Pharmacy $244 $228 $262 $293 ($51) * 2,049
Average Health Home Monthly Case Rate $0 $0 $0 $326 ($326) * 2,049
Other $38 $48 $23 $18 $14 N/S 2,049
Total $994 $984 $837 $1,137 ($322) * 2,049
Medical - Mental Health $89 $61 $138 $43 $66 * 631
Medical - Non-Mental Health $65 $70 $58 $64 ($1) N/S 631
Inpatient $15 $9 $15 $14 ($4) N/S 631
Outpatient $27 $25 $32 $27 $3 N/S 631
Emergency Department (ED) $10 $10 $12 $13 ($1) N/S 631
Pharmacy $109 $98 $125 $153 ($41) * 631
Average Health Home Monthly Case Rate $0 $0 $0 $329 ($329) * 631
Other $0 $0 $0 $0 $0 * 631
Total $356 $320 $394 $680 ($323) * 631
Medical - Mental Health $102 $77 $119 $30 $64 * 1,415
Medical - Non-Mental Health $326 $330 $290 $333 ($47) N/S 1,415
Inpatient $114 $93 $95 $84 ($10) N/S 1,415
Outpatient $69 $61 $83 $86 ($11) N/S 1,415
Emergency Department (ED) $38 $38 $37 $36 ($0) N/S 1,415
Pharmacy $301 $273 $328 $358 ($66) * 1,415
Average Health Home Monthly Case Rate $0 $0 $0 $325 ($325) * 1,415
Other $86 $86 $33 $26 $5 N/S 1,415
Total $1,287 $1,228 $1,059 $1,371 ($393) * 1,415
Shawnee (All Ages, All CMHC)
Shawnee (Under 18, All CMHC)
Shawnee (18 and Over, All CMHC)

APPENDIX A
Cost Category Baseline Remeasurement Baseline Remeasurement
Comparison Group
Summary of Cost Savings for All StratificationsBy Category of Service
Sample
Treatment
Group SizeCost Savings
Health Home Members
Medical - Mental Health $144 $109 $150 $33 $83 * 1,516
Medical - Non-Mental Health $229 $230 $217 $247 ($28) N/S 1,516
Inpatient $70 $57 $55 $46 ($4) N/S 1,516
Outpatient $59 $51 $66 $67 ($10) N/S 1,516
Emergency Department (ED) $33 $31 $29 $28 ($1) N/S 1,516
Pharmacy $244 $218 $260 $275 ($40) * 1,516
Average Health Home Monthly Case Rate $0 $0 $0 $326 ($326) * 1,516
Other $28 $27 $26 $19 $6 N/S 1,516
Total $1,019 $977 $877 $1,125 ($290) * 1,516
Medical - Mental Health $1 $3 $1 $43 ($40) * 403
Medical - Non-Mental Health $163 $208 $178 $223 ($9) N/S 403
Inpatient $88 $86 $70 $100 ($32) N/S 403
Outpatient $69 $47 $65 $77 ($35) * 403
Emergency Department (ED) $31 $26 $29 $33 ($9) N/S 403
Pharmacy $131 $131 $140 $230 ($97) * 403
Average Health Home Monthly Case Rate $0 $0 $0 $327 ($327) * 403
Other $18 $15 $10 $13 ($8) N/S 403
Total $689 $626 $488 $1,069 ($669) * 403
Medical - Mental Health $130 $95 $197 $174 ($12) N/S 1,652
Medical - Non-Mental Health $221 $229 $206 $257 ($47) N/S 1,652
Inpatient $144 $103 $185 $191 ($45) N/S 1,652
Outpatient $63 $54 $66 $74 ($18) * 1,652
Emergency Department (ED) $43 $37 $51 $53 ($9) N/S 1,652
Pharmacy $242 $217 $214 $325 ($140) * 1,652
Average Health Home Monthly Case Rate $0 $0 $0 $296 ($296) * 1,652
Other $280 $307 $69 $77 $16 N/S 1,652
Total $1,319 $1,273 $1,110 $1,611 ($561) * 1,652
Unison (All Ages, All CMHC)
Shawnee (All Ages, CMHC Experience)
Shawnee (All Ages, No CMHC Experience)

APPENDIX A
Cost Category Baseline Remeasurement Baseline Remeasurement
Comparison Group
Summary of Cost Savings for All StratificationsBy Category of Service
Sample
Treatment
Group SizeCost Savings
Health Home Members
Medical - Mental Health $173 $126 $140 $257 ($164) * 235
Medical - Non-Mental Health $47 $45 $35 $43 ($10) N/S 235
Inpatient $20 $5 $11 $7 ($10) N/S 235
Outpatient $18 $19 $17 $12 $6 N/S 235
Emergency Department (ED) $10 $8 $11 $13 ($3) N/S 235
Pharmacy $97 $88 $85 $140 ($64) * 235
Average Health Home Monthly Case Rate $0 $0 $0 $290 ($290) * 235
Other $0 $0 $0 $0 $0 * 235
Total $418 $314 $318 $810 ($595) * 235
Medical - Mental Health $140 $106 $194 $150 $9 N/S 1,395
Medical - Non-Mental Health $236 $231 $222 $280 ($68) * 1,395
Inpatient $186 $131 $210 $219 ($62) * 1,395
Outpatient $67 $57 $74 $83 ($19) * 1,395
Emergency Department (ED) $49 $44 $59 $61 ($7) N/S 1,395
Pharmacy $271 $230 $234 $356 ($169) * 1,395
Average Health Home Monthly Case Rate $0 $0 $0 $297 ($297) * 1,395
Other $305 $360 $82 $90 $43 N/S 1,395
Total $1,446 $1,384 $1,216 $1,713 ($582) * 1,395
Medical - Mental Health $185 $138 $211 $163 $1 N/S 1,293
Medical - Non-Mental Health $211 $235 $219 $258 ($15) N/S 1,293
Inpatient $171 $105 $164 $174 ($76) * 1,293
Outpatient $63 $47 $63 $67 ($20) * 1,293
Emergency Department (ED) $41 $37 $52 $52 ($4) N/S 1,293
Pharmacy $245 $221 $218 $317 ($123) * 1,293
Average Health Home Monthly Case Rate $0 $0 $0 $296 ($296) * 1,293
Other $77 $80 $48 $57 ($6) N/S 1,293
Total $1,262 $1,149 $1,131 $1,565 ($547) * 1,293
Unison (Under 18, All CMHC)
Unison (18 and Over, All CMHC)
Unison (All Ages, CMHC Experience)
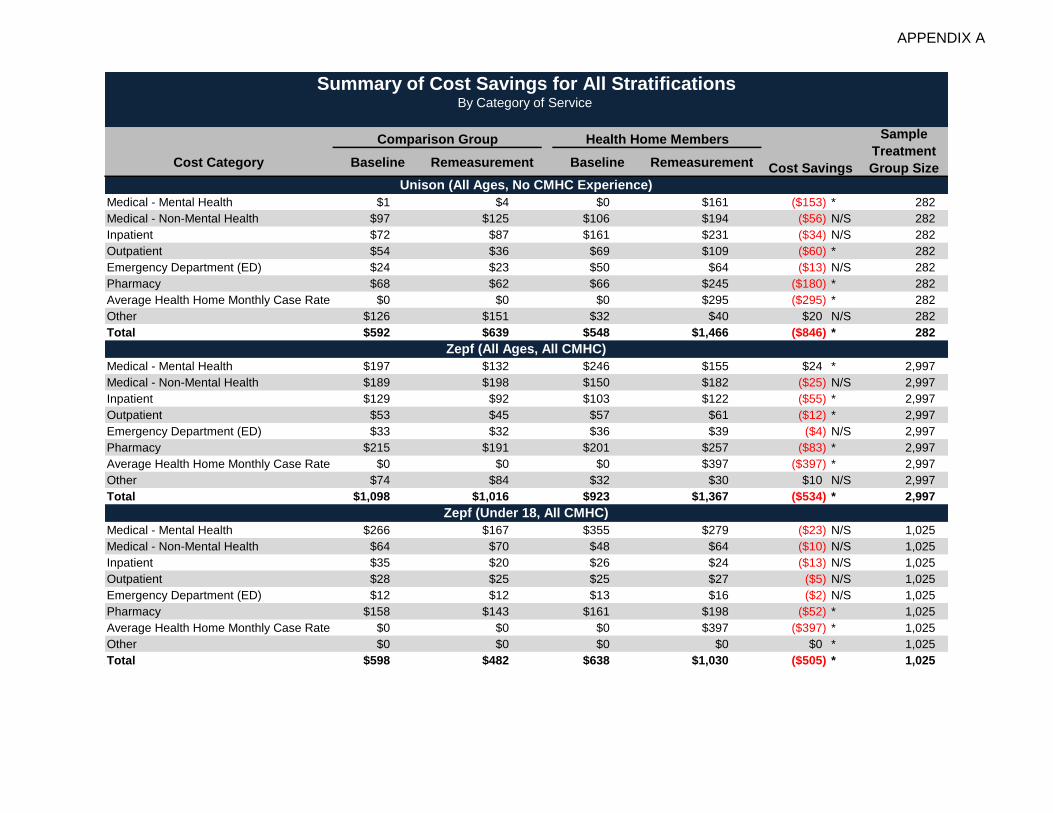
APPENDIX A
Cost Category Baseline Remeasurement Baseline Remeasurement
Comparison Group
Summary of Cost Savings for All StratificationsBy Category of Service
Sample
Treatment
Group SizeCost Savings
Health Home Members
Medical - Mental Health $1 $4 $0 $161 ($153) * 282
Medical - Non-Mental Health $97 $125 $106 $194 ($56) N/S 282
Inpatient $72 $87 $161 $231 ($34) N/S 282
Outpatient $54 $36 $69 $109 ($60) * 282
Emergency Department (ED) $24 $23 $50 $64 ($13) N/S 282
Pharmacy $68 $62 $66 $245 ($180) * 282
Average Health Home Monthly Case Rate $0 $0 $0 $295 ($295) * 282
Other $126 $151 $32 $40 $20 N/S 282
Total $592 $639 $548 $1,466 ($846) * 282
Medical - Mental Health $197 $132 $246 $155 $24 * 2,997
Medical - Non-Mental Health $189 $198 $150 $182 ($25) N/S 2,997
Inpatient $129 $92 $103 $122 ($55) * 2,997
Outpatient $53 $45 $57 $61 ($12) * 2,997
Emergency Department (ED) $33 $32 $36 $39 ($4) N/S 2,997
Pharmacy $215 $191 $201 $257 ($83) * 2,997
Average Health Home Monthly Case Rate $0 $0 $0 $397 ($397) * 2,997
Other $74 $84 $32 $30 $10 N/S 2,997
Total $1,098 $1,016 $923 $1,367 ($534) * 2,997
Medical - Mental Health $266 $167 $355 $279 ($23) N/S 1,025
Medical - Non-Mental Health $64 $70 $48 $64 ($10) N/S 1,025
Inpatient $35 $20 $26 $24 ($13) N/S 1,025
Outpatient $28 $25 $25 $27 ($5) N/S 1,025
Emergency Department (ED) $12 $12 $13 $16 ($2) N/S 1,025
Pharmacy $158 $143 $161 $198 ($52) * 1,025
Average Health Home Monthly Case Rate $0 $0 $0 $397 ($397) * 1,025
Other $0 $0 $0 $0 $0 * 1,025
Total $598 $482 $638 $1,030 ($505) * 1,025
Unison (All Ages, No CMHC Experience)
Zepf (All Ages, All CMHC)
Zepf (Under 18, All CMHC)
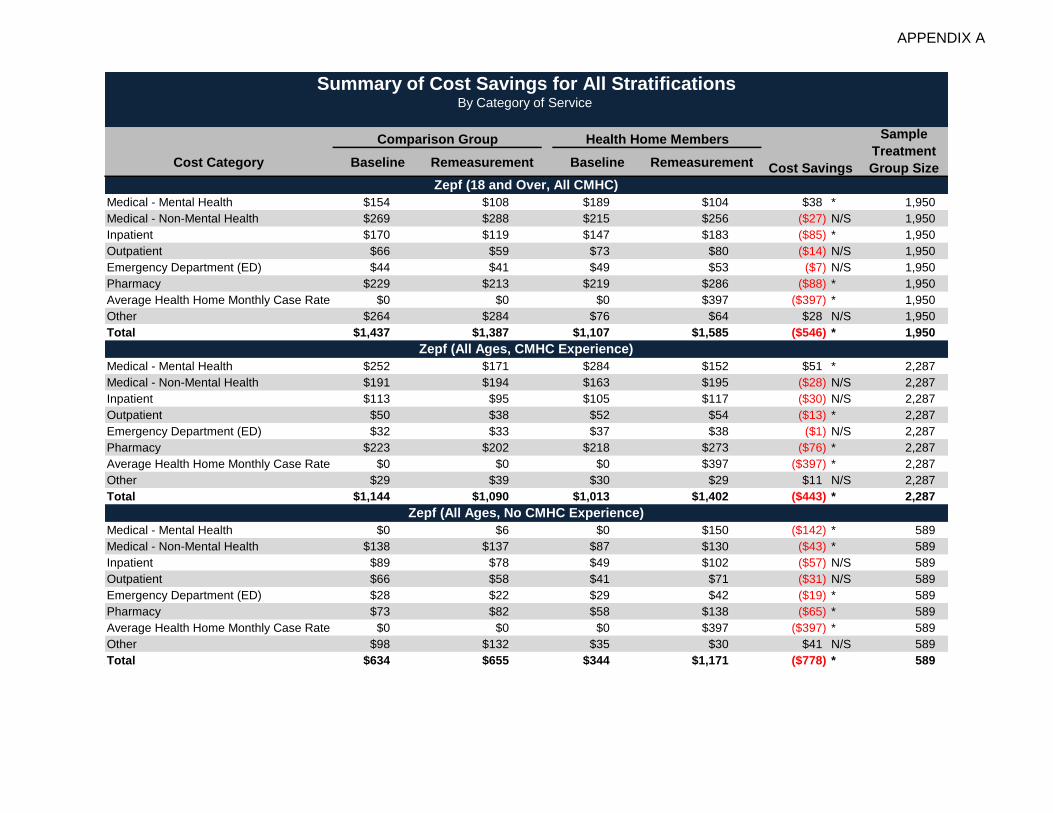
APPENDIX A
Cost Category Baseline Remeasurement Baseline Remeasurement
Comparison Group
Summary of Cost Savings for All StratificationsBy Category of Service
Sample
Treatment
Group SizeCost Savings
Health Home Members
Medical - Mental Health $154 $108 $189 $104 $38 * 1,950
Medical - Non-Mental Health $269 $288 $215 $256 ($27) N/S 1,950
Inpatient $170 $119 $147 $183 ($85) * 1,950
Outpatient $66 $59 $73 $80 ($14) N/S 1,950
Emergency Department (ED) $44 $41 $49 $53 ($7) N/S 1,950
Pharmacy $229 $213 $219 $286 ($88) * 1,950
Average Health Home Monthly Case Rate $0 $0 $0 $397 ($397) * 1,950
Other $264 $284 $76 $64 $28 N/S 1,950
Total $1,437 $1,387 $1,107 $1,585 ($546) * 1,950
Medical - Mental Health $252 $171 $284 $152 $51 * 2,287
Medical - Non-Mental Health $191 $194 $163 $195 ($28) N/S 2,287
Inpatient $113 $95 $105 $117 ($30) N/S 2,287
Outpatient $50 $38 $52 $54 ($13) * 2,287
Emergency Department (ED) $32 $33 $37 $38 ($1) N/S 2,287
Pharmacy $223 $202 $218 $273 ($76) * 2,287
Average Health Home Monthly Case Rate $0 $0 $0 $397 ($397) * 2,287
Other $29 $39 $30 $29 $11 N/S 2,287
Total $1,144 $1,090 $1,013 $1,402 ($443) * 2,287
Medical - Mental Health $0 $6 $0 $150 ($142) * 589
Medical - Non-Mental Health $138 $137 $87 $130 ($43) * 589
Inpatient $89 $78 $49 $102 ($57) N/S 589
Outpatient $66 $58 $41 $71 ($31) N/S 589
Emergency Department (ED) $28 $22 $29 $42 ($19) * 589
Pharmacy $73 $82 $58 $138 ($65) * 589
Average Health Home Monthly Case Rate $0 $0 $0 $397 ($397) * 589
Other $98 $132 $35 $30 $41 N/S 589
Total $634 $655 $344 $1,171 ($778) * 589
Zepf (18 and Over, All CMHC)
Zepf (All Ages, CMHC Experience)
Zepf (All Ages, No CMHC Experience)

APPENDIX A
Cost Category Baseline Remeasurement Baseline Remeasurement
Comparison Group
Summary of Cost Savings for All StratificationsBy Category of Service
Sample
Treatment
Group SizeCost Savings
Health Home Members
Medical - Mental Health $133 $84 $157 $159 ($53) * 3,113
Medical - Non-Mental Health $143 $143 $98 $127 ($29) * 3,113
Inpatient $82 $60 $51 $55 ($26) * 3,113
Outpatient $53 $44 $48 $52 ($13) * 3,113
Emergency Department (ED) $27 $26 $21 $24 ($4) N/S 3,113
Pharmacy $156 $142 $144 $191 ($62) * 3,113
Average Health Home Monthly Case Rate $0 $0 $0 $300 ($300) * 3,113
Other $54 $54 $7 $12 ($6) N/S 3,113
Total $772 $682 $567 $987 ($514) * 3,113
Medical - Mental Health $126 $83 $158 $108 $5 N/S 5,967
Medical - Non-Mental Health $246 $253 $200 $237 ($34) * 5,967
Inpatient $126 $89 $98 $114 ($51) * 5,967
Outpatient $62 $51 $60 $71 ($20) * 5,967
Emergency Department (ED) $36 $33 $37 $40 ($6) * 5,967
Pharmacy $204 $182 $201 $265 ($89) * 5,967
Average Health Home Monthly Case Rate $0 $0 $0 $349 ($349) * 5,967
Other $181 $193 $43 $39 $11 N/S 5,967
Total $1,170 $1,101 $864 $1,313 ($530) * 5,967
Medical - Mental Health $73 $33 $99 $132 ($73) * 4,933
Medical - Non-Mental Health $169 $171 $136 $170 ($33) * 4,933
Inpatient $91 $63 $65 $83 ($42) * 4,933
Outpatient $54 $43 $49 $59 ($21) * 4,933
Emergency Department (ED) $33 $30 $32 $36 ($7) * 4,933
Pharmacy $118 $100 $117 $191 ($92) * 4,933
Average Health Home Monthly Case Rate $0 $0 $0 $328 ($328) * 4,933
Other $153 $168 $31 $27 $15 N/S 4,933
Total $833 $758 $576 $1,106 ($609) * 4,933
Pharmacist on Site (All Ages, All CMHC)
No Pharmacist on Site (All Ages, All CMHC)
Lucas County (All Ages, All CMHC)

APPENDIX A
Cost Category Baseline Remeasurement Baseline Remeasurement
Comparison Group
Summary of Cost Savings for All StratificationsBy Category of Service
Sample
Treatment
Group SizeCost Savings
Health Home Members
Medical - Mental Health $73 $39 $102 $167 ($100) * 2,464
Medical - Non-Mental Health $47 $47 $39 $52 ($14) * 2,464
Inpatient $14 $10 $13 $16 ($8) * 2,464
Outpatient $24 $17 $24 $26 ($9) * 2,464
Emergency Department (ED) $11 $11 $11 $12 ($1) N/S 2,464
Pharmacy $68 $62 $81 $124 ($49) * 2,464
Average Health Home Monthly Case Rate $0 $0 $0 $314 ($314) * 2,464
Other $0 $0 $0 $0 $0 N/S 2,464
Total $268 $206 $290 $756 ($529) * 2,464
Medical - Mental Health $77 $31 $95 $104 ($54) * 2,345
Medical - Non-Mental Health $220 $215 $212 $273 ($73) * 2,345
Inpatient $169 $115 $119 $166 ($97) * 2,345
Outpatient $69 $64 $70 $89 ($25) * 2,345
Emergency Department (ED) $47 $43 $51 $60 ($13) * 2,345
Pharmacy $159 $129 $153 $260 ($140) * 2,345
Average Health Home Monthly Case Rate $0 $0 $0 $343 ($343) * 2,345
Other $318 $353 $63 $62 $27 N/S 2,345
Total $1,347 $1,214 $859 $1,503 ($797) * 2,345
Medical - Mental Health $124 $56 $137 $127 ($58) * 3,134
Medical - Non-Mental Health $135 $131 $125 $158 ($38) * 3,134
Inpatient $91 $63 $64 $76 ($40) * 3,134
Outpatient $50 $37 $42 $46 ($17) * 3,134
Emergency Department (ED) $33 $28 $32 $33 ($5) N/S 3,134
Pharmacy $117 $93 $121 $186 ($89) * 3,134
Average Health Home Monthly Case Rate $0 $0 $0 $326 ($326) * 3,134
Other $26 $29 $21 $22 $2 N/S 3,134
Total $741 $606 $633 $1,092 ($594) * 3,134
Lucas County (All Ages, CMHC Experience)
Lucas County (Under 18, All CMHC)
Lucas County (18 and Over, All CMHC)

APPENDIX A
Cost Category Baseline Remeasurement Baseline Remeasurement
Comparison Group
Summary of Cost Savings for All StratificationsBy Category of Service
Sample
Treatment
Group SizeCost Savings
Health Home Members
Medical - Mental Health $0 $4 $0 $151 ($146) * 1,518
Medical - Non-Mental Health $75 $80 $71 $123 ($43) * 1,518
Inpatient $97 $55 $56 $122 ($97) * 1,518
Outpatient $52 $49 $43 $71 ($29) * 1,518
Emergency Department (ED) $31 $26 $29 $39 ($15) * 1,518
Pharmacy $59 $52 $52 $152 ($102) * 1,518
Average Health Home Monthly Case Rate $0 $0 $0 $330 ($330) * 1,518
Other $27 $27 $5 $14 ($5) N/S 1,518
Total $423 $378 $303 $1,085 ($796) * 1,518
Medical - Mental Health $82 $45 $108 $146 ($75) * 942
Medical - Non-Mental Health $60 $69 $52 $74 ($11) N/S 942
Inpatient $39 $61 $33 $71 ($14) N/S 942
Outpatient $27 $28 $30 $33 ($2) N/S 942
Emergency Department (ED) $18 $21 $19 $20 $3 N/S 942
Pharmacy $73 $76 $79 $137 ($54) * 942
Average Health Home Monthly Case Rate $0 $0 $0 $327 ($327) * 942
Other $0 $0 $0 $0 ($0) N/S 942
Total $329 $324 $337 $846 ($505) * 942
Medical - Mental Health $95 $81 $119 $77 $27 * 1,537
Medical - Non-Mental Health $142 $154 $131 $157 ($14) N/S 1,537
Inpatient $144 $131 $110 $128 ($30) N/S 1,537
Outpatient $92 $90 $85 $104 ($20) N/S 1,537
Emergency Department (ED) $37 $35 $35 $37 ($3) N/S 1,537
Pharmacy $268 $271 $280 $346 ($62) * 1,537
Average Health Home Monthly Case Rate $0 $0 $0 $340 ($340) * 1,537
Other $1 $0 $1 $0 ($0) N/S 1,537
Total $870 $830 $791 $1,223 ($469) * 1,537
Lucas County (All Ages, No CMHC Experience)
MCP: Buckeye (All Ages, All CMHC)
MCP: CareSource (All Ages, All CMHC)

APPENDIX A
Cost Category Baseline Remeasurement Baseline Remeasurement
Comparison Group
Summary of Cost Savings for All StratificationsBy Category of Service
Sample
Treatment
Group SizeCost Savings
Health Home Members
Medical - Mental Health $120 $109 $133 $58 $64 * 580
Medical - Non-Mental Health $133 $141 $132 $137 $4 N/S 580
Inpatient $81 $82 $77 $77 $1 N/S 580
Outpatient $79 $62 $74 $74 ($15) N/S 580
Emergency Department (ED) $37 $38 $27 $31 ($3) N/S 580
Pharmacy $273 $281 $307 $356 ($39) N/S 580
Average Health Home Monthly Case Rate $0 $0 $0 $335 ($335) * 580
Other $0 $1 $1 $2 $1 N/S 580
Total $825 $798 $816 $1,123 ($327) * 580
Medical - Mental Health $64 $32 $94 $147 ($88) * 1,930
Medical - Non-Mental Health $74 $66 $54 $71 ($24) * 1,930
Inpatient $35 $25 $26 $33 ($16) * 1,930
Outpatient $52 $45 $43 $49 ($11) * 1,930
Emergency Department (ED) $31 $36 $27 $36 ($3) N/S 1,930
Pharmacy $88 $84 $100 $157 ($62) * 1,930
Average Health Home Monthly Case Rate $0 $0 $0 $319 ($319) * 1,930
Other $0 $0 $0 $0 $0 * 1,930
Total $375 $314 $367 $854 ($552) * 1,930
Medical - Mental Health $70 $42 $98 $94 ($23) N/S 347
Medical - Non-Mental Health $145 $173 $133 $192 ($32) N/S 347
Inpatient $217 $207 $215 $252 ($46) N/S 347
Outpatient $89 $103 $83 $114 ($17) N/S 347
Emergency Department (ED) $73 $83 $54 $84 ($20) N/S 347
Pharmacy $183 $207 $214 $340 ($102) * 347
Average Health Home Monthly Case Rate $0 $0 $0 $337 ($337) * 347
Other $2 $3 $2 $0 $3 N/S 347
Total $882 $891 $845 $1,467 ($612) * 347
MCP: Paramount (All Ages, All CMHC)
MCP: UnitedHealthcare (All Ages, All CMHC)
MCP: Molina (All Ages, All CMHC)
Note: Total Cost Savings may not equal the sum of all Cost Categories because each Cost Category and Total Cost Savings are modeled independently.

Health Services Advisory Group, Inc. - FINAL (F3) - Cost Savings Annual Report Ohio Department of Medicaid January 2015 Page B-1 11
APPENDIX B. COVARIATE BALANCE ASSESSMENT
This section includes an assessment of covariate balance for each model. A total of 42 models with
various stratifications were evaluated. The covariates were evaluated to ensure the populations
were appropriately matched. For each covariate, the mean of the control and treatment groups for
the full group population and matched population is provided. An asterisk denotes that the
particular covariate was balanced. In other words, a p-value of greater than 0.05 indicates there
were no significant differences between the treatment and control group after matching.
A bias reduction of greater than 0 and less than 200 percent indicates an improved covariate
balance, but does not necessarily identify whether a covariate was statistically balanced. A bias
reduction of 100 percent indicates a perfectly balanced covariate.

APPENDIX B
Covariate
Age 27.695 30.407 32.894 29.714 222% N/A
Female 0.576 0.530 0.538 0.532 87% *
White 0.727 0.644 0.691 0.658 60%
Black 0.239 0.338 0.288 0.324 64%
County: Adams 0.042 0.034 0.037 0.037 93% *
County: Butler 0.300 0.062 0.120 0.073 76%
County: Lawrence 0.074 0.064 0.087 0.070 -63%
County: Lucas 0.471 0.730 0.628 0.701 72%
Medicaid Member Months 9.475 11.085 11.215 10.943 124%
MCP Member Months 7.156 7.662 7.247 7.607 29%
Dual Eligibility Member Months 0.282 0.344 0.453 0.346 256%
Waiver Member Months 0.363 0.469 0.622 0.467 228%
ABD Member Months 1.005 3.816 3.648 3.287 111%
CFC Member Months 7.018 5.618 5.419 5.957 138%
Excluded
from PSM2
Balanced3
Control Treatment Control Treatment
Bias
Reduction1
Full Group Matched Samples
All Health Homes (All Ages, All CMHC)
Summary of Covariate Averages Before and After Propensity Score Matching

APPENDIX B
Covariate
Excluded
from PSM2
Balanced3
Control Treatment Control Treatment
Bias
Reduction1
Full Group Matched Samples
All Health Homes (All Ages, All CMHC)
Summary of Covariate Averages Before and After Propensity Score Matching
# Mental Health Center Visits 1.069 21.324 13.467 15.500 92%
# ED Mental Health Visits 0.012 0.079 0.078 0.070 109% *
# IP Mental Health Visits 0.003 0.033 0.026 0.026 100% *
13 or More Mental Health Rx 0.031 0.253 0.221 0.204 106%
ADHD 0.032 0.180 0.185 0.162 112%
Acute bronchitis 0.056 0.079 0.087 0.078 136%
Alcohol-related disorders 0.006 0.022 0.024 0.019 124%
Anxiety Disorders 0.028 0.083 0.116 0.083 146%
Asthma 0.060 0.125 0.131 0.116 120%
Autism 0.003 0.007 0.010 0.007 138% *
Bipolar Disorder 0.014 0.129 0.119 0.107 109%
Blindness and vision defects 0.150 0.265 0.293 0.253 131%
Cancer 0.014 0.017 0.023 0.017 233%
Cardiac dysrhythmias 0.027 0.055 0.059 0.048 135%

APPENDIX B
Covariate
Excluded
from PSM2
Balanced3
Control Treatment Control Treatment
Bias
Reduction1
Full Group Matched Samples
All Health Homes (All Ages, All CMHC)
Summary of Covariate Averages Before and After Propensity Score Matching
Chronic obstructive pulmonary disease and
bronchiectasis0.059 0.114 0.130 0.107 136%
Conduct Disorder 0.011 0.108 0.110 0.095 112%
Congestive heart failure; nonhypertensive 0.014 0.017 0.021 0.016 245%
Coronary atherosclerosis and other heart
disease0.023 0.034 0.040 0.033 155%
Cystic fibrosis 0.000 0.000 0.000 0.000 48% YES *
Delirium, dementia, and amnestic and other
cognitive diseases0.010 0.010 0.012 0.009 5470% *
Depression 0.047 0.304 0.350 0.277 122%
Developmental disorders 0.037 0.083 0.085 0.078 113% *
Diabetes 0.061 0.119 0.138 0.111 139%
Epilepsy; convulsions 0.019 0.040 0.047 0.037 142%
Esophageal disorders 0.027 0.059 0.065 0.054 127%
Essential hypertension 0.083 0.166 0.187 0.152 136%
HIV infection 0.002 0.003 0.003 0.003 142% *
Intracranial injury 0.006 0.013 0.013 0.012 117% *

APPENDIX B
Covariate
Excluded
from PSM2
Balanced3
Control Treatment Control Treatment
Bias
Reduction1
Full Group Matched Samples
All Health Homes (All Ages, All CMHC)
Summary of Covariate Averages Before and After Propensity Score Matching
Mental Disorder Not Otherwise Specified
(NOS)0.005 0.025 0.025 0.022 110% *
Neoplasms of unspecified nature or uncertain
behavior0.035 0.078 0.092 0.074 134%
Obsessive-Compulsive Disorders 0.001 0.006 0.008 0.006 124% *
Osteoarthritis 0.031 0.066 0.072 0.060 131%
Other Developmental Disorder 0.003 0.031 0.030 0.027 107% *
Other nervous system disorders 0.062 0.126 0.148 0.117 141%
PTSD 0.005 0.031 0.034 0.028 116%
Pregnancy 0.040 0.023 0.030 0.025 70% *
Psychotic Disorder 0.015 0.212 0.176 0.166 104% *
Spondylosis; intervertebral disc disorders;
other back0.100 0.208 0.244 0.196 138%
Substance-related disorders 0.019 0.050 0.060 0.047 135%
Thyroid disorders 0.021 0.045 0.051 0.042 132%
3 An asterisk (*) indicates that the averages for the matched control group and treatment group are statistically equivalent.
Notes: 1
Bias Reduction represents the reduction in the standardized bias coefficient as a result of the matching process. A figure greater than 0% and less than 200%
represents reduced bias.
2 Indicates if the covariate was excluded in the Propensity Score Model logistic regression.

APPENDIX B
Covariate
Age 9.427 11.367 11.721 11.218 128%
Female 0.498 0.390 0.376 0.400 122%
White 0.710 0.599 0.646 0.616 74%
Black 0.256 0.381 0.331 0.364 75%
County: Adams 0.042 0.015 0.021 0.017 82% *
County: Butler 0.341 0.038 0.083 0.044 80%
County: Lawrence 0.071 0.049 0.074 0.054 12%
County: Lucas 0.450 0.806 0.723 0.786 82%
Medicaid Member Months 10.659 11.394 11.168 11.320 76%
MCP Member Months 9.662 9.049 8.764 9.275 180%
Dual Eligibility Member Months 0.003 0.008 0.011 0.008 142% *
Waiver Member Months 0.029 0.005 0.011 0.006 68% *
ABD Member Months 0.332 1.582 1.429 1.319 107% *
CFC Member Months 10.318 9.805 9.729 9.994 150%
Control Treatment Control Treatment Balanced3
All Health Homes (Under 18, All CMHC)
Summary of Covariate Averages Before and After Propensity Score Matching
Full Group Matched SamplesBias
Reduction1
Excluded
from PSM2

APPENDIX B
Covariate Control Treatment Control Treatment Balanced3
All Health Homes (Under 18, All CMHC)
Summary of Covariate Averages Before and After Propensity Score Matching
Full Group Matched SamplesBias
Reduction1
Excluded
from PSM2
# Mental Health Center Visits 1.105 21.856 13.857 15.365 94%
# ED Mental Health Visits 0.004 0.029 0.032 0.025 120% *
# IP Mental Health Visits 0.002 0.030 0.024 0.023 103% *
13 or More Mental Health Rx 0.008 0.086 0.063 0.066 97% *
ADHD 0.060 0.404 0.410 0.351 114%
Acute bronchitis 0.056 0.045 0.056 0.047 24% *
Alcohol-related disorders 0.001 0.005 0.006 0.004 126% *
Anxiety Disorders 0.008 0.044 0.058 0.040 136%
Asthma 0.075 0.135 0.144 0.126 127%
Autism 0.003 0.015 0.017 0.013 128% *
Bipolar Disorder 0.003 0.028 0.025 0.023 108% *
Blindness and vision defects 0.156 0.286 0.292 0.275 112% *
Cancer 0.001 0.001 0.004 0.001 -296% YES
Cardiac dysrhythmias 0.005 0.017 0.019 0.013 141%

APPENDIX B
Covariate Control Treatment Control Treatment Balanced3
All Health Homes (Under 18, All CMHC)
Summary of Covariate Averages Before and After Propensity Score Matching
Full Group Matched SamplesBias
Reduction1
Excluded
from PSM2
Chronic obstructive pulmonary disease and
bronchiectasis0.024 0.024 0.029 0.024 -2598% *
Conduct Disorder 0.021 0.243 0.232 0.202 110%
Congestive heart failure; nonhypertensive 0.000 0.000 0.001 0.000 -133% YES *
Coronary atherosclerosis and other heart
disease0.000 0.000 0.000 0.000 100% YES *
Cystic fibrosis 0.001 0.000 0.001 0.000 -111% YES *
Delirium, dementia, and amnestic and other
cognitive diseases0.001 0.004 0.004 0.003 123% *
Depression 0.016 0.143 0.138 0.121 111%
Developmental disorders 0.050 0.135 0.143 0.118 125%
Diabetes 0.005 0.011 0.014 0.011 136% *
Epilepsy; convulsions 0.012 0.026 0.034 0.024 161%
Esophageal disorders 0.009 0.011 0.012 0.010 272% *
Essential hypertension 0.003 0.008 0.008 0.008 112% *
HIV infection 0.000 0.000 0.000 0.000 -45% YES *
Intracranial injury 0.005 0.008 0.008 0.008 118% *

APPENDIX B
Covariate Control Treatment Control Treatment Balanced3
All Health Homes (Under 18, All CMHC)
Summary of Covariate Averages Before and After Propensity Score Matching
Full Group Matched SamplesBias
Reduction1
Excluded
from PSM2
Mental Disorder Not Otherwise Specified
(NOS)0.002 0.011 0.013 0.010 129% *
Neoplasms of unspecified nature or uncertain
behavior0.012 0.047 0.047 0.040 116% *
Obsessive-Compulsive Disorders 0.001 0.009 0.006 0.007 92% *
Osteoarthritis 0.000 0.000 0.001 0.000 -15% YES *
Other Developmental Disorder 0.005 0.071 0.064 0.059 106% *
Other nervous system disorders 0.025 0.049 0.060 0.045 155%
PTSD 0.004 0.033 0.032 0.027 114% *
Pregnancy 0.003 0.005 0.008 0.005 186% *
Psychotic Disorder 0.002 0.014 0.013 0.012 104% *
Spondylosis; intervertebral disc disorders;
other back0.018 0.033 0.042 0.031 164%
Substance-related disorders 0.004 0.017 0.021 0.015 132% *
Thyroid disorders 0.003 0.008 0.009 0.008 122% *
1 Bias Reduction represents the reduction in the standardized bias coefficient as a result of the matching process. A figure greater than 0% and less than 200%
represents reduced bias.
2 Indicates if the covariate was excluded in the Propensity Score Model logistic regression.
3 An asterisk (*) indicates that the averages for the matched control group and treatment group are statistically equivalent.
Notes:

APPENDIX B
Covariate
Age 42.341 43.890 44.281 43.560 151%
Female 0.639 0.629 0.647 0.630 -64% *
White 0.742 0.676 0.739 0.697 35%
Black 0.225 0.308 0.244 0.286 50%
County: Adams 0.042 0.048 0.057 0.051 192% *
County: Butler 0.268 0.079 0.154 0.097 66%
County: Lawrence 0.076 0.075 0.099 0.082 -1080%
County: Lucas 0.488 0.676 0.549 0.639 53%
Medicaid Member Months 8.527 10.866 11.146 10.626 132% N/A
MCP Member Months 5.146 6.680 6.351 6.393 97% *
Dual Eligibility Member Months 0.506 0.581 0.682 0.593 210% *
Waiver Member Months 0.631 0.798 0.897 0.812 147% *
ABD Member Months 1.545 5.398 4.922 4.736 104% *
CFC Member Months 4.371 2.654 3.013 2.993 99% *
Control Treatment Control Treatment Balanced3
All Health Homes (18 and Over, All CMHC)
Summary of Covariate Averages Before and After Propensity Score Matching
Full Group Matched SamplesBias
Reduction1
Excluded
from PSM2

APPENDIX B
Covariate Control Treatment Control Treatment Balanced3
All Health Homes (18 and Over, All CMHC)
Summary of Covariate Averages Before and After Propensity Score Matching
Full Group Matched SamplesBias
Reduction1
Excluded
from PSM2
# Mental Health Center Visits 1.040 20.948 13.131 14.457 94%
# ED Mental Health Visits 0.018 0.115 0.113 0.099 111% *
# IP Mental Health Visits 0.003 0.035 0.033 0.028 113% *
13 or More Mental Health Rx 0.048 0.372 0.337 0.303 108%
ADHD 0.010 0.022 0.027 0.021 141% *
Acute bronchitis 0.055 0.104 0.118 0.098 134%
Alcohol-related disorders 0.010 0.034 0.033 0.030 109% *
Anxiety Disorders 0.044 0.110 0.148 0.115 139%
Asthma 0.048 0.118 0.123 0.105 123%
Autism 0.002 0.002 0.002 0.002 -54% *
Bipolar Disorder 0.023 0.200 0.193 0.170 110%
Blindness and vision defects 0.146 0.251 0.263 0.242 118%
Cancer 0.024 0.029 0.033 0.031 136% *
Cardiac dysrhythmias 0.044 0.082 0.087 0.076 125% *

APPENDIX B
Covariate Control Treatment Control Treatment Balanced3
All Health Homes (18 and Over, All CMHC)
Summary of Covariate Averages Before and After Propensity Score Matching
Full Group Matched SamplesBias
Reduction1
Excluded
from PSM2
Chronic obstructive pulmonary disease and
bronchiectasis0.088 0.178 0.197 0.170 126%
Conduct Disorder 0.003 0.012 0.014 0.010 135% *
Congestive heart failure; nonhypertensive 0.025 0.029 0.034 0.029 215% *
Coronary atherosclerosis and other heart
disease0.042 0.058 0.065 0.057 144% *
Cystic fibrosis 0.000 0.000 0.000 0.000 2% YES *
Delirium, dementia, and amnestic and other
cognitive diseases0.017 0.014 0.017 0.013 -37% *
Depression 0.072 0.418 0.485 0.399 120%
Developmental disorders 0.027 0.046 0.051 0.044 131% *
Diabetes 0.106 0.196 0.203 0.186 117%
Epilepsy; convulsions 0.025 0.050 0.055 0.049 122% *
Esophageal disorders 0.041 0.093 0.100 0.087 122%
Essential hypertension 0.147 0.278 0.290 0.261 120%
HIV infection 0.003 0.005 0.005 0.005 119% *
Intracranial injury 0.007 0.016 0.014 0.015 84% *

APPENDIX B
Covariate Control Treatment Control Treatment Balanced3
All Health Homes (18 and Over, All CMHC)
Summary of Covariate Averages Before and After Propensity Score Matching
Full Group Matched SamplesBias
Reduction1
Excluded
from PSM2
Mental Disorder Not Otherwise Specified
(NOS)0.007 0.035 0.035 0.029 117% *
Neoplasms of unspecified nature or uncertain
behavior0.053 0.101 0.111 0.097 125%
Obsessive-Compulsive Disorders 0.001 0.004 0.004 0.005 86% *
Osteoarthritis 0.055 0.113 0.115 0.102 119%
Other Developmental Disorder 0.001 0.004 0.004 0.003 120% *
Other nervous system disorders 0.091 0.180 0.199 0.168 130%
PTSD 0.005 0.029 0.036 0.026 132%
Pregnancy 0.070 0.037 0.044 0.041 91% *
Psychotic Disorder 0.025 0.352 0.281 0.276 101% *
Spondylosis; intervertebral disc disorders;
other back0.166 0.333 0.363 0.321 123%
Substance-related disorders 0.032 0.073 0.081 0.069 124%
Thyroid disorders 0.035 0.071 0.074 0.067 117% *
1 Bias Reduction represents the reduction in the standardized bias coefficient as a result of the matching process. A figure greater than 0% and less than 200%
represents reduced bias.
2 Indicates if the covariate was excluded in the Propensity Score Model logistic regression.
3 An asterisk (*) indicates that the averages for the matched control group and treatment group are statistically equivalent.
Notes:

APPENDIX B
Covariate
Age 29.433 32.125 30.466 29.705 128%
Female 0.566 0.529 0.533 0.530 90% *
White 0.773 0.649 0.676 0.689 110% *
Black 0.201 0.335 0.305 0.291 110% *
County: Adams 0.028 0.037 0.039 0.040 92% *
County: Butler 0.394 0.051 0.098 0.076 91%
County: Lawrence 0.063 0.063 0.075 0.076 303% *
County: Lucas 0.392 0.735 0.657 0.669 97% *
Medicaid Member Months 11.345 11.608 11.488 11.465 108% *
MCP Member Months 7.691 7.766 7.488 7.552 16% *
Dual Eligibility Member Months 0.418 0.401 0.406 0.379 -62% *
Waiver Member Months 0.540 0.556 0.601 0.583 209% *
ABD Member Months 2.324 4.437 3.285 2.992 114%
CFC Member Months 6.993 5.224 6.038 6.350 117%
Control Treatment Control Treatment Balanced3
All Health Homes (All Ages, CMHC Experience)
Summary of Covariate Averages Before and After Propensity Score Matching
Full Group Matched SamplesBias
Reduction1
Excluded
from PSM2

APPENDIX B
Covariate Control Treatment Control Treatment Balanced3
All Health Homes (All Ages, CMHC Experience)
Summary of Covariate Averages Before and After Propensity Score Matching
Full Group Matched SamplesBias
Reduction1
Excluded
from PSM2
# Mental Health Center Visits 15.681 27.246 18.818 18.767 100% *
# ED Mental Health Visits 0.095 0.097 0.091 0.087 283% *
# IP Mental Health Visits 0.029 0.041 0.036 0.036 103% *
13 or More Mental Health Rx 0.167 0.308 0.210 0.192 114%
ADHD 0.164 0.216 0.209 0.207 104% *
Acute bronchitis 0.080 0.085 0.082 0.078 173% *
Alcohol-related disorders 0.027 0.026 0.023 0.023 158% *
Anxiety Disorders 0.141 0.095 0.114 0.113 98% *
Asthma 0.090 0.132 0.123 0.113 125% *
Autism 0.009 0.008 0.010 0.010 -327% *
Bipolar Disorder 0.141 0.161 0.143 0.143 104% *
Blindness and vision defects 0.249 0.283 0.275 0.273 106% *
Cancer 0.019 0.019 0.021 0.020 211% *
Cardiac dysrhythmias 0.046 0.061 0.050 0.050 104% *

APPENDIX B
Covariate Control Treatment Control Treatment Balanced3
All Health Homes (All Ages, CMHC Experience)
Summary of Covariate Averages Before and After Propensity Score Matching
Full Group Matched SamplesBias
Reduction1
Excluded
from PSM2
Chronic obstructive pulmonary disease and
bronchiectasis0.099 0.129 0.113 0.111 107% *
Conduct Disorder 0.113 0.135 0.140 0.142 90% *
Congestive heart failure; nonhypertensive 0.017 0.019 0.016 0.017 47% *
Coronary atherosclerosis and other heart
disease0.026 0.040 0.035 0.034 105% *
Cystic fibrosis 0.001 0.000 0.000 0.000 13% YES *
Delirium, dementia, and amnestic and other
cognitive diseases0.016 0.011 0.010 0.011 120% *
Depression 0.385 0.374 0.381 0.378 68% *
Developmental disorders 0.089 0.094 0.092 0.092 112% *
Diabetes 0.101 0.138 0.121 0.113 121% *
Epilepsy; convulsions 0.041 0.045 0.045 0.042 167% *
Esophageal disorders 0.053 0.067 0.062 0.056 140% *
Essential hypertension 0.135 0.190 0.169 0.156 124% *
HIV infection 0.002 0.003 0.003 0.004 77% *
Intracranial injury 0.013 0.014 0.013 0.012 285% *

APPENDIX B
Covariate Control Treatment Control Treatment Balanced3
All Health Homes (All Ages, CMHC Experience)
Summary of Covariate Averages Before and After Propensity Score Matching
Full Group Matched SamplesBias
Reduction1
Excluded
from PSM2
Mental Disorder Not Otherwise Specified
(NOS)0.046 0.031 0.030 0.031 107% *
Neoplasms of unspecified nature or uncertain
behavior0.074 0.089 0.090 0.085 132% *
Obsessive-Compulsive Disorders 0.005 0.008 0.007 0.007 115% *
Osteoarthritis 0.052 0.076 0.068 0.062 123% *
Other Developmental Disorder 0.031 0.040 0.041 0.042 96% *
Other nervous system disorders 0.133 0.140 0.133 0.129 171% *
PTSD 0.058 0.039 0.043 0.040 85% *
Pregnancy 0.048 0.020 0.024 0.026 109% *
Psychotic Disorder 0.135 0.267 0.191 0.173 113%
Spondylosis; intervertebral disc disorders;
other back0.205 0.230 0.220 0.208 149% *
Substance-related disorders 0.112 0.058 0.064 0.066 104% *
Thyroid disorders 0.042 0.052 0.045 0.046 92% *
1 Bias Reduction represents the reduction in the standardized bias coefficient as a result of the matching process. A figure greater than 0% and less than 200%
represents reduced bias.
2 Indicates if the covariate was excluded in the Propensity Score Model logistic regression.
3 An asterisk (*) indicates that the averages for the matched control group and treatment group are statistically equivalent.
Notes:

APPENDIX B
Covariate
Age 27.568 24.219 28.786 24.219 -45%
Female 0.577 0.534 0.534 0.534 99% *
White 0.724 0.626 0.658 0.626 68%
Black 0.241 0.352 0.312 0.352 65%
County: Adams 0.043 0.026 0.039 0.026 21%
County: Butler 0.293 0.102 0.094 0.102 105% *
County: Lawrence 0.075 0.070 0.091 0.070 -350%
County: Lucas 0.477 0.709 0.662 0.709 79%
Medicaid Member Months 9.339 9.202 9.611 9.202 -225%
MCP Member Months 7.117 7.287 6.688 7.287 -263%
Dual Eligibility Member Months 0.272 0.139 0.232 0.139 27%
Waiver Member Months 0.350 0.156 0.321 0.156 13%
ABD Member Months 0.909 1.577 2.326 1.577 192%
CFC Member Months 7.019 7.039 6.276 7.039 -3847%
Control Treatment Control Treatment Balanced3
All Health Homes (All Ages, No CMHC Experience)
Summary of Covariate Averages Before and After Propensity Score Matching
Full Group Matched SamplesBias
Reduction1
Excluded
from PSM2

APPENDIX B
Covariate Control Treatment Control Treatment Balanced3
All Health Homes (All Ages, No CMHC Experience)
Summary of Covariate Averages Before and After Propensity Score Matching
Full Group Matched SamplesBias
Reduction1
Excluded
from PSM2
# Mental Health Center Visits 0.000 0.000 0.000 0.000 N/A YES N/A
# ED Mental Health Visits 0.006 0.015 0.020 0.015 143% *
# IP Mental Health Visits 0.001 0.003 0.003 0.003 100% *
13 or More Mental Health Rx 0.021 0.055 0.070 0.055 136%
ADHD 0.023 0.053 0.057 0.053 113% *
Acute bronchitis 0.054 0.058 0.092 0.058 726%
Alcohol-related disorders 0.004 0.009 0.011 0.009 123% *
Anxiety Disorders 0.020 0.038 0.054 0.038 169%
Asthma 0.057 0.100 0.121 0.100 140%
Autism 0.002 0.004 0.005 0.004 147% YES *
Bipolar Disorder 0.005 0.011 0.014 0.011 129% *
Blindness and vision defects 0.143 0.201 0.232 0.201 149%
Cancer 0.013 0.010 0.019 0.010 -143%
Cardiac dysrhythmias 0.025 0.033 0.051 0.033 307%

APPENDIX B
Covariate Control Treatment Control Treatment Balanced3
All Health Homes (All Ages, No CMHC Experience)
Summary of Covariate Averages Before and After Propensity Score Matching
Full Group Matched SamplesBias
Reduction1
Excluded
from PSM2
Chronic obstructive pulmonary disease and
bronchiectasis0.056 0.062 0.095 0.062 664%
Conduct Disorder 0.003 0.008 0.010 0.008 121% *
Congestive heart failure; nonhypertensive 0.014 0.011 0.016 0.011 -87% *
Coronary atherosclerosis and other heart
disease0.023 0.015 0.028 0.015 -50%
Cystic fibrosis 0.000 0.000 0.000 0.000 100% YES *
Delirium, dementia, and amnestic and other
cognitive diseases0.009 0.007 0.014 0.007 -193%
Depression 0.022 0.050 0.057 0.050 124% *
Developmental disorders 0.033 0.043 0.057 0.043 245%
Diabetes 0.058 0.051 0.085 0.051 -348%
Epilepsy; convulsions 0.018 0.022 0.028 0.022 238% *
Esophageal disorders 0.025 0.028 0.042 0.028 526%
Essential hypertension 0.079 0.079 0.125 0.079 8737%
HIV infection 0.002 0.001 0.002 0.001 -319% YES *
Intracranial injury 0.005 0.009 0.011 0.009 156% *

APPENDIX B
Covariate Control Treatment Control Treatment Balanced3
All Health Homes (All Ages, No CMHC Experience)
Summary of Covariate Averages Before and After Propensity Score Matching
Full Group Matched SamplesBias
Reduction1
Excluded
from PSM2
Mental Disorder Not Otherwise Specified
(NOS)0.002 0.004 0.005 0.004 115% YES *
Neoplasms of unspecified nature or uncertain
behavior0.032 0.040 0.067 0.040 395%
Obsessive-Compulsive Disorders 0.001 0.001 0.001 0.001 319% YES *
Osteoarthritis 0.029 0.029 0.044 0.029 4338%
Other Developmental Disorder 0.001 0.000 0.003 0.000 -308% YES
Other nervous system disorders 0.057 0.074 0.108 0.074 263%
PTSD 0.001 0.002 0.002 0.002 67% YES *
Pregnancy 0.040 0.036 0.058 0.036 -510%
Psychotic Disorder 0.006 0.014 0.018 0.014 138% *
Spondylosis; intervertebral disc disorders;
other back0.092 0.130 0.186 0.130 227%
Substance-related disorders 0.012 0.021 0.029 0.021 185% *
Thyroid disorders 0.019 0.017 0.025 0.017 -242% *
1 Bias Reduction represents the reduction in the standardized bias coefficient as a result of the matching process. A figure greater than 0% and less than 200%
represents reduced bias.
2 Indicates if the covariate was excluded in the Propensity Score Model logistic regression.
3 An asterisk (*) indicates that the averages for the matched control group and treatment group are statistically equivalent.
Notes:

APPENDIX B
Covariate
Age 27.695 35.413 40.305 35.413 166%
Female 0.576 0.638 0.608 0.638 52% *
White 0.727 0.835 0.812 0.835 77% *
Black 0.239 0.145 0.166 0.145 75% *
County: Adams 0.042 0.000 0.028 0.000 19% YES
County: Butler 0.300 1.000 0.349 1.000 11% YES
County: Lawrence 0.074 0.000 0.104 0.000 -21% YES
County: Lucas 0.471 0.000 0.378 0.000 17% YES
Medicaid Member Months 9.475 10.741 11.194 10.741 150%
MCP Member Months 7.156 7.496 7.093 7.496 -19% *
Dual Eligibility Member Months 0.282 0.432 0.626 0.432 207% *
Waiver Member Months 0.363 0.481 0.615 0.481 200% *
ABD Member Months 1.005 3.566 4.065 3.566 116% *
CFC Member Months 7.018 5.173 4.264 5.173 150%
Control Treatment Control Treatment Balanced3
Butler (All Ages, All CMHC)
Summary of Covariate Averages Before and After Propensity Score Matching
Full Group Matched SamplesBias
Reduction1
Excluded
from PSM2

APPENDIX B
Covariate Control Treatment Control Treatment Balanced3
Butler (All Ages, All CMHC)
Summary of Covariate Averages Before and After Propensity Score Matching
Full Group Matched SamplesBias
Reduction1
Excluded
from PSM2
# Mental Health Center Visits 1.069 13.690 9.199 13.690 76%
# ED Mental Health Visits 0.012 0.095 0.064 0.095 69% *
# IP Mental Health Visits 0.003 0.026 0.021 0.026 83% *
13 or More Mental Health Rx 0.031 0.274 0.253 0.274 93% *
ADHD 0.032 0.111 0.095 0.111 83% *
Acute bronchitis 0.056 0.113 0.119 0.113 110% *
Alcohol-related disorders 0.006 0.020 0.023 0.020 118% *
Anxiety Disorders 0.028 0.127 0.135 0.127 106% *
Asthma 0.060 0.103 0.122 0.103 139% *
Autism 0.003 0.003 0.003 0.003 100% YES *
Bipolar Disorder 0.014 0.145 0.132 0.145 92% *
Blindness and vision defects 0.150 0.271 0.282 0.271 109% *
Cancer 0.014 0.039 0.059 0.039 157% *
Cardiac dysrhythmias 0.027 0.059 0.067 0.059 121% *

APPENDIX B
Covariate Control Treatment Control Treatment Balanced3
Butler (All Ages, All CMHC)
Summary of Covariate Averages Before and After Propensity Score Matching
Full Group Matched SamplesBias
Reduction1
Excluded
from PSM2
Chronic obstructive pulmonary disease and
bronchiectasis0.059 0.127 0.155 0.127 134% *
Conduct Disorder 0.011 0.051 0.038 0.051 73% *
Congestive heart failure; nonhypertensive 0.014 0.010 0.029 0.010 -279% YES
Coronary atherosclerosis and other heart
disease0.023 0.034 0.059 0.034 274%
Cystic fibrosis 0.000 0.000 0.000 0.000 N/A YES N/A
Delirium, dementia, and amnestic and other
cognitive diseases0.010 0.003 0.021 0.003 -104% YES
Depression 0.047 0.312 0.328 0.312 105% *
Developmental disorders 0.037 0.065 0.083 0.065 154% *
Diabetes 0.061 0.155 0.197 0.155 136% *
Epilepsy; convulsions 0.019 0.054 0.067 0.054 130% *
Esophageal disorders 0.027 0.080 0.126 0.080 164%
Essential hypertension 0.083 0.192 0.233 0.192 131% *
HIV infection 0.002 0.005 0.003 0.005 56% YES *
Intracranial injury 0.006 0.010 0.028 0.010 398% YES

APPENDIX B
Covariate Control Treatment Control Treatment Balanced3
Butler (All Ages, All CMHC)
Summary of Covariate Averages Before and After Propensity Score Matching
Full Group Matched SamplesBias
Reduction1
Excluded
from PSM2
Mental Disorder Not Otherwise Specified
(NOS)0.005 0.033 0.036 0.033 109% *
Neoplasms of unspecified nature or uncertain
behavior0.035 0.093 0.106 0.093 118% *
Obsessive-Compulsive Disorders 0.001 0.010 0.008 0.010 85% YES *
Osteoarthritis 0.031 0.064 0.085 0.064 152% *
Other Developmental Disorder 0.003 0.016 0.015 0.016 90% YES *
Other nervous system disorders 0.062 0.206 0.254 0.206 127%
PTSD 0.005 0.073 0.051 0.073 74% *
Pregnancy 0.040 0.034 0.038 0.034 45% *
Psychotic Disorder 0.015 0.119 0.106 0.119 90% *
Spondylosis; intervertebral disc disorders;
other back0.100 0.305 0.351 0.305 118% *
Substance-related disorders 0.019 0.047 0.049 0.047 105% *
Thyroid disorders 0.021 0.042 0.051 0.042 132% *
1 Bias Reduction represents the reduction in the standardized bias coefficient as a result of the matching process. A figure greater than 0% and less than 200%
represents reduced bias.
2 Indicates if the covariate was excluded in the Propensity Score Model logistic regression.
3 An asterisk (*) indicates that the averages for the matched control group and treatment group are statistically equivalent.
Notes:

APPENDIX B
Covariate
Age 9.427 11.898 12.408 11.898 123% *
Female 0.498 0.401 0.401 0.401 100% *
White 0.710 0.834 0.752 0.834 32% *
Black 0.256 0.140 0.229 0.140 21%
County: Adams 0.042 0.000 0.019 0.000 33% YES *
County: Butler 0.341 1.000 0.516 1.000 30% YES
County: Lawrence 0.071 0.000 0.108 0.000 -26% YES
County: Lucas 0.450 0.000 0.280 0.000 31% YES
Medicaid Member Months 10.659 11.510 11.452 11.510 90% *
MCP Member Months 9.662 9.904 8.522 9.904 -444%
Dual Eligibility Member Months 0.003 0.000 0.013 0.000 -279% *
Waiver Member Months 0.029 0.000 0.057 0.000 -61% *
ABD Member Months 0.332 1.006 1.682 1.006 174% *
CFC Member Months 10.318 10.503 9.752 10.503 -295% *
Control Treatment Control Treatment Balanced3
Butler (Under 18, All CMHC)
Summary of Covariate Averages Before and After Propensity Score Matching
Full Group Matched SamplesBias
Reduction1
Excluded
from PSM2

APPENDIX B
Covariate Control Treatment Control Treatment Balanced3
Butler (Under 18, All CMHC)
Summary of Covariate Averages Before and After Propensity Score Matching
Full Group Matched SamplesBias
Reduction1
Excluded
from PSM2
# Mental Health Center Visits 1.105 15.618 18.879 15.618 115% *
# ED Mental Health Visits 0.004 0.083 0.076 0.083 94% *
# IP Mental Health Visits 0.002 0.051 0.051 0.051 100% *
13 or More Mental Health Rx 0.008 0.070 0.089 0.070 122% *
ADHD 0.060 0.369 0.344 0.369 93% *
Acute bronchitis 0.056 0.057 0.051 0.057 -675% YES *
Alcohol-related disorders 0.001 0.000 0.000 0.000 N/A YES N/A
Anxiety Disorders 0.008 0.064 0.083 0.064 124% YES *
Asthma 0.075 0.108 0.070 0.108 -16% *
Autism 0.003 0.006 0.019 0.006 370% YES *
Bipolar Disorder 0.003 0.051 0.070 0.051 127% YES *
Blindness and vision defects 0.156 0.293 0.217 0.293 47% *
Cancer 0.001 0.006 0.006 0.006 100% YES *
Cardiac dysrhythmias 0.005 0.006 0.013 0.006 425% YES *

APPENDIX B
Covariate Control Treatment Control Treatment Balanced3
Butler (Under 18, All CMHC)
Summary of Covariate Averages Before and After Propensity Score Matching
Full Group Matched SamplesBias
Reduction1
Excluded
from PSM2
Chronic obstructive pulmonary disease and
bronchiectasis0.024 0.006 0.032 0.006 -31% YES *
Conduct Disorder 0.021 0.172 0.197 0.172 112% *
Congestive heart failure; nonhypertensive 0.000 0.000 0.000 0.000 N/A YES N/A
Coronary atherosclerosis and other heart
disease0.000 0.000 0.000 0.000 N/A YES N/A
Cystic fibrosis 0.001 0.000 0.000 0.000 N/A YES N/A
Delirium, dementia, and amnestic and other
cognitive diseases0.001 0.006 0.000 0.006 -25% YES *
Depression 0.016 0.197 0.229 0.197 113% *
Developmental disorders 0.050 0.146 0.166 0.146 116% *
Diabetes 0.005 0.019 0.013 0.019 61% YES *
Epilepsy; convulsions 0.012 0.038 0.038 0.038 100% YES *
Esophageal disorders 0.009 0.013 0.006 0.013 -108% YES *
Essential hypertension 0.003 0.025 0.006 0.025 21% YES *
HIV infection 0.000 0.000 0.000 0.000 N/A YES N/A
Intracranial injury 0.005 0.013 0.032 0.013 256% YES *

APPENDIX B
Covariate Control Treatment Control Treatment Balanced3
Butler (Under 18, All CMHC)
Summary of Covariate Averages Before and After Propensity Score Matching
Full Group Matched SamplesBias
Reduction1
Excluded
from PSM2
Mental Disorder Not Otherwise Specified
(NOS)0.002 0.038 0.045 0.038 112% YES *
Neoplasms of unspecified nature or uncertain
behavior0.012 0.057 0.045 0.057 77% YES *
Obsessive-Compulsive Disorders 0.001 0.006 0.006 0.006 100% YES *
Osteoarthritis 0.000 0.000 0.000 0.000 N/A YES N/A
Other Developmental Disorder 0.005 0.045 0.057 0.045 123% YES *
Other nervous system disorders 0.025 0.127 0.115 0.127 90% *
PTSD 0.004 0.070 0.089 0.070 120% *
Pregnancy 0.003 0.006 0.019 0.006 306% YES *
Psychotic Disorder 0.002 0.025 0.025 0.025 100% YES *
Spondylosis; intervertebral disc disorders;
other back0.018 0.064 0.045 0.064 64% YES *
Substance-related disorders 0.004 0.019 0.032 0.019 156% YES *
Thyroid disorders 0.003 0.000 0.000 0.000 N/A YES N/A
1 Bias Reduction represents the reduction in the standardized bias coefficient as a result of the matching process. A figure greater than 0% and less than 200%
represents reduced bias.
2 Indicates if the covariate was excluded in the Propensity Score Model logistic regression.
3 An asterisk (*) indicates that the averages for the matched control group and treatment group are statistically equivalent.
Notes:

APPENDIX B
Covariate
Age 42.341 43.509 46.331 43.509 364%
Female 0.639 0.719 0.724 0.719 106% *
White 0.742 0.836 0.836 0.836 100% *
Black 0.225 0.147 0.138 0.147 112% *
County: Adams 0.042 0.000 0.059 0.000 -20% YES
County: Butler 0.268 1.000 0.346 1.000 17% YES
County: Lawrence 0.076 0.000 0.107 0.000 -21% YES
County: Lucas 0.488 0.000 0.336 0.000 27% YES
Medicaid Member Months 8.527 10.476 11.160 10.476 151%
MCP Member Months 5.146 6.667 6.553 6.667 92% *
Dual Eligibility Member Months 0.506 0.581 0.971 0.581 531%
Waiver Member Months 0.631 0.647 0.930 0.647 1698% *
ABD Member Months 1.545 4.447 4.480 4.447 101% *
CFC Member Months 4.371 3.338 3.195 3.338 114% *
Control Treatment Control Treatment Balanced3
Butler (18 and Over, All CMHC)
Summary of Covariate Averages Before and After Propensity Score Matching
Full Group Matched SamplesBias
Reduction1
Excluded
from PSM2

APPENDIX B
Covariate Control Treatment Control Treatment Balanced3
Butler (18 and Over, All CMHC)
Summary of Covariate Averages Before and After Propensity Score Matching
Full Group Matched SamplesBias
Reduction1
Excluded
from PSM2
# Mental Health Center Visits 1.040 13.026 9.388 13.026 80%
# ED Mental Health Visits 0.018 0.099 0.066 0.099 63% *
# IP Mental Health Visits 0.003 0.018 0.015 0.018 88% *
13 or More Mental Health Rx 0.048 0.344 0.377 0.344 109% *
ADHD 0.010 0.022 0.011 0.022 12% YES *
Acute bronchitis 0.055 0.132 0.151 0.132 121% *
Alcohol-related disorders 0.010 0.026 0.029 0.026 111% *
Anxiety Disorders 0.044 0.149 0.162 0.149 110% *
Asthma 0.048 0.101 0.105 0.101 107% *
Autism 0.002 0.002 0.002 0.002 100% YES *
Bipolar Disorder 0.023 0.178 0.171 0.178 97% *
Blindness and vision defects 0.146 0.263 0.307 0.263 133% *
Cancer 0.024 0.050 0.064 0.050 140% *
Cardiac dysrhythmias 0.044 0.077 0.105 0.077 173% *

APPENDIX B
Covariate Control Treatment Control Treatment Balanced3
Butler (18 and Over, All CMHC)
Summary of Covariate Averages Before and After Propensity Score Matching
Full Group Matched SamplesBias
Reduction1
Excluded
from PSM2
Chronic obstructive pulmonary disease and
bronchiectasis0.088 0.169 0.232 0.169 165%
Conduct Disorder 0.003 0.009 0.000 0.009 -62% YES
Congestive heart failure; nonhypertensive 0.025 0.013 0.053 0.013 -161% YES
Coronary atherosclerosis and other heart
disease0.042 0.046 0.075 0.046 640% *
Cystic fibrosis 0.000 0.000 0.000 0.000 N/A YES N/A
Delirium, dementia, and amnestic and other
cognitive diseases0.017 0.002 0.031 0.002 -50% YES
Depression 0.072 0.351 0.414 0.351 118%
Developmental disorders 0.027 0.037 0.039 0.037 119% *
Diabetes 0.106 0.202 0.221 0.202 118% *
Epilepsy; convulsions 0.025 0.059 0.081 0.059 150% *
Esophageal disorders 0.041 0.103 0.101 0.103 97% *
Essential hypertension 0.147 0.250 0.305 0.250 147% *
HIV infection 0.003 0.007 0.007 0.007 100% YES *
Intracranial injury 0.007 0.009 0.007 0.009 -1% YES *

APPENDIX B
Covariate Control Treatment Control Treatment Balanced3
Butler (18 and Over, All CMHC)
Summary of Covariate Averages Before and After Propensity Score Matching
Full Group Matched SamplesBias
Reduction1
Excluded
from PSM2
Mental Disorder Not Otherwise Specified
(NOS)0.007 0.031 0.022 0.031 69% *
Neoplasms of unspecified nature or uncertain
behavior0.053 0.105 0.114 0.105 114% *
Obsessive-Compulsive Disorders 0.001 0.011 0.009 0.011 82% YES *
Osteoarthritis 0.055 0.086 0.123 0.086 202% *
Other Developmental Disorder 0.001 0.007 0.007 0.007 100% YES *
Other nervous system disorders 0.091 0.232 0.276 0.232 126% *
PTSD 0.005 0.075 0.031 0.075 45%
Pregnancy 0.070 0.044 0.044 0.044 100% *
Psychotic Disorder 0.025 0.151 0.158 0.151 104% *
Spondylosis; intervertebral disc disorders;
other back0.166 0.388 0.461 0.388 129%
Substance-related disorders 0.032 0.057 0.061 0.057 115% *
Thyroid disorders 0.035 0.057 0.086 0.057 206% *
1 Bias Reduction represents the reduction in the standardized bias coefficient as a result of the matching process. A figure greater than 0% and less than 200%
represents reduced bias.
2 Indicates if the covariate was excluded in the Propensity Score Model logistic regression.
3 An asterisk (*) indicates that the averages for the matched control group and treatment group are statistically equivalent.
Notes:
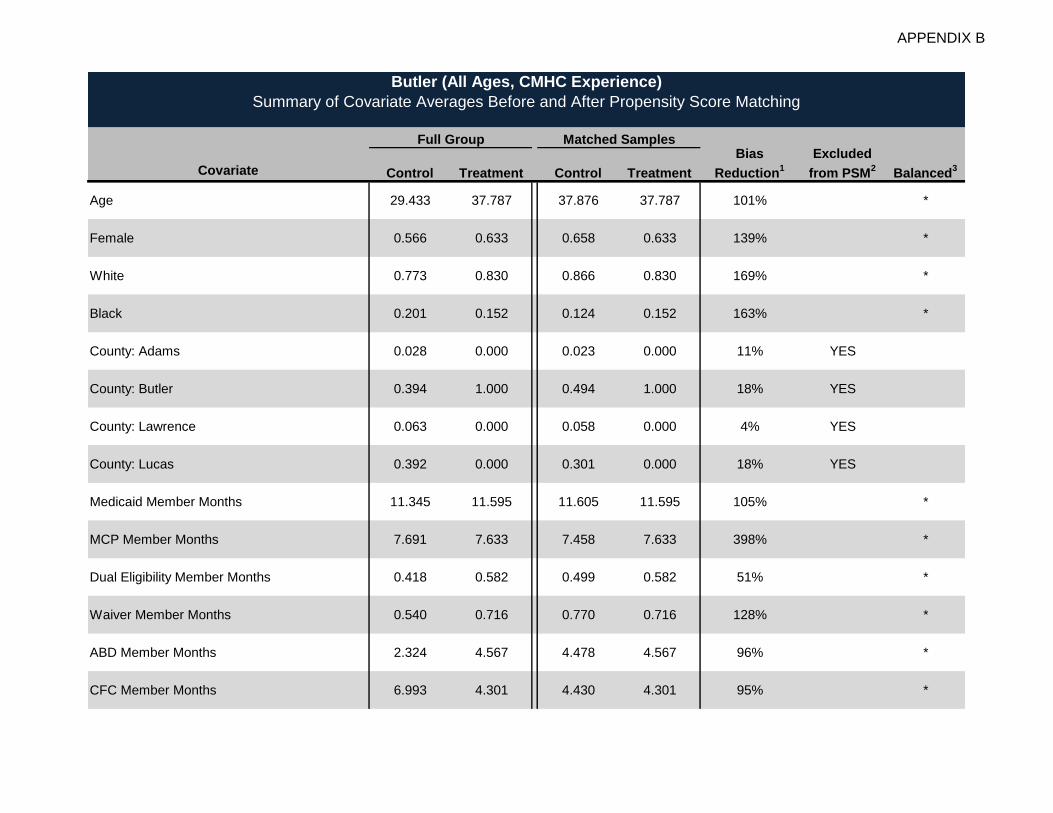
APPENDIX B
Covariate
Age 29.433 37.787 37.876 37.787 101% *
Female 0.566 0.633 0.658 0.633 139% *
White 0.773 0.830 0.866 0.830 169% *
Black 0.201 0.152 0.124 0.152 163% *
County: Adams 0.028 0.000 0.023 0.000 11% YES
County: Butler 0.394 1.000 0.494 1.000 18% YES
County: Lawrence 0.063 0.000 0.058 0.000 4% YES
County: Lucas 0.392 0.000 0.301 0.000 18% YES
Medicaid Member Months 11.345 11.595 11.605 11.595 105% *
MCP Member Months 7.691 7.633 7.458 7.633 398% *
Dual Eligibility Member Months 0.418 0.582 0.499 0.582 51% *
Waiver Member Months 0.540 0.716 0.770 0.716 128% *
ABD Member Months 2.324 4.567 4.478 4.567 96% *
CFC Member Months 6.993 4.301 4.430 4.301 95% *
Control Treatment Control Treatment Balanced3
Butler (All Ages, CMHC Experience)
Summary of Covariate Averages Before and After Propensity Score Matching
Full Group Matched SamplesBias
Reduction1
Excluded
from PSM2

APPENDIX B
Covariate Control Treatment Control Treatment Balanced3
Butler (All Ages, CMHC Experience)
Summary of Covariate Averages Before and After Propensity Score Matching
Full Group Matched SamplesBias
Reduction1
Excluded
from PSM2
# Mental Health Center Visits 15.681 21.246 20.127 21.246 82% *
# ED Mental Health Visits 0.095 0.137 0.142 0.137 111% *
# IP Mental Health Visits 0.029 0.038 0.043 0.038 148% *
13 or More Mental Health Rx 0.167 0.380 0.405 0.380 111% *
ADHD 0.164 0.122 0.101 0.122 153% *
Acute bronchitis 0.080 0.122 0.114 0.122 83% *
Alcohol-related disorders 0.027 0.020 0.025 0.020 19% YES *
Anxiety Disorders 0.141 0.162 0.172 0.162 147% *
Asthma 0.090 0.114 0.104 0.114 58% *
Autism 0.009 0.003 0.010 0.003 -18% YES *
Bipolar Disorder 0.141 0.208 0.233 0.208 135% *
Blindness and vision defects 0.249 0.294 0.276 0.294 61% *
Cancer 0.019 0.048 0.051 0.048 107% *
Cardiac dysrhythmias 0.046 0.071 0.053 0.071 30% *

APPENDIX B
Covariate Control Treatment Control Treatment Balanced3
Butler (All Ages, CMHC Experience)
Summary of Covariate Averages Before and After Propensity Score Matching
Full Group Matched SamplesBias
Reduction1
Excluded
from PSM2
Chronic obstructive pulmonary disease and
bronchiectasis0.099 0.154 0.162 0.154 112% *
Conduct Disorder 0.113 0.061 0.056 0.061 112% *
Congestive heart failure; nonhypertensive 0.017 0.010 0.020 0.010 -39% YES *
Coronary atherosclerosis and other heart
disease0.026 0.046 0.038 0.046 64% *
Cystic fibrosis 0.001 0.000 0.000 0.000 N/A YES N/A
Delirium, dementia, and amnestic and other
cognitive diseases0.016 0.003 0.020 0.003 -19% YES
Depression 0.385 0.453 0.471 0.453 126% *
Developmental disorders 0.089 0.084 0.089 0.084 10% *
Diabetes 0.101 0.200 0.195 0.200 95% *
Epilepsy; convulsions 0.041 0.056 0.073 0.056 208% *
Esophageal disorders 0.053 0.101 0.096 0.101 91% *
Essential hypertension 0.135 0.241 0.215 0.241 78% *
HIV infection 0.002 0.003 0.000 0.003 -2441% YES *
Intracranial injury 0.013 0.008 0.020 0.008 -96% YES *

APPENDIX B
Covariate Control Treatment Control Treatment Balanced3
Butler (All Ages, CMHC Experience)
Summary of Covariate Averages Before and After Propensity Score Matching
Full Group Matched SamplesBias
Reduction1
Excluded
from PSM2
Mental Disorder Not Otherwise Specified
(NOS)0.046 0.051 0.073 0.051 528% *
Neoplasms of unspecified nature or uncertain
behavior0.074 0.124 0.127 0.124 105% *
Obsessive-Compulsive Disorders 0.005 0.015 0.005 0.015 -2% YES *
Osteoarthritis 0.052 0.084 0.076 0.084 78% *
Other Developmental Disorder 0.031 0.023 0.023 0.023 100% YES *
Other nervous system disorders 0.133 0.228 0.263 0.228 133% *
PTSD 0.058 0.106 0.096 0.106 81% *
Pregnancy 0.048 0.023 0.043 0.023 17% YES *
Psychotic Disorder 0.135 0.180 0.177 0.180 95% *
Spondylosis; intervertebral disc disorders;
other back0.205 0.359 0.408 0.359 128% *
Substance-related disorders 0.112 0.061 0.063 0.061 94% *
Thyroid disorders 0.042 0.063 0.066 0.063 111% *
1 Bias Reduction represents the reduction in the standardized bias coefficient as a result of the matching process. A figure greater than 0% and less than 200%
represents reduced bias.
2 Indicates if the covariate was excluded in the Propensity Score Model logistic regression.
3 An asterisk (*) indicates that the averages for the matched control group and treatment group are statistically equivalent.
Notes:

APPENDIX B
Covariate
Age 27.568 31.110 36.239 31.110 252%
Female 0.577 0.647 0.670 0.647 134% *
White 0.724 0.844 0.743 0.844 15%
Black 0.241 0.133 0.225 0.133 14%
County: Adams 0.043 0.000 0.064 0.000 -24% YES
County: Butler 0.293 1.000 0.271 1.000 -6% YES
County: Lawrence 0.075 0.000 0.069 0.000 4% YES
County: Lucas 0.477 0.000 0.431 0.000 9% YES
Medicaid Member Months 9.339 9.193 10.078 9.193 -599%
MCP Member Months 7.117 7.248 6.202 7.248 -730%
Dual Eligibility Member Months 0.272 0.161 0.413 0.161 -96% *
Waiver Member Months 0.350 0.055 0.110 0.055 72% *
ABD Member Months 0.909 1.752 2.427 1.752 167% *
CFC Member Months 7.019 6.752 6.096 6.752 352% *
Control Treatment Control Treatment Balanced3
Butler (All Ages, No CMHC Experience)
Summary of Covariate Averages Before and After Propensity Score Matching
Full Group Matched SamplesBias
Reduction1
Excluded
from PSM2

APPENDIX B
Covariate Control Treatment Control Treatment Balanced3
Butler (All Ages, No CMHC Experience)
Summary of Covariate Averages Before and After Propensity Score Matching
Full Group Matched SamplesBias
Reduction1
Excluded
from PSM2
# Mental Health Center Visits 0.000 0.000 0.000 0.000 N/A YES N/A
# ED Mental Health Visits 0.006 0.018 0.032 0.018 166% *
# IP Mental Health Visits 0.001 0.005 0.005 0.005 100% *
13 or More Mental Health Rx 0.021 0.083 0.064 0.083 75% *
ADHD 0.023 0.092 0.069 0.092 72% *
Acute bronchitis 0.054 0.096 0.124 0.096 154% *
Alcohol-related disorders 0.004 0.018 0.009 0.018 41% YES *
Anxiety Disorders 0.020 0.064 0.078 0.064 124% *
Asthma 0.057 0.083 0.106 0.083 180% *
Autism 0.002 0.005 0.005 0.005 100% YES *
Bipolar Disorder 0.005 0.032 0.005 0.032 -1% YES
Blindness and vision defects 0.143 0.229 0.298 0.229 170% *
Cancer 0.013 0.023 0.023 0.023 100% YES *
Cardiac dysrhythmias 0.025 0.037 0.073 0.037 346% YES *

APPENDIX B
Covariate Control Treatment Control Treatment Balanced3
Butler (All Ages, No CMHC Experience)
Summary of Covariate Averages Before and After Propensity Score Matching
Full Group Matched SamplesBias
Reduction1
Excluded
from PSM2
Chronic obstructive pulmonary disease and
bronchiectasis0.056 0.078 0.156 0.078 384%
Conduct Disorder 0.003 0.032 0.009 0.032 27% YES *
Congestive heart failure; nonhypertensive 0.014 0.009 0.037 0.009 -343% YES *
Coronary atherosclerosis and other heart
disease0.023 0.014 0.083 0.014 -378% YES
Cystic fibrosis 0.000 0.000 0.000 0.000 N/A YES N/A
Delirium, dementia, and amnestic and other
cognitive diseases0.009 0.005 0.023 0.005 -182% YES *
Depression 0.022 0.055 0.092 0.055 183% *
Developmental disorders 0.033 0.032 0.050 0.032 -1128% YES *
Diabetes 0.058 0.073 0.115 0.073 325% *
Epilepsy; convulsions 0.018 0.050 0.073 0.050 153% *
Esophageal disorders 0.025 0.041 0.078 0.041 272% YES *
Essential hypertension 0.079 0.106 0.179 0.106 330%
HIV infection 0.002 0.009 0.005 0.009 47% YES *
Intracranial injury 0.005 0.014 0.005 0.014 -11% YES *
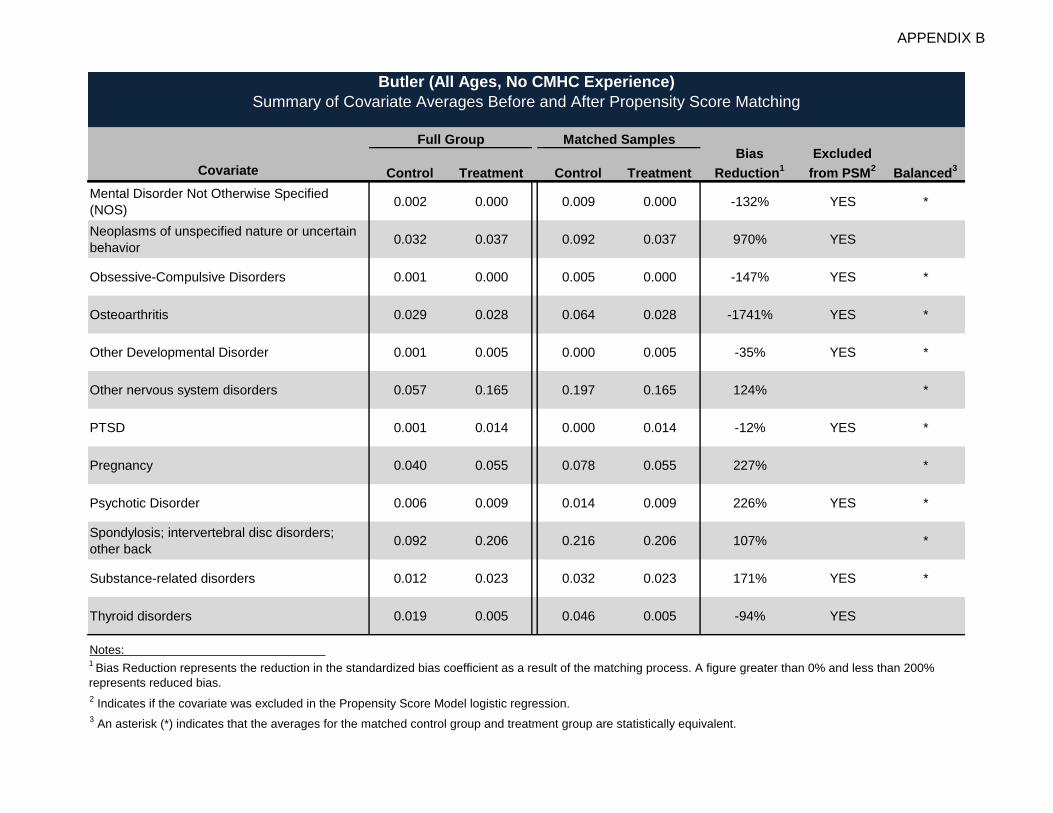
APPENDIX B
Covariate Control Treatment Control Treatment Balanced3
Butler (All Ages, No CMHC Experience)
Summary of Covariate Averages Before and After Propensity Score Matching
Full Group Matched SamplesBias
Reduction1
Excluded
from PSM2
Mental Disorder Not Otherwise Specified
(NOS)0.002 0.000 0.009 0.000 -132% YES *
Neoplasms of unspecified nature or uncertain
behavior0.032 0.037 0.092 0.037 970% YES
Obsessive-Compulsive Disorders 0.001 0.000 0.005 0.000 -147% YES *
Osteoarthritis 0.029 0.028 0.064 0.028 -1741% YES *
Other Developmental Disorder 0.001 0.005 0.000 0.005 -35% YES *
Other nervous system disorders 0.057 0.165 0.197 0.165 124% *
PTSD 0.001 0.014 0.000 0.014 -12% YES *
Pregnancy 0.040 0.055 0.078 0.055 227% *
Psychotic Disorder 0.006 0.009 0.014 0.009 226% YES *
Spondylosis; intervertebral disc disorders;
other back0.092 0.206 0.216 0.206 107% *
Substance-related disorders 0.012 0.023 0.032 0.023 171% YES *
Thyroid disorders 0.019 0.005 0.046 0.005 -94% YES
1 Bias Reduction represents the reduction in the standardized bias coefficient as a result of the matching process. A figure greater than 0% and less than 200%
represents reduced bias.
2 Indicates if the covariate was excluded in the Propensity Score Model logistic regression.
3 An asterisk (*) indicates that the averages for the matched control group and treatment group are statistically equivalent.
Notes:

APPENDIX B
Covariate
Age 27.695 15.569 18.484 15.569 68%
Female 0.576 0.430 0.410 0.430 114% *
White 0.727 0.529 0.563 0.529 83%
Black 0.239 0.452 0.411 0.452 82%
County: Adams 0.042 0.000 0.029 0.000 17% YES
County: Butler 0.300 0.000 0.354 0.000 -13% YES
County: Lawrence 0.074 0.000 0.073 0.000 1% YES
County: Lucas 0.471 1.000 0.455 1.000 -3% YES N/A
Medicaid Member Months 9.475 11.308 11.469 11.308 115%
MCP Member Months 7.156 8.629 8.149 8.629 66%
Dual Eligibility Member Months 0.282 0.115 0.174 0.115 57% *
Waiver Member Months 0.363 0.129 0.226 0.129 51%
ABD Member Months 1.005 2.126 2.784 2.126 149%
CFC Member Months 7.018 8.821 8.056 8.821 56%
Control Treatment Control Treatment Balanced3
Harbor (All Ages, All CMHC)
Summary of Covariate Averages Before and After Propensity Score Matching
Full Group Matched SamplesBias
Reduction1
Excluded
from PSM2

APPENDIX B
Covariate Control Treatment Control Treatment Balanced3
Harbor (All Ages, All CMHC)
Summary of Covariate Averages Before and After Propensity Score Matching
Full Group Matched SamplesBias
Reduction1
Excluded
from PSM2
# Mental Health Center Visits 1.069 19.560 15.644 19.560 86%
# ED Mental Health Visits 0.012 0.045 0.056 0.045 127% *
# IP Mental Health Visits 0.003 0.033 0.025 0.033 77% *
13 or More Mental Health Rx 0.031 0.115 0.134 0.115 117%
ADHD 0.032 0.292 0.328 0.292 110%
Acute bronchitis 0.056 0.038 0.046 0.038 51% *
Alcohol-related disorders 0.006 0.004 0.008 0.004 -117% YES
Anxiety Disorders 0.028 0.051 0.079 0.051 193%
Asthma 0.060 0.148 0.180 0.148 129%
Autism 0.003 0.019 0.024 0.019 120% *
Bipolar Disorder 0.014 0.043 0.047 0.043 110% *
Blindness and vision defects 0.150 0.284 0.329 0.284 130%
Cancer 0.014 0.006 0.008 0.006 71% *
Cardiac dysrhythmias 0.027 0.023 0.038 0.023 -237%

APPENDIX B
Covariate Control Treatment Control Treatment Balanced3
Harbor (All Ages, All CMHC)
Summary of Covariate Averages Before and After Propensity Score Matching
Full Group Matched SamplesBias
Reduction1
Excluded
from PSM2
Chronic obstructive pulmonary disease and
bronchiectasis0.059 0.035 0.056 0.035 13%
Conduct Disorder 0.011 0.213 0.234 0.213 107% *
Congestive heart failure; nonhypertensive 0.014 0.004 0.006 0.004 69% YES *
Coronary atherosclerosis and other heart
disease0.023 0.005 0.006 0.005 86% *
Cystic fibrosis 0.000 0.000 0.001 0.000 1888% YES *
Delirium, dementia, and amnestic and other
cognitive diseases0.010 0.004 0.007 0.004 42% *
Depression 0.047 0.177 0.236 0.177 135%
Developmental disorders 0.037 0.136 0.162 0.136 121%
Diabetes 0.061 0.037 0.063 0.037 -9%
Epilepsy; convulsions 0.019 0.031 0.043 0.031 194%
Esophageal disorders 0.027 0.020 0.031 0.020 -51%
Essential hypertension 0.083 0.040 0.065 0.040 37%
HIV infection 0.002 0.001 0.003 0.001 -137% YES *
Intracranial injury 0.006 0.010 0.013 0.010 165% *

APPENDIX B
Covariate Control Treatment Control Treatment Balanced3
Harbor (All Ages, All CMHC)
Summary of Covariate Averages Before and After Propensity Score Matching
Full Group Matched SamplesBias
Reduction1
Excluded
from PSM2
Mental Disorder Not Otherwise Specified
(NOS)0.005 0.009 0.014 0.009 200% *
Neoplasms of unspecified nature or uncertain
behavior0.035 0.053 0.069 0.053 176%
Obsessive-Compulsive Disorders 0.001 0.002 0.006 0.002 558% YES
Osteoarthritis 0.031 0.020 0.042 0.020 -83%
Other Developmental Disorder 0.003 0.081 0.077 0.081 96% *
Other nervous system disorders 0.062 0.072 0.117 0.072 468%
PTSD 0.005 0.019 0.031 0.019 154%
Pregnancy 0.040 0.011 0.016 0.011 76% *
Psychotic Disorder 0.015 0.059 0.079 0.059 133%
Spondylosis; intervertebral disc disorders;
other back0.100 0.075 0.134 0.075 -115%
Substance-related disorders 0.019 0.013 0.024 0.013 -63%
Thyroid disorders 0.021 0.016 0.030 0.016 -163%
1 Bias Reduction represents the reduction in the standardized bias coefficient as a result of the matching process. A figure greater than 0% and less than 200%
represents reduced bias.
2 Indicates if the covariate was excluded in the Propensity Score Model logistic regression.
3 An asterisk (*) indicates that the averages for the matched control group and treatment group are statistically equivalent.
Notes:

APPENDIX B
Covariate
Age 9.427 10.651 10.841 10.642 117% *
Female 0.498 0.377 0.329 0.378 142%
White 0.710 0.534 0.579 0.535 76%
Black 0.256 0.449 0.400 0.448 76%
County: Adams 0.042 0.000 0.027 0.000 20% YES
County: Butler 0.341 0.000 0.371 0.000 -7% YES
County: Lawrence 0.071 0.000 0.067 0.000 2% YES
County: Lucas 0.450 1.000 0.459 1.000 2% YES N/A
Medicaid Member Months 10.659 11.423 11.309 11.421 81% *
MCP Member Months 9.662 9.039 8.546 9.054 176%
Dual Eligibility Member Months 0.003 0.012 0.018 0.012 137% *
Waiver Member Months 0.029 0.002 0.019 0.002 20% *
ABD Member Months 0.332 1.569 1.693 1.551 109% *
CFC Member Months 10.318 9.843 9.597 9.860 152% *
Control Treatment Control Treatment Balanced3
Harbor (Under 18, All CMHC)
Summary of Covariate Averages Before and After Propensity Score Matching
Full Group Matched SamplesBias
Reduction1
Excluded
from PSM2

APPENDIX B
Covariate Control Treatment Control Treatment Balanced3
Harbor (Under 18, All CMHC)
Summary of Covariate Averages Before and After Propensity Score Matching
Full Group Matched SamplesBias
Reduction1
Excluded
from PSM2
# Mental Health Center Visits 1.105 18.331 15.487 17.966 90%
# ED Mental Health Visits 0.004 0.026 0.033 0.026 124% *
# IP Mental Health Visits 0.002 0.027 0.020 0.027 77% *
13 or More Mental Health Rx 0.008 0.060 0.066 0.061 108% *
ADHD 0.060 0.351 0.411 0.349 117%
Acute bronchitis 0.056 0.030 0.035 0.030 78% *
Alcohol-related disorders 0.001 0.003 0.006 0.003 163% YES *
Anxiety Disorders 0.008 0.044 0.056 0.044 123% *
Asthma 0.075 0.151 0.161 0.151 111% *
Autism 0.003 0.021 0.026 0.021 121% *
Bipolar Disorder 0.003 0.009 0.016 0.009 190%
Blindness and vision defects 0.156 0.286 0.308 0.286 115% *
Cancer 0.001 0.001 0.001 0.001 100% YES *
Cardiac dysrhythmias 0.005 0.012 0.021 0.012 196%

APPENDIX B
Covariate Control Treatment Control Treatment Balanced3
Harbor (Under 18, All CMHC)
Summary of Covariate Averages Before and After Propensity Score Matching
Full Group Matched SamplesBias
Reduction1
Excluded
from PSM2
Chronic obstructive pulmonary disease and
bronchiectasis0.024 0.017 0.025 0.017 -15% *
Conduct Disorder 0.021 0.256 0.275 0.255 106% *
Congestive heart failure; nonhypertensive 0.000 0.000 0.000 0.000 N/A YES N/A
Coronary atherosclerosis and other heart
disease0.000 0.000 0.000 0.000 -49% YES *
Cystic fibrosis 0.001 0.000 0.001 0.000 -1344% YES *
Delirium, dementia, and amnestic and other
cognitive diseases0.001 0.002 0.003 0.002 149% YES *
Depression 0.016 0.095 0.107 0.095 112% *
Developmental disorders 0.050 0.147 0.177 0.146 125%
Diabetes 0.005 0.010 0.018 0.010 206%
Epilepsy; convulsions 0.012 0.021 0.035 0.021 222%
Esophageal disorders 0.009 0.008 0.013 0.008 -295% *
Essential hypertension 0.003 0.008 0.015 0.008 190%
HIV infection 0.000 0.000 0.000 0.000 N/A YES N/A
Intracranial injury 0.005 0.008 0.010 0.008 157% *

APPENDIX B
Covariate Control Treatment Control Treatment Balanced3
Harbor (Under 18, All CMHC)
Summary of Covariate Averages Before and After Propensity Score Matching
Full Group Matched SamplesBias
Reduction1
Excluded
from PSM2
Mental Disorder Not Otherwise Specified
(NOS)0.002 0.003 0.016 0.003 1276% YES
Neoplasms of unspecified nature or uncertain
behavior0.012 0.043 0.061 0.043 144%
Obsessive-Compulsive Disorders 0.001 0.001 0.002 0.001 141% YES *
Osteoarthritis 0.000 0.000 0.001 0.000 -53% YES *
Other Developmental Disorder 0.005 0.098 0.086 0.098 91% *
Other nervous system disorders 0.025 0.054 0.082 0.054 175%
PTSD 0.004 0.018 0.025 0.018 133% *
Pregnancy 0.003 0.001 0.002 0.001 54% YES *
Psychotic Disorder 0.002 0.009 0.010 0.009 110% *
Spondylosis; intervertebral disc disorders;
other back0.018 0.027 0.040 0.027 219%
Substance-related disorders 0.004 0.004 0.025 0.004 2037% YES
Thyroid disorders 0.003 0.006 0.006 0.006 100% *
1 Bias Reduction represents the reduction in the standardized bias coefficient as a result of the matching process. A figure greater than 0% and less than 200%
represents reduced bias.
2 Indicates if the covariate was excluded in the Propensity Score Model logistic regression.
3 An asterisk (*) indicates that the averages for the matched control group and treatment group are statistically equivalent.
Notes:

APPENDIX B
Covariate
Age 42.341 35.460 36.252 35.460 87% *
Female 0.639 0.646 0.682 0.646 627% *
White 0.742 0.506 0.530 0.506 90% *
Black 0.225 0.462 0.428 0.462 87% *
County: Adams 0.042 0.000 0.018 0.000 35% YES
County: Butler 0.268 0.000 0.338 0.000 -18% YES
County: Lawrence 0.076 0.000 0.058 0.000 14% YES
County: Lucas 0.488 1.000 0.516 1.000 5% YES
Medicaid Member Months 8.527 10.844 11.184 10.844 123%
MCP Member Months 5.146 6.974 6.894 6.974 96% *
Dual Eligibility Member Months 0.506 0.528 0.628 0.528 523% *
Waiver Member Months 0.631 0.644 0.668 0.644 277% *
ABD Member Months 1.545 4.380 4.784 4.380 112% *
CFC Member Months 4.371 4.688 4.462 4.688 29% *
Control Treatment Control Treatment Balanced3
Harbor (18 and Over, All CMHC)
Summary of Covariate Averages Before and After Propensity Score Matching
Full Group Matched SamplesBias
Reduction1
Excluded
from PSM2

APPENDIX B
Covariate Control Treatment Control Treatment Balanced3
Harbor (18 and Over, All CMHC)
Summary of Covariate Averages Before and After Propensity Score Matching
Full Group Matched SamplesBias
Reduction1
Excluded
from PSM2
# Mental Health Center Visits 1.040 24.530 20.154 24.530 88%
# ED Mental Health Visits 0.018 0.124 0.138 0.124 111% *
# IP Mental Health Visits 0.003 0.058 0.074 0.058 120% *
13 or More Mental Health Rx 0.048 0.336 0.342 0.336 102% *
ADHD 0.010 0.056 0.070 0.056 122% *
Acute bronchitis 0.055 0.072 0.066 0.072 67% *
Alcohol-related disorders 0.010 0.006 0.034 0.006 -379% YES
Anxiety Disorders 0.044 0.080 0.114 0.080 176% *
Asthma 0.048 0.136 0.156 0.136 118% *
Autism 0.002 0.012 0.016 0.012 128% YES *
Bipolar Disorder 0.023 0.182 0.220 0.182 117% *
Blindness and vision defects 0.146 0.274 0.254 0.274 86% *
Cancer 0.024 0.022 0.030 0.022 -347% *
Cardiac dysrhythmias 0.044 0.066 0.084 0.066 172% *

APPENDIX B
Covariate Control Treatment Control Treatment Balanced3
Harbor (18 and Over, All CMHC)
Summary of Covariate Averages Before and After Propensity Score Matching
Full Group Matched SamplesBias
Reduction1
Excluded
from PSM2
Chronic obstructive pulmonary disease and
bronchiectasis0.088 0.108 0.100 0.108 61% *
Conduct Disorder 0.003 0.038 0.020 0.038 58% *
Congestive heart failure; nonhypertensive 0.025 0.018 0.012 0.018 205% YES *
Coronary atherosclerosis and other heart
disease0.042 0.022 0.016 0.022 139% *
Cystic fibrosis 0.000 0.000 0.002 0.000 -200% YES *
Delirium, dementia, and amnestic and other
cognitive diseases0.017 0.012 0.014 0.012 55% YES *
Depression 0.072 0.506 0.570 0.506 112%
Developmental disorders 0.027 0.088 0.092 0.088 105% *
Diabetes 0.106 0.146 0.190 0.146 196% *
Epilepsy; convulsions 0.025 0.068 0.082 0.068 126% *
Esophageal disorders 0.041 0.068 0.076 0.068 126% *
Essential hypertension 0.147 0.168 0.196 0.168 226% *
HIV infection 0.003 0.004 0.008 0.004 333% YES *
Intracranial injury 0.007 0.018 0.012 0.018 52% YES *

APPENDIX B
Covariate Control Treatment Control Treatment Balanced3
Harbor (18 and Over, All CMHC)
Summary of Covariate Averages Before and After Propensity Score Matching
Full Group Matched SamplesBias
Reduction1
Excluded
from PSM2
Mental Disorder Not Otherwise Specified
(NOS)0.007 0.032 0.030 0.032 94% *
Neoplasms of unspecified nature or uncertain
behavior0.053 0.094 0.088 0.094 87% *
Obsessive-Compulsive Disorders 0.001 0.002 0.006 0.002 588% YES *
Osteoarthritis 0.055 0.100 0.118 0.100 134% *
Other Developmental Disorder 0.001 0.012 0.014 0.012 113% YES *
Other nervous system disorders 0.091 0.146 0.170 0.146 138% *
PTSD 0.005 0.024 0.022 0.024 91% *
Pregnancy 0.070 0.050 0.054 0.050 79% *
Psychotic Disorder 0.025 0.260 0.266 0.260 102% *
Spondylosis; intervertebral disc disorders;
other back0.166 0.266 0.298 0.266 129% *
Substance-related disorders 0.032 0.048 0.064 0.048 183% *
Thyroid disorders 0.035 0.056 0.062 0.056 125% *
1 Bias Reduction represents the reduction in the standardized bias coefficient as a result of the matching process. A figure greater than 0% and less than 200%
represents reduced bias.
2 Indicates if the covariate was excluded in the Propensity Score Model logistic regression.
3 An asterisk (*) indicates that the averages for the matched control group and treatment group are statistically equivalent.
Notes:

APPENDIX B
Covariate
Age 29.433 16.273 16.591 16.349 98% *
Female 0.566 0.428 0.431 0.431 100% *
White 0.773 0.540 0.539 0.547 103% *
Black 0.201 0.442 0.441 0.434 102% *
County: Adams 0.028 0.000 0.021 0.000 15% YES
County: Butler 0.394 0.000 0.369 0.000 5% YES
County: Lawrence 0.063 0.000 0.056 0.000 6% YES
County: Lucas 0.392 1.000 0.486 1.000 17% YES N/A
Medicaid Member Months 11.345 11.737 11.743 11.734 103% *
MCP Member Months 7.691 8.679 8.773 8.751 102% *
Dual Eligibility Member Months 0.418 0.147 0.153 0.149 98% *
Waiver Member Months 0.540 0.159 0.158 0.161 101% *
ABD Member Months 2.324 2.544 2.373 2.472 55% *
CFC Member Months 6.993 8.763 8.928 8.827 106% *
Control Treatment Control Treatment Balanced3
Harbor (All Ages, CMHC Experience)
Summary of Covariate Averages Before and After Propensity Score Matching
Full Group Matched SamplesBias
Reduction1
Excluded
from PSM2

APPENDIX B
Covariate Control Treatment Control Treatment Balanced3
Harbor (All Ages, CMHC Experience)
Summary of Covariate Averages Before and After Propensity Score Matching
Full Group Matched SamplesBias
Reduction1
Excluded
from PSM2
# Mental Health Center Visits 15.681 26.337 25.920 25.622 102% *
# ED Mental Health Visits 0.095 0.060 0.062 0.061 94% *
# IP Mental Health Visits 0.029 0.044 0.037 0.043 64% *
13 or More Mental Health Rx 0.167 0.151 0.153 0.151 93% *
ADHD 0.164 0.373 0.376 0.372 102% *
Acute bronchitis 0.080 0.040 0.047 0.040 80% *
Alcohol-related disorders 0.027 0.005 0.009 0.005 74% YES *
Anxiety Disorders 0.141 0.065 0.060 0.065 109% *
Asthma 0.090 0.153 0.150 0.149 102% *
Autism 0.009 0.023 0.022 0.023 91% *
Bipolar Disorder 0.141 0.058 0.072 0.058 80% *
Blindness and vision defects 0.249 0.305 0.310 0.306 107% *
Cancer 0.019 0.006 0.006 0.006 100% *
Cardiac dysrhythmias 0.046 0.028 0.028 0.027 97% *

APPENDIX B
Covariate Control Treatment Control Treatment Balanced3
Harbor (All Ages, CMHC Experience)
Summary of Covariate Averages Before and After Propensity Score Matching
Full Group Matched SamplesBias
Reduction1
Excluded
from PSM2
Chronic obstructive pulmonary disease and
bronchiectasis0.099 0.041 0.047 0.041 87% *
Conduct Disorder 0.113 0.285 0.290 0.282 104% *
Congestive heart failure; nonhypertensive 0.017 0.004 0.008 0.004 57% YES *
Coronary atherosclerosis and other heart
disease0.026 0.006 0.008 0.006 84% *
Cystic fibrosis 0.001 0.000 0.000 0.000 N/A YES N/A
Delirium, dementia, and amnestic and other
cognitive diseases0.016 0.005 0.007 0.005 75% YES *
Depression 0.385 0.231 0.230 0.233 102% *
Developmental disorders 0.089 0.162 0.163 0.157 108% *
Diabetes 0.101 0.043 0.045 0.043 96% *
Epilepsy; convulsions 0.041 0.035 0.040 0.035 18% *
Esophageal disorders 0.053 0.023 0.027 0.023 85% *
Essential hypertension 0.135 0.044 0.053 0.045 88% *
HIV infection 0.002 0.001 0.000 0.001 246% YES *
Intracranial injury 0.013 0.011 0.010 0.011 188% *

APPENDIX B
Covariate Control Treatment Control Treatment Balanced3
Harbor (All Ages, CMHC Experience)
Summary of Covariate Averages Before and After Propensity Score Matching
Full Group Matched SamplesBias
Reduction1
Excluded
from PSM2
Mental Disorder Not Otherwise Specified
(NOS)0.046 0.012 0.008 0.012 121% *
Neoplasms of unspecified nature or uncertain
behavior0.074 0.064 0.059 0.063 144% *
Obsessive-Compulsive Disorders 0.005 0.002 0.002 0.002 100% YES *
Osteoarthritis 0.052 0.025 0.028 0.025 86% *
Other Developmental Disorder 0.031 0.109 0.107 0.107 100% *
Other nervous system disorders 0.133 0.085 0.082 0.085 108% *
PTSD 0.058 0.026 0.028 0.026 92% *
Pregnancy 0.048 0.010 0.012 0.010 91% *
Psychotic Disorder 0.135 0.078 0.084 0.080 91% *
Spondylosis; intervertebral disc disorders;
other back0.205 0.085 0.090 0.086 96% *
Substance-related disorders 0.112 0.017 0.016 0.017 103% *
Thyroid disorders 0.042 0.018 0.021 0.018 89% *
1 Bias Reduction represents the reduction in the standardized bias coefficient as a result of the matching process. A figure greater than 0% and less than 200%
represents reduced bias.
2 Indicates if the covariate was excluded in the Propensity Score Model logistic regression.
3 An asterisk (*) indicates that the averages for the matched control group and treatment group are statistically equivalent.
Notes:

APPENDIX B
Covariate
Age 27.568 13.538 16.740 13.538 68%
Female 0.577 0.438 0.379 0.438 142%
White 0.724 0.496 0.507 0.496 96% *
Black 0.241 0.481 0.453 0.481 89% *
County: Adams 0.043 0.000 0.037 0.000 7% YES
County: Butler 0.293 0.000 0.296 0.000 -1% YES
County: Lawrence 0.075 0.000 0.065 0.000 7% YES
County: Lucas 0.477 1.000 0.516 1.000 8% YES
Medicaid Member Months 9.339 10.071 9.720 10.071 47% *
MCP Member Months 7.117 8.487 7.059 8.487 -11%
Dual Eligibility Member Months 0.272 0.022 0.017 0.022 111% *
Waiver Member Months 0.350 0.043 0.139 0.043 53% *
ABD Member Months 0.909 0.921 1.602 0.921 4816%
CFC Member Months 7.019 8.986 7.787 8.986 34%
Control Treatment Control Treatment Balanced3
Harbor (All Ages, No CMHC Experience)
Summary of Covariate Averages Before and After Propensity Score Matching
Full Group Matched SamplesBias
Reduction1
Excluded
from PSM2

APPENDIX B
Covariate Control Treatment Control Treatment Balanced3
Harbor (All Ages, No CMHC Experience)
Summary of Covariate Averages Before and After Propensity Score Matching
Full Group Matched SamplesBias
Reduction1
Excluded
from PSM2
# Mental Health Center Visits 0.000 0.000 0.000 0.000 N/A YES N/A
# ED Mental Health Visits 0.006 0.003 0.008 0.003 -95% *
# IP Mental Health Visits 0.001 0.002 0.003 0.002 278% *
13 or More Mental Health Rx 0.021 0.012 0.025 0.012 -41% YES *
ADHD 0.023 0.059 0.074 0.059 134% *
Acute bronchitis 0.054 0.035 0.052 0.035 7% *
Alcohol-related disorders 0.004 0.002 0.006 0.002 -49% YES *
Anxiety Disorders 0.020 0.011 0.009 0.011 122% YES *
Asthma 0.057 0.134 0.194 0.134 162%
Autism 0.002 0.006 0.006 0.006 100% YES *
Bipolar Disorder 0.005 0.002 0.008 0.002 -59% YES *
Blindness and vision defects 0.143 0.222 0.291 0.222 177%
Cancer 0.013 0.005 0.008 0.005 58% YES *
Cardiac dysrhythmias 0.025 0.006 0.022 0.006 14% YES

APPENDIX B
Covariate Control Treatment Control Treatment Balanced3
Harbor (All Ages, No CMHC Experience)
Summary of Covariate Averages Before and After Propensity Score Matching
Full Group Matched SamplesBias
Reduction1
Excluded
from PSM2
Chronic obstructive pulmonary disease and
bronchiectasis0.056 0.020 0.046 0.020 23%
Conduct Disorder 0.003 0.006 0.012 0.006 240% YES *
Congestive heart failure; nonhypertensive 0.014 0.003 0.011 0.003 20% YES *
Coronary atherosclerosis and other heart
disease0.023 0.002 0.009 0.002 46% YES *
Cystic fibrosis 0.000 0.002 0.000 0.002 -44% YES *
Delirium, dementia, and amnestic and other
cognitive diseases0.009 0.003 0.002 0.003 141% YES *
Depression 0.022 0.020 0.029 0.020 -274% *
Developmental disorders 0.033 0.060 0.080 0.060 162% *
Diabetes 0.058 0.020 0.052 0.020 11%
Epilepsy; convulsions 0.018 0.018 0.040 0.018 2341%
Esophageal disorders 0.025 0.012 0.026 0.012 -7% YES *
Essential hypertension 0.079 0.026 0.074 0.026 7%
HIV infection 0.002 0.000 0.002 0.000 -1% YES *
Intracranial injury 0.005 0.006 0.012 0.006 689% YES *

APPENDIX B
Covariate Control Treatment Control Treatment Balanced3
Harbor (All Ages, No CMHC Experience)
Summary of Covariate Averages Before and After Propensity Score Matching
Full Group Matched SamplesBias
Reduction1
Excluded
from PSM2
Mental Disorder Not Otherwise Specified
(NOS)0.002 0.000 0.003 0.000 -34% YES *
Neoplasms of unspecified nature or uncertain
behavior0.032 0.022 0.045 0.022 -101%
Obsessive-Compulsive Disorders 0.001 0.000 0.000 0.000 N/A YES N/A
Osteoarthritis 0.029 0.006 0.011 0.006 71% YES *
Other Developmental Disorder 0.001 0.000 0.000 0.000 N/A YES N/A
Other nervous system disorders 0.057 0.035 0.072 0.035 -63%
PTSD 0.001 0.002 0.000 0.002 -312% YES *
Pregnancy 0.040 0.015 0.046 0.015 -20% YES
Psychotic Disorder 0.006 0.003 0.008 0.003 -38% YES *
Spondylosis; intervertebral disc disorders;
other back0.092 0.043 0.105 0.043 -21%
Substance-related disorders 0.012 0.002 0.011 0.002 10% YES
Thyroid disorders 0.019 0.011 0.014 0.011 61% YES *
1 Bias Reduction represents the reduction in the standardized bias coefficient as a result of the matching process. A figure greater than 0% and less than 200%
represents reduced bias.
2 Indicates if the covariate was excluded in the Propensity Score Model logistic regression.
3 An asterisk (*) indicates that the averages for the matched control group and treatment group are statistically equivalent.
Notes:

APPENDIX B
Covariate
Age 27.695 34.881 37.928 34.881 144%
Female 0.576 0.574 0.581 0.574 -277% *
White 0.727 0.964 0.971 0.964 106% *
Black 0.239 0.027 0.023 0.027 104% *
County: Adams 0.042 0.165 0.151 0.165 91% *
County: Butler 0.300 0.000 0.251 0.000 12% YES
County: Lawrence 0.074 0.308 0.313 0.308 102% *
County: Lucas 0.471 0.000 0.180 0.000 50% YES
Medicaid Member Months 9.475 11.116 11.409 11.116 128%
MCP Member Months 7.156 7.846 7.497 7.846 49%
Dual Eligibility Member Months 0.282 0.337 0.388 0.337 188% *
Waiver Member Months 0.363 0.816 0.932 0.816 121% *
ABD Member Months 1.005 4.599 4.925 4.599 107% *
CFC Member Months 7.018 4.794 4.296 4.794 123%
Control Treatment Control Treatment Balanced3
Shawnee (All Ages, All CMHC)
Summary of Covariate Averages Before and After Propensity Score Matching
Full Group Matched SamplesBias
Reduction1
Excluded
from PSM2

APPENDIX B
Covariate Control Treatment Control Treatment Balanced3
Shawnee (All Ages, All CMHC)
Summary of Covariate Averages Before and After Propensity Score Matching
Full Group Matched SamplesBias
Reduction1
Excluded
from PSM2
# Mental Health Center Visits 1.069 16.468 13.751 16.468 90%
# ED Mental Health Visits 0.012 0.074 0.081 0.074 109% *
# IP Mental Health Visits 0.003 0.014 0.015 0.014 106% *
13 or More Mental Health Rx 0.031 0.326 0.328 0.326 101% *
ADHD 0.032 0.156 0.159 0.156 102% *
Acute bronchitis 0.056 0.149 0.163 0.149 112% *
Alcohol-related disorders 0.006 0.012 0.017 0.012 159% *
Anxiety Disorders 0.028 0.153 0.172 0.153 112% *
Asthma 0.060 0.119 0.131 0.119 118% *
Autism 0.003 0.005 0.004 0.005 69% *
Bipolar Disorder 0.014 0.132 0.132 0.132 100% *
Blindness and vision defects 0.150 0.285 0.305 0.285 113% *
Cancer 0.014 0.022 0.030 0.022 175% *
Cardiac dysrhythmias 0.027 0.061 0.077 0.061 140%

APPENDIX B
Covariate Control Treatment Control Treatment Balanced3
Shawnee (All Ages, All CMHC)
Summary of Covariate Averages Before and After Propensity Score Matching
Full Group Matched SamplesBias
Reduction1
Excluded
from PSM2
Chronic obstructive pulmonary disease and
bronchiectasis0.059 0.208 0.233 0.208 113% *
Conduct Disorder 0.011 0.082 0.087 0.082 105% *
Congestive heart failure; nonhypertensive 0.014 0.027 0.026 0.027 90% *
Coronary atherosclerosis and other heart
disease0.023 0.065 0.069 0.065 108% *
Cystic fibrosis 0.000 0.000 0.000 0.000 N/A YES N/A
Delirium, dementia, and amnestic and other
cognitive diseases0.010 0.014 0.014 0.014 111% *
Depression 0.047 0.339 0.358 0.339 105% *
Developmental disorders 0.037 0.052 0.063 0.052 172% *
Diabetes 0.061 0.171 0.195 0.171 118%
Epilepsy; convulsions 0.019 0.048 0.054 0.048 117% *
Esophageal disorders 0.027 0.090 0.106 0.090 120% *
Essential hypertension 0.083 0.226 0.265 0.226 122%
HIV infection 0.002 0.001 0.003 0.001 -167% YES *
Intracranial injury 0.006 0.013 0.016 0.013 132% *

APPENDIX B
Covariate Control Treatment Control Treatment Balanced3
Shawnee (All Ages, All CMHC)
Summary of Covariate Averages Before and After Propensity Score Matching
Full Group Matched SamplesBias
Reduction1
Excluded
from PSM2
Mental Disorder Not Otherwise Specified
(NOS)0.005 0.041 0.038 0.041 94% *
Neoplasms of unspecified nature or uncertain
behavior0.035 0.111 0.129 0.111 119% *
Obsessive-Compulsive Disorders 0.001 0.019 0.018 0.019 96% *
Osteoarthritis 0.031 0.088 0.103 0.088 120% *
Other Developmental Disorder 0.003 0.006 0.005 0.006 75% *
Other nervous system disorders 0.062 0.133 0.159 0.133 130%
PTSD 0.005 0.031 0.035 0.031 111% *
Pregnancy 0.040 0.023 0.025 0.023 87% *
Psychotic Disorder 0.015 0.174 0.158 0.174 93% *
Spondylosis; intervertebral disc disorders;
other back0.100 0.282 0.318 0.282 117%
Substance-related disorders 0.019 0.063 0.063 0.063 101% *
Thyroid disorders 0.021 0.082 0.081 0.082 99% *
1 Bias Reduction represents the reduction in the standardized bias coefficient as a result of the matching process. A figure greater than 0% and less than 200%
represents reduced bias.
2 Indicates if the covariate was excluded in the Propensity Score Model logistic regression.
3 An asterisk (*) indicates that the averages for the matched control group and treatment group are statistically equivalent.
Notes:

APPENDIX B
Covariate
Age 9.427 12.297 12.635 12.288 113% *
Female 0.498 0.409 0.414 0.409 95% *
White 0.710 0.940 0.930 0.940 94% *
Black 0.256 0.041 0.043 0.041 99% *
County: Adams 0.042 0.096 0.125 0.097 142% *
County: Butler 0.341 0.000 0.326 0.000 3% YES
County: Lawrence 0.071 0.315 0.242 0.314 76%
County: Lucas 0.450 0.000 0.217 0.000 42% YES
Medicaid Member Months 10.659 11.421 11.376 11.418 92% *
MCP Member Months 9.662 9.344 8.680 9.345 297%
Dual Eligibility Member Months 0.003 0.002 0.005 0.002 -121% *
Waiver Member Months 0.029 0.019 0.052 0.019 -182% *
ABD Member Months 0.332 1.530 1.978 1.523 128%
CFC Member Months 10.318 9.890 9.393 9.894 207%
Control Treatment Control Treatment Balanced3
Shawnee (Under 18, All CMHC)
Summary of Covariate Averages Before and After Propensity Score Matching
Full Group Matched SamplesBias
Reduction1
Excluded
from PSM2

APPENDIX B
Covariate Control Treatment Control Treatment Balanced3
Shawnee (Under 18, All CMHC)
Summary of Covariate Averages Before and After Propensity Score Matching
Full Group Matched SamplesBias
Reduction1
Excluded
from PSM2
# Mental Health Center Visits 1.105 15.319 14.157 15.225 96% *
# ED Mental Health Visits 0.004 0.032 0.032 0.032 100% *
# IP Mental Health Visits 0.002 0.011 0.011 0.010 115% *
13 or More Mental Health Rx 0.008 0.090 0.065 0.089 77% *
ADHD 0.060 0.453 0.474 0.450 105% *
Acute bronchitis 0.056 0.132 0.154 0.132 124% *
Alcohol-related disorders 0.001 0.006 0.003 0.006 50% YES *
Anxiety Disorders 0.008 0.066 0.073 0.065 110% *
Asthma 0.075 0.123 0.122 0.122 100% *
Autism 0.003 0.016 0.014 0.014 100% YES *
Bipolar Disorder 0.003 0.052 0.038 0.051 80% *
Blindness and vision defects 0.156 0.304 0.358 0.304 132%
Cancer 0.001 0.000 0.000 0.000 N/A YES N/A
Cardiac dysrhythmias 0.005 0.025 0.022 0.024 94% *

APPENDIX B
Covariate Control Treatment Control Treatment Balanced3
Shawnee (Under 18, All CMHC)
Summary of Covariate Averages Before and After Propensity Score Matching
Full Group Matched SamplesBias
Reduction1
Excluded
from PSM2
Chronic obstructive pulmonary disease and
bronchiectasis0.024 0.069 0.067 0.068 97% *
Conduct Disorder 0.021 0.241 0.258 0.239 106% *
Congestive heart failure; nonhypertensive 0.000 0.000 0.000 0.000 N/A YES N/A
Coronary atherosclerosis and other heart
disease0.000 0.000 0.002 0.000 -260% YES *
Cystic fibrosis 0.001 0.000 0.000 0.000 N/A YES N/A
Delirium, dementia, and amnestic and other
cognitive diseases0.001 0.006 0.006 0.006 100% YES *
Depression 0.016 0.180 0.181 0.176 102% *
Developmental disorders 0.050 0.117 0.151 0.116 142% *
Diabetes 0.005 0.014 0.016 0.014 114% YES *
Epilepsy; convulsions 0.012 0.041 0.029 0.040 66% *
Esophageal disorders 0.009 0.021 0.029 0.019 168% *
Essential hypertension 0.003 0.011 0.010 0.010 100% YES *
HIV infection 0.000 0.000 0.000 0.000 N/A YES N/A
Intracranial injury 0.005 0.008 0.019 0.008 362% YES *

APPENDIX B
Covariate Control Treatment Control Treatment Balanced3
Shawnee (Under 18, All CMHC)
Summary of Covariate Averages Before and After Propensity Score Matching
Full Group Matched SamplesBias
Reduction1
Excluded
from PSM2
Mental Disorder Not Otherwise Specified
(NOS)0.002 0.043 0.057 0.041 127% *
Neoplasms of unspecified nature or uncertain
behavior0.012 0.057 0.062 0.057 108% *
Obsessive-Compulsive Disorders 0.001 0.046 0.017 0.041 54%
Osteoarthritis 0.000 0.000 0.000 0.000 N/A YES N/A
Other Developmental Disorder 0.005 0.016 0.030 0.014 205% YES *
Other nervous system disorders 0.025 0.033 0.041 0.032 210% *
PTSD 0.004 0.014 0.029 0.014 195% YES *
Pregnancy 0.003 0.008 0.006 0.008 74% YES *
Psychotic Disorder 0.002 0.024 0.021 0.022 94% *
Spondylosis; intervertebral disc disorders;
other back0.018 0.058 0.079 0.059 138% *
Substance-related disorders 0.004 0.030 0.029 0.030 95% *
Thyroid disorders 0.003 0.017 0.024 0.017 132% *
1 Bias Reduction represents the reduction in the standardized bias coefficient as a result of the matching process. A figure greater than 0% and less than 200%
represents reduced bias.
2 Indicates if the covariate was excluded in the Propensity Score Model logistic regression.
3 An asterisk (*) indicates that the averages for the matched control group and treatment group are statistically equivalent.
Notes:

APPENDIX B
Covariate
Age 42.341 45.000 46.008 45.000 142% *
Female 0.639 0.649 0.649 0.649 100% *
White 0.742 0.975 0.980 0.975 105% *
Black 0.225 0.021 0.016 0.021 106% *
County: Adams 0.042 0.196 0.186 0.196 95% *
County: Butler 0.268 0.001 0.254 0.001 3% YES
County: Lawrence 0.076 0.305 0.307 0.305 101% *
County: Lucas 0.488 0.000 0.149 0.000 57% YES
Medicaid Member Months 8.527 10.979 11.433 10.979 130%
MCP Member Months 5.146 7.175 7.434 7.175 113% *
Dual Eligibility Member Months 0.506 0.487 0.482 0.487 127% *
Waiver Member Months 0.631 1.174 1.149 1.174 96% *
ABD Member Months 1.545 5.974 6.189 5.974 104% *
CFC Member Months 4.371 2.510 2.618 2.510 94% *
Control Treatment Control Treatment Balanced3
Shawnee (18 and Over, All CMHC)
Summary of Covariate Averages Before and After Propensity Score Matching
Full Group Matched SamplesBias
Reduction1
Excluded
from PSM2
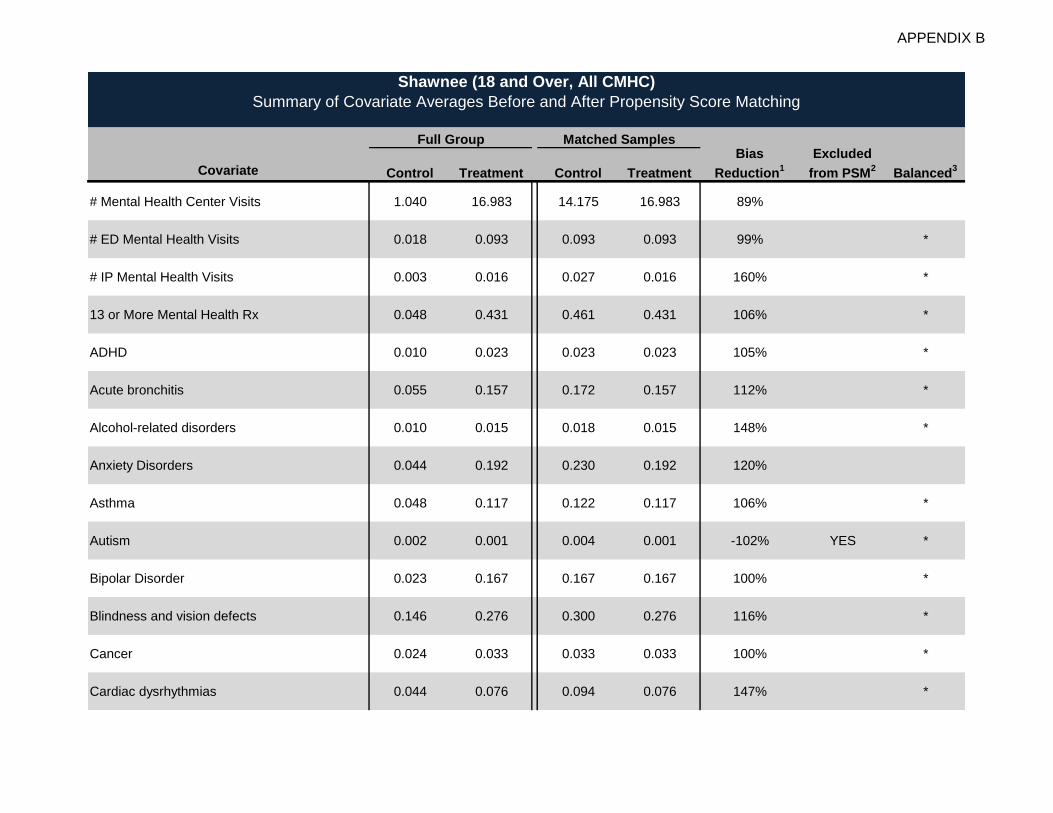
APPENDIX B
Covariate Control Treatment Control Treatment Balanced3
Shawnee (18 and Over, All CMHC)
Summary of Covariate Averages Before and After Propensity Score Matching
Full Group Matched SamplesBias
Reduction1
Excluded
from PSM2
# Mental Health Center Visits 1.040 16.983 14.175 16.983 89%
# ED Mental Health Visits 0.018 0.093 0.093 0.093 99% *
# IP Mental Health Visits 0.003 0.016 0.027 0.016 160% *
13 or More Mental Health Rx 0.048 0.431 0.461 0.431 106% *
ADHD 0.010 0.023 0.023 0.023 105% *
Acute bronchitis 0.055 0.157 0.172 0.157 112% *
Alcohol-related disorders 0.010 0.015 0.018 0.015 148% *
Anxiety Disorders 0.044 0.192 0.230 0.192 120%
Asthma 0.048 0.117 0.122 0.117 106% *
Autism 0.002 0.001 0.004 0.001 -102% YES *
Bipolar Disorder 0.023 0.167 0.167 0.167 100% *
Blindness and vision defects 0.146 0.276 0.300 0.276 116% *
Cancer 0.024 0.033 0.033 0.033 100% *
Cardiac dysrhythmias 0.044 0.076 0.094 0.076 147% *

APPENDIX B
Covariate Control Treatment Control Treatment Balanced3
Shawnee (18 and Over, All CMHC)
Summary of Covariate Averages Before and After Propensity Score Matching
Full Group Matched SamplesBias
Reduction1
Excluded
from PSM2
Chronic obstructive pulmonary disease and
bronchiectasis0.088 0.271 0.278 0.271 104% *
Conduct Disorder 0.003 0.011 0.011 0.011 100% *
Congestive heart failure; nonhypertensive 0.025 0.040 0.048 0.040 149% *
Coronary atherosclerosis and other heart
disease0.042 0.094 0.090 0.094 94% *
Cystic fibrosis 0.000 0.000 0.001 0.000 -78% YES *
Delirium, dementia, and amnestic and other
cognitive diseases0.017 0.017 0.020 0.017 1464% *
Depression 0.072 0.411 0.433 0.411 105% *
Developmental disorders 0.027 0.023 0.020 0.023 171% *
Diabetes 0.106 0.241 0.249 0.241 105% *
Epilepsy; convulsions 0.025 0.052 0.059 0.052 124% *
Esophageal disorders 0.041 0.121 0.141 0.121 121% *
Essential hypertension 0.147 0.323 0.349 0.323 113% *
HIV infection 0.003 0.001 0.002 0.001 41% YES *
Intracranial injury 0.007 0.016 0.017 0.016 113% *

APPENDIX B
Covariate Control Treatment Control Treatment Balanced3
Shawnee (18 and Over, All CMHC)
Summary of Covariate Averages Before and After Propensity Score Matching
Full Group Matched SamplesBias
Reduction1
Excluded
from PSM2
Mental Disorder Not Otherwise Specified
(NOS)0.007 0.040 0.042 0.040 105% *
Neoplasms of unspecified nature or uncertain
behavior0.053 0.136 0.151 0.136 115% *
Obsessive-Compulsive Disorders 0.001 0.007 0.003 0.007 30% YES *
Osteoarthritis 0.055 0.128 0.129 0.128 101% *
Other Developmental Disorder 0.001 0.002 0.004 0.002 232% YES *
Other nervous system disorders 0.091 0.178 0.175 0.178 96% *
PTSD 0.005 0.038 0.047 0.038 119% *
Pregnancy 0.070 0.030 0.023 0.030 126% *
Psychotic Disorder 0.025 0.241 0.224 0.241 94% *
Spondylosis; intervertebral disc disorders;
other back0.166 0.382 0.413 0.382 113% *
Substance-related disorders 0.032 0.078 0.091 0.078 124% *
Thyroid disorders 0.035 0.110 0.118 0.110 108% *
1 Bias Reduction represents the reduction in the standardized bias coefficient as a result of the matching process. A figure greater than 0% and less than 200%
represents reduced bias.
2 Indicates if the covariate was excluded in the Propensity Score Model logistic regression.
3 An asterisk (*) indicates that the averages for the matched control group and treatment group are statistically equivalent.
Notes:

APPENDIX B
Covariate
Age 29.433 36.026 34.677 35.232 92% *
Female 0.566 0.575 0.571 0.575 57% *
White 0.773 0.966 0.962 0.963 99% *
Black 0.201 0.027 0.031 0.029 98% *
County: Adams 0.028 0.172 0.149 0.149 100% *
County: Butler 0.394 0.001 0.299 0.001 19% YES
County: Lawrence 0.063 0.293 0.272 0.270 101% *
County: Lucas 0.392 0.000 0.177 0.000 42% YES
Medicaid Member Months 11.345 11.663 11.633 11.646 95% *
MCP Member Months 7.691 8.076 8.007 7.999 102% *
Dual Eligibility Member Months 0.418 0.354 0.334 0.369 157% *
Waiver Member Months 0.540 0.919 0.794 0.883 78% *
ABD Member Months 2.324 5.081 4.743 4.663 103% *
CFC Member Months 6.993 4.608 4.877 4.922 102% *
Control Treatment Control Treatment Balanced3
Shawnee (All Ages, CMHC Experience)
Summary of Covariate Averages Before and After Propensity Score Matching
Full Group Matched SamplesBias
Reduction1
Excluded
from PSM2

APPENDIX B
Covariate Control Treatment Control Treatment Balanced3
Shawnee (All Ages, CMHC Experience)
Summary of Covariate Averages Before and After Propensity Score Matching
Full Group Matched SamplesBias
Reduction1
Excluded
from PSM2
# Mental Health Center Visits 15.681 20.500 20.024 19.970 101% *
# ED Mental Health Visits 0.095 0.086 0.082 0.089 189% *
# IP Mental Health Visits 0.029 0.016 0.018 0.016 87% *
13 or More Mental Health Rx 0.167 0.371 0.347 0.347 100% *
ADHD 0.164 0.180 0.203 0.187 201% *
Acute bronchitis 0.080 0.156 0.136 0.149 84% *
Alcohol-related disorders 0.027 0.013 0.014 0.015 106% *
Anxiety Disorders 0.141 0.171 0.181 0.173 123% *
Asthma 0.090 0.129 0.109 0.118 78% *
Autism 0.009 0.005 0.007 0.005 45% YES *
Bipolar Disorder 0.141 0.158 0.171 0.159 166% *
Blindness and vision defects 0.249 0.298 0.297 0.301 94% *
Cancer 0.019 0.024 0.025 0.024 111% *
Cardiac dysrhythmias 0.046 0.062 0.055 0.060 71% *

APPENDIX B
Covariate Control Treatment Control Treatment Balanced3
Shawnee (All Ages, CMHC Experience)
Summary of Covariate Averages Before and After Propensity Score Matching
Full Group Matched SamplesBias
Reduction1
Excluded
from PSM2
Chronic obstructive pulmonary disease and
bronchiectasis0.099 0.224 0.203 0.209 96% *
Conduct Disorder 0.113 0.100 0.103 0.106 119% *
Congestive heart failure; nonhypertensive 0.017 0.027 0.026 0.026 100% *
Coronary atherosclerosis and other heart
disease0.026 0.073 0.065 0.070 92% *
Cystic fibrosis 0.001 0.000 0.001 0.000 -14% YES *
Delirium, dementia, and amnestic and other
cognitive diseases0.016 0.015 0.009 0.015 618% *
Depression 0.385 0.397 0.392 0.401 33% *
Developmental disorders 0.089 0.055 0.060 0.057 92% *
Diabetes 0.101 0.190 0.166 0.177 88% *
Epilepsy; convulsions 0.041 0.055 0.055 0.055 105% *
Esophageal disorders 0.053 0.100 0.093 0.097 92% *
Essential hypertension 0.135 0.245 0.231 0.239 93% *
HIV infection 0.002 0.001 0.006 0.001 -232% YES
Intracranial injury 0.013 0.013 0.016 0.014 1204% *

APPENDIX B
Covariate Control Treatment Control Treatment Balanced3
Shawnee (All Ages, CMHC Experience)
Summary of Covariate Averages Before and After Propensity Score Matching
Full Group Matched SamplesBias
Reduction1
Excluded
from PSM2
Mental Disorder Not Otherwise Specified
(NOS)0.046 0.049 0.045 0.049 -71% *
Neoplasms of unspecified nature or uncertain
behavior0.074 0.123 0.119 0.121 95% *
Obsessive-Compulsive Disorders 0.005 0.023 0.021 0.020 103% *
Osteoarthritis 0.052 0.094 0.084 0.089 90% *
Other Developmental Disorder 0.031 0.008 0.009 0.009 96% *
Other nervous system disorders 0.133 0.144 0.137 0.147 3% *
PTSD 0.058 0.038 0.040 0.040 100% *
Pregnancy 0.048 0.020 0.016 0.022 125% *
Psychotic Disorder 0.135 0.210 0.194 0.191 103% *
Spondylosis; intervertebral disc disorders;
other back0.205 0.293 0.282 0.284 97% *
Substance-related disorders 0.112 0.069 0.080 0.073 83% *
Thyroid disorders 0.042 0.092 0.081 0.082 99% *
1 Bias Reduction represents the reduction in the standardized bias coefficient as a result of the matching process. A figure greater than 0% and less than 200%
represents reduced bias.
2 Indicates if the covariate was excluded in the Propensity Score Model logistic regression.
3 An asterisk (*) indicates that the averages for the matched control group and treatment group are statistically equivalent.
Notes:

APPENDIX B
Covariate
Age 27.568 30.203 35.921 30.203 323%
Female 0.577 0.571 0.566 0.571 181% *
White 0.724 0.955 0.945 0.955 93% *
Black 0.241 0.030 0.025 0.030 105% *
County: Adams 0.043 0.139 0.141 0.139 102% *
County: Butler 0.293 0.000 0.161 0.000 32% YES
County: Lawrence 0.075 0.372 0.347 0.372 93% *
County: Lucas 0.477 0.000 0.199 0.000 48% YES
Medicaid Member Months 9.339 8.878 9.722 8.878 -99%
MCP Member Months 7.117 6.908 6.524 6.908 288% *
Dual Eligibility Member Months 0.272 0.266 0.392 0.266 -1611% *
Waiver Member Months 0.350 0.400 0.648 0.400 524% *
ABD Member Months 0.909 2.630 3.444 2.630 138%
CFC Member Months 7.019 5.551 5.112 5.551 131% *
Control Treatment Control Treatment Balanced3
Shawnee (All Ages, No CMHC Experience)
Summary of Covariate Averages Before and After Propensity Score Matching
Full Group Matched SamplesBias
Reduction1
Excluded
from PSM2

APPENDIX B
Covariate Control Treatment Control Treatment Balanced3
Shawnee (All Ages, No CMHC Experience)
Summary of Covariate Averages Before and After Propensity Score Matching
Full Group Matched SamplesBias
Reduction1
Excluded
from PSM2
# Mental Health Center Visits 0.000 0.000 0.000 0.000 N/A YES N/A
# ED Mental Health Visits 0.006 0.025 0.030 0.025 118% *
# IP Mental Health Visits 0.001 0.007 0.002 0.007 30% *
13 or More Mental Health Rx 0.021 0.141 0.181 0.141 124% *
ADHD 0.023 0.057 0.077 0.057 145% *
Acute bronchitis 0.054 0.122 0.136 0.122 118% *
Alcohol-related disorders 0.004 0.007 0.005 0.007 25% YES *
Anxiety Disorders 0.020 0.079 0.084 0.079 106% *
Asthma 0.057 0.079 0.119 0.079 253% *
Autism 0.002 0.007 0.000 0.007 -57% YES *
Bipolar Disorder 0.005 0.025 0.032 0.025 127% YES *
Blindness and vision defects 0.143 0.231 0.251 0.231 120% *
Cancer 0.013 0.015 0.035 0.015 1125% YES *
Cardiac dysrhythmias 0.025 0.055 0.072 0.055 148% *

APPENDIX B
Covariate Control Treatment Control Treatment Balanced3
Shawnee (All Ages, No CMHC Experience)
Summary of Covariate Averages Before and After Propensity Score Matching
Full Group Matched SamplesBias
Reduction1
Excluded
from PSM2
Chronic obstructive pulmonary disease and
bronchiectasis0.056 0.144 0.166 0.144 121% *
Conduct Disorder 0.003 0.012 0.012 0.012 100% YES *
Congestive heart failure; nonhypertensive 0.014 0.027 0.030 0.027 115% *
Coronary atherosclerosis and other heart
disease0.023 0.032 0.065 0.032 363%
Cystic fibrosis 0.000 0.000 0.000 0.000 N/A YES N/A
Delirium, dementia, and amnestic and other
cognitive diseases0.009 0.010 0.020 0.010 1248% YES *
Depression 0.022 0.102 0.127 0.102 123% *
Developmental disorders 0.033 0.040 0.040 0.040 100% *
Diabetes 0.058 0.092 0.139 0.092 214%
Epilepsy; convulsions 0.018 0.022 0.052 0.022 580% YES
Esophageal disorders 0.025 0.050 0.060 0.050 134% *
Essential hypertension 0.079 0.149 0.199 0.149 159% *
HIV infection 0.002 0.000 0.002 0.000 -28% YES *
Intracranial injury 0.005 0.012 0.012 0.012 100% YES *

APPENDIX B
Covariate Control Treatment Control Treatment Balanced3
Shawnee (All Ages, No CMHC Experience)
Summary of Covariate Averages Before and After Propensity Score Matching
Full Group Matched SamplesBias
Reduction1
Excluded
from PSM2
Mental Disorder Not Otherwise Specified
(NOS)0.002 0.010 0.007 0.010 75% YES *
Neoplasms of unspecified nature or uncertain
behavior0.032 0.065 0.109 0.065 204%
Obsessive-Compulsive Disorders 0.001 0.002 0.000 0.002 -64% YES *
Osteoarthritis 0.029 0.065 0.092 0.065 161% *
Other Developmental Disorder 0.001 0.000 0.005 0.000 -138% YES *
Other nervous system disorders 0.057 0.089 0.099 0.089 127% *
PTSD 0.001 0.000 0.000 0.000 N/A YES N/A
Pregnancy 0.040 0.037 0.045 0.037 -194% *
Psychotic Disorder 0.006 0.025 0.020 0.025 78% YES *
Spondylosis; intervertebral disc disorders;
other back0.092 0.233 0.270 0.233 122% *
Substance-related disorders 0.012 0.040 0.047 0.040 121% *
Thyroid disorders 0.019 0.037 0.062 0.037 207% *
1 Bias Reduction represents the reduction in the standardized bias coefficient as a result of the matching process. A figure greater than 0% and less than 200%
represents reduced bias.
2 Indicates if the covariate was excluded in the Propensity Score Model logistic regression.
3 An asterisk (*) indicates that the averages for the matched control group and treatment group are statistically equivalent.
Notes:

APPENDIX B
Covariate
Age 27.695 41.072 42.883 40.946 115%
Female 0.576 0.560 0.583 0.561 -37% *
White 0.727 0.559 0.645 0.562 52%
Black 0.239 0.415 0.324 0.411 53%
County: Adams 0.042 0.000 0.042 0.000 0% YES
County: Butler 0.300 0.000 0.371 0.000 -17% YES
County: Lawrence 0.074 0.000 0.082 0.000 -6% YES
County: Lucas 0.471 1.000 0.403 1.000 -15% YES N/A
Medicaid Member Months 9.475 10.968 11.260 10.958 130%
MCP Member Months 7.156 6.916 6.544 6.881 239% *
Dual Eligibility Member Months 0.282 0.513 0.614 0.518 136% *
Waiver Member Months 0.363 0.499 0.659 0.504 199% *
ABD Member Months 1.005 5.032 5.149 4.968 104% *
CFC Member Months 7.018 3.293 2.978 3.327 110%
Control Treatment Control Treatment Balanced3
Unison (All Ages, All CMHC)
Summary of Covariate Averages Before and After Propensity Score Matching
Full Group Matched SamplesBias
Reduction1
Excluded
from PSM2

APPENDIX B
Covariate Control Treatment Control Treatment Balanced3
Unison (All Ages, All CMHC)
Summary of Covariate Averages Before and After Propensity Score Matching
Full Group Matched SamplesBias
Reduction1
Excluded
from PSM2
# Mental Health Center Visits 1.069 21.664 18.950 21.064 94% *
# ED Mental Health Visits 0.012 0.123 0.138 0.124 110% *
# IP Mental Health Visits 0.003 0.042 0.045 0.041 108% *
13 or More Mental Health Rx 0.031 0.336 0.339 0.331 102% *
ADHD 0.032 0.081 0.094 0.082 119% *
Acute bronchitis 0.056 0.078 0.097 0.078 174% *
Alcohol-related disorders 0.006 0.055 0.053 0.053 100% *
Anxiety Disorders 0.028 0.077 0.097 0.078 130% *
Asthma 0.060 0.117 0.128 0.118 114% *
Autism 0.003 0.000 0.008 0.000 -84% YES
Bipolar Disorder 0.014 0.195 0.208 0.193 106% *
Blindness and vision defects 0.150 0.261 0.281 0.260 118% *
Cancer 0.014 0.026 0.035 0.026 161% *
Cardiac dysrhythmias 0.027 0.080 0.083 0.080 105% *

APPENDIX B
Covariate Control Treatment Control Treatment Balanced3
Unison (All Ages, All CMHC)
Summary of Covariate Averages Before and After Propensity Score Matching
Full Group Matched SamplesBias
Reduction1
Excluded
from PSM2
Chronic obstructive pulmonary disease and
bronchiectasis0.059 0.144 0.171 0.144 126%
Conduct Disorder 0.011 0.035 0.041 0.036 115% *
Congestive heart failure; nonhypertensive 0.014 0.025 0.034 0.025 161% *
Coronary atherosclerosis and other heart
disease0.023 0.050 0.065 0.050 147% *
Cystic fibrosis 0.000 0.000 0.000 0.000 N/A YES N/A
Delirium, dementia, and amnestic and other
cognitive diseases0.010 0.014 0.020 0.014 224% *
Depression 0.047 0.373 0.423 0.369 113%
Developmental disorders 0.037 0.053 0.060 0.053 139% *
Diabetes 0.061 0.165 0.204 0.165 130%
Epilepsy; convulsions 0.019 0.041 0.050 0.041 135% *
Esophageal disorders 0.027 0.073 0.097 0.072 143%
Essential hypertension 0.083 0.253 0.278 0.249 114% *
HIV infection 0.002 0.005 0.005 0.005 100% YES *
Intracranial injury 0.006 0.014 0.014 0.014 100% *

APPENDIX B
Covariate Control Treatment Control Treatment Balanced3
Unison (All Ages, All CMHC)
Summary of Covariate Averages Before and After Propensity Score Matching
Full Group Matched SamplesBias
Reduction1
Excluded
from PSM2
Mental Disorder Not Otherwise Specified
(NOS)0.005 0.037 0.037 0.037 100% *
Neoplasms of unspecified nature or uncertain
behavior0.035 0.080 0.087 0.081 112% *
Obsessive-Compulsive Disorders 0.001 0.004 0.006 0.004 166% YES *
Osteoarthritis 0.031 0.098 0.109 0.097 114% *
Other Developmental Disorder 0.003 0.001 0.018 0.001 -348% YES
Other nervous system disorders 0.062 0.167 0.180 0.166 111% *
PTSD 0.005 0.027 0.031 0.027 114% *
Pregnancy 0.040 0.028 0.028 0.028 100% *
Psychotic Disorder 0.015 0.398 0.383 0.392 98% *
Spondylosis; intervertebral disc disorders;
other back0.100 0.287 0.344 0.287 125%
Substance-related disorders 0.019 0.087 0.090 0.087 103% *
Thyroid disorders 0.021 0.056 0.070 0.055 133% *
1 Bias Reduction represents the reduction in the standardized bias coefficient as a result of the matching process. A figure greater than 0% and less than 200%
represents reduced bias.
2 Indicates if the covariate was excluded in the Propensity Score Model logistic regression.
3 An asterisk (*) indicates that the averages for the matched control group and treatment group are statistically equivalent.
Notes:

APPENDIX B
Covariate
Age 9.427 11.251 11.336 11.251 105% *
Female 0.498 0.379 0.366 0.379 111% *
White 0.710 0.540 0.587 0.540 73% *
Black 0.256 0.400 0.370 0.400 80% *
County: Adams 0.042 0.000 0.034 0.000 10% YES
County: Butler 0.341 0.000 0.391 0.000 -12% YES
County: Lawrence 0.071 0.000 0.055 0.000 12% YES
County: Lucas 0.450 1.000 0.451 1.000 0% YES
Medicaid Member Months 10.659 11.430 11.485 11.430 110% *
MCP Member Months 9.662 9.217 8.860 9.217 175% *
Dual Eligibility Member Months 0.003 0.013 0.004 0.013 -9% *
Waiver Member Months 0.029 0.000 0.000 0.000 N/A N/A
ABD Member Months 0.332 1.515 1.387 1.515 91% *
CFC Member Months 10.318 9.902 10.094 9.902 55% *
Control Treatment Control Treatment Balanced3
Unison (Under 18, All CMHC)
Summary of Covariate Averages Before and After Propensity Score Matching
Full Group Matched SamplesBias
Reduction1
Excluded
from PSM2

APPENDIX B
Covariate Control Treatment Control Treatment Balanced3
Unison (Under 18, All CMHC)
Summary of Covariate Averages Before and After Propensity Score Matching
Full Group Matched SamplesBias
Reduction1
Excluded
from PSM2
# Mental Health Center Visits 1.105 16.187 19.545 16.187 115% *
# ED Mental Health Visits 0.004 0.000 0.072 0.000 -244%
# IP Mental Health Visits 0.002 0.017 0.055 0.017 223%
13 or More Mental Health Rx 0.008 0.060 0.085 0.060 135% *
ADHD 0.060 0.511 0.528 0.511 103% *
Acute bronchitis 0.056 0.021 0.038 0.021 45% YES *
Alcohol-related disorders 0.001 0.000 0.000 0.000 N/A YES N/A
Anxiety Disorders 0.008 0.030 0.051 0.030 168% YES *
Asthma 0.075 0.128 0.085 0.128 21% *
Autism 0.003 0.000 0.017 0.000 -124% YES
Bipolar Disorder 0.003 0.004 0.043 0.004 1557% YES
Blindness and vision defects 0.156 0.349 0.306 0.349 80% *
Cancer 0.001 0.000 0.013 0.000 -200% YES *
Cardiac dysrhythmias 0.005 0.013 0.009 0.013 51% YES *

APPENDIX B
Covariate Control Treatment Control Treatment Balanced3
Unison (Under 18, All CMHC)
Summary of Covariate Averages Before and After Propensity Score Matching
Full Group Matched SamplesBias
Reduction1
Excluded
from PSM2
Chronic obstructive pulmonary disease and
bronchiectasis0.024 0.017 0.030 0.017 -79% YES *
Conduct Disorder 0.021 0.234 0.209 0.234 91% *
Congestive heart failure; nonhypertensive 0.000 0.000 0.000 0.000 N/A YES N/A
Coronary atherosclerosis and other heart
disease0.000 0.000 0.000 0.000 N/A YES N/A
Cystic fibrosis 0.001 0.000 0.000 0.000 N/A YES N/A
Delirium, dementia, and amnestic and other
cognitive diseases0.001 0.004 0.004 0.004 100% YES *
Depression 0.016 0.132 0.213 0.132 148%
Developmental disorders 0.050 0.081 0.123 0.081 213% *
Diabetes 0.005 0.009 0.013 0.009 193% YES *
Epilepsy; convulsions 0.012 0.004 0.030 0.004 -121% YES
Esophageal disorders 0.009 0.004 0.017 0.004 -98% YES *
Essential hypertension 0.003 0.004 0.004 0.004 100% YES *
HIV infection 0.000 0.000 0.000 0.000 N/A YES N/A
Intracranial injury 0.005 0.009 0.009 0.009 100% YES *

APPENDIX B
Covariate Control Treatment Control Treatment Balanced3
Unison (Under 18, All CMHC)
Summary of Covariate Averages Before and After Propensity Score Matching
Full Group Matched SamplesBias
Reduction1
Excluded
from PSM2
Mental Disorder Not Otherwise Specified
(NOS)0.002 0.000 0.026 0.000 -232% YES
Neoplasms of unspecified nature or uncertain
behavior0.012 0.038 0.072 0.038 190% YES *
Obsessive-Compulsive Disorders 0.001 0.004 0.000 0.004 -22% YES *
Osteoarthritis 0.000 0.000 0.000 0.000 N/A YES N/A
Other Developmental Disorder 0.005 0.009 0.055 0.009 798% YES
Other nervous system disorders 0.025 0.017 0.068 0.017 -341% YES
PTSD 0.004 0.017 0.051 0.017 251% YES
Pregnancy 0.003 0.009 0.004 0.009 32% YES *
Psychotic Disorder 0.002 0.009 0.021 0.009 218% YES *
Spondylosis; intervertebral disc disorders;
other back0.018 0.013 0.017 0.013 16% YES *
Substance-related disorders 0.004 0.026 0.021 0.026 84% YES *
Thyroid disorders 0.003 0.004 0.004 0.004 100% YES *
1 Bias Reduction represents the reduction in the standardized bias coefficient as a result of the matching process. A figure greater than 0% and less than 200%
represents reduced bias.
2 Indicates if the covariate was excluded in the Propensity Score Model logistic regression.
3 An asterisk (*) indicates that the averages for the matched control group and treatment group are statistically equivalent.
Notes:

APPENDIX B
Covariate
Age 42.341 45.959 45.867 45.928 98% *
Female 0.639 0.590 0.612 0.589 54% *
White 0.742 0.562 0.614 0.570 76%
Black 0.225 0.417 0.363 0.409 78%
County: Adams 0.042 0.000 0.031 0.000 14% YES
County: Butler 0.268 0.000 0.357 0.000 -23% YES
County: Lawrence 0.076 0.000 0.082 0.000 -4% YES
County: Lucas 0.488 1.000 0.437 1.000 -11% YES N/A
Medicaid Member Months 8.527 10.893 11.237 10.862 125%
MCP Member Months 5.146 6.539 6.429 6.445 99% *
Dual Eligibility Member Months 0.506 0.596 0.749 0.604 249% *
Waiver Member Months 0.631 0.580 0.632 0.594 24% *
ABD Member Months 1.545 5.608 5.569 5.471 102% *
CFC Member Months 4.371 2.210 2.361 2.259 95% *
Control Treatment Control Treatment Balanced3
Unison (18 and Over, All CMHC)
Summary of Covariate Averages Before and After Propensity Score Matching
Full Group Matched SamplesBias
Reduction1
Excluded
from PSM2

APPENDIX B
Covariate Control Treatment Control Treatment Balanced3
Unison (18 and Over, All CMHC)
Summary of Covariate Averages Before and After Propensity Score Matching
Full Group Matched SamplesBias
Reduction1
Excluded
from PSM2
# Mental Health Center Visits 1.040 22.562 18.303 20.940 91%
# ED Mental Health Visits 0.018 0.144 0.156 0.139 111% *
# IP Mental Health Visits 0.003 0.046 0.043 0.043 100% *
13 or More Mental Health Rx 0.048 0.381 0.388 0.366 105% *
ADHD 0.010 0.011 0.019 0.011 502% *
Acute bronchitis 0.055 0.087 0.103 0.087 142% *
Alcohol-related disorders 0.010 0.063 0.063 0.059 105% *
Anxiety Disorders 0.044 0.085 0.122 0.085 171%
Asthma 0.048 0.116 0.133 0.117 119% *
Autism 0.002 0.000 0.004 0.000 -56% YES
Bipolar Disorder 0.023 0.227 0.257 0.219 114%
Blindness and vision defects 0.146 0.247 0.277 0.244 130%
Cancer 0.024 0.030 0.037 0.029 213% *
Cardiac dysrhythmias 0.044 0.091 0.087 0.090 95% *

APPENDIX B
Covariate Control Treatment Control Treatment Balanced3
Unison (18 and Over, All CMHC)
Summary of Covariate Averages Before and After Propensity Score Matching
Full Group Matched SamplesBias
Reduction1
Excluded
from PSM2
Chronic obstructive pulmonary disease and
bronchiectasis0.088 0.165 0.205 0.163 147%
Conduct Disorder 0.003 0.003 0.019 0.002 4921% YES
Congestive heart failure; nonhypertensive 0.025 0.029 0.034 0.029 203% *
Coronary atherosclerosis and other heart
disease0.042 0.058 0.070 0.059 158% *
Cystic fibrosis 0.000 0.000 0.000 0.000 N/A YES N/A
Delirium, dementia, and amnestic and other
cognitive diseases0.017 0.015 0.022 0.016 -332% *
Depression 0.072 0.412 0.480 0.404 118%
Developmental disorders 0.027 0.048 0.047 0.047 100% *
Diabetes 0.106 0.191 0.218 0.193 126% *
Epilepsy; convulsions 0.025 0.047 0.059 0.047 146% *
Esophageal disorders 0.041 0.084 0.090 0.082 114% *
Essential hypertension 0.147 0.294 0.324 0.288 122%
HIV infection 0.003 0.006 0.008 0.006 132% YES *
Intracranial injury 0.007 0.015 0.018 0.015 127% *
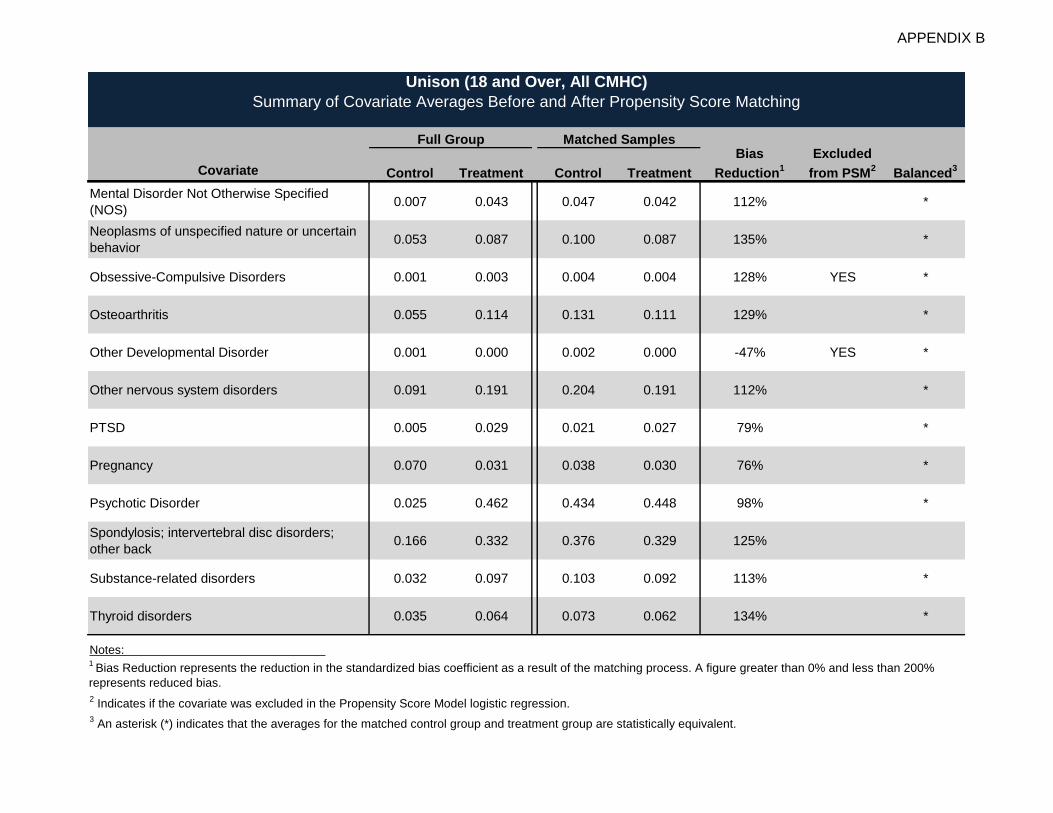
APPENDIX B
Covariate Control Treatment Control Treatment Balanced3
Unison (18 and Over, All CMHC)
Summary of Covariate Averages Before and After Propensity Score Matching
Full Group Matched SamplesBias
Reduction1
Excluded
from PSM2
Mental Disorder Not Otherwise Specified
(NOS)0.007 0.043 0.047 0.042 112% *
Neoplasms of unspecified nature or uncertain
behavior0.053 0.087 0.100 0.087 135% *
Obsessive-Compulsive Disorders 0.001 0.003 0.004 0.004 128% YES *
Osteoarthritis 0.055 0.114 0.131 0.111 129% *
Other Developmental Disorder 0.001 0.000 0.002 0.000 -47% YES *
Other nervous system disorders 0.091 0.191 0.204 0.191 112% *
PTSD 0.005 0.029 0.021 0.027 79% *
Pregnancy 0.070 0.031 0.038 0.030 76% *
Psychotic Disorder 0.025 0.462 0.434 0.448 98% *
Spondylosis; intervertebral disc disorders;
other back0.166 0.332 0.376 0.329 125%
Substance-related disorders 0.032 0.097 0.103 0.092 113% *
Thyroid disorders 0.035 0.064 0.073 0.062 134% *
1 Bias Reduction represents the reduction in the standardized bias coefficient as a result of the matching process. A figure greater than 0% and less than 200%
represents reduced bias.
2 Indicates if the covariate was excluded in the Propensity Score Model logistic regression.
3 An asterisk (*) indicates that the averages for the matched control group and treatment group are statistically equivalent.
Notes:
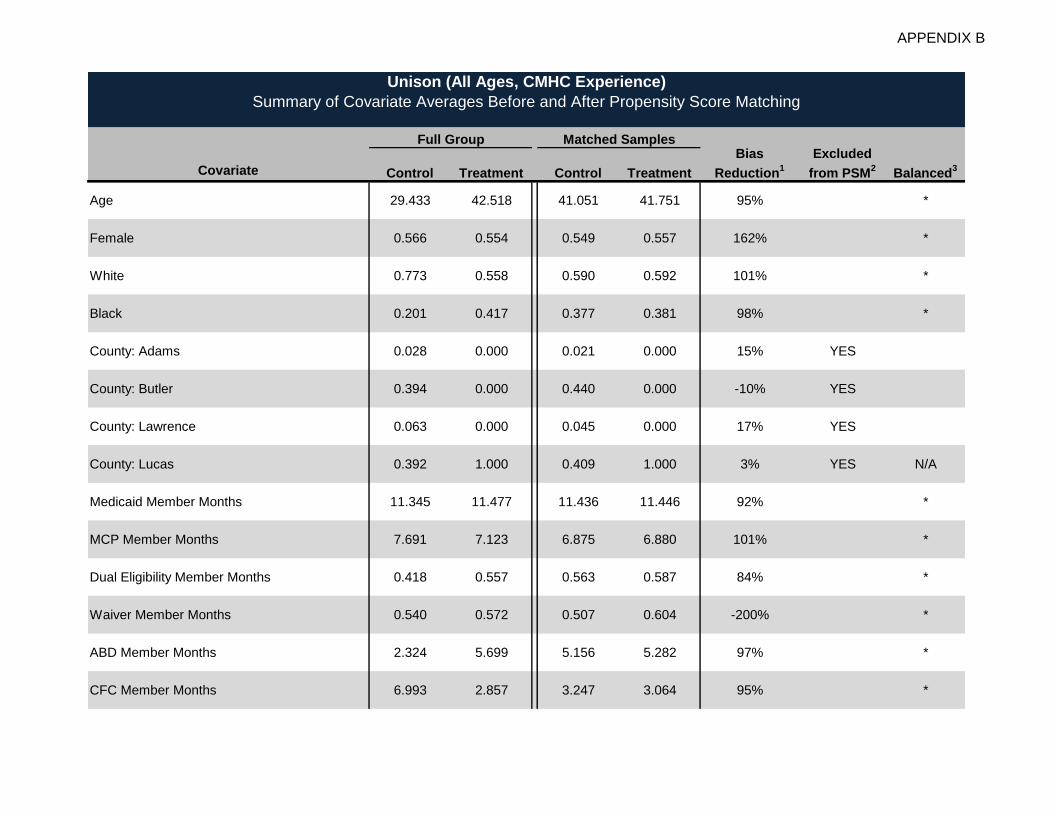
APPENDIX B
Covariate
Age 29.433 42.518 41.051 41.751 95% *
Female 0.566 0.554 0.549 0.557 162% *
White 0.773 0.558 0.590 0.592 101% *
Black 0.201 0.417 0.377 0.381 98% *
County: Adams 0.028 0.000 0.021 0.000 15% YES
County: Butler 0.394 0.000 0.440 0.000 -10% YES
County: Lawrence 0.063 0.000 0.045 0.000 17% YES
County: Lucas 0.392 1.000 0.409 1.000 3% YES N/A
Medicaid Member Months 11.345 11.477 11.436 11.446 92% *
MCP Member Months 7.691 7.123 6.875 6.880 101% *
Dual Eligibility Member Months 0.418 0.557 0.563 0.587 84% *
Waiver Member Months 0.540 0.572 0.507 0.604 -200% *
ABD Member Months 2.324 5.699 5.156 5.282 97% *
CFC Member Months 6.993 2.857 3.247 3.064 95% *
Control Treatment Control Treatment Balanced3
Unison (All Ages, CMHC Experience)
Summary of Covariate Averages Before and After Propensity Score Matching
Full Group Matched SamplesBias
Reduction1
Excluded
from PSM2

APPENDIX B
Covariate Control Treatment Control Treatment Balanced3
Unison (All Ages, CMHC Experience)
Summary of Covariate Averages Before and After Propensity Score Matching
Full Group Matched SamplesBias
Reduction1
Excluded
from PSM2
# Mental Health Center Visits 15.681 26.069 24.497 23.658 107% *
# ED Mental Health Visits 0.095 0.146 0.163 0.144 133% *
# IP Mental Health Visits 0.029 0.050 0.046 0.045 107% *
13 or More Mental Health Rx 0.167 0.394 0.351 0.360 97% *
ADHD 0.164 0.094 0.115 0.101 78% *
Acute bronchitis 0.080 0.084 0.081 0.087 -17% *
Alcohol-related disorders 0.027 0.062 0.049 0.061 69% *
Anxiety Disorders 0.141 0.084 0.093 0.088 91% *
Asthma 0.090 0.126 0.118 0.129 69% *
Autism 0.009 0.000 0.005 0.000 26% YES
Bipolar Disorder 0.141 0.234 0.240 0.233 107% *
Blindness and vision defects 0.249 0.280 0.265 0.280 53% *
Cancer 0.019 0.029 0.036 0.026 187% *
Cardiac dysrhythmias 0.046 0.089 0.076 0.083 85% *

APPENDIX B
Covariate Control Treatment Control Treatment Balanced3
Unison (All Ages, CMHC Experience)
Summary of Covariate Averages Before and After Propensity Score Matching
Full Group Matched SamplesBias
Reduction1
Excluded
from PSM2
Chronic obstructive pulmonary disease and
bronchiectasis0.099 0.159 0.147 0.159 81% *
Conduct Disorder 0.113 0.043 0.050 0.045 90% *
Congestive heart failure; nonhypertensive 0.017 0.026 0.026 0.026 100% *
Coronary atherosclerosis and other heart
disease0.026 0.054 0.045 0.053 75% *
Cystic fibrosis 0.001 0.000 0.000 0.000 N/A YES N/A
Delirium, dementia, and amnestic and other
cognitive diseases0.016 0.014 0.014 0.015 198% *
Depression 0.385 0.435 0.435 0.443 83% *
Developmental disorders 0.089 0.059 0.067 0.063 84% *
Diabetes 0.101 0.185 0.164 0.184 78% *
Epilepsy; convulsions 0.041 0.045 0.043 0.048 -11% *
Esophageal disorders 0.053 0.079 0.063 0.079 40% *
Essential hypertension 0.135 0.280 0.258 0.265 96% *
HIV infection 0.002 0.006 0.005 0.005 100% YES *
Intracranial injury 0.013 0.015 0.010 0.015 -193% *

APPENDIX B
Covariate Control Treatment Control Treatment Balanced3
Unison (All Ages, CMHC Experience)
Summary of Covariate Averages Before and After Propensity Score Matching
Full Group Matched SamplesBias
Reduction1
Excluded
from PSM2
Mental Disorder Not Otherwise Specified
(NOS)0.046 0.043 0.039 0.043 196% *
Neoplasms of unspecified nature or uncertain
behavior0.074 0.087 0.083 0.089 53% *
Obsessive-Compulsive Disorders 0.005 0.004 0.006 0.004 -153% YES *
Osteoarthritis 0.052 0.108 0.104 0.104 100% *
Other Developmental Disorder 0.031 0.001 0.023 0.002 16% YES
Other nervous system disorders 0.133 0.184 0.179 0.186 88% *
PTSD 0.058 0.032 0.029 0.035 129% *
Pregnancy 0.048 0.022 0.021 0.023 111% *
Psychotic Disorder 0.135 0.474 0.462 0.439 106% *
Spondylosis; intervertebral disc disorders;
other back0.205 0.306 0.285 0.302 85% *
Substance-related disorders 0.112 0.096 0.100 0.098 90% *
Thyroid disorders 0.042 0.061 0.056 0.060 81% *
1 Bias Reduction represents the reduction in the standardized bias coefficient as a result of the matching process. A figure greater than 0% and less than 200%
represents reduced bias.
2 Indicates if the covariate was excluded in the Propensity Score Model logistic regression.
3 An asterisk (*) indicates that the averages for the matched control group and treatment group are statistically equivalent.
Notes:

APPENDIX B
Covariate
Age 27.568 33.961 39.092 33.961 179%
Female 0.577 0.592 0.613 0.592 240% *
White 0.724 0.564 0.610 0.564 72% *
Black 0.241 0.404 0.340 0.404 63% *
County: Adams 0.043 0.000 0.060 0.000 -20% YES
County: Butler 0.293 0.000 0.262 0.000 7% YES
County: Lawrence 0.075 0.000 0.078 0.000 -3% YES
County: Lucas 0.477 1.000 0.511 1.000 7% YES
Medicaid Member Months 9.339 8.465 9.918 8.465 -86%
MCP Member Months 7.117 5.901 5.755 5.901 112% *
Dual Eligibility Member Months 0.272 0.298 0.610 0.298 1074% *
Waiver Member Months 0.350 0.135 0.163 0.135 82% *
ABD Member Months 0.909 1.748 1.752 1.748 100% *
CFC Member Months 7.019 5.440 5.309 5.440 109% *
Control Treatment Control Treatment Balanced3
Unison (All Ages, No CMHC Experience)
Summary of Covariate Averages Before and After Propensity Score Matching
Full Group Matched SamplesBias
Reduction1
Excluded
from PSM2

APPENDIX B
Covariate Control Treatment Control Treatment Balanced3
Unison (All Ages, No CMHC Experience)
Summary of Covariate Averages Before and After Propensity Score Matching
Full Group Matched SamplesBias
Reduction1
Excluded
from PSM2
# Mental Health Center Visits 0.000 0.000 0.000 0.000 N/A YES N/A
# ED Mental Health Visits 0.006 0.011 0.018 0.011 209% *
# IP Mental Health Visits 0.001 0.000 0.000 0.000 N/A N/A
13 or More Mental Health Rx 0.021 0.050 0.060 0.050 130% *
ADHD 0.023 0.021 0.011 0.021 1051% YES *
Acute bronchitis 0.054 0.046 0.106 0.046 -551%
Alcohol-related disorders 0.004 0.018 0.025 0.018 138% YES *
Anxiety Disorders 0.020 0.043 0.078 0.043 212% *
Asthma 0.057 0.074 0.085 0.074 157% *
Autism 0.002 0.000 0.000 0.000 N/A YES N/A
Bipolar Disorder 0.005 0.004 0.011 0.004 -353% YES *
Blindness and vision defects 0.143 0.170 0.188 0.170 161% *
Cancer 0.013 0.011 0.043 0.011 -683% YES
Cardiac dysrhythmias 0.025 0.039 0.071 0.039 281% *

APPENDIX B
Covariate Control Treatment Control Treatment Balanced3
Unison (All Ages, No CMHC Experience)
Summary of Covariate Averages Before and After Propensity Score Matching
Full Group Matched SamplesBias
Reduction1
Excluded
from PSM2
Chronic obstructive pulmonary disease and
bronchiectasis0.056 0.071 0.149 0.071 523%
Conduct Disorder 0.003 0.000 0.000 0.000 N/A YES N/A
Congestive heart failure; nonhypertensive 0.014 0.021 0.039 0.021 277% YES *
Coronary atherosclerosis and other heart
disease0.023 0.028 0.053 0.028 463% YES *
Cystic fibrosis 0.000 0.000 0.000 0.000 N/A YES N/A
Delirium, dementia, and amnestic and other
cognitive diseases0.009 0.011 0.032 0.011 1141% YES *
Depression 0.022 0.067 0.103 0.067 158% *
Developmental disorders 0.033 0.021 0.025 0.021 68% YES *
Diabetes 0.058 0.071 0.142 0.071 532%
Epilepsy; convulsions 0.018 0.018 0.050 0.018 652398% YES
Esophageal disorders 0.025 0.043 0.092 0.043 307%
Essential hypertension 0.079 0.117 0.195 0.117 268%
HIV infection 0.002 0.004 0.007 0.004 220% YES *
Intracranial injury 0.005 0.011 0.011 0.011 100% YES *

APPENDIX B
Covariate Control Treatment Control Treatment Balanced3
Unison (All Ages, No CMHC Experience)
Summary of Covariate Averages Before and After Propensity Score Matching
Full Group Matched SamplesBias
Reduction1
Excluded
from PSM2
Mental Disorder Not Otherwise Specified
(NOS)0.002 0.007 0.000 0.007 -47% YES *
Neoplasms of unspecified nature or uncertain
behavior0.032 0.050 0.092 0.050 286%
Obsessive-Compulsive Disorders 0.001 0.000 0.004 0.000 -117% YES *
Osteoarthritis 0.029 0.046 0.064 0.046 187% *
Other Developmental Disorder 0.001 0.000 0.000 0.000 N/A YES N/A
Other nervous system disorders 0.057 0.082 0.160 0.082 344%
PTSD 0.001 0.000 0.004 0.000 -84% YES *
Pregnancy 0.040 0.060 0.082 0.060 188% *
Psychotic Disorder 0.006 0.028 0.032 0.028 112% YES *
Spondylosis; intervertebral disc disorders;
other back0.092 0.191 0.280 0.191 173%
Substance-related disorders 0.012 0.043 0.032 0.043 70% *
Thyroid disorders 0.019 0.028 0.018 0.028 -21% YES *
1 Bias Reduction represents the reduction in the standardized bias coefficient as a result of the matching process. A figure greater than 0% and less than 200%
represents reduced bias.
2 Indicates if the covariate was excluded in the Propensity Score Model logistic regression.
3 An asterisk (*) indicates that the averages for the matched control group and treatment group are statistically equivalent.
Notes:

APPENDIX B
Covariate
Age 27.695 32.870 35.837 32.878 160%
Female 0.576 0.544 0.560 0.544 52% *
White 0.727 0.531 0.597 0.531 68%
Black 0.239 0.453 0.384 0.453 70%
County: Adams 0.042 0.000 0.022 0.000 27% YES
County: Butler 0.300 0.000 0.380 0.000 -20% YES N/A
County: Lawrence 0.074 0.000 0.074 0.000 0% YES
County: Lucas 0.471 0.999 0.442 0.999 -6% YES N/A
Medicaid Member Months 9.475 11.011 11.145 11.011 113%
MCP Member Months 7.156 7.172 6.717 7.174 -2792%
Dual Eligibility Member Months 0.282 0.429 0.573 0.429 185%
Waiver Member Months 0.363 0.499 0.539 0.499 127% *
ABD Member Months 1.005 4.076 4.317 4.073 106% *
CFC Member Months 7.018 4.874 4.322 4.876 126%
Control Treatment Control Treatment Balanced3
Zepf (All Ages, All CMHC)
Summary of Covariate Averages Before and After Propensity Score Matching
Full Group Matched SamplesBias
Reduction1
Excluded
from PSM2

APPENDIX B
Covariate Control Treatment Control Treatment Balanced3
Zepf (All Ages, All CMHC)
Summary of Covariate Averages Before and After Propensity Score Matching
Full Group Matched SamplesBias
Reduction1
Excluded
from PSM2
# Mental Health Center Visits 1.069 27.499 23.998 27.463 91%
# ED Mental Health Visits 0.012 0.084 0.110 0.084 127%
# IP Mental Health Visits 0.003 0.042 0.042 0.042 99% *
13 or More Mental Health Rx 0.031 0.270 0.274 0.270 101% *
ADHD 0.032 0.172 0.179 0.172 104% *
Acute bronchitis 0.056 0.060 0.075 0.060 381%
Alcohol-related disorders 0.006 0.026 0.031 0.026 118% *
Anxiety Disorders 0.028 0.056 0.077 0.056 162%
Asthma 0.060 0.117 0.126 0.117 113% *
Autism 0.003 0.004 0.005 0.004 175% *
Bipolar Disorder 0.014 0.157 0.177 0.157 110%
Blindness and vision defects 0.150 0.237 0.273 0.237 137%
Cancer 0.014 0.015 0.021 0.015 515% *
Cardiac dysrhythmias 0.027 0.064 0.070 0.064 113% *

APPENDIX B
Covariate Control Treatment Control Treatment Balanced3
Zepf (All Ages, All CMHC)
Summary of Covariate Averages Before and After Propensity Score Matching
Full Group Matched SamplesBias
Reduction1
Excluded
from PSM2
Chronic obstructive pulmonary disease and
bronchiectasis0.059 0.096 0.112 0.096 138%
Conduct Disorder 0.011 0.088 0.096 0.088 108% *
Congestive heart failure; nonhypertensive 0.014 0.018 0.019 0.018 140% *
Coronary atherosclerosis and other heart
disease0.023 0.029 0.038 0.029 227% *
Cystic fibrosis 0.000 0.000 0.000 0.000 N/A YES N/A
Delirium, dementia, and amnestic and other
cognitive diseases0.010 0.011 0.015 0.011 466% *
Depression 0.047 0.347 0.422 0.346 119%
Developmental disorders 0.037 0.080 0.081 0.080 101% *
Diabetes 0.061 0.120 0.143 0.120 133%
Epilepsy; convulsions 0.019 0.039 0.044 0.039 121% *
Esophageal disorders 0.027 0.058 0.069 0.058 131% *
Essential hypertension 0.083 0.177 0.211 0.178 129%
HIV infection 0.002 0.004 0.005 0.004 138% *
Intracranial injury 0.006 0.014 0.019 0.014 151% *

APPENDIX B
Covariate Control Treatment Control Treatment Balanced3
Zepf (All Ages, All CMHC)
Summary of Covariate Averages Before and After Propensity Score Matching
Full Group Matched SamplesBias
Reduction1
Excluded
from PSM2
Mental Disorder Not Otherwise Specified
(NOS)0.005 0.020 0.029 0.020 143%
Neoplasms of unspecified nature or uncertain
behavior0.035 0.073 0.088 0.073 132%
Obsessive-Compulsive Disorders 0.001 0.002 0.005 0.002 292% YES *
Osteoarthritis 0.031 0.073 0.080 0.073 115% *
Other Developmental Disorder 0.003 0.027 0.026 0.027 98% *
Other nervous system disorders 0.062 0.127 0.152 0.126 133%
PTSD 0.005 0.034 0.038 0.034 112% *
Pregnancy 0.040 0.029 0.037 0.029 30% *
Psychotic Disorder 0.015 0.282 0.306 0.282 107%
Spondylosis; intervertebral disc disorders;
other back0.100 0.207 0.249 0.207 133%
Substance-related disorders 0.019 0.051 0.058 0.051 118% *
Thyroid disorders 0.021 0.038 0.052 0.038 166%
1 Bias Reduction represents the reduction in the standardized bias coefficient as a result of the matching process. A figure greater than 0% and less than 200%
represents reduced bias.
2 Indicates if the covariate was excluded in the Propensity Score Model logistic regression.
3 An asterisk (*) indicates that the averages for the matched control group and treatment group are statistically equivalent.
Notes:

APPENDIX B
Covariate
Age 9.427 12.142 12.329 12.151 107% *
Female 0.498 0.404 0.364 0.407 147%
White 0.710 0.495 0.553 0.499 76%
Black 0.256 0.487 0.425 0.484 76%
County: Adams 0.042 0.000 0.018 0.000 36% YES
County: Butler 0.341 0.000 0.416 0.000 -17% YES
County: Lawrence 0.071 0.000 0.075 0.000 -3% YES
County: Lucas 0.450 0.998 0.422 0.998 -6% YES
Medicaid Member Months 10.659 11.296 11.337 11.289 110% *
MCP Member Months 9.662 8.722 8.073 8.760 168%
Dual Eligibility Member Months 0.003 0.005 0.008 0.005 309% *
Waiver Member Months 0.029 0.005 0.015 0.005 41% *
ABD Member Months 0.332 1.739 2.100 1.709 121%
CFC Member Months 10.318 9.551 9.228 9.574 141% *
Control Treatment Control Treatment Balanced3
Zepf (Under 18, All CMHC)
Summary of Covariate Averages Before and After Propensity Score Matching
Full Group Matched SamplesBias
Reduction1
Excluded
from PSM2

APPENDIX B
Covariate Control Treatment Control Treatment Balanced3
Zepf (Under 18, All CMHC)
Summary of Covariate Averages Before and After Propensity Score Matching
Full Group Matched SamplesBias
Reduction1
Excluded
from PSM2
# Mental Health Center Visits 1.105 34.967 30.944 33.991 94% *
# ED Mental Health Visits 0.004 0.033 0.055 0.033 148%
# IP Mental Health Visits 0.002 0.047 0.048 0.044 107% *
13 or More Mental Health Rx 0.008 0.142 0.137 0.140 98% *
ADHD 0.060 0.460 0.518 0.455 112%
Acute bronchitis 0.056 0.023 0.031 0.023 72% *
Alcohol-related disorders 0.001 0.009 0.004 0.008 55% YES *
Anxiety Disorders 0.008 0.031 0.052 0.031 162%
Asthma 0.075 0.116 0.145 0.116 162%
Autism 0.003 0.009 0.010 0.009 115% YES *
Bipolar Disorder 0.003 0.053 0.057 0.053 106% *
Blindness and vision defects 0.156 0.258 0.283 0.260 121% *
Cancer 0.001 0.000 0.001 0.000 18% YES *
Cardiac dysrhythmias 0.005 0.024 0.024 0.022 108% *

APPENDIX B
Covariate Control Treatment Control Treatment Balanced3
Zepf (Under 18, All CMHC)
Summary of Covariate Averages Before and After Propensity Score Matching
Full Group Matched SamplesBias
Reduction1
Excluded
from PSM2
Chronic obstructive pulmonary disease and
bronchiectasis0.024 0.012 0.024 0.012 -4%
Conduct Disorder 0.021 0.231 0.273 0.226 116%
Congestive heart failure; nonhypertensive 0.000 0.000 0.000 0.000 N/A YES N/A
Coronary atherosclerosis and other heart
disease0.000 0.000 0.000 0.000 N/A YES N/A
Cystic fibrosis 0.001 0.000 0.000 0.000 N/A YES N/A
Delirium, dementia, and amnestic and other
cognitive diseases0.001 0.005 0.006 0.004 139% YES *
Depression 0.016 0.208 0.248 0.204 117%
Developmental disorders 0.050 0.133 0.170 0.132 137%
Diabetes 0.005 0.011 0.017 0.011 177% *
Epilepsy; convulsions 0.012 0.031 0.032 0.031 104% *
Esophageal disorders 0.009 0.010 0.011 0.010 547% YES *
Essential hypertension 0.003 0.006 0.013 0.006 246% YES *
HIV infection 0.000 0.000 0.001 0.000 -171% YES *
Intracranial injury 0.005 0.007 0.012 0.007 316% YES *

APPENDIX B
Covariate Control Treatment Control Treatment Balanced3
Zepf (Under 18, All CMHC)
Summary of Covariate Averages Before and After Propensity Score Matching
Full Group Matched SamplesBias
Reduction1
Excluded
from PSM2
Mental Disorder Not Otherwise Specified
(NOS)0.002 0.007 0.020 0.007 281% YES
Neoplasms of unspecified nature or uncertain
behavior0.012 0.049 0.075 0.049 151%
Obsessive-Compulsive Disorders 0.001 0.004 0.004 0.004 100% YES *
Osteoarthritis 0.000 0.000 0.001 0.000 -52% YES *
Other Developmental Disorder 0.005 0.069 0.076 0.066 111% *
Other nervous system disorders 0.025 0.046 0.059 0.047 146% *
PTSD 0.004 0.072 0.074 0.071 103% *
Pregnancy 0.003 0.009 0.004 0.009 23% YES *
Psychotic Disorder 0.002 0.015 0.020 0.016 121% *
Spondylosis; intervertebral disc disorders;
other back0.018 0.027 0.045 0.027 253%
Substance-related disorders 0.004 0.030 0.042 0.029 134% *
Thyroid disorders 0.003 0.006 0.012 0.006 271% YES *
1 Bias Reduction represents the reduction in the standardized bias coefficient as a result of the matching process. A figure greater than 0% and less than 200%
represents reduced bias.
2 Indicates if the covariate was excluded in the Propensity Score Model logistic regression.
3 An asterisk (*) indicates that the averages for the matched control group and treatment group are statistically equivalent.
Notes:

APPENDIX B
Covariate
Age 42.341 43.815 44.023 43.823 115% *
Female 0.639 0.618 0.632 0.617 33% *
White 0.742 0.550 0.622 0.552 65%
Black 0.225 0.434 0.363 0.433 69%
County: Adams 0.042 0.000 0.024 0.000 25% YES
County: Butler 0.268 0.000 0.364 0.000 -25% YES
County: Lawrence 0.076 0.000 0.076 0.000 0% YES
County: Lucas 0.488 1.000 0.447 1.000 -9% YES N/A
Medicaid Member Months 8.527 10.860 11.214 10.854 124%
MCP Member Months 5.146 6.353 6.129 6.333 83% *
Dual Eligibility Member Months 0.506 0.652 0.818 0.646 207%
Waiver Member Months 0.631 0.759 0.751 0.758 95% *
ABD Member Months 1.545 5.309 5.301 5.279 100% *
CFC Member Months 4.371 2.404 2.394 2.419 101% *
Control Treatment Control Treatment Balanced3
Zepf (18 and Over, All CMHC)
Summary of Covariate Averages Before and After Propensity Score Matching
Full Group Matched SamplesBias
Reduction1
Excluded
from PSM2

APPENDIX B
Covariate Control Treatment Control Treatment Balanced3
Zepf (18 and Over, All CMHC)
Summary of Covariate Averages Before and After Propensity Score Matching
Full Group Matched SamplesBias
Reduction1
Excluded
from PSM2
# Mental Health Center Visits 1.040 23.556 20.112 23.252 91%
# ED Mental Health Visits 0.018 0.111 0.132 0.110 119% *
# IP Mental Health Visits 0.003 0.039 0.043 0.038 111% *
13 or More Mental Health Rx 0.048 0.337 0.350 0.334 104% *
ADHD 0.010 0.019 0.026 0.019 151% *
Acute bronchitis 0.055 0.080 0.088 0.079 129% *
Alcohol-related disorders 0.010 0.036 0.045 0.035 128% *
Anxiety Disorders 0.044 0.069 0.089 0.069 166%
Asthma 0.048 0.118 0.134 0.118 119% *
Autism 0.002 0.002 0.006 0.002 -1104% YES
Bipolar Disorder 0.023 0.213 0.249 0.211 115%
Blindness and vision defects 0.146 0.226 0.249 0.224 129% *
Cancer 0.024 0.023 0.027 0.023 -368% *
Cardiac dysrhythmias 0.044 0.086 0.107 0.086 141%

APPENDIX B
Covariate Control Treatment Control Treatment Balanced3
Zepf (18 and Over, All CMHC)
Summary of Covariate Averages Before and After Propensity Score Matching
Full Group Matched SamplesBias
Reduction1
Excluded
from PSM2
Chronic obstructive pulmonary disease and
bronchiectasis0.088 0.141 0.166 0.141 142%
Conduct Disorder 0.003 0.012 0.017 0.012 138% *
Congestive heart failure; nonhypertensive 0.025 0.027 0.029 0.027 188% *
Coronary atherosclerosis and other heart
disease0.042 0.045 0.045 0.045 85% *
Cystic fibrosis 0.000 0.000 0.000 0.000 N/A YES N/A
Delirium, dementia, and amnestic and other
cognitive diseases0.017 0.014 0.018 0.014 -52% *
Depression 0.072 0.420 0.510 0.418 121%
Developmental disorders 0.027 0.052 0.057 0.052 115% *
Diabetes 0.106 0.178 0.185 0.177 110% *
Epilepsy; convulsions 0.025 0.043 0.055 0.043 156% *
Esophageal disorders 0.041 0.083 0.088 0.084 109% *
Essential hypertension 0.147 0.268 0.296 0.267 122%
HIV infection 0.003 0.006 0.006 0.006 100% *
Intracranial injury 0.007 0.018 0.018 0.018 100% *

APPENDIX B
Covariate Control Treatment Control Treatment Balanced3
Zepf (18 and Over, All CMHC)
Summary of Covariate Averages Before and After Propensity Score Matching
Full Group Matched SamplesBias
Reduction1
Excluded
from PSM2
Mental Disorder Not Otherwise Specified
(NOS)0.007 0.027 0.031 0.027 116% *
Neoplasms of unspecified nature or uncertain
behavior0.053 0.086 0.092 0.086 117% *
Obsessive-Compulsive Disorders 0.001 0.001 0.008 0.001 -708% YES
Osteoarthritis 0.055 0.111 0.114 0.111 105% *
Other Developmental Disorder 0.001 0.005 0.005 0.005 100% YES *
Other nervous system disorders 0.091 0.169 0.206 0.169 140%
PTSD 0.005 0.013 0.017 0.013 141% *
Pregnancy 0.070 0.040 0.036 0.040 116% *
Psychotic Disorder 0.025 0.422 0.431 0.418 102% *
Spondylosis; intervertebral disc disorders;
other back0.166 0.302 0.339 0.301 125%
Substance-related disorders 0.032 0.063 0.075 0.063 133% *
Thyroid disorders 0.035 0.055 0.064 0.054 141% *
1 Bias Reduction represents the reduction in the standardized bias coefficient as a result of the matching process. A figure greater than 0% and less than 200%
represents reduced bias.
2 Indicates if the covariate was excluded in the Propensity Score Model logistic regression.
3 An asterisk (*) indicates that the averages for the matched control group and treatment group are statistically equivalent.
Notes:

APPENDIX B
Covariate
Age 29.433 34.873 35.192 34.554 112% *
Female 0.566 0.544 0.552 0.544 65% *
White 0.773 0.541 0.575 0.563 95% *
Black 0.201 0.444 0.412 0.422 96% *
County: Adams 0.028 0.000 0.015 0.000 28% YES
County: Butler 0.394 0.000 0.444 0.000 -11% YES N/A
County: Lawrence 0.063 0.000 0.052 0.000 9% YES
County: Lucas 0.392 1.000 0.417 1.000 5% YES N/A
Medicaid Member Months 11.345 11.546 11.530 11.525 103% *
MCP Member Months 7.691 7.237 6.971 7.178 144% *
Dual Eligibility Member Months 0.418 0.509 0.599 0.513 186% *
Waiver Member Months 0.540 0.581 0.578 0.588 78% *
ABD Member Months 2.324 4.722 4.466 4.490 99% *
CFC Member Months 6.993 4.407 4.362 4.571 108% *
Control Treatment Control Treatment Balanced3
Zepf (All Ages, CMHC Experience)
Summary of Covariate Averages Before and After Propensity Score Matching
Full Group Matched SamplesBias
Reduction1
Excluded
from PSM2

APPENDIX B
Covariate Control Treatment Control Treatment Balanced3
Zepf (All Ages, CMHC Experience)
Summary of Covariate Averages Before and After Propensity Score Matching
Full Group Matched SamplesBias
Reduction1
Excluded
from PSM2
# Mental Health Center Visits 15.681 34.223 32.332 32.689 99% *
# ED Mental Health Visits 0.095 0.099 0.110 0.100 343% *
# IP Mental Health Visits 0.029 0.051 0.051 0.049 107% *
13 or More Mental Health Rx 0.167 0.328 0.311 0.311 100% *
ADHD 0.164 0.203 0.195 0.203 79% *
Acute bronchitis 0.080 0.067 0.064 0.069 140% *
Alcohol-related disorders 0.027 0.030 0.031 0.030 151% *
Anxiety Disorders 0.141 0.063 0.067 0.066 98% *
Asthma 0.090 0.122 0.118 0.117 103% *
Autism 0.009 0.005 0.007 0.005 23% *
Bipolar Disorder 0.141 0.194 0.195 0.194 102% *
Blindness and vision defects 0.249 0.255 0.253 0.258 28% *
Cancer 0.019 0.017 0.022 0.017 -132% *
Cardiac dysrhythmias 0.046 0.070 0.063 0.067 82% *

APPENDIX B
Covariate Control Treatment Control Treatment Balanced3
Zepf (All Ages, CMHC Experience)
Summary of Covariate Averages Before and After Propensity Score Matching
Full Group Matched SamplesBias
Reduction1
Excluded
from PSM2
Chronic obstructive pulmonary disease and
bronchiectasis0.099 0.110 0.117 0.113 139% *
Conduct Disorder 0.113 0.108 0.108 0.109 117% *
Congestive heart failure; nonhypertensive 0.017 0.021 0.019 0.020 69% *
Coronary atherosclerosis and other heart
disease0.026 0.034 0.028 0.034 22% *
Cystic fibrosis 0.001 0.000 0.000 0.000 N/A YES N/A
Delirium, dementia, and amnestic and other
cognitive diseases0.016 0.011 0.011 0.010 59% *
Depression 0.385 0.423 0.432 0.424 122% *
Developmental disorders 0.089 0.090 0.087 0.091 -134% *
Diabetes 0.101 0.140 0.144 0.139 113% *
Epilepsy; convulsions 0.041 0.044 0.046 0.044 155% *
Esophageal disorders 0.053 0.067 0.069 0.066 118% *
Essential hypertension 0.135 0.205 0.207 0.202 107% *
HIV infection 0.002 0.005 0.006 0.005 133% *
Intracranial injury 0.013 0.016 0.017 0.015 180% *

APPENDIX B
Covariate Control Treatment Control Treatment Balanced3
Zepf (All Ages, CMHC Experience)
Summary of Covariate Averages Before and After Propensity Score Matching
Full Group Matched SamplesBias
Reduction1
Excluded
from PSM2
Mental Disorder Not Otherwise Specified
(NOS)0.046 0.023 0.026 0.024 86% *
Neoplasms of unspecified nature or uncertain
behavior0.074 0.081 0.080 0.081 83% *
Obsessive-Compulsive Disorders 0.005 0.002 0.006 0.002 -7% YES *
Osteoarthritis 0.052 0.085 0.081 0.080 101% *
Other Developmental Disorder 0.031 0.033 0.031 0.034 -9% *
Other nervous system disorders 0.133 0.141 0.137 0.140 54% *
PTSD 0.058 0.042 0.038 0.043 129% *
Pregnancy 0.048 0.026 0.025 0.027 109% *
Psychotic Disorder 0.135 0.347 0.344 0.326 107% *
Spondylosis; intervertebral disc disorders;
other back0.205 0.233 0.241 0.231 134% *
Substance-related disorders 0.112 0.060 0.057 0.061 109% *
Thyroid disorders 0.042 0.045 0.047 0.045 200% *
1 Bias Reduction represents the reduction in the standardized bias coefficient as a result of the matching process. A figure greater than 0% and less than 200%
represents reduced bias.
2 Indicates if the covariate was excluded in the Propensity Score Model logistic regression.
3 An asterisk (*) indicates that the averages for the matched control group and treatment group are statistically equivalent.
Notes:

APPENDIX B
Covariate
Age 27.568 24.677 31.752 24.677 -164%
Female 0.577 0.545 0.567 0.545 31% *
White 0.724 0.492 0.499 0.492 97% *
Black 0.241 0.487 0.453 0.487 87% *
County: Adams 0.043 0.000 0.041 0.000 2% YES
County: Butler 0.293 0.000 0.250 0.000 10% YES
County: Lawrence 0.075 0.000 0.066 0.000 6% YES
County: Lucas 0.477 0.997 0.564 0.997 16% YES
Medicaid Member Months 9.339 8.823 9.801 8.823 -111%
MCP Member Months 7.117 6.903 6.241 6.903 420%
Dual Eligibility Member Months 0.272 0.098 0.258 0.098 -2%
Waiver Member Months 0.350 0.163 0.479 0.163 -51%
ABD Member Months 0.909 1.433 2.868 1.433 316%
CFC Member Months 7.019 6.784 5.669 6.784 589%
Control Treatment Control Treatment Balanced3
Zepf (All Ages, No CMHC Experience)
Summary of Covariate Averages Before and After Propensity Score Matching
Full Group Matched SamplesBias
Reduction1
Excluded
from PSM2

APPENDIX B
Covariate Control Treatment Control Treatment Balanced3
Zepf (All Ages, No CMHC Experience)
Summary of Covariate Averages Before and After Propensity Score Matching
Full Group Matched SamplesBias
Reduction1
Excluded
from PSM2
# Mental Health Center Visits 0.000 0.000 0.000 0.000 N/A YES N/A
# ED Mental Health Visits 0.006 0.022 0.025 0.022 116% *
# IP Mental Health Visits 0.001 0.003 0.005 0.003 141% *
13 or More Mental Health Rx 0.021 0.034 0.068 0.034 289%
ADHD 0.023 0.044 0.054 0.044 139% *
Acute bronchitis 0.054 0.032 0.046 0.032 34% *
Alcohol-related disorders 0.004 0.012 0.008 0.012 61% YES *
Anxiety Disorders 0.020 0.027 0.054 0.027 373%
Asthma 0.057 0.097 0.119 0.097 148% *
Autism 0.002 0.000 0.007 0.000 -81% YES
Bipolar Disorder 0.005 0.008 0.012 0.008 173% YES *
Blindness and vision defects 0.143 0.161 0.258 0.161 564%
Cancer 0.013 0.008 0.017 0.008 -60% YES *
Cardiac dysrhythmias 0.025 0.042 0.071 0.042 232%

APPENDIX B
Covariate Control Treatment Control Treatment Balanced3
Zepf (All Ages, No CMHC Experience)
Summary of Covariate Averages Before and After Propensity Score Matching
Full Group Matched SamplesBias
Reduction1
Excluded
from PSM2
Chronic obstructive pulmonary disease and
bronchiectasis0.056 0.041 0.092 0.041 -182%
Conduct Disorder 0.003 0.003 0.005 0.003 522% YES *
Congestive heart failure; nonhypertensive 0.014 0.003 0.032 0.003 -97% YES
Coronary atherosclerosis and other heart
disease0.023 0.012 0.037 0.012 -96% YES
Cystic fibrosis 0.000 0.000 0.000 0.000 N/A YES N/A
Delirium, dementia, and amnestic and other
cognitive diseases0.009 0.008 0.012 0.008 -328% YES *
Depression 0.022 0.036 0.073 0.036 308%
Developmental disorders 0.033 0.039 0.048 0.039 239% *
Diabetes 0.058 0.039 0.087 0.039 -125%
Epilepsy; convulsions 0.018 0.017 0.048 0.017 -2927% YES
Esophageal disorders 0.025 0.019 0.061 0.019 -393%
Essential hypertension 0.079 0.063 0.127 0.063 -252%
HIV infection 0.002 0.000 0.005 0.000 -84% YES *
Intracranial injury 0.005 0.007 0.007 0.007 100% YES *

APPENDIX B
Covariate Control Treatment Control Treatment Balanced3
Zepf (All Ages, No CMHC Experience)
Summary of Covariate Averages Before and After Propensity Score Matching
Full Group Matched SamplesBias
Reduction1
Excluded
from PSM2
Mental Disorder Not Otherwise Specified
(NOS)0.002 0.005 0.005 0.005 100% YES *
Neoplasms of unspecified nature or uncertain
behavior0.032 0.039 0.066 0.039 419%
Obsessive-Compulsive Disorders 0.001 0.002 0.002 0.002 100% YES *
Osteoarthritis 0.029 0.024 0.073 0.024 -594%
Other Developmental Disorder 0.001 0.000 0.002 0.000 -39% YES *
Other nervous system disorders 0.057 0.070 0.139 0.070 525%
PTSD 0.001 0.002 0.000 0.002 -237% YES *
Pregnancy 0.040 0.041 0.063 0.041 1929% *
Psychotic Disorder 0.006 0.014 0.010 0.014 58% YES *
Spondylosis; intervertebral disc disorders;
other back0.092 0.098 0.199 0.098 1459%
Substance-related disorders 0.012 0.017 0.024 0.017 229% YES *
Thyroid disorders 0.019 0.010 0.036 0.010 -123% YES
1 Bias Reduction represents the reduction in the standardized bias coefficient as a result of the matching process. A figure greater than 0% and less than 200%
represents reduced bias.
2 Indicates if the covariate was excluded in the Propensity Score Model logistic regression.
3 An asterisk (*) indicates that the averages for the matched control group and treatment group are statistically equivalent.
Notes:

APPENDIX B
Covariate
Age 27.695 19.449 23.517 19.493 45% N/A
Female 0.576 0.471 0.468 0.470 102% *
White 0.727 0.589 0.637 0.589 67%
Black 0.239 0.392 0.344 0.391 71%
County: Adams 0.042 0.000 0.000 0.000 N/A YES N/A
County: Butler 0.300 0.196 0.265 0.197 33%
County: Lawrence 0.074 0.000 0.000 0.000 N/A YES N/A
County: Lucas 0.471 0.804 0.735 0.803 78%
Medicaid Member Months 9.475 11.197 11.320 11.192 111%
MCP Member Months 7.156 8.408 7.900 8.412 58%
Dual Eligibility Member Months 0.282 0.177 0.314 0.178 -26%
Waiver Member Months 0.363 0.198 0.340 0.199 14%
ABD Member Months 1.005 2.408 2.890 2.391 130%
CFC Member Months 7.018 8.107 7.298 8.114 25%
Control Treatment Control Treatment Balanced3
Pharmacist on Site (All Ages, All CMHC)
Summary of Covariate Averages Before and After Propensity Score Matching
Full Group Matched SamplesBias
Reduction1
Excluded
from PSM2

APPENDIX B
Covariate Control Treatment Control Treatment Balanced3
Pharmacist on Site (All Ages, All CMHC)
Summary of Covariate Averages Before and After Propensity Score Matching
Full Group Matched SamplesBias
Reduction1
Excluded
from PSM2
# Mental Health Center Visits 1.069 18.412 15.930 18.181 91%
# ED Mental Health Visits 0.012 0.055 0.075 0.055 136%
# IP Mental Health Visits 0.003 0.032 0.029 0.032 92% *
13 or More Mental Health Rx 0.031 0.146 0.175 0.146 119%
ADHD 0.032 0.257 0.281 0.254 109%
Acute bronchitis 0.056 0.053 0.073 0.052 -659%
Alcohol-related disorders 0.006 0.007 0.012 0.007 395% *
Anxiety Disorders 0.028 0.066 0.100 0.066 168%
Asthma 0.060 0.139 0.152 0.137 115% *
Autism 0.003 0.016 0.022 0.016 132% *
Bipolar Disorder 0.014 0.063 0.076 0.062 121%
Blindness and vision defects 0.150 0.281 0.335 0.280 137%
Cancer 0.014 0.012 0.018 0.012 -207% *
Cardiac dysrhythmias 0.027 0.030 0.044 0.030 518%

APPENDIX B
Covariate Control Treatment Control Treatment Balanced3
Pharmacist on Site (All Ages, All CMHC)
Summary of Covariate Averages Before and After Propensity Score Matching
Full Group Matched SamplesBias
Reduction1
Excluded
from PSM2
Chronic obstructive pulmonary disease and
bronchiectasis0.059 0.053 0.082 0.053 -336%
Conduct Disorder 0.011 0.181 0.187 0.178 104% *
Congestive heart failure; nonhypertensive 0.014 0.005 0.008 0.005 54% *
Coronary atherosclerosis and other heart
disease0.023 0.011 0.019 0.011 29%
Cystic fibrosis 0.000 0.000 0.001 0.000 -479% YES *
Delirium, dementia, and amnestic and other
cognitive diseases0.010 0.004 0.007 0.004 48% *
Depression 0.047 0.203 0.275 0.203 135%
Developmental disorders 0.037 0.122 0.138 0.121 116%
Diabetes 0.061 0.060 0.085 0.061 -4956%
Epilepsy; convulsions 0.019 0.035 0.049 0.035 173%
Esophageal disorders 0.027 0.032 0.048 0.032 387%
Essential hypertension 0.083 0.070 0.106 0.070 -158%
HIV infection 0.002 0.002 0.004 0.002 5490% YES *
Intracranial injury 0.006 0.010 0.011 0.010 121% *

APPENDIX B
Covariate Control Treatment Control Treatment Balanced3
Pharmacist on Site (All Ages, All CMHC)
Summary of Covariate Averages Before and After Propensity Score Matching
Full Group Matched SamplesBias
Reduction1
Excluded
from PSM2
Mental Disorder Not Otherwise Specified
(NOS)0.005 0.013 0.022 0.013 167%
Neoplasms of unspecified nature or uncertain
behavior0.035 0.061 0.083 0.060 173%
Obsessive-Compulsive Disorders 0.001 0.003 0.005 0.003 155% YES *
Osteoarthritis 0.031 0.028 0.045 0.028 -572%
Other Developmental Disorder 0.003 0.069 0.069 0.069 100% *
Other nervous system disorders 0.062 0.098 0.144 0.098 205%
PTSD 0.005 0.030 0.042 0.030 135%
Pregnancy 0.040 0.016 0.021 0.016 73% *
Psychotic Disorder 0.015 0.071 0.099 0.071 136%
Spondylosis; intervertebral disc disorders;
other back0.100 0.120 0.172 0.120 337%
Substance-related disorders 0.019 0.020 0.034 0.020 2272%
Thyroid disorders 0.021 0.021 0.028 0.022 1785% *
1 Bias Reduction represents the reduction in the standardized bias coefficient as a result of the matching process. A figure greater than 0% and less than 200%
represents reduced bias.
2 Indicates if the covariate was excluded in the Propensity Score Model logistic regression.
3 An asterisk (*) indicates that the averages for the matched control group and treatment group are statistically equivalent.
Notes:

APPENDIX B
Covariate
Age 27.695 35.522 37.392 34.839 134%
Female 0.576 0.557 0.564 0.559 76% *
White 0.727 0.670 0.732 0.684 15%
Black 0.239 0.313 0.250 0.299 34%
County: Adams 0.042 0.050 0.060 0.053 170% *
County: Butler 0.300 0.000 0.189 0.000 26% YES
County: Lawrence 0.074 0.094 0.120 0.099 190%
County: Lucas 0.471 0.695 0.579 0.669 60%
Medicaid Member Months 9.475 11.032 11.154 10.926 120%
MCP Member Months 7.156 7.314 6.752 7.220 -195%
Dual Eligibility Member Months 0.282 0.422 0.555 0.430 177%
Waiver Member Months 0.363 0.596 0.753 0.601 156%
ABD Member Months 1.005 4.473 4.255 4.073 104% *
CFC Member Months 7.018 4.457 4.326 4.734 116%
Control Treatment Control Treatment Balanced3
No Pharmacist on Site (All Ages, All CMHC)
Summary of Covariate Averages Before and After Propensity Score Matching
Full Group Matched SamplesBias
Reduction1
Excluded
from PSM2

APPENDIX B
Covariate Control Treatment Control Treatment Balanced3
No Pharmacist on Site (All Ages, All CMHC)
Summary of Covariate Averages Before and After Propensity Score Matching
Full Group Matched SamplesBias
Reduction1
Excluded
from PSM2
# Mental Health Center Visits 1.069 22.684 16.078 18.404 92%
# ED Mental Health Visits 0.012 0.091 0.099 0.085 114% *
# IP Mental Health Visits 0.003 0.034 0.033 0.031 104% *
13 or More Mental Health Rx 0.031 0.303 0.269 0.263 102% *
ADHD 0.032 0.144 0.166 0.141 117%
Acute bronchitis 0.056 0.092 0.101 0.092 123% *
Alcohol-related disorders 0.006 0.029 0.031 0.026 118% *
Anxiety Disorders 0.028 0.091 0.117 0.091 132%
Asthma 0.060 0.118 0.117 0.114 104% *
Autism 0.003 0.003 0.005 0.004 224% *
Bipolar Disorder 0.014 0.159 0.159 0.141 109%
Blindness and vision defects 0.150 0.258 0.273 0.251 119%
Cancer 0.014 0.020 0.028 0.019 222%
Cardiac dysrhythmias 0.027 0.067 0.070 0.060 121%

APPENDIX B
Covariate Control Treatment Control Treatment Balanced3
No Pharmacist on Site (All Ages, All CMHC)
Summary of Covariate Averages Before and After Propensity Score Matching
Full Group Matched SamplesBias
Reduction1
Excluded
from PSM2
Chronic obstructive pulmonary disease and
bronchiectasis0.059 0.142 0.163 0.137 126%
Conduct Disorder 0.011 0.073 0.088 0.070 120%
Congestive heart failure; nonhypertensive 0.014 0.022 0.025 0.022 130% *
Coronary atherosclerosis and other heart
disease0.023 0.045 0.054 0.045 134%
Cystic fibrosis 0.000 0.000 0.000 0.000 N/A YES N/A
Delirium, dementia, and amnestic and other
cognitive diseases0.010 0.012 0.015 0.013 162% *
Depression 0.047 0.351 0.402 0.332 118%
Developmental disorders 0.037 0.065 0.073 0.063 133%
Diabetes 0.061 0.147 0.158 0.137 121%
Epilepsy; convulsions 0.019 0.042 0.048 0.041 127% *
Esophageal disorders 0.027 0.071 0.081 0.067 126%
Essential hypertension 0.083 0.211 0.232 0.198 122%
HIV infection 0.002 0.003 0.004 0.003 155% *
Intracranial injury 0.006 0.014 0.016 0.013 129% *

APPENDIX B
Covariate Control Treatment Control Treatment Balanced3
No Pharmacist on Site (All Ages, All CMHC)
Summary of Covariate Averages Before and After Propensity Score Matching
Full Group Matched SamplesBias
Reduction1
Excluded
from PSM2
Mental Disorder Not Otherwise Specified
(NOS)0.005 0.030 0.031 0.029 108% *
Neoplasms of unspecified nature or uncertain
behavior0.035 0.087 0.104 0.085 130%
Obsessive-Compulsive Disorders 0.001 0.008 0.010 0.008 123% *
Osteoarthritis 0.031 0.084 0.095 0.077 128%
Other Developmental Disorder 0.003 0.014 0.014 0.014 102% *
Other nervous system disorders 0.062 0.139 0.153 0.131 124%
PTSD 0.005 0.031 0.034 0.029 113% *
Pregnancy 0.040 0.027 0.031 0.028 78% *
Psychotic Disorder 0.015 0.278 0.232 0.232 100% *
Spondylosis; intervertebral disc disorders;
other back0.100 0.250 0.278 0.240 122%
Substance-related disorders 0.019 0.064 0.074 0.062 122%
Thyroid disorders 0.021 0.056 0.062 0.053 120%
1 Bias Reduction represents the reduction in the standardized bias coefficient as a result of the matching process. A figure greater than 0% and less than 200%
represents reduced bias.
2 Indicates if the covariate was excluded in the Propensity Score Model logistic regression.
3 An asterisk (*) indicates that the averages for the matched control group and treatment group are statistically equivalent.
Notes:

APPENDIX B
Covariate
Age 27.809 28.711 29.781 27.162 403%
Female 0.580 0.508 0.518 0.518 99% *
White 0.568 0.537 0.558 0.540 42% *
Black 0.395 0.444 0.420 0.437 64% *
County: Adams 0.000 0.000 0.000 0.000 N/A N/A
County: Butler 0.000 0.000 0.000 0.000 N/A N/A
County: Lawrence 0.000 0.000 0.000 0.000 N/A N/A
County: Lucas 1.000 1.000 1.000 1.000 N/A N/A
Medicaid Member Months 9.324 11.105 11.100 10.764 125%
MCP Member Months 7.066 7.623 7.117 7.620 9%
Dual Eligibility Member Months 0.284 0.338 0.460 0.322 329%
Waiver Member Months 0.319 0.369 0.513 0.359 372%
ABD Member Months 0.917 3.615 2.859 2.668 106% *
CFC Member Months 6.949 5.890 6.161 6.575 139%
Control Treatment Control Treatment Balanced3
Lucas County (All Ages, All CMHC)
Summary of Covariate Averages Before and After Propensity Score Matching
Full Group Matched SamplesBias
Reduction1
Excluded
from PSM2

APPENDIX B
Covariate Control Treatment Control Treatment Balanced3
Lucas County (All Ages, All CMHC)
Summary of Covariate Averages Before and After Propensity Score Matching
Full Group Matched SamplesBias
Reduction1
Excluded
from PSM2
# Mental Health Center Visits 0.602 23.366 8.791 11.132 87%
# ED Mental Health Visits 0.008 0.079 0.060 0.054 107% *
# IP Mental Health Visits 0.003 0.039 0.029 0.027 105% *
13 or More Mental Health Rx 0.018 0.231 0.147 0.137 104% *
ADHD 0.022 0.193 0.181 0.154 112%
Acute bronchitis 0.041 0.057 0.059 0.054 128% *
Alcohol-related disorders 0.005 0.025 0.026 0.021 122% *
Anxiety Disorders 0.020 0.059 0.078 0.056 146%
Asthma 0.065 0.128 0.129 0.118 115% *
Autism 0.002 0.008 0.012 0.009 133% *
Bipolar Disorder 0.009 0.126 0.103 0.085 113%
Blindness and vision defects 0.147 0.259 0.284 0.236 139%
Cancer 0.013 0.014 0.019 0.014 390%
Cardiac dysrhythmias 0.027 0.053 0.053 0.041 143%

APPENDIX B
Covariate Control Treatment Control Treatment Balanced3
Lucas County (All Ages, All CMHC)
Summary of Covariate Averages Before and After Propensity Score Matching
Full Group Matched SamplesBias
Reduction1
Excluded
from PSM2
Chronic obstructive pulmonary disease and
bronchiectasis0.043 0.086 0.089 0.072 136%
Conduct Disorder 0.010 0.120 0.111 0.095 111%
Congestive heart failure; nonhypertensive 0.014 0.014 0.018 0.014 840% *
Coronary atherosclerosis and other heart
disease0.019 0.025 0.029 0.023 201%
Cystic fibrosis 0.000 0.000 0.000 0.000 350% YES *
Delirium, dementia, and amnestic and other
cognitive diseases0.009 0.009 0.013 0.009 4798%
Depression 0.043 0.293 0.308 0.242 121%
Developmental disorders 0.033 0.093 0.098 0.079 127%
Diabetes 0.056 0.102 0.114 0.084 159%
Epilepsy; convulsions 0.019 0.036 0.044 0.032 159%
Esophageal disorders 0.022 0.048 0.051 0.039 140%
Essential hypertension 0.076 0.147 0.158 0.121 147%
HIV infection 0.002 0.003 0.004 0.003 347% *
Intracranial injury 0.006 0.013 0.014 0.010 156% *

APPENDIX B
Covariate Control Treatment Control Treatment Balanced3
Lucas County (All Ages, All CMHC)
Summary of Covariate Averages Before and After Propensity Score Matching
Full Group Matched SamplesBias
Reduction1
Excluded
from PSM2
Mental Disorder Not Otherwise Specified
(NOS)0.002 0.020 0.016 0.014 111% *
Neoplasms of unspecified nature or uncertain
behavior0.029 0.068 0.075 0.054 146%
Obsessive-Compulsive Disorders 0.001 0.002 0.003 0.002 198% *
Osteoarthritis 0.031 0.060 0.062 0.048 144%
Other Developmental Disorder 0.003 0.040 0.038 0.033 110% *
Other nervous system disorders 0.054 0.117 0.124 0.096 139%
PTSD 0.003 0.027 0.021 0.021 99% *
Pregnancy 0.043 0.023 0.031 0.025 71% *
Psychotic Disorder 0.013 0.231 0.165 0.148 107%
Spondylosis; intervertebral disc disorders;
other back0.090 0.179 0.202 0.155 147%
Substance-related disorders 0.014 0.046 0.049 0.042 117% *
Thyroid disorders 0.017 0.035 0.042 0.029 162%
1 Bias Reduction represents the reduction in the standardized bias coefficient as a result of the matching process. A figure greater than 0% and less than 200%
represents reduced bias.
2 Indicates if the covariate was excluded in the Propensity Score Model logistic regression.
3 An asterisk (*) indicates that the averages for the matched control group and treatment group are statistically equivalent.
Notes:

APPENDIX B
Covariate
Age 9.293 11.166 11.335 10.856 128%
Female 0.502 0.386 0.395 0.406 109% *
White 0.545 0.522 0.533 0.526 66% *
Black 0.421 0.458 0.447 0.453 85% *
County: Adams 0.000 0.000 0.000 0.000 N/A N/A
County: Butler 0.000 0.000 0.000 0.000 N/A N/A
County: Lawrence 0.000 0.000 0.000 0.000 N/A N/A
County: Lucas 1.000 1.000 1.000 1.000 N/A N/A
Medicaid Member Months 10.775 11.383 11.205 11.212 99% *
MCP Member Months 9.835 8.950 8.648 9.264 167%
Dual Eligibility Member Months 0.004 0.010 0.014 0.010 138% *
Waiver Member Months 0.020 0.003 0.006 0.004 75% *
ABD Member Months 0.390 1.620 1.321 1.142 113% *
CFC Member Months 10.378 9.754 9.877 10.061 129% *
Control Treatment Control Treatment Balanced3
Lucas County (Under 18, All CMHC)
Summary of Covariate Averages Before and After Propensity Score Matching
Full Group Matched SamplesBias
Reduction1
Excluded
from PSM2

APPENDIX B
Covariate Control Treatment Control Treatment Balanced3
Lucas County (Under 18, All CMHC)
Summary of Covariate Averages Before and After Propensity Score Matching
Full Group Matched SamplesBias
Reduction1
Excluded
from PSM2
# Mental Health Center Visits 0.664 23.426 8.805 11.476 86%
# ED Mental Health Visits 0.002 0.026 0.019 0.017 107% *
# IP Mental Health Visits 0.002 0.033 0.019 0.018 104% *
13 or More Mental Health Rx 0.005 0.086 0.036 0.045 89% *
ADHD 0.040 0.397 0.338 0.296 110%
Acute bronchitis 0.044 0.027 0.038 0.029 43% *
Alcohol-related disorders 0.001 0.005 0.003 0.003 100% *
Anxiety Disorders 0.006 0.039 0.044 0.036 119% *
Asthma 0.090 0.139 0.155 0.130 148%
Autism 0.003 0.015 0.015 0.009 135% *
Bipolar Disorder 0.001 0.022 0.009 0.014 78% *
Blindness and vision defects 0.158 0.282 0.289 0.266 117% *
Cancer 0.001 0.001 0.003 0.001 -289% YES *
Cardiac dysrhythmias 0.005 0.016 0.015 0.012 127% *

APPENDIX B
Covariate Control Treatment Control Treatment Balanced3
Lucas County (Under 18, All CMHC)
Summary of Covariate Averages Before and After Propensity Score Matching
Full Group Matched SamplesBias
Reduction1
Excluded
from PSM2
Chronic obstructive pulmonary disease and
bronchiectasis0.014 0.015 0.023 0.015 547% *
Conduct Disorder 0.019 0.247 0.211 0.184 109%
Congestive heart failure; nonhypertensive 0.000 0.000 0.000 0.000 -28% YES *
Coronary atherosclerosis and other heart
disease0.000 0.000 0.000 0.000 100% YES *
Cystic fibrosis 0.000 0.000 0.000 0.000 439% YES *
Delirium, dementia, and amnestic and other
cognitive diseases0.001 0.003 0.003 0.003 100% *
Depression 0.012 0.133 0.110 0.087 116%
Developmental disorders 0.040 0.138 0.130 0.108 120%
Diabetes 0.004 0.010 0.011 0.009 117% *
Epilepsy; convulsions 0.012 0.023 0.022 0.017 143% *
Esophageal disorders 0.009 0.009 0.007 0.008 719% *
Essential hypertension 0.003 0.007 0.007 0.006 124% *
HIV infection 0.000 0.000 0.000 0.000 -28% YES *
Intracranial injury 0.005 0.008 0.007 0.006 169% *

APPENDIX B
Covariate Control Treatment Control Treatment Balanced3
Lucas County (Under 18, All CMHC)
Summary of Covariate Averages Before and After Propensity Score Matching
Full Group Matched SamplesBias
Reduction1
Excluded
from PSM2
Mental Disorder Not Otherwise Specified
(NOS)0.001 0.004 0.004 0.003 120% *
Neoplasms of unspecified nature or uncertain
behavior0.011 0.044 0.035 0.037 94% *
Obsessive-Compulsive Disorders 0.000 0.002 0.001 0.002 60% YES *
Osteoarthritis 0.000 0.000 0.000 0.000 2% YES *
Other Developmental Disorder 0.005 0.083 0.068 0.060 108% *
Other nervous system disorders 0.017 0.049 0.052 0.039 135%
PTSD 0.002 0.035 0.023 0.026 94% *
Pregnancy 0.003 0.004 0.006 0.005 138% *
Psychotic Disorder 0.001 0.011 0.006 0.008 89% *
Spondylosis; intervertebral disc disorders;
other back0.015 0.026 0.026 0.024 123% *
Substance-related disorders 0.004 0.014 0.014 0.011 122% *
Thyroid disorders 0.002 0.006 0.007 0.004 153% *
1 Bias Reduction represents the reduction in the standardized bias coefficient as a result of the matching process. A figure greater than 0% and less than 200%
represents reduced bias.
2 Indicates if the covariate was excluded in the Propensity Score Model logistic regression.
3 An asterisk (*) indicates that the averages for the matched control group and treatment group are statistically equivalent.
Notes:

APPENDIX B
Covariate
Age 41.492 43.532 42.819 42.607 111% *
Female 0.638 0.611 0.643 0.621 20% *
White 0.586 0.549 0.582 0.551 14%
Black 0.376 0.431 0.391 0.426 39%
County: Adams 0.000 0.000 0.000 0.000 N/A N/A
County: Butler 0.000 0.000 0.000 0.000 N/A N/A
County: Lawrence 0.000 0.000 0.000 0.000 N/A N/A
County: Lucas 1.000 1.000 1.000 1.000 N/A N/A
Medicaid Member Months 8.251 10.870 10.756 10.266 124%
MCP Member Months 5.020 6.501 5.555 5.930 75%
Dual Eligibility Member Months 0.491 0.616 0.737 0.663 154% *
Waiver Member Months 0.540 0.679 0.743 0.670 149% *
ABD Member Months 1.306 5.300 3.832 3.988 97% *
CFC Member Months 4.415 2.626 3.366 3.257 94% *
Control Treatment Control Treatment Balanced3
Lucas County (18 and Over, All CMHC)
Summary of Covariate Averages Before and After Propensity Score Matching
Full Group Matched SamplesBias
Reduction1
Excluded
from PSM2

APPENDIX B
Covariate Control Treatment Control Treatment Balanced3
Lucas County (18 and Over, All CMHC)
Summary of Covariate Averages Before and After Propensity Score Matching
Full Group Matched SamplesBias
Reduction1
Excluded
from PSM2
# Mental Health Center Visits 0.557 23.315 8.804 10.534 90%
# ED Mental Health Visits 0.012 0.124 0.095 0.092 102% *
# IP Mental Health Visits 0.003 0.044 0.036 0.035 103% *
13 or More Mental Health Rx 0.028 0.353 0.230 0.214 104% *
ADHD 0.009 0.021 0.026 0.023 116% *
Acute bronchitis 0.038 0.082 0.081 0.074 114% *
Alcohol-related disorders 0.009 0.042 0.039 0.034 112% *
Anxiety Disorders 0.031 0.076 0.097 0.075 138%
Asthma 0.046 0.120 0.109 0.107 103% *
Autism 0.002 0.002 0.009 0.003 1221% YES
Bipolar Disorder 0.015 0.214 0.181 0.155 111%
Blindness and vision defects 0.139 0.240 0.237 0.214 121% *
Cancer 0.021 0.025 0.030 0.027 157% *
Cardiac dysrhythmias 0.043 0.085 0.081 0.068 128% *

APPENDIX B
Covariate Control Treatment Control Treatment Balanced3
Lucas County (18 and Over, All CMHC)
Summary of Covariate Averages Before and After Propensity Score Matching
Full Group Matched SamplesBias
Reduction1
Excluded
from PSM2
Chronic obstructive pulmonary disease and
bronchiectasis0.065 0.146 0.142 0.124 120% *
Conduct Disorder 0.003 0.012 0.015 0.010 138% *
Congestive heart failure; nonhypertensive 0.024 0.027 0.032 0.026 305% *
Coronary atherosclerosis and other heart
disease0.034 0.047 0.041 0.040 110% *
Cystic fibrosis 0.000 0.000 0.000 0.000 N/A YES N/A
Delirium, dementia, and amnestic and other
cognitive diseases0.015 0.014 0.019 0.014 -295% *
Depression 0.065 0.428 0.471 0.383 119%
Developmental disorders 0.028 0.055 0.054 0.051 110% *
Diabetes 0.094 0.179 0.167 0.147 122% *
Epilepsy; convulsions 0.023 0.048 0.057 0.043 148%
Esophageal disorders 0.031 0.082 0.072 0.068 107% *
Essential hypertension 0.131 0.265 0.252 0.227 117%
HIV infection 0.004 0.006 0.009 0.006 261% *
Intracranial injury 0.006 0.017 0.018 0.014 131% *

APPENDIX B
Covariate Control Treatment Control Treatment Balanced3
Lucas County (18 and Over, All CMHC)
Summary of Covariate Averages Before and After Propensity Score Matching
Full Group Matched SamplesBias
Reduction1
Excluded
from PSM2
Mental Disorder Not Otherwise Specified
(NOS)0.004 0.033 0.026 0.024 105% *
Neoplasms of unspecified nature or uncertain
behavior0.042 0.087 0.096 0.074 144%
Obsessive-Compulsive Disorders 0.002 0.002 0.006 0.002 952% YES *
Osteoarthritis 0.054 0.111 0.106 0.092 124% *
Other Developmental Disorder 0.001 0.004 0.003 0.005 49% *
Other nervous system disorders 0.082 0.174 0.179 0.152 126%
PTSD 0.003 0.020 0.017 0.017 104% *
Pregnancy 0.073 0.038 0.055 0.048 77% *
Psychotic Disorder 0.022 0.416 0.301 0.278 105% *
Spondylosis; intervertebral disc disorders;
other back0.146 0.308 0.314 0.278 120%
Substance-related disorders 0.022 0.073 0.081 0.069 118% *
Thyroid disorders 0.028 0.059 0.060 0.050 127% *
1 Bias Reduction represents the reduction in the standardized bias coefficient as a result of the matching process. A figure greater than 0% and less than 200%
represents reduced bias.
2 Indicates if the covariate was excluded in the Propensity Score Model logistic regression.
3 An asterisk (*) indicates that the averages for the matched control group and treatment group are statistically equivalent.
Notes:

APPENDIX B
Covariate
Age 28.699 30.598 28.407 28.153 113% *
Female 0.561 0.508 0.502 0.518 129% *
White 0.597 0.545 0.562 0.570 115% *
Black 0.375 0.437 0.417 0.407 116% *
County: Adams 0.000 0.000 0.000 0.000 N/A N/A
County: Butler 0.000 0.000 0.000 0.000 N/A N/A
County: Lawrence 0.000 0.000 0.000 0.000 N/A N/A
County: Lucas 1.000 1.000 1.000 1.000 N/A N/A
Medicaid Member Months 11.243 11.592 11.398 11.375 106% *
MCP Member Months 7.637 7.685 7.462 7.456 112% *
Dual Eligibility Member Months 0.334 0.401 0.401 0.387 121% *
Waiver Member Months 0.359 0.439 0.441 0.441 99% *
ABD Member Months 1.855 4.241 2.765 2.551 109% *
CFC Member Months 7.272 5.467 6.514 6.708 111% *
Control Treatment Control Treatment Balanced3
Lucas County (All Ages, CMHC Experience)
Summary of Covariate Averages Before and After Propensity Score Matching
Full Group Matched SamplesBias
Reduction1
Excluded
from PSM2

APPENDIX B
Covariate Control Treatment Control Treatment Balanced3
Lucas County (All Ages, CMHC Experience)
Summary of Covariate Averages Before and After Propensity Score Matching
Full Group Matched SamplesBias
Reduction1
Excluded
from PSM2
# Mental Health Center Visits 10.604 29.623 14.672 15.943 91%
# ED Mental Health Visits 0.078 0.098 0.079 0.081 93% *
# IP Mental Health Visits 0.034 0.049 0.042 0.043 90% *
13 or More Mental Health Rx 0.088 0.285 0.138 0.127 106% *
ADHD 0.148 0.232 0.212 0.212 101% *
Acute bronchitis 0.053 0.062 0.057 0.055 128% *
Alcohol-related disorders 0.026 0.029 0.024 0.024 90% *
Anxiety Disorders 0.116 0.069 0.084 0.085 101% *
Asthma 0.098 0.134 0.119 0.114 114% *
Autism 0.009 0.010 0.010 0.010 39% *
Bipolar Disorder 0.111 0.159 0.128 0.118 121% *
Blindness and vision defects 0.233 0.278 0.267 0.257 122% *
Cancer 0.018 0.016 0.016 0.017 165% *
Cardiac dysrhythmias 0.043 0.061 0.046 0.045 106% *
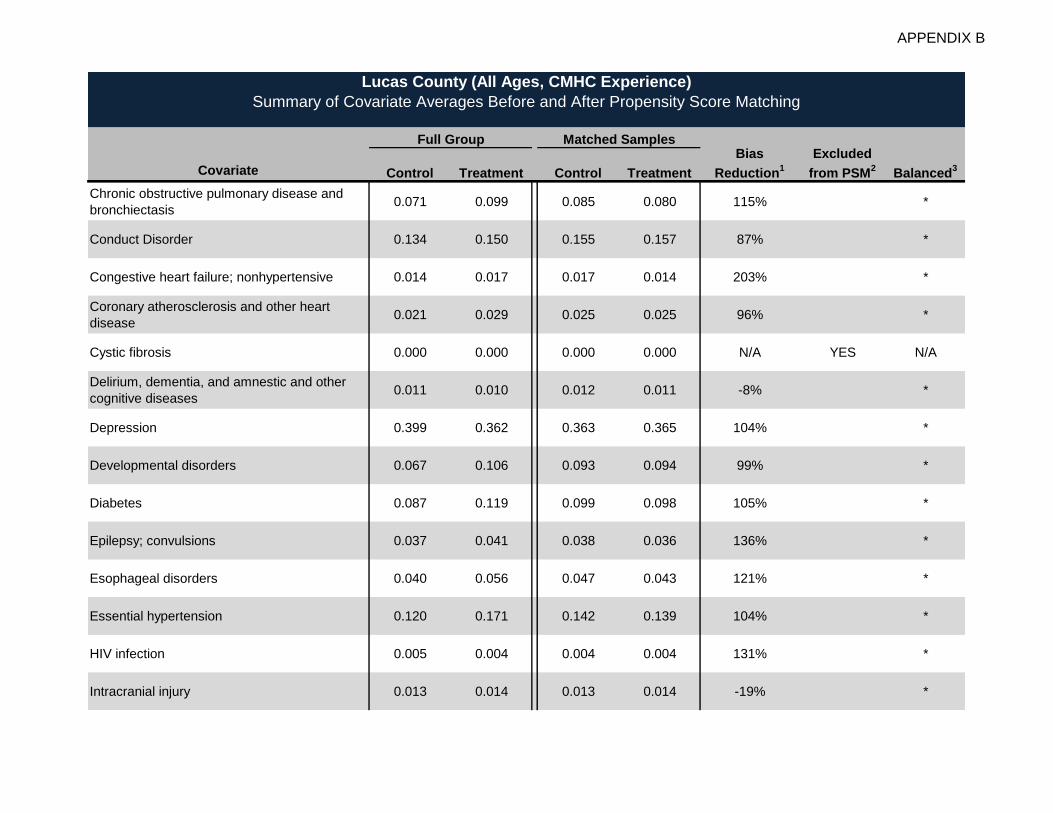
APPENDIX B
Covariate Control Treatment Control Treatment Balanced3
Lucas County (All Ages, CMHC Experience)
Summary of Covariate Averages Before and After Propensity Score Matching
Full Group Matched SamplesBias
Reduction1
Excluded
from PSM2
Chronic obstructive pulmonary disease and
bronchiectasis0.071 0.099 0.085 0.080 115% *
Conduct Disorder 0.134 0.150 0.155 0.157 87% *
Congestive heart failure; nonhypertensive 0.014 0.017 0.017 0.014 203% *
Coronary atherosclerosis and other heart
disease0.021 0.029 0.025 0.025 96% *
Cystic fibrosis 0.000 0.000 0.000 0.000 N/A YES N/A
Delirium, dementia, and amnestic and other
cognitive diseases0.011 0.010 0.012 0.011 -8% *
Depression 0.399 0.362 0.363 0.365 104% *
Developmental disorders 0.067 0.106 0.093 0.094 99% *
Diabetes 0.087 0.119 0.099 0.098 105% *
Epilepsy; convulsions 0.037 0.041 0.038 0.036 136% *
Esophageal disorders 0.040 0.056 0.047 0.043 121% *
Essential hypertension 0.120 0.171 0.142 0.139 104% *
HIV infection 0.005 0.004 0.004 0.004 131% *
Intracranial injury 0.013 0.014 0.013 0.014 -19% *

APPENDIX B
Covariate Control Treatment Control Treatment Balanced3
Lucas County (All Ages, CMHC Experience)
Summary of Covariate Averages Before and After Propensity Score Matching
Full Group Matched SamplesBias
Reduction1
Excluded
from PSM2
Mental Disorder Not Otherwise Specified
(NOS)0.022 0.024 0.020 0.021 38% *
Neoplasms of unspecified nature or uncertain
behavior0.059 0.077 0.068 0.066 112% *
Obsessive-Compulsive Disorders 0.003 0.003 0.001 0.002 284% *
Osteoarthritis 0.053 0.071 0.057 0.056 106% *
Other Developmental Disorder 0.039 0.051 0.053 0.053 102% *
Other nervous system disorders 0.113 0.133 0.118 0.114 123% *
PTSD 0.039 0.034 0.031 0.034 168% *
Pregnancy 0.058 0.020 0.023 0.028 115% *
Psychotic Disorder 0.135 0.289 0.200 0.186 109% *
Spondylosis; intervertebral disc disorders;
other back0.193 0.202 0.187 0.180 176% *
Substance-related disorders 0.093 0.055 0.055 0.060 114% *
Thyroid disorders 0.032 0.040 0.036 0.034 130% *
1 Bias Reduction represents the reduction in the standardized bias coefficient as a result of the matching process. A figure greater than 0% and less than 200%
represents reduced bias.
2 Indicates if the covariate was excluded in the Propensity Score Model logistic regression.
3 An asterisk (*) indicates that the averages for the matched control group and treatment group are statistically equivalent.
Notes:

APPENDIX B
Covariate
Age 27.755 21.663 25.397 21.663 31%
Female 0.581 0.508 0.555 0.508 36%
White 0.567 0.507 0.569 0.507 -3%
Black 0.396 0.470 0.409 0.470 18%
County: Adams 0.000 0.000 0.000 0.000 N/A N/A
County: Butler 0.000 0.000 0.000 0.000 N/A N/A
County: Lawrence 0.000 0.000 0.000 0.000 N/A N/A
County: Lucas 1.000 1.000 1.000 1.000 N/A N/A
Medicaid Member Months 9.208 9.286 9.610 9.286 550%
MCP Member Months 7.031 7.387 7.065 7.387 6% *
Dual Eligibility Member Months 0.281 0.103 0.161 0.103 60% *
Waiver Member Months 0.316 0.107 0.112 0.107 97% *
ABD Member Months 0.860 1.275 1.648 1.275 179%
CFC Member Months 6.929 7.469 7.171 7.469 43% *
Control Treatment Control Treatment Balanced3
Lucas County (All Ages, No CMHC Experience)
Summary of Covariate Averages Before and After Propensity Score Matching
Full Group Matched SamplesBias
Reduction1
Excluded
from PSM2

APPENDIX B
Covariate Control Treatment Control Treatment Balanced3
Lucas County (All Ages, No CMHC Experience)
Summary of Covariate Averages Before and After Propensity Score Matching
Full Group Matched SamplesBias
Reduction1
Excluded
from PSM2
# Mental Health Center Visits 0.000 0.000 0.000 0.000 N/A YES N/A
# ED Mental Health Visits 0.004 0.012 0.013 0.012 106% *
# IP Mental Health Visits 0.001 0.002 0.003 0.002 190% *
13 or More Mental Health Rx 0.014 0.028 0.040 0.028 169% *
ADHD 0.015 0.046 0.045 0.046 98% *
Acute bronchitis 0.040 0.036 0.045 0.036 -107% *
Alcohol-related disorders 0.004 0.009 0.009 0.009 113% *
Anxiety Disorders 0.015 0.023 0.029 0.023 160% *
Asthma 0.063 0.109 0.122 0.109 125% *
Autism 0.002 0.003 0.003 0.003 170% YES *
Bipolar Disorder 0.003 0.005 0.006 0.005 164% YES *
Blindness and vision defects 0.142 0.189 0.262 0.189 236%
Cancer 0.012 0.007 0.014 0.007 -28% *
Cardiac dysrhythmias 0.026 0.026 0.042 0.026 2244%

APPENDIX B
Covariate Control Treatment Control Treatment Balanced3
Lucas County (All Ages, No CMHC Experience)
Summary of Covariate Averages Before and After Propensity Score Matching
Full Group Matched SamplesBias
Reduction1
Excluded
from PSM2
Chronic obstructive pulmonary disease and
bronchiectasis0.042 0.038 0.068 0.038 -541%
Conduct Disorder 0.002 0.004 0.005 0.004 159% YES *
Congestive heart failure; nonhypertensive 0.014 0.007 0.016 0.007 -21% YES
Coronary atherosclerosis and other heart
disease0.019 0.011 0.012 0.011 83% *
Cystic fibrosis 0.000 0.001 0.000 0.001 -86% YES *
Delirium, dementia, and amnestic and other
cognitive diseases0.009 0.007 0.006 0.007 130% YES *
Depression 0.021 0.035 0.055 0.035 218%
Developmental disorders 0.031 0.045 0.046 0.045 109% *
Diabetes 0.054 0.037 0.069 0.037 -73%
Epilepsy; convulsions 0.018 0.018 0.024 0.018 3539% *
Esophageal disorders 0.020 0.020 0.027 0.020 435241% *
Essential hypertension 0.074 0.057 0.110 0.057 -187%
HIV infection 0.002 0.001 0.004 0.001 -58% YES *
Intracranial injury 0.006 0.007 0.011 0.007 263% *

APPENDIX B
Covariate Control Treatment Control Treatment Balanced3
Lucas County (All Ages, No CMHC Experience)
Summary of Covariate Averages Before and After Propensity Score Matching
Full Group Matched SamplesBias
Reduction1
Excluded
from PSM2
Mental Disorder Not Otherwise Specified
(NOS)0.001 0.003 0.004 0.003 124% YES *
Neoplasms of unspecified nature or uncertain
behavior0.027 0.034 0.057 0.034 396%
Obsessive-Compulsive Disorders 0.001 0.001 0.002 0.001 -197% YES *
Osteoarthritis 0.030 0.020 0.031 0.020 -8% *
Other Developmental Disorder 0.001 0.000 0.001 0.000 9% YES *
Other nervous system disorders 0.050 0.057 0.094 0.057 559%
PTSD 0.001 0.001 0.001 0.001 100% YES *
Pregnancy 0.042 0.034 0.069 0.034 -253%
Psychotic Disorder 0.006 0.012 0.012 0.012 100% *
Spondylosis; intervertebral disc disorders;
other back0.084 0.092 0.159 0.092 810%
Substance-related disorders 0.009 0.015 0.021 0.015 182% *
Thyroid disorders 0.016 0.014 0.019 0.014 -136% *
1 Bias Reduction represents the reduction in the standardized bias coefficient as a result of the matching process. A figure greater than 0% and less than 200%
represents reduced bias.
2 Indicates if the covariate was excluded in the Propensity Score Model logistic regression.
3 An asterisk (*) indicates that the averages for the matched control group and treatment group are statistically equivalent.
Notes:
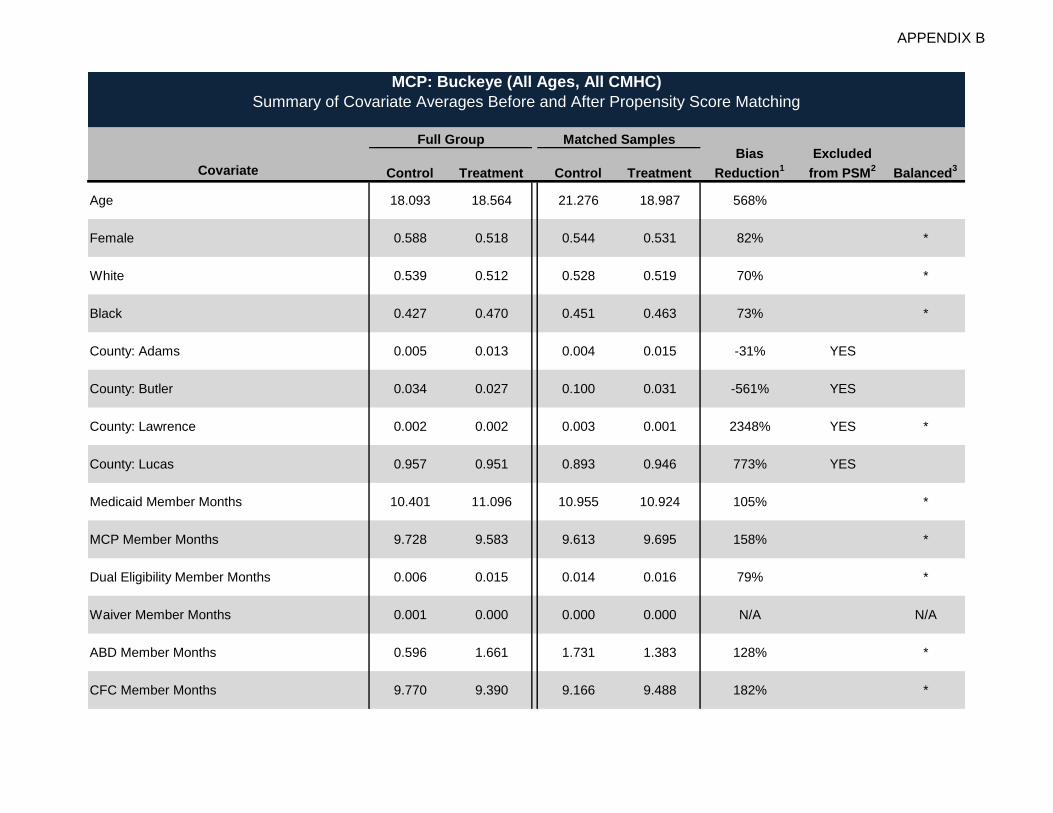
APPENDIX B
Covariate
Age 18.093 18.564 21.276 18.987 568%
Female 0.588 0.518 0.544 0.531 82% *
White 0.539 0.512 0.528 0.519 70% *
Black 0.427 0.470 0.451 0.463 73% *
County: Adams 0.005 0.013 0.004 0.015 -31% YES
County: Butler 0.034 0.027 0.100 0.031 -561% YES
County: Lawrence 0.002 0.002 0.003 0.001 2348% YES *
County: Lucas 0.957 0.951 0.893 0.946 773% YES
Medicaid Member Months 10.401 11.096 10.955 10.924 105% *
MCP Member Months 9.728 9.583 9.613 9.695 158% *
Dual Eligibility Member Months 0.006 0.015 0.014 0.016 79% *
Waiver Member Months 0.001 0.000 0.000 0.000 N/A N/A
ABD Member Months 0.596 1.661 1.731 1.383 128% *
CFC Member Months 9.770 9.390 9.166 9.488 182% *
Control Treatment Control Treatment Balanced3
MCP: Buckeye (All Ages, All CMHC)
Summary of Covariate Averages Before and After Propensity Score Matching
Full Group Matched SamplesBias
Reduction1
Excluded
from PSM2

APPENDIX B
Covariate Control Treatment Control Treatment Balanced3
MCP: Buckeye (All Ages, All CMHC)
Summary of Covariate Averages Before and After Propensity Score Matching
Full Group Matched SamplesBias
Reduction1
Excluded
from PSM2
# Mental Health Center Visits 0.671 21.901 10.000 11.954 89%
# ED Mental Health Visits 0.007 0.032 0.044 0.029 143% *
# IP Mental Health Visits 0.003 0.026 0.027 0.023 111% *
13 or More Mental Health Rx 0.014 0.129 0.115 0.100 111% *
ADHD 0.026 0.271 0.214 0.205 103% *
Acute bronchitis 0.042 0.039 0.050 0.044 -104% *
Alcohol-related disorders 0.003 0.007 0.008 0.008 100% YES *
Anxiety Disorders 0.016 0.053 0.075 0.050 151%
Asthma 0.081 0.133 0.138 0.123 126% *
Autism 0.001 0.009 0.010 0.007 120% *
Bipolar Disorder 0.006 0.067 0.064 0.057 108% *
Blindness and vision defects 0.161 0.255 0.263 0.247 116% *
Cancer 0.005 0.003 0.007 0.003 -45% YES *
Cardiac dysrhythmias 0.013 0.026 0.028 0.021 145% *
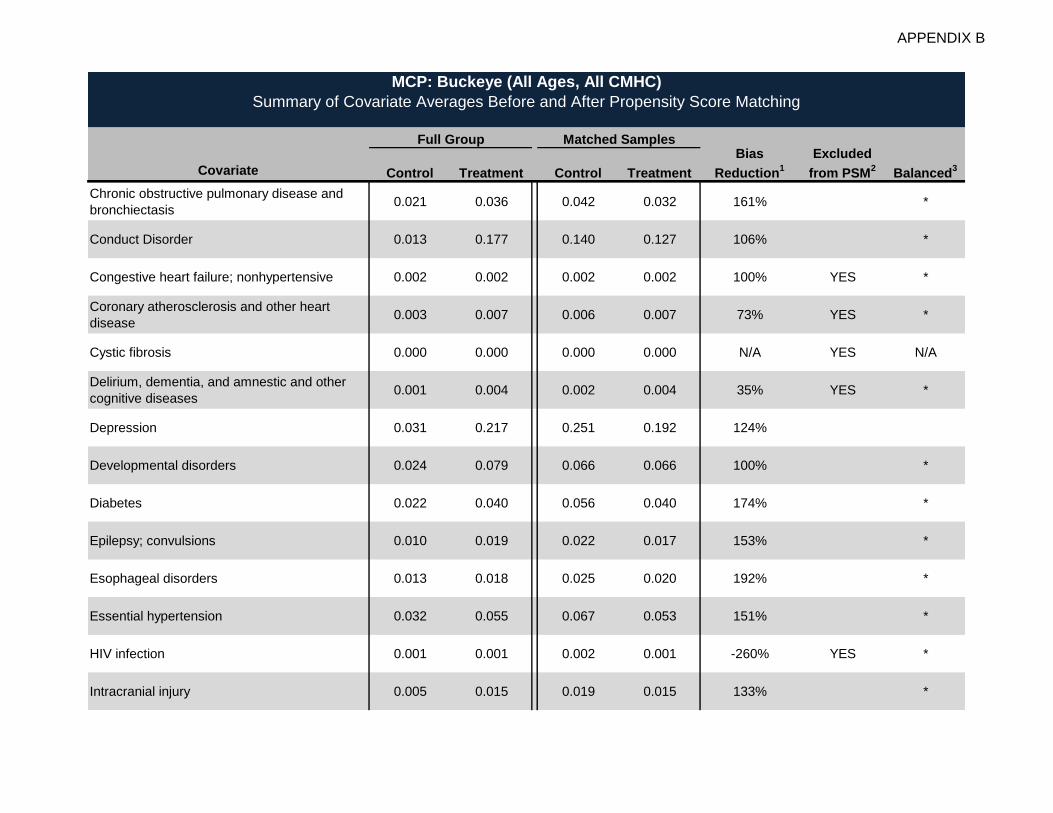
APPENDIX B
Covariate Control Treatment Control Treatment Balanced3
MCP: Buckeye (All Ages, All CMHC)
Summary of Covariate Averages Before and After Propensity Score Matching
Full Group Matched SamplesBias
Reduction1
Excluded
from PSM2
Chronic obstructive pulmonary disease and
bronchiectasis0.021 0.036 0.042 0.032 161% *
Conduct Disorder 0.013 0.177 0.140 0.127 106% *
Congestive heart failure; nonhypertensive 0.002 0.002 0.002 0.002 100% YES *
Coronary atherosclerosis and other heart
disease0.003 0.007 0.006 0.007 73% YES *
Cystic fibrosis 0.000 0.000 0.000 0.000 N/A YES N/A
Delirium, dementia, and amnestic and other
cognitive diseases0.001 0.004 0.002 0.004 35% YES *
Depression 0.031 0.217 0.251 0.192 124%
Developmental disorders 0.024 0.079 0.066 0.066 100% *
Diabetes 0.022 0.040 0.056 0.040 174% *
Epilepsy; convulsions 0.010 0.019 0.022 0.017 153% *
Esophageal disorders 0.013 0.018 0.025 0.020 192% *
Essential hypertension 0.032 0.055 0.067 0.053 151% *
HIV infection 0.001 0.001 0.002 0.001 -260% YES *
Intracranial injury 0.005 0.015 0.019 0.015 133% *

APPENDIX B
Covariate Control Treatment Control Treatment Balanced3
MCP: Buckeye (All Ages, All CMHC)
Summary of Covariate Averages Before and After Propensity Score Matching
Full Group Matched SamplesBias
Reduction1
Excluded
from PSM2
Mental Disorder Not Otherwise Specified
(NOS)0.002 0.007 0.016 0.005 230% YES
Neoplasms of unspecified nature or uncertain
behavior0.008 0.028 0.029 0.025 114% *
Obsessive-Compulsive Disorders 0.000 0.005 0.000 0.004 4% YES
Osteoarthritis 0.008 0.016 0.018 0.014 151% *
Other Developmental Disorder 0.002 0.039 0.031 0.032 98% *
Other nervous system disorders 0.031 0.060 0.068 0.052 149% *
PTSD 0.003 0.035 0.035 0.033 105% *
Pregnancy 0.055 0.030 0.056 0.034 12%
Psychotic Disorder 0.006 0.053 0.067 0.045 135%
Spondylosis; intervertebral disc disorders;
other back0.063 0.085 0.126 0.091 238%
Substance-related disorders 0.013 0.029 0.033 0.027 134% *
Thyroid disorders 0.010 0.022 0.030 0.021 158% *
1 Bias Reduction represents the reduction in the standardized bias coefficient as a result of the matching process. A figure greater than 0% and less than 200%
represents reduced bias.
2 Indicates if the covariate was excluded in the Propensity Score Model logistic regression.
3 An asterisk (*) indicates that the averages for the matched control group and treatment group are statistically equivalent.
Notes:

APPENDIX B
Covariate
Age 20.482 36.935 34.801 33.840 105% *
Female 0.574 0.557 0.571 0.553 -3% *
White 0.831 0.740 0.802 0.782 78% *
Black 0.137 0.245 0.182 0.202 81% *
County: Adams 0.058 0.042 0.037 0.051 191% *
County: Butler 0.611 0.114 0.207 0.149 87%
County: Lawrence 0.084 0.110 0.149 0.132 156% *
County: Lucas 0.058 0.450 0.309 0.344 93%
Medicaid Member Months 10.277 11.173 10.971 10.982 99% *
MCP Member Months 9.539 9.983 9.673 9.776 77% *
Dual Eligibility Member Months 0.008 0.034 0.046 0.035 127% *
Waiver Member Months 0.001 0.002 0.000 0.003 -284% *
ABD Member Months 1.117 6.833 5.626 5.617 100% *
CFC Member Months 9.135 4.267 5.242 5.285 101% *
Control Treatment Control Treatment Balanced3
MCP: CareSource (All Ages, All CMHC)
Summary of Covariate Averages Before and After Propensity Score Matching
Full Group Matched SamplesBias
Reduction1
Excluded
from PSM2

APPENDIX B
Covariate Control Treatment Control Treatment Balanced3
MCP: CareSource (All Ages, All CMHC)
Summary of Covariate Averages Before and After Propensity Score Matching
Full Group Matched SamplesBias
Reduction1
Excluded
from PSM2
# Mental Health Center Visits 1.187 18.750 13.618 13.692 100% *
# ED Mental Health Visits 0.012 0.090 0.093 0.079 115% *
# IP Mental Health Visits 0.003 0.032 0.028 0.029 98% *
13 or More Mental Health Rx 0.035 0.426 0.353 0.322 106% *
ADHD 0.054 0.117 0.161 0.141 125% *
Acute bronchitis 0.074 0.119 0.127 0.123 108% *
Alcohol-related disorders 0.006 0.028 0.025 0.022 112% *
Anxiety Disorders 0.031 0.105 0.142 0.108 134%
Asthma 0.060 0.123 0.125 0.114 116% *
Autism 0.002 0.002 0.003 0.003 359% YES *
Bipolar Disorder 0.013 0.154 0.128 0.126 101% *
Blindness and vision defects 0.179 0.306 0.303 0.290 110% *
Cancer 0.008 0.019 0.024 0.020 128% *
Cardiac dysrhythmias 0.018 0.071 0.067 0.059 113% *

APPENDIX B
Covariate Control Treatment Control Treatment Balanced3
MCP: CareSource (All Ages, All CMHC)
Summary of Covariate Averages Before and After Propensity Score Matching
Full Group Matched SamplesBias
Reduction1
Excluded
from PSM2
Chronic obstructive pulmonary disease and
bronchiectasis0.047 0.154 0.145 0.142 103% *
Conduct Disorder 0.014 0.065 0.096 0.074 130%
Congestive heart failure; nonhypertensive 0.004 0.020 0.020 0.018 110% *
Coronary atherosclerosis and other heart
disease0.011 0.050 0.046 0.042 110% *
Cystic fibrosis 0.000 0.000 0.000 0.000 N/A YES N/A
Delirium, dementia, and amnestic and other
cognitive diseases0.001 0.012 0.007 0.008 89% *
Depression 0.045 0.358 0.381 0.323 114%
Developmental disorders 0.035 0.035 0.049 0.044 -5666% *
Diabetes 0.036 0.148 0.134 0.124 107% *
Epilepsy; convulsions 0.013 0.042 0.047 0.040 120% *
Esophageal disorders 0.026 0.084 0.083 0.078 107% *
Essential hypertension 0.056 0.242 0.216 0.201 107% *
HIV infection 0.001 0.005 0.005 0.004 113% YES *
Intracranial injury 0.005 0.011 0.011 0.010 120% *

APPENDIX B
Covariate Control Treatment Control Treatment Balanced3
MCP: CareSource (All Ages, All CMHC)
Summary of Covariate Averages Before and After Propensity Score Matching
Full Group Matched SamplesBias
Reduction1
Excluded
from PSM2
Mental Disorder Not Otherwise Specified
(NOS)0.004 0.037 0.033 0.030 108% *
Neoplasms of unspecified nature or uncertain
behavior0.014 0.044 0.050 0.043 119% *
Obsessive-Compulsive Disorders 0.001 0.012 0.008 0.009 95% *
Osteoarthritis 0.017 0.095 0.070 0.077 92% *
Other Developmental Disorder 0.003 0.009 0.014 0.012 128% *
Other nervous system disorders 0.057 0.163 0.161 0.148 110% *
PTSD 0.007 0.029 0.042 0.029 142%
Pregnancy 0.046 0.025 0.038 0.029 54% *
Psychotic Disorder 0.007 0.276 0.145 0.164 94% *
Spondylosis; intervertebral disc disorders;
other back0.095 0.287 0.303 0.258 120%
Substance-related disorders 0.022 0.063 0.071 0.062 118% *
Thyroid disorders 0.019 0.064 0.053 0.056 94% *
1 Bias Reduction represents the reduction in the standardized bias coefficient as a result of the matching process. A figure greater than 0% and less than 200%
represents reduced bias.
2 Indicates if the covariate was excluded in the Propensity Score Model logistic regression.
3 An asterisk (*) indicates that the averages for the matched control group and treatment group are statistically equivalent.
Notes:

APPENDIX B
Covariate
Age 23.476 33.613 35.566 33.741 118% *
Female 0.557 0.556 0.560 0.559 -185% *
White 0.889 0.911 0.897 0.914 20% *
Black 0.081 0.077 0.095 0.074 -362% *
County: Adams 0.127 0.186 0.148 0.188 34% *
County: Butler 0.377 0.210 0.281 0.212 57%
County: Lawrence 0.209 0.203 0.214 0.205 -36% *
County: Lucas 0.017 0.060 0.045 0.052 85% *
Medicaid Member Months 9.952 11.119 11.138 11.112 103% *
MCP Member Months 9.067 9.543 9.714 9.621 121% *
Dual Eligibility Member Months 0.018 0.032 0.053 0.033 219% *
Waiver Member Months 0.001 0.003 0.000 0.003 -205% *
ABD Member Months 2.290 6.621 6.897 6.569 107% *
CFC Member Months 7.628 4.462 4.188 4.509 110% *
Control Treatment Control Treatment Balanced3
MCP: Molina (All Ages, All CMHC)
Summary of Covariate Averages Before and After Propensity Score Matching
Full Group Matched SamplesBias
Reduction1
Excluded
from PSM2

APPENDIX B
Covariate Control Treatment Control Treatment Balanced3
MCP: Molina (All Ages, All CMHC)
Summary of Covariate Averages Before and After Propensity Score Matching
Full Group Matched SamplesBias
Reduction1
Excluded
from PSM2
# Mental Health Center Visits 1.534 18.046 15.948 17.221 95% *
# ED Mental Health Visits 0.014 0.082 0.103 0.083 124% *
# IP Mental Health Visits 0.003 0.026 0.029 0.026 111% *
13 or More Mental Health Rx 0.061 0.389 0.410 0.386 106% *
ADHD 0.036 0.152 0.179 0.145 123% *
Acute bronchitis 0.076 0.121 0.138 0.122 131% *
Alcohol-related disorders 0.008 0.024 0.019 0.024 71% *
Anxiety Disorders 0.036 0.135 0.179 0.136 133%
Asthma 0.060 0.142 0.150 0.140 111% *
Autism 0.002 0.010 0.009 0.010 82% YES *
Bipolar Disorder 0.020 0.159 0.164 0.159 103% *
Blindness and vision defects 0.159 0.275 0.290 0.276 111% *
Cancer 0.012 0.022 0.024 0.022 114% *
Cardiac dysrhythmias 0.021 0.051 0.041 0.052 70% *

APPENDIX B
Covariate Control Treatment Control Treatment Balanced3
MCP: Molina (All Ages, All CMHC)
Summary of Covariate Averages Before and After Propensity Score Matching
Full Group Matched SamplesBias
Reduction1
Excluded
from PSM2
Chronic obstructive pulmonary disease and
bronchiectasis0.084 0.159 0.212 0.160 158%
Conduct Disorder 0.009 0.073 0.069 0.067 102% *
Congestive heart failure; nonhypertensive 0.006 0.017 0.010 0.017 41% YES *
Coronary atherosclerosis and other heart
disease0.018 0.055 0.048 0.055 84% *
Cystic fibrosis 0.000 0.000 0.000 0.000 N/A YES N/A
Delirium, dementia, and amnestic and other
cognitive diseases0.001 0.009 0.000 0.007 -15% YES
Depression 0.051 0.336 0.366 0.331 109% *
Developmental disorders 0.028 0.063 0.045 0.062 55% *
Diabetes 0.052 0.131 0.147 0.131 116% *
Epilepsy; convulsions 0.019 0.058 0.047 0.059 74% *
Esophageal disorders 0.032 0.075 0.076 0.074 103% *
Essential hypertension 0.082 0.217 0.240 0.217 114% *
HIV infection 0.001 0.003 0.002 0.003 33% YES *
Intracranial injury 0.005 0.010 0.009 0.010 70% YES *

APPENDIX B
Covariate Control Treatment Control Treatment Balanced3
MCP: Molina (All Ages, All CMHC)
Summary of Covariate Averages Before and After Propensity Score Matching
Full Group Matched SamplesBias
Reduction1
Excluded
from PSM2
Mental Disorder Not Otherwise Specified
(NOS)0.005 0.048 0.034 0.048 74% *
Neoplasms of unspecified nature or uncertain
behavior0.015 0.046 0.038 0.045 81% *
Obsessive-Compulsive Disorders 0.001 0.017 0.007 0.017 45% YES *
Osteoarthritis 0.022 0.063 0.074 0.064 120% *
Other Developmental Disorder 0.001 0.017 0.003 0.014 32% YES *
Other nervous system disorders 0.062 0.135 0.176 0.134 146% *
PTSD 0.007 0.043 0.050 0.043 114% *
Pregnancy 0.042 0.027 0.033 0.028 63% *
Psychotic Disorder 0.016 0.155 0.140 0.155 91% *
Spondylosis; intervertebral disc disorders;
other back0.111 0.270 0.297 0.271 114% *
Substance-related disorders 0.033 0.055 0.059 0.055 114% *
Thyroid disorders 0.021 0.073 0.095 0.074 130% *
1 Bias Reduction represents the reduction in the standardized bias coefficient as a result of the matching process. A figure greater than 0% and less than 200%
represents reduced bias.
2 Indicates if the covariate was excluded in the Propensity Score Model logistic regression.
3 An asterisk (*) indicates that the averages for the matched control group and treatment group are statistically equivalent.
Notes:

APPENDIX B
Covariate
Age 17.620 16.123 17.837 16.141 -15%
Female 0.593 0.494 0.511 0.507 95% *
White 0.591 0.561 0.591 0.560 -4%
Black 0.375 0.412 0.384 0.412 25% *
County: Adams 0.003 0.001 0.001 0.001 135% YES *
County: Butler 0.033 0.000 0.008 0.001 56% YES
County: Lawrence 0.001 0.000 0.000 0.001 323% YES *
County: Lucas 0.962 0.997 0.992 0.996 76% *
Medicaid Member Months 10.218 11.232 11.113 11.042 108% *
MCP Member Months 9.569 10.051 9.990 10.110 73% *
Dual Eligibility Member Months 0.002 0.005 0.006 0.005 120% *
Waiver Member Months 0.000 0.000 0.000 0.000 N/A N/A
ABD Member Months 0.200 0.948 0.794 0.613 122%
CFC Member Months 9.980 10.268 10.273 10.410 50% *
Control Treatment Control Treatment Balanced3
MCP: Paramount (All Ages, All CMHC)
Summary of Covariate Averages Before and After Propensity Score Matching
Full Group Matched SamplesBias
Reduction1
Excluded
from PSM2

APPENDIX B
Covariate Control Treatment Control Treatment Balanced3
MCP: Paramount (All Ages, All CMHC)
Summary of Covariate Averages Before and After Propensity Score Matching
Full Group Matched SamplesBias
Reduction1
Excluded
from PSM2
# Mental Health Center Visits 0.559 19.716 8.206 10.127 88%
# ED Mental Health Visits 0.004 0.050 0.032 0.025 120% *
# IP Mental Health Visits 0.002 0.046 0.032 0.023 125% *
13 or More Mental Health Rx 0.010 0.123 0.090 0.073 113% *
ADHD 0.032 0.311 0.262 0.236 107% *
Acute bronchitis 0.045 0.042 0.051 0.043 -151% *
Alcohol-related disorders 0.003 0.009 0.009 0.008 121% *
Anxiety Disorders 0.019 0.059 0.078 0.055 143%
Asthma 0.066 0.130 0.144 0.120 133%
Autism 0.001 0.008 0.009 0.008 106% *
Bipolar Disorder 0.004 0.059 0.039 0.041 97% *
Blindness and vision defects 0.163 0.298 0.304 0.278 118% *
Cancer 0.004 0.007 0.012 0.008 214% *
Cardiac dysrhythmias 0.011 0.023 0.030 0.021 163% *

APPENDIX B
Covariate Control Treatment Control Treatment Balanced3
MCP: Paramount (All Ages, All CMHC)
Summary of Covariate Averages Before and After Propensity Score Matching
Full Group Matched SamplesBias
Reduction1
Excluded
from PSM2
Chronic obstructive pulmonary disease and
bronchiectasis0.019 0.028 0.048 0.025 320%
Conduct Disorder 0.012 0.190 0.154 0.145 104% *
Congestive heart failure; nonhypertensive 0.001 0.002 0.000 0.001 -100% YES *
Coronary atherosclerosis and other heart
disease0.002 0.002 0.005 0.002 -932% YES *
Cystic fibrosis 0.000 0.000 0.000 0.001 -853% YES *
Delirium, dementia, and amnestic and other
cognitive diseases0.001 0.003 0.006 0.002 275% YES
Depression 0.028 0.210 0.227 0.164 127%
Developmental disorders 0.024 0.097 0.094 0.077 120% *
Diabetes 0.016 0.028 0.036 0.023 185%
Epilepsy; convulsions 0.009 0.020 0.022 0.018 136% *
Esophageal disorders 0.014 0.021 0.028 0.017 239%
Essential hypertension 0.021 0.032 0.043 0.031 201%
HIV infection 0.001 0.000 0.001 0.001 100% YES *
Intracranial injury 0.005 0.009 0.010 0.007 172% *

APPENDIX B
Covariate Control Treatment Control Treatment Balanced3
MCP: Paramount (All Ages, All CMHC)
Summary of Covariate Averages Before and After Propensity Score Matching
Full Group Matched SamplesBias
Reduction1
Excluded
from PSM2
Mental Disorder Not Otherwise Specified
(NOS)0.000 0.009 0.005 0.005 100% *
Neoplasms of unspecified nature or uncertain
behavior0.011 0.026 0.024 0.019 131% *
Obsessive-Compulsive Disorders 0.000 0.001 0.003 0.000 621% YES
Osteoarthritis 0.007 0.011 0.015 0.009 229% *
Other Developmental Disorder 0.004 0.067 0.053 0.049 105% *
Other nervous system disorders 0.029 0.066 0.084 0.056 165%
PTSD 0.003 0.031 0.026 0.023 109% *
Pregnancy 0.057 0.031 0.042 0.033 58% *
Psychotic Disorder 0.002 0.036 0.021 0.020 103% *
Spondylosis; intervertebral disc disorders;
other back0.062 0.090 0.111 0.082 190%
Substance-related disorders 0.010 0.029 0.036 0.026 142% *
Thyroid disorders 0.011 0.016 0.026 0.016 273%
1 Bias Reduction represents the reduction in the standardized bias coefficient as a result of the matching process. A figure greater than 0% and less than 200%
represents reduced bias.
2 Indicates if the covariate was excluded in the Propensity Score Model logistic regression.
3 An asterisk (*) indicates that the averages for the matched control group and treatment group are statistically equivalent.
Notes:

APPENDIX B
Covariate
Age 27.637 43.502 39.588 39.939 98% *
Female 0.541 0.545 0.533 0.545 -232% *
White 0.731 0.528 0.579 0.565 93% *
Black 0.246 0.458 0.409 0.421 95% *
County: Adams 0.025 0.001 0.000 0.003 137% YES *
County: Butler 0.243 0.004 0.049 0.009 69% YES
County: Lawrence 0.360 0.105 0.193 0.199 102% *
County: Lucas 0.360 0.884 0.755 0.778 96% *
Medicaid Member Months 10.059 11.103 10.686 10.548 114% *
MCP Member Months 9.025 9.410 8.556 8.628 83% *
Dual Eligibility Member Months 0.035 0.101 0.138 0.110 131% *
Waiver Member Months 0.000 0.000 0.000 0.000 N/A N/A
ABD Member Months 3.997 9.637 8.213 8.305 98% *
CFC Member Months 6.016 1.350 2.314 2.124 96% *
Control Treatment Control Treatment Balanced3
MCP: UnitedHealthcare (All Ages, All CMHC)
Summary of Covariate Averages Before and After Propensity Score Matching
Full Group Matched SamplesBias
Reduction1
Excluded
from PSM2

APPENDIX B
Covariate Control Treatment Control Treatment Balanced3
MCP: UnitedHealthcare (All Ages, All CMHC)
Summary of Covariate Averages Before and After Propensity Score Matching
Full Group Matched SamplesBias
Reduction1
Excluded
from PSM2
# Mental Health Center Visits 0.878 24.462 10.597 11.476 96% *
# ED Mental Health Visits 0.012 0.159 0.078 0.084 96% *
# IP Mental Health Visits 0.004 0.059 0.040 0.049 88% *
13 or More Mental Health Rx 0.046 0.531 0.320 0.311 101% *
ADHD 0.032 0.042 0.098 0.072 274% *
Acute bronchitis 0.055 0.073 0.078 0.072 130% *
Alcohol-related disorders 0.011 0.059 0.046 0.043 105% *
Anxiety Disorders 0.028 0.069 0.072 0.069 106% *
Asthma 0.067 0.099 0.118 0.089 182% *
Autism 0.003 0.004 0.000 0.009 -487% YES *
Bipolar Disorder 0.017 0.231 0.184 0.179 102% *
Blindness and vision defects 0.118 0.177 0.182 0.161 132% *
Cancer 0.014 0.022 0.037 0.023 231% *
Cardiac dysrhythmias 0.032 0.078 0.058 0.058 100% *

APPENDIX B
Covariate Control Treatment Control Treatment Balanced3
MCP: UnitedHealthcare (All Ages, All CMHC)
Summary of Covariate Averages Before and After Propensity Score Matching
Full Group Matched SamplesBias
Reduction1
Excluded
from PSM2
Chronic obstructive pulmonary disease and
bronchiectasis0.088 0.151 0.170 0.141 141% *
Conduct Disorder 0.008 0.010 0.032 0.014 503% YES *
Congestive heart failure; nonhypertensive 0.016 0.016 0.023 0.012 -10660% *
Coronary atherosclerosis and other heart
disease0.025 0.036 0.026 0.026 100% *
Cystic fibrosis 0.001 0.000 0.000 0.000 N/A YES N/A
Delirium, dementia, and amnestic and other
cognitive diseases0.001 0.007 0.017 0.009 192% YES *
Depression 0.050 0.428 0.412 0.383 106% *
Developmental disorders 0.027 0.018 0.035 0.023 -15% *
Diabetes 0.067 0.150 0.115 0.144 68% *
Epilepsy; convulsions 0.022 0.043 0.046 0.040 124% *
Esophageal disorders 0.025 0.081 0.058 0.061 95% *
Essential hypertension 0.106 0.242 0.222 0.202 114% *
HIV infection 0.004 0.004 0.006 0.006 100% YES *
Intracranial injury 0.007 0.018 0.026 0.017 160% *

APPENDIX B
Covariate Control Treatment Control Treatment Balanced3
MCP: UnitedHealthcare (All Ages, All CMHC)
Summary of Covariate Averages Before and After Propensity Score Matching
Full Group Matched SamplesBias
Reduction1
Excluded
from PSM2
Mental Disorder Not Otherwise Specified
(NOS)0.004 0.048 0.037 0.032 111% *
Neoplasms of unspecified nature or uncertain
behavior0.018 0.036 0.040 0.037 113% *
Obsessive-Compulsive Disorders 0.000 0.007 0.003 0.009 25% YES *
Osteoarthritis 0.041 0.114 0.110 0.081 136% *
Other Developmental Disorder 0.002 0.004 0.009 0.003 363% YES *
Other nervous system disorders 0.075 0.169 0.159 0.147 111% *
PTSD 0.006 0.021 0.026 0.026 100% *
Pregnancy 0.038 0.020 0.017 0.026 153% *
Psychotic Disorder 0.015 0.471 0.228 0.199 106% *
Spondylosis; intervertebral disc disorders;
other back0.134 0.336 0.323 0.285 117% *
Substance-related disorders 0.033 0.104 0.092 0.092 100% *
Thyroid disorders 0.020 0.057 0.049 0.052 93% *
1 Bias Reduction represents the reduction in the standardized bias coefficient as a result of the matching process. A figure greater than 0% and less than 200%
represents reduced bias.
2 Indicates if the covariate was excluded in the Propensity Score Model logistic regression.
3 An asterisk (*) indicates that the averages for the matched control group and treatment group are statistically equivalent.
Notes:

Health Services Advisory Group, Inc. - FINAL (F3) - Cost Savings Annual Report Ohio Department of Medicaid January 2015 Page C-1 11
APPENDIX C. PROPENSITY SCORE MODELS
This section provides the detailed results of the propensity score-based matching for each level of
analysis. For each of the 42 stratifications, summary statistics describe the matched control and
treatment group samples and percentage matched.

APPENDIX C
All Health Homes (All Ages, All CMHC) 202,319 9,851 8,335 8,335 84.6%
All Health Homes (Under 18, All CMHC) 90,026 4,084 3,562 3,562 87.2%
All Health Homes (18 and Over, All CMHC) 112,293 5,767 4,649 4,649 80.6%
All Health Homes (All Ages, CMHC Experience) 13,792 7,710 5,212 5,212 67.6%
All Health Homes (All Ages, No CMHC Experience) 188,527 2,141 2,141 2,141 100.0%
Butler (All Ages, All CMHC) 202,319 613 613 613 100.0%
Butler (Under 18, All CMHC) 90,026 157 157 157 100.0%
Butler (18 and Over, All CMHC) 112,293 456 456 456 100.0%
Butler (All Ages, CMHC Experience) 13,792 395 395 395 100.0%
Butler (All Ages, No CMHC Experience) 188,527 218 218 218 100.0%
Harbor (All Ages, All CMHC) 202,319 2,522 2,522 2,522 100.0%
Harbor (Under 18, All CMHC) 90,026 2,022 2,015 2,015 99.7%
Harbor (18 and Over, All CMHC) 112,293 500 500 500 100.0%
Harbor (All Ages, CMHC Experience) 13,792 1,873 1,849 1,849 98.7%
Harbor (All Ages, No CMHC Experience) 188,527 649 649 649 100.0%
Shawnee (All Ages, All CMHC) 202,319 2,049 2,049 2,049 100.0%
Shawnee (Under 18, All CMHC) 90,026 634 631 631 99.5%
Shawnee (18 and Over, All CMHC) 112,293 1,415 1,415 1,415 100.0%
Shawnee (All Ages, CMHC Experience) 13,792 1,646 1,516 1,516 92.1%
Shawnee (All Ages, No CMHC Experience) 188,527 403 403 403 100.0%
Unison (All Ages, All CMHC) 202,319 1,669 1,652 1,652 99.0%
Control Treatment
Summary of Propensity Score-Based Matching
Percentage
Matched
Full Group
Stratification Eligible Control
Eligible
Treatment
Number of Members in Eligible Population and Matched Sample
Matched

APPENDIX C
Control Treatment
Summary of Propensity Score-Based Matching
Percentage
Matched
Full Group
Stratification Eligible Control
Eligible
Treatment
Number of Members in Eligible Population and Matched Sample
Matched
Unison (Under 18, All CMHC) 90,026 235 235 235 100.0%
Unison (18 and Over, All CMHC) 112,293 1,434 1,395 1,395 97.3%
Unison (All Ages, CMHC Experience) 13,792 1,387 1,293 1,293 93.2%
Unison (All Ages, No CMHC Experience) 188,527 282 282 282 100.0%
Zepf (All Ages, All CMHC) 202,319 2,998 2,997 2,997 100.0%
Zepf (Under 18, All CMHC) 90,026 1,036 1,025 1,025 98.9%
Zepf (18 and Over, All CMHC) 112,293 1,962 1,950 1,950 99.4%
Zepf (All Ages, CMHC Experience) 13,792 2,409 2,287 2,287 94.9%
Zepf (All Ages, No CMHC Experience) 188,527 589 589 589 100.0%
Pharmacist on Site (All Ages, All CMHC) 202,319 3,135 3,113 3,113 99.3%
No Pharmacist on Site (All Ages, All CMHC) 202,319 6,716 5,967 5,967 88.8%
Lucas County (All Ages, All CMHC) 95,275 7,187 4,933 4,933 68.6%
Lucas County (Under 18, All CMHC) 40,488 3,291 2,464 2,464 74.9%
Lucas County (18 and Over, All CMHC) 54,787 3,896 2,345 2,345 60.2%
Lucas County (All Ages, CMHC Experience) 5,413 5,669 3,134 3,134 55.3%
Lucas County (All Ages, No CMHC Experience) 89,862 1,518 1,518 1,518 100.0%
MCP: Buckeye (All Ages, All CMHC) 20,104 1,159 942 942 81.3%
MCP: CareSource (All Ages, All CMHC) 54,423 2,016 1,537 1,537 76.2%
MCP: Molina (All Ages, All CMHC) 16,453 586 580 580 99.0%
MCP: Paramount (All Ages, All CMHC) 41,141 2,466 1,930 1,930 78.3%
MCP: UnitedHealthcare (All Ages, All CMHC) 6,112 769 347 347 45.1%