health systems strengthening and quality … systems strengthening and quality improvement for...
TRANSCRIPT

The 3 feet Approach
Health systems Strengthening and
Quality Improvement for improved
Pediatric HIV outcomes

What are our goals within the 3 feet approach?
To end preventable maternal,
newborn, child and women’s
deaths in South Africa
Incl. Combating HIV/AIDS and TB

Cruising at 30,000ft
Minister Motsoaledi ‘it is time we zoomed in
from cruising altitude at 30,000 feet to 3 feet’
– where the action happens, where the rubber hits the road.
3 feet
Action on the ground…DIPs!

3 Feet approach in a nutshell
• NDoH commissioned the MNCWH&N Mid term review in 2014 • Certain recommendations
– Know your target, track performance, be accountable – Get the basic right – Connect the dots
• There was a need to implement these recommendations to reduce maternal and child deaths and improve pediatric health outcomes
• EC NMBHD Aug 2014 • Equipping Facilities at 3 Feet level to Use data for action
– Understand their indicators and targets – monitor, and interpret their monthly data – use it for action – become accountable for quality of care
Tools: Facility dashboards &
Runcharts 3x4 matrix BNA Tool Action dashboards

5
NDOH
PDOH
District
Sub District
Facility
30 000 feet level • Recommendations • Plans • Targets
By means of • Simple
tools • Clear steps
• Understand their indicators and targets • monitor, and interpret their monthly data • use it for action • become accountable for quality of care
Impact on various indicators in priority programs
Impact on outcomes at district level
Progress to wards MDG 4,5 and 6 from 3 ft. level up

Survive
Thrive
Treatment As primary, secondary, and tertiary prevention
Prevalence
Burden of Disease: The Open Tap Analogy
Bucket = total
Population
Mortality = Flow out of bucket
Prevention- Turn off the
Tap
Plug the hole in the bucket
Incidence = flow out of
tap
Prevalence

Which taps need to be closed? - Cascades and the continuum of care from community, to clinic, to hospital

Quality Coverage Good Outcomes
PCR positivity at 6 weeks Maternal mortality Neonatal mortality Child mortality
Pregnant women initiated on ART HIV testing HIV+ children initiated on ART
VL management and adherence Quality of BANC Quality of child health follow-up
Indicators Measures of quality
Mortality Indicators
Dashboards ANC Audits RTHC Audits
Effective Health System
PPIP/CHIP death audits

9
Goal/Targets
What will be measured? Feedback & accountability mechanisms
Identify actions Prioritise actions
Implement Action
Understand the system Identify bottlenecks

Targets
Track Performance
by Dashboards and run charts
Identify Facility
Bottlenecks and Actions
Track Facility
level actions in
Action DB
Compare action and
performance dashboard
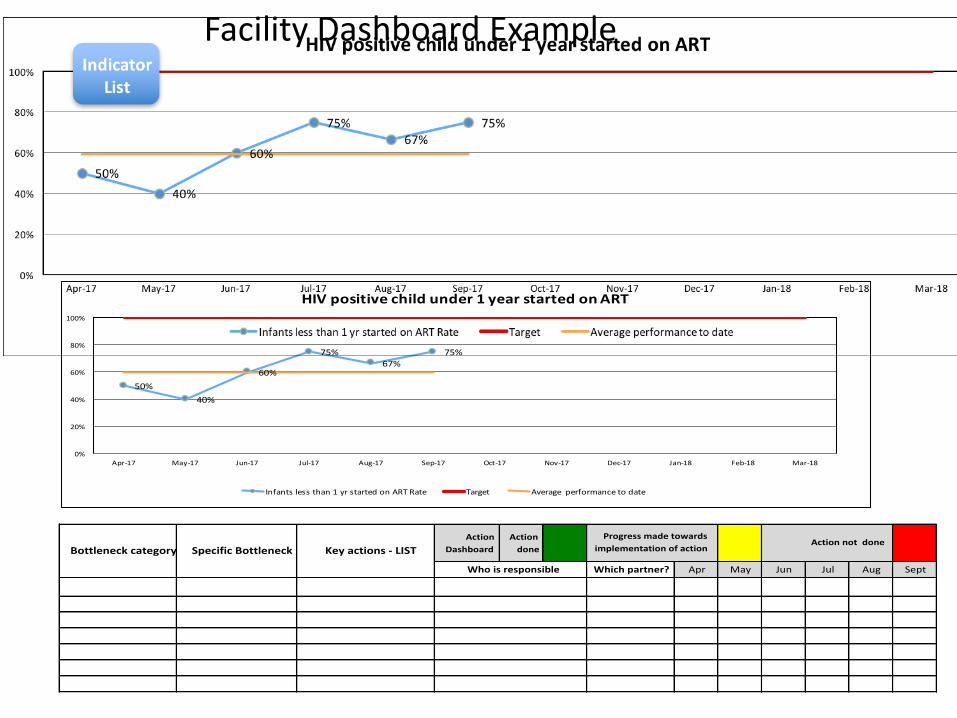
Facility Dashboard Example
Apr-17 May-17 Jun-17 Jul-17 Aug-17 Sep-17 Oct-17 Nov-17 Dec-17 Jan-18 Feb-18 Mar-18
3 2 3 3 2 3
6 5 5 4 3 4
50% 40% 60% 75% 67% 75% #N/A #N/A #N/A #N/A #N/A #N/A
59% 59% 59% 59% 59% 59% #N/A #N/A #N/A #N/A #N/A #N/A
100% 100% 100% 100% 100% 100% 100% 100% 100% 100% 100% 100% 100%
R R R R R R N N N N N N
Action
Dashboard
Action
done
Apr May Jun Jul Aug Sept
Source:Tier.net
N=Childunder1yearnaivestartedART
D=PCRtestpositiveunder1year:InfantPCRtestpositive
atbirthPLUSInfantPCRtestpositivearound10weeks
Monthlyperformance
HIV-positivechildunder1yearstartARTrate
Robotshowsaverageperformanceagainsttarget
SpecificBottleneck Keyactions-LIST
Progressmadetowards
implementationofactionActionnotdone
Whoisresponsible Whichpartner?
DistrictTarget
Averageperformancetodate
Bottleneckcategory
50%
40%
60%
75%
67%
75%
0%
20%
40%
60%
80%
100%
Apr-17 May-17 Jun-17 Jul-17 Aug-17 Sep-17 Oct-17 Nov-17 Dec-17 Jan-18 Feb-18 Mar-18
HIVpositivechildunder1yearstartedonART
Infantslessthan1yrstartedonARTRate Target Averageperformancetodate
IndicatorList
PaediatricHIVTB

How will we know that a change is an improvement?
• What will you measure?
– Indicator
• Why must you measure
– You cannot manage what you do not measure
– Measure assessment/evaluation strategies for improvement
– In order to be accountable

How will we know that a change is an improvement?
• So we measure by counting how many clients receive a service e.g. Ped HIV tests, and report it every month into DHIS…
• But how do we know that performance is improving
• What feedback mechanisms are in place ?? – Who is the person who has the most direct influence
on that indicator? – How do they gauge their performance?
– What are the external feedback mechanisms in place

Accountability What is the capacity of a person to exercise accountability
• Training • Clarity of performance expectations and targets • Involvement in decision making • Systems to measure and evaluate for
– Internal Feedback to be able to gauge own performance and build internal commitment
– External Feedback (supervision/regulatory mechanisms) – What are the linkages between actors i.e. who is accountable to who, and who
holds who accountable
• Support and promote improved service delivery through feedback and learning -CQI
– Rewards (or, sanctions)
• Supporting infrastructure – Information systems – Communication systems – Human resource management – Performance management
Source: J O'Hagan; D Persaud: Creating a culture of accountability in health care. The health care manager. 2009 Brinkerhoff, D: Accountability and health systems: toward conceptual clarity and policy relevance. Health policy and planning. 2004

Facility Dashboard Example
(Source:PPIP/CHIP)
##### ##### ##### Jul-17 ##### ##### ##### ##### ##### ##### ##### #####
5 4 3 2 2 2 1
9 9 8 7 8 12 9
Monthlyperformance 56% 44% 38% 29% 25% 17% 11% #N/A #N/A #N/A #N/A #N/A
Averageperformancetodate 31% 31% 31% 31% 31% 31% 31% 31% 31% 31% #N/A #N/A
10% 10% 10% 10% 10% 10% 10% 10% 10% 10% 10% 10% 10%
R R R R R R R N N N N N
Action
Dash
board
Action
done
Apr May Jun Jul Aug Sept
DistrictTarget
Robotscoring
Bottleneck
category
HIVpositivityinAuditedDeathsUnder5years
Specific
BottleneckKeyactions-LIST
Progressmade
towards
implementationof
Actionnotdone
WhoisresponsibleWhich
partner?
AuditedDeathsunder5years
thatareHIVinfected
D=Numberofchilddeaths
auditedunder5years
56%
44%38%
29% 25%
17%11%
0%
10%
20%
30%
40%
50%
60%
Apr-17 May-17 Jun-17 Jul-17 Aug-17 Sep-17 Oct-17 Nov-17 Dec-17 Jan-18 Feb-18 Mar-18
HIVpositivityinAuditedDeathsUnder5Years
AuditedDeathsunder5yearsthatareHIVinfected Target Averageperformancetodate
Indicator
List
NewbornChildSurvive

+
3 x 4 MATRIX
Know your issues, track your response, accountability
Target setting at all levels
Data management (recording, analyzing, use, monitoring)
Communication strategy, feedback loop, key messages
Getting the basics right
Infrastructure, medicines, equipment
Human resources (quantity, capacity), supervision and mentoring to deliver quality services
Service delivery platforms defined and linked with communities
Connecting the dots
Cascades and pathways (continuum of care)
Referrals and transport (mapped, available and skilled)
Inter-sectoral coordination

Bottleneck analysis
• Various methods – 3x4 matrix – Fishbone analysis – Process map
• Involve relevant staff in BNA – Relevant and applicable to that facility – Promotes accountability in those that have to
implement the action
• Identify level at which action required i.e. PHC facility/ hospital/ district – Keep facility focused on what is in their sphere of
control and influence

The action dashboard help us “study” our actions…
It tells us two things: 1. Was the action actually performed? ….
– Red= action NOT done – Yellow = progress towards action implementation of action
happening and ongoing, – Green = action done
2. Did the action give the desired results i.e. move our dashboard to green.
To determine if the action was the right action, we need to compare the action dashboard to the performance indicator dashboard

For indicators scoring red or yellow, perform a bottleneck analysis, using the 3x4 matrix or fishbone analysis, and identify actions required to relieve bottlenecks.
List required actions in the action dashboard. Select the bottleneck category from the drop-down list. Indicate who is responsible, and which partner is able to assist with this particular action.
As you review your indicator performance every month, also track the implementation of, and effectivity of your actions, by means of the action dashboard. Every month shade the action according to the key below:
To shade your action dashboard in either red, yellow, or green, copy the relevant colour block in the "key" and paste into the block you would like to shade.
Compare indicator dashboard to action dashboard:
Action dashboard
Indicator dashboard
Meaning Interpretation
G Upward
trend
The action was done (green), and the
indicator shows signs of improvement.
The action seems correct. Continue the action and monitor results.
No change
The action was NOT done (red), and the
indicator did not improve (red)
The action was NOT done, so no improvement can be expected. The effectivity of the action cannot be determined until it is actually implemented
G
No change or
downward trend
The action was done (green), but the indictor
did not improve (red)
The action was implemented but did not effect results. This means that this action was not the correct action. Adapt your action or choose a different action
Summary of the action dashboard

Interpreting the action dashboard
• If the action is red, and the performance dashboard is also still red it means that the action was not done (not implemented), and therefore the performance dashboard will remain red as no change has been implemented to move it towards green
If the action is red, and the performance dashboard is also still red it means that the action was not done (not implemented), and therefore the performance dashboard will not improve, as no change has been implemented to move it towards green

If the action is green (i.e. was done), and the performance indicator shows an upward trend, then you have the right action.

• Facilities know their targets, track their indicators and track their actions using the facility dashboard charts
• Improved data quality • Improved accountability at facility level • Strengthening of health system across all priority
programs, and not just one vertical program • Improved Teamwork and morale
– Facility – District
Benefits of 3 feet Approach