healthcare associated infection reporting template (hairt) · this is below heat target...
TRANSCRIPT

Official Sensitive
Official Sensitive 1
NHS Greater Glasgow & Clyde NHS Board Meeting Medical Director
19 December 2017
Paper No: 17/66
Healthcare Associated Infection Reporting Template (HAIRT) Recommendation: For noting Purpose of Paper: Update on NHSGGC performance against HEAT and other HAI Targets and performance measures. Key Issues to be considered:
Validated HPS / ISD data : Quarter 2 (April - June) 2017
HEAT Targets GGC National HEAT target
SAB rate per 100,000 AOBD 34.3 31.3 24.0
CDI rate per 100,000 OBD 30.8 27.6 32.0
Table 1. Progress against National HAI HEAT targets 01/04/2017 – 30/06/2017
116 Staphylococcus aureus Bacteraemia (SAB) cases were reported for April to June 2017
with a rate of 34.3 cases per 100,000 AOBD. This is above the national rate.
103 Clostridium difficile (CDI) cases were reported for April to June 2017 with a rate of 30.8
cases per 100,000 OBD. This is below HEAT target requirements.
Local surveillance status for Quarter 3 has shown a 14% reduction in the number of SAB
cases. There has been an increase in CDI cases and we proactively reviewed these with
Health Protection Scotland and our local Antimicrobial Management Team and no
commonalities were identified. In October and November there has been a reduction in
the number of CDI cases with 68 cases reported for the first two months.

Official Sensitive
Official Sensitive 2
Any Patient Safety /Patient Experience Issues:
Local surveillance for Q3 2017 shows that NHSGGC have improved slightly, although remain above the National SAB HEAT target with 100 patient cases reported. The Medical Director and Board Infection Control Committee noted the increase in the number of SAB cases which were related to the use of an intravascular access device and issued additional guidance to all clinicians across GGC. (Appendix 1) Any Financial Implications from this Paper: No Any Staffing Implications from this Paper: No Any Equality Implications from this Paper: No Any Health Inequalities Implications from this Paper: No
Has a Risk Assessment been carried out for this issue? If yes, please detail the outcome:
No
Highlight the Corporate Plan priorities to which your paper relates: Improving quality,
efficiency and effectiveness.
Author: Dr. Jennifer L Armstrong Tel No: 0141 201 4611 Date: 19/12/2017

Official Sensitive
Official Sensitive 3
Healthcare Associated Infection Reporting Template (HAIRT) Section 1 – Board Wide Issues This is the bi-monthly publication of the reporting template for submission to the NHS Board as required by the national HAI Action Plan. Staphylococcus aureus (including Meticillin resistant Staphylococcus aureus (MRSA)) Staphylococcus aureus Bacteraemia Surveillance and Actions
Figure 1: SAB patient cases by quarter
Summary In Q2 of 2017 (April - June), there were 116 validated cases. In the period July to September 2017 there has been a 14% reduction in local case numbers and we have reported 100 patient cases (figure 1). MSSA bacteraemia rates in both NHS GGC and Scotland as a whole (published by HPS October 2017), have indicated that SAB rates continue to plateau. NHSGGC continue to support improvement in clinical practice across all acute sectors through ongoing education and audit initiatives. The Acute Infection Control Committee, receives progress reports bi-monthly on the SAB Action Plan. The Nurse Consultant for IPC attended a meeting in October with the IPCT in Ayrshire and Arran who met their SAB HEAT target (table 2), to benchmark our processes with theirs to identify any other areas of good practice that NHSGGC might adopt. Several potential initiatives have been identified from this review and a paper is currently being prepared for the Chiefs of Medicine and Nursing. At the Board Infection Control Committee the Board Medical Director asked the Chair of the Acute Infection Control Committee (Chief of Medicine, South Clyde) to review the information from Ayrshire and Arran and propose some additional actions which could be reviewed by the NHSGGC Chief of Medicines Group with a plan to implement those thought to offer the opportunity for further improvement.
Jul 13-Sep 13
Oct 13 -Dec 13
Jan 14-Mar 14
Apr 14-Jun 14
Jul 14-Sep 14
Oct 14-Dec14
Jan 15 -Mar 15
Apr 15-Jun 15
Jul 15-Sep 15
Oct 15-Dec 15
Jan 16-Mar 16
Apr 16-Jun 16
Jul 16-Sep 16
Oct 16-Dec 16
Jan 17-Mar 17
Apr 17-Jun 17
Jul 17-Sep 17
Oct 17-Dec 17
Jan 18-Mar 18
GGC SABs 129 133 98 106 87 93 102 116 116 127 106 110 117 104 114 116 100
HEAT target 82 82 82 75 75 75 75 75 75 75 75 75 75 75 75 75 75 75 75
0
10
20
30
40
50
60
70
80
90
100
110
120
130
140
150
160
Cas
es
pe
r Q
uar
ter
NHSGGCStaphylococcus aureus Bacteraemia cases to achieve HEAT target 31st March 2017
[subject to change as HEAT target based on Acute Occupied Bed Day data]
GGC SABs
HEAT target
Unvalidated Q3-17 data 100 patient cases

Official Sensitive
Official Sensitive 4
The Medical Director and Board Infection Control Committee recognised the trend in SAB cases that were directly associated with intravascular access devices and commissioned a memorandum and Core Brief which featured an alert to all clinical staff in our Board on behalf of the Acute Infection Control Committee. The communication emphasised the impact of SABs and in particular peripheral venous access devices, on patients within our care. (The article is included in the Appendix of this report.) Quarter 2: 2017 (April - June) Surveillance In Q2 NHSGGC reported 34.3 SAB cases per 100,000 AOBDs (116 cases). Health Protection Scotland issued the Q2 report in early October and there was a revision to the presentation of the data across three metrics (SAB, CDI and E.coli Bacteraemia). This separated cases into ‘Healthcare Associated ‘and ‘Community Associated’ and used different denominators to previously published data contained within the HAIRT. NHSGGC and other NHS Boards will continue to report both SAB and CDI in the established format required by the SGHD until the national reports are harmonised along with HAI Standards. This is anticipated to be mid 2018. Table 2 below includes SAB rates per 100,000 AOBDs across different health boards in Scotland however given the diversity in the size of the other health boards this data should be viewed with caution.
Health Board Q2: SAB rate (per 100,000 AOBDs)
Ayrshire & Arran 24.4
Forth Valley 32.3
Grampian 26.8
Greater Glasgow & Clyde 34.3
Lanarkshire 33.0
Lothian 25.9
Tayside 41.1
Scotland 31.3
Table 2: SAB rates (01/04/17 – 30/06/17)
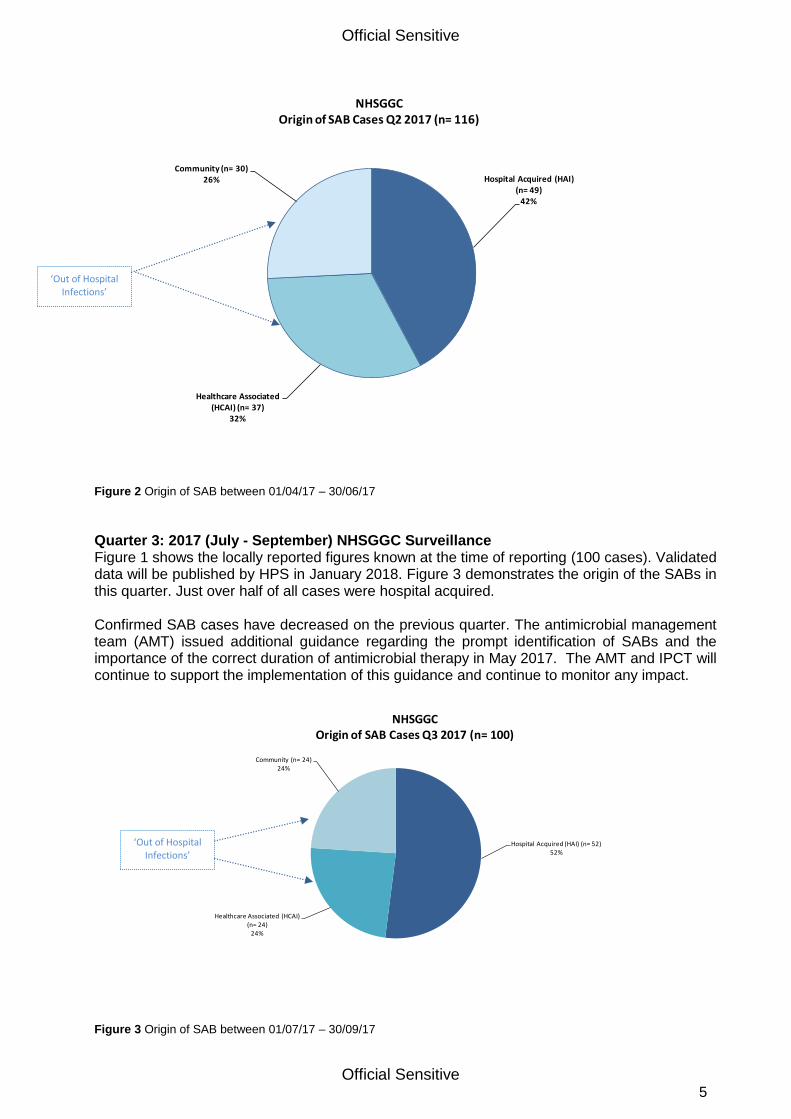
42% (n=49) patients developed a SAB after admission to an NHSGGC hospital; 32% patients were confirmed to have a healthcare associated infection (HCAI) and the remaining 26% were community acquired cases (Figure 2.)
Official Sensitive
Official Sensitive 5
Figure 2 Origin of SAB between 01/04/17 – 30/06/17
Quarter 3: 2017 (July - September) NHSGGC Surveillance Figure 1 shows the locally reported figures known at the time of reporting (100 cases). Validated data will be published by HPS in January 2018. Figure 3 demonstrates the origin of the SABs in this quarter. Just over half of all cases were hospital acquired. Confirmed SAB cases have decreased on the previous quarter. The antimicrobial management team (AMT) issued additional guidance regarding the prompt identification of SABs and the importance of the correct duration of antimicrobial therapy in May 2017. The AMT and IPCT will continue to support the implementation of this guidance and continue to monitor any impact.
Figure 3 Origin of SAB between 01/07/17 – 30/09/17
Hospital Acquired (HAI) (n= 49)
42%
Healthcare Associated (HCAI) (n= 37)
32%
Community (n= 30)26%
NHSGGCOrigin of SAB Cases Q2 2017 (n= 116)
Hospital Acquired (HAI) (n= 52)52%
Healthcare Associated (HCAI) (n= 24)
24%
Community (n= 24)24%
NHSGGCOrigin of SAB Cases Q3 2017 (n= 100)
‘Out of Hospital Infections’
‘Out of Hospital Infections’

Official Sensitive
Official Sensitive 6
NHSGGC MRSA Screening Project CRA compliance for Q2 (July - September 2017) in GGC was 89%. Ward compliance rates are returned to the Sector / Directorate Senior Management Teams to identify areas that require support / education in relation to improved screening. Table 3 shows the CRA compliance rate over the past four quarters. Please note that reporting quarters for this project are different to those used for CDI, SAB and SSI
2016-17 Q3 (Oct-Dec)
2016-17 Q4 (Jan-Mar)
2017-18 Q1 (Apr-Jun)
2017-18 Q2 (Jul-Sep)
Greater Glasgow & Clyde 88% 81% 92% 89%
Scotland 82% 79% 85% tbc
Table 3.Quarterly screening compliance National Data Source: HPS MRSA Screening Team June 2017

Official Sensitive
Official Sensitive 7
Clostridium difficile Surveillance and Actions
Figure 4: CDI patient cases by quarter
Summary
Figure 4 above shows quarterly variation of all CDI cases from April 2015 to September 2017. Quarter 2: 2017 (April - June) Surveillance In the last published report NHSGGC reported 30.8 CDI cases per 100,000 AOBD (103 cases). This is above the NHS Scotland national CDI rate of 27.6, but below the 2017 HEAT requirements. Quarter 3: 2017 (July – September) Local Surveillance Status Local surveillance has identified an increase on the previous quarter with 131 reported cases. (Figure 4). 104 cases were identified from patients who were inpatients, although it should be noted that a fifth of CDI cases were from specimens obtained from GP practices. (Figure 5).
Apr-Jun 2015
Jul-Sep 2015
Oct-Dec 2015
Jan-Mar 2016
Apr-Jun 2016
Jul-Sep 2016
Oct-Dec 2016
Jan-Mar 2017
Apr-Jun 2017
Jul-Sep 2017
Oct-Dec 2017
Jan-Mar 2018
All CDI - GGC 107 101 139 92 87 120 78 93 103 131
Target - GGC 110 110 110 110 110 110 110 110 105 105 105 105
0
20
40
60
80
100
120
140
160
180
Nu
mb
er
of
CD
I ca
ses
by
rep
ort
ing
Qu
arte
r
Clostridium difficile cases in ages 15 & over to achieve HEAT target /LDP requirements
Q3-2017 unvalidated 131 patient cases
Q2-2017 : Target reduced to reflectreduction in occupied bed daysacross GGC

Official Sensitive
Official Sensitive 8
Figure 5. Proportion of CDI specimens taken in GP practices versus hospital in-patients
CDI Cases (Q3 July - September)
Origin Number of Cases
Hospital acquired (HAI) 42
Healthcare associated (HCAI) 40
Community associated 35
Indeterminate 14
Total 131 Table 4. Origin of CDI (note: some GP specimens may be healthcare associated or indeterminate)
CDI July – Heath Protection Scotland Analysis Local surveillance identified an increase in the number of CDI cases in July. These cases had no obvious links to individual clinical areas, and after discussion with HPS the IPCT proactively sent all the isolates of CDI available for typing. HPS completed their analysis in August and the only issue they raised, was the identification of four patients with CDI Ribotype 005 across RAH and IRH, that could potentially be linked. A further review of the four cases was undertaken on the advice of HPS and it was confirmed that they did not have contact with each other in wards in RAH or IRH. The patients were also not from a single post code area. None were hospital acquired. A report has been returned to HPS. Current Quarter 4 status Local surveillance of CDI has shown a reduction in the number of cases for the first two months of the current Quarter with a total of 68 patient cases. OUTBREAKS / EXCEPTIONS (Reported are those that are assessed as AMBER or RED using the HPS HIIAT tool) There were no incidents or outbreaks assessed as AMBER or RED during September/October. November 2017 QEUH – Orthopaedics, Possible Carbapenemase Resistant Pseudomonas aeruginosa Transmission. 3 patients with Pseudomonas aeruginosa isolated from wounds. IMT held 03/11/17. HIIAT Red in the first instance due to the possibility of cross transmission of a resistant organism, however, following a review of the isolates they were confirmed as distinct, therefore the incident was downgraded to HIIAT Green.
Specimens taken by GP (n=27)
21%
Specimens taken in hospital (n=104)
79%
CDI specimen location Q3-2017 (n=131)

Official Sensitive
Official Sensitive 9
Norovirus Norovirus activity was reported in 1 hospital in September 2017 where 2 wards were closed and in 2 hospitals in October 2017 where 2 wards were closed.
Month
No
v-1
6
Dec-1
6
Jan
-17
Feb
-17
Mar-
17
Ap
r-17
May-1
7
Ju
n-1
7
Ju
l-17
Au
g -
17
Sep
-17
Oct-
17
Ward Closures 5 11 3 6 4 5 2 2* 0 0 2 2
Bed Days Lost 115 136 38 61 160 121 53 39 0 0 10 49
Table 5: NHSGGC Ward closures due to suspected/confirmed Norovirus. *Both wards closed in May and remained closed in to the start of June
Data on the numbers of wards closed due to confirmed or suspected Norovirus is available from HPS on a weekly basis: http://www.hps.scot.nhs.uk/giz/norovirussurveillance.aspx Healthcare Environment Inspectorate (HEI) There has been no unannounced HEI / HAI inspection since the last published HAIRT. Other HAI Related Activity Surgical Site Infection (SSI) Surveillance All NHS Boards are required to undertake in-patient and 30-day re-admission surveillance as per HDL (2006) 38 and CEL (11) 2009. Quarter 2 (April - June 2017)
Category of Procedure
Operations Infections NHSGGC SSI rate
(%)
NHSGGC 95% CI
National Dataset SSI rate
(%)
National 95% CI
Caesarean section
1316 10 0.8 0.4,1.3 1.2 0.9,1.6
Hip arthroplasty 443 7 1.6 0.7,3.2 0.7 0.4,1.1
Table 6. SSI rates for Caesarean section (in-patient and PDS to day 10), Hip arthroplasty (in-patient and re-admission to day-30), NHS GG&C
Between April - June 2017, the SSI rate of 1.6% for hip arthroplasty was above the national average of 0.7%, but within NHSGGC confidence intervals (0.7-3.2). It should be noted that six of the identified infections were in complex revision arthroplasty operations, which have associated risk factors and therefore are at a higher risk of infection. Caesarean section procedures this quarter had a lower SSI rate than the national average (table 6 above) and were also under national confidence intervals (0.9-1.6).

Official Sensitive
Official Sensitive 10
Q3 (July - September 2017) Local SSI Surveillance Status Surveillance to 30 day post operatively is now complete for the quarter and local data, at time of publication, for July - September 2017 is displayed in Table 7 below. Surveillance of the following procedures commenced in July 2016 (in-patient and 30-day re-admission) Large Bowel surgery (GGC wide)
Major Vascular surgery (QEUH)
Craniotomy, Craniectomy and Cranioplasty (Institute of Neurological Sciences, QEUH campus)
Spinal surgery (Institute of Neurological Sciences) It should be noted that the above surgical procedures will not be included in the national reporting figures or published by Health Protection Scotland therefore caution should be exercised when interpreting local SSI rates in future publications to enable local baseline data to be established. Large bowel and major vascular surgery became a mandatory requirement for SSI surveillance in April 2017 and as these are new categories of surveillance comparative data is awaited, however NHSGGC rates are below those in the published literature.
Quarter 3-17 (July - September) : Local SSI Surveillance Status (correct at time of reporting)
Category of Procedure Operations Infections NHSGGC SSI Rate (%)
Mandatory
(reported to HPS)
Caesarean section 1360 12 0.9
Hip arthroplasty 343 2 0.6
Large Bowel Surgery 223 10 4.5
Major Vascular Surgery 192 11 5.7
Voluntary Knee arthroplasty 345 2 0.6
Repair of neck of femur 402 5 1.2
Additional
INS, QEUH only
Cranial Surgery 165 4 2.4
Spinal Surgery 175 5 2.9
Table 7. Local SSI Surveillance 01/07/17 - 30/09/17(In-patient and 30 day readmission; C-section in-patient and PDS to day 10) .
Statistical Process Control Charts All Hospital Level Statistical Process Control Charts (SPCs) continue to remain within normal control limits. Cleaning and the Healthcare Environment All areas within NHSGGC scored GREEN (>90%) in the most recent report on the National Cleaning Specification.

Official Sensitive
Official Sensitive 11
Healthcare Associated Infection Reporting Template (HAIRT)
Section 2 – Healthcare Associated Infection Report Cards The following section is a series of ‘Report Cards’ that provide information for each acute hospital and key community hospitals in the Board, on the number of cases of Staphylococcus aureus blood stream infections (also broken down into MSSA and MRSA) and Clostridium difficile infections, as well as hand hygiene and cleaning compliance. In addition there is a single report card which covers all community hospitals [which do not have individual cards] and a report which covers infections identified as having been contracted from outwith hospital. The information in the report cards is provisional local data and may differ from the national surveillance reports carried out by Health Protection Scotland (HPS) and Health Facilities Scotland (HFS). The national reports are official statistics which undergo rigorous validation which means final national figures may differ from those reported here. However these reports aim to provide more detailed and up-to-date information on HAI activities at local level than is possible to provide through the national statistics.
Understanding the Report Cards – Infection Case Numbers Clostridium difficile infections (CDI) and Staphylococcus aureus bacteraemia (SAB) cases are presented for each hospital, broken down by month. SAB cases are further broken down into Meticillin Sensitive Staphylococcus aureus (MSSA) and Meticillin Resistant Staphylococcus aureus (MRSA). More information on these organisms can be found on the HPS website: Clostridium difficile:http://www.hps.scot.nhs.uk/haiic/sshaip/clostridiumdifficile.aspx?subjectid=79 Staphylococcus aureus Bacteraemia: http://www.hps.scot.nhs.uk/haiic/sshaip/mrsabacteraemiasurveillance.aspx?subjectid=D For each hospital the total number of cases for each month are those which have been reported as positive from a laboratory report on samples taken more than 48 hours after admission. For the purposes of these reports positive samples taken from patients within 48 hours of admission will be considered to be confirmation that the infection was contracted prior to hospital admission and will be shown in the “out of hospital” report card.
Targets There are national targets associated with reductions in C. diff and SABs. More information on these can be found on the Scotland Performs website: http://www.scotland.gov.uk/About/Performance/scotPerforms/partnerstories/NHSScotlandperformance
Understanding the Report Cards – Hand Hygiene Compliance Hospitals carry out regular audits of how well their staff are complying with hand hygiene. The Board report card presents the combined percentage of hand hygiene compliance with both opportunity taken and technique used broken down by staff group.
Understanding the Report Cards – Cleaning Compliance Hospitals strive to keep the care environment as clean as possible. This is monitored through cleaning and estates compliance audits. More information on how hospitals carry out these audits can be found on the HFS website: http://www.hfs.scot.nhs.uk/online-services/publications/hai/
Understanding the Report Cards – ‘Out of Hospital Infections’ CDI and SAB cases (including MRSA) are all associated with being treated in hospitals however this is not the only place a patient may contract an infection. This total will also include infection from community sources such as GP surgeries and care homes. The final Report Card report in this section covers ‘Out of Hospital Infections’ and reports on SAB and CDI cases reported to a Health Board which are not attributable to a hospital.

Official Sensitive 12
NHS GREATER GLASGOW & CLYDE REPORT CARD Staphylococcus aureus bacteraemia monthly case numbers
Nov 2016
Dec 2016
Jan 2017
Feb 2017
Mar 2017
Apr 2017
May 2017
Jun 2017
Jul 2017
Aug 2017
Sep 2017
Oct 2017
MRSA 1 0 3 0 3 1 2 1 0 1 1 3
MSSA 39 30 33 30 45 42 27 43 32 31 35 34
Total SABS
40 30 36 30 48 43 29 44 32 32 36 37
Clostridium difficile infection monthly case numbers
Nov 2016
Dec 2016
Jan 2017
Feb 2017
Mar 2017
Apr 2017
May 2017
Jun 2017
Jul 2017
Aug 2017
Sep 2017
Oct 2017
Ages
15-64 6 5 7 11 18 12 13 10 18 16 15 15
Ages
65 plus 23 15 20 26 11 16 28 24 27 25 30 17
Total Ages
15 plus 29 20 27 37 29 28 41 34 45 41 45 32
Hand Hygiene Monitoring Compliance (%)
Nov 2016
Dec 2016
Jan 2017
Feb 2017
Mar 2017
Apr 2017
May 2017
Jun 2017
Jul 2017
Aug 2017
Sep 2017
Oct 2017
Board
Total 98 98 98 98 97 97 97 97 97 97 97 97
Cleaning Compliance (%)
Nov 2016
Dec 2016
Jan 2017
Feb 2017
Mar 2017
Apr 2017
May 2017
Jun 2017
Jul 2017
Aug 2017
Sep 2017
Oct 2017
Board
Total 95.7 96.0 95.4 95.5 95.7 95.5 95.6 95.4 95.2 95.2 95.3 95.2
Estates Monitoring Compliance (%)
Nov 2016
Dec 2016
Jan 2017
Feb 2017
Mar 2017
Apr 2017
May 2017
Jun 2017
Jul 2017
Aug 2017
Sep 2017
Oct 2017
Board
Total 98.8 98.9 99.3 99.2 99.0 99.0 99.1 99.3 99.0 99.2 98.9 98.9

Official Sensitive 13
GLASGOW ROYAL INFIRMARY / PRINCESS ROYAL MATERNITY
REPORT CARD
Staphylococcus aureus bacteraemia monthly case numbers
Nov 2016
Dec 2016
Jan 2017
Feb 2017
Mar 2017
Apr 2017
May 2017
Jun 2017
Jul 2017
Aug 2017
Sep 2017
Oct 2017
MRSA 0 0 0 0 0 1 1 0 0 0 0 0
MSSA 5 1 5 3 9 2 8 4 1 2 9 2
Total
SABS 5 1 5 3 9 3 9 4 1 2 9 2
Clostridium difficile infection monthly case numbers
Nov 2016
Dec 2016
Jan 2017
Feb 2017
Mar 2017
Apr 2017
May 2017
Jun 2017
Jul 2017
Aug 2017
Sep 2017
Oct 2017
Ages
15-
64
1 0 0 2 0 2 5 1 2 1 0 1
Ages
65
plus
3 4 3 0 0 5 2 5 3 5 3 4
Ages
15
plus
4 4 3 2 0 7 7 6 5 6 3 5
Cleaning Compliance (%)
Nov 2016
Dec 2016
Jan 2017
Feb 2017
Mar 2017
Apr 2017
May 2017
Jun 2017
Jul 2017
Aug 2017
Sep 2017
Oct 2017
Board
Total 95.7 95.8 95.8 96.0 96.0 96.0 96.0 96.0 95.9 95.6 95.6 95.8
Estates Monitoring Compliance (%)
Nov 2016
Dec 2016
Jan 2017
Feb 2017
Mar 2017
Apr 2017
May 2017
Jun 2017
Jul 2017
Aug 2017
Sep 2017
Oct 2017
Board
Total 99.7 99.8 99.7 99.7 99.6 99.8 99.6 99.7 99.0 99.7 99.5 99.6

Official Sensitive 14
ROYAL ALEXANDRA HOSPITAL REPORT CARD Staphylococcus aureus bacteraemia monthly case numbers
Nov 2016
Dec 2016
Jan 2017
Feb 2017
Mar 2017
Apr 2017
May 2017
Jun 2017
Jul 2017
Aug 2017
Sep 2017
Oct 2017
MRSA 0 0 0 0 1 0 1 0 0 0 0 0
MSSA 0 2 3 0 2 0 0 2 2 1 2 4
Total
SABS 0 2 3 0 3 0 1 2 2 1 2 4
Clostridium difficile infection monthly case numbers
Nov 2016
Dec 2016
Jan 2017
Feb 2017
Mar 2017
Apr 2017
May 2017
Jun 2017
Jul 2017
Aug 2017
Sep 2017
Oct 2017
Ages
15-
64
1 1 0 0 1 0 0 2 0 0
0 0
Ages
65
plus
3 2 3 1 1 1 0 1 4 3 1 0
Ages
15
plus
4 3 3 1 2 1 0 3 4 3 1 0
Cleaning Compliance (%)
Nov 2016
Dec 2016
Jan 2017
Feb 2017
Mar 2017
Apr 2017
May 2017
Jun 2017
Jul 2017
Aug 2017
Sep 2017
Oct 2017
Board
Total 96.4 96.2 96.3 96.5 95.3 96.2 96.2 95.1 96.2 96.2 95.4 95.9
Estates Monitoring Compliance (%)
Nov 2016
Dec 2016
Jan 2017
Feb 2017
Mar 2017
Apr 2017
May 2017
Jun 2017
Jul 2017
Aug 2017
Sep 2017
Oct 2017
Board
Total 97.8 96.4 98.3 99.0 97.4 98.2 99.1 98.5 99.0 98.5 96.7 98.4

Official Sensitive 15
INVERCLYDE ROYAL HOSPITAL REPORT CARD Staphylococcus aureus bacteraemia monthly case numbers
Nov 2016
Dec 2016
Jan 2017
Feb 2017
Mar 2017
Apr 2017
May 2017
Jun 2017
Jul 2017
Aug 2017
Sep 2017
Oct 2017
MRSA 0 0 0 0 0 0 0 0 0 0 0 0
MSSA 1 1 2 1 1 0 0 2 0 2 1 1
Total
SABS 1 1 2 1 1 0 0 2 0 2 1 1
Clostridium difficile infection monthly case numbers
Nov 2016
Dec 2016
Jan 2017
Feb 2017
Mar 2017
Apr 2017
May 2017
Jun 2017
Jul 2017
Aug 2017
Sep 2017
Oct 2017
Ages
15-
64
0 0 0 1 0 0 0 0 0 0 0 0
Ages
65
plus
2 2 1 1 0 0 2 1 0 2 0 0
Ages
15
plus
2 2 1 2 0 0 2 1 0 2 0 0
Cleaning Compliance (%)
Nov 2016
Dec 2016
Jan 2017
Feb 2017
Mar 2017
Apr 2017
May 2017
Jun 2017
Jul 2017
Aug 2017
Sep 2017
Oct 2017
Board
Total 96.5 95.6 94.9 95.3 95.4 95.0 94.5 95.8 95.2 96.3 94.7 95.6
Estates Monitoring Compliance (%)
Nov 2016
Dec 2016
Jan 2017
Feb 2017
Mar 2017
Apr 2017
May 2017
Jun 2017
Jul 2017
Aug 2017
Sep 2017
Oct 2017
Board
Total 97.9 96.8 97.1 96.5 97.4 96.7 95.8 97.5 99.0 98.3 97.8 97.8

Official Sensitive 16
VALE OF LEVEN HOSPITAL REPORT CARD
Staphylococcus aureus bacteraemia monthly case numbers
Nov 2016
Dec 2016
Jan 2017
Feb 2017
Mar 2017
Apr 2017
May 2017
Jun 2017
Jul 2017
Aug 2017
Sep 2017
Oct 2017
MRSA 0 0 0 0 0 0 0 0 0 0 0 0
MSSA 0 0 0 0 0 1 0 0 0 0 0 0
Total
SABS 0 0 0 0 0 1 0 0 0 0 0 0
Clostridium difficile infection monthly case numbers
Nov 2016
Dec 2016
Jan 2017
Feb 2017
Mar 2017
Apr 2017
May 2017
Jun 2017
Jul 2017
Aug 2017
Sep 2017
Oct 2017
Ages
15-
64
0 0 0 0 0 0 0 0 0 0 0 0
Ages
65
plus
0 1 0 0 0 0 0 0 0 0 0 0
Ages
15
plus
0 1 0 0 0 0 0 0 0 0 0 0
Cleaning Compliance (%)
Nov 2016
Dec 2016
Jan 2017
Feb 2017
Mar 2017
Apr 2017
May 2017
Jun 2017
Jul 2017
Aug 2017
Sep 2017
Oct 2017
Board
Total 97.5 97.7 97.2 97.4 97.2 97.6 97.6 97.3 97.5 97.5 97.7 97.7
Estates Monitoring Compliance (%)
Nov 2016
Dec 2016
Jan 2017
Feb 2017
Mar 2017
Apr 2017
May 2017
Jun 2017
Jul 2017
Aug 2017
Sep 2017
Oct 2017
Board
Total 99.5 99.8 99.6 99.4 99.7 99.6 99.6 99.6 99.0 99.7 99.8 99.5

Official Sensitive 17
GARTNAVEL GENERAL HOSPITAL
REPORT CARD Figures combined for Gartnavel General Hospital, The Beatson WoSCC and Homeopathic Hospital Staphylococcus aureus bacteraemia monthly case numbers
Nov 2016
Dec 2016
Jan 2017
Feb 2017
Mar 2017
Apr 2017
May 2017
Jun 2017
Jul 2017
Aug 2017
Sep 2017
Oct 2017
MRSA 0 0 0 0 0 0 0 0 0 0 0 0
MSSA 1 0 1 0 0 0 0 3 2 0 0 0
Total
SABS 1 0 1 0 0 0 0 3 2 0 0 0
Clostridium difficile infection monthly case numbers
Nov 2016
Dec 2016
Jan 2017
Feb 2017
Mar 2017
Apr 2017
May 2017
Jun 2017
Jul 2017
Aug 2017
Sep 2017
Oct 2017
Ages
15-
64
0 0 1 0 0 2 0 0 3 0 1 1
Ages
65
plus
0 1 1 2 1 1 2 2 2 0 1 0
Ages
15
plus
0 1 2 2 1 3 2 2 5 0 2 1
Cleaning Compliance (%)
Nov 2016
Dec 2016
Jan 2017
Feb 2017
Mar 2017
Apr 2017
May 2017
Jun 2017
Jul 2017
Aug 2017
Sep 2017
Oct 2017
Board
Total 95.9 96.7 96.1 96.9 97.1 96.5 96.9 96.9 96.2 96.4 97.1 96.2
Estates Monitoring Compliance (%)
Nov 2016
Dec 2016
Jan 2017
Feb 2017
Mar 2017
Apr 2017
May 2017
Jun 2017
Jul 2017
Aug 2017
Sep 2017
Oct 2017
Board
Total 99.2 99.5 99.5 99.6 99.5 99.2 99.4 99.5 99.0 99.6 99.4 99.6

Official Sensitive 18
QUEEN ELIZABETH UNIVERSITY HOSPITAL
REPORT CARD Staphylococcus aureus bacteraemia monthly case numbers
Nov 2016
Dec 2016
Jan 2017
Feb 2017
Mar 2017
Apr 2017
May 2017
Jun 2017
Jul 2017
Aug 2017
Sep 2017
Oct 2017
MRSA 0 0 0 0 0 0 0 0 0 1 1 1
MSSA 6 6 4 4 6 6 2 6 6 3 10 4
Total
SABS 6 6 4 4 6 6 2 6 6 4 11 5
Clostridium difficile infection monthly case numbers
Nov 2016
Dec 2016
Jan 2017
Feb 2017
Mar 2017
Apr 2017
May 2017
Jun 2017
Jul 2017
Aug 2017
Sep 2017
Oct 2017
Ages
15-
64
1 1 1 0 4 0 1 0 1 2 1 1
Ages
65
plus
4 2 2 4 2 2 6 1 2 1 3 3
Ages
15
plus
5 3 3 4 6 2 7 1 3 3 4 4
Cleaning Compliance (%)
Nov 2016
Dec 2016
Jan 2017
Feb 2017
Mar 2017
Apr 2017
May 2017
Jun 2017
Jul 2017
Aug 2017
Sep 2017
Oct 2017
Board
Total 94.5 95.3 94.0 92.9 94.7 93.2 93.8 91.8 92.0 91.1 93.3 91.4
Estates Monitoring Compliance (%)
Nov 2016
Dec 2016
Jan 2017
Feb 2017
Mar 2017
Apr 2017
May 2017
Jun 2017
Jul 2017
Aug 2017
Sep 2017
Oct 2017
Board
Total 99.2 99.6 99.9 99.8 99.9 99.7 99.2 99.9 99.0 99.6 99.7 99.5

Official Sensitive 19
ROYAL HOSPITAL FOR CHILDREN REPORT CARD Staphylococcus aureus bacteraemia monthly case numbers
Nov 2016
Dec 2016
Jan 2017
Feb 2017
Mar 2017
Apr 2017
May 2017
Jun 2017
Jul 2017
Aug 2017
Sep 2017
Oct 2017
MRSA 0 0 0 0 0 0 0 0 0 0 0 0
MSSA 2 1 0 1 1 3 0 4 1 1 4 0
Total
SABS 2 1 0 1 1 3 0 4 1 1 4 0
Clostridium difficile infection monthly case numbers (in ages 15 & over only)
Nov 2016
Dec 2016
Jan 2017
Feb 2017
Mar 2017
Apr 2017
May 2017
Jun 2017
Jul 2017
Aug 2017
Sep 2017
Oct 2017
Ages
15
plus
0 0 0 0 0 0 0 0 0 0 0 0
Cleaning Compliance (%)
Nov 2016
Dec 2016
Jan 2017
Feb 2017
Mar 2017
Apr 2017
May 2017
Jun 2017
Jul 2017
Aug 2017
Sep 2017
Oct 2017
Board
Total 96.3 96.0 95.1 96.5 94.4 94.9 93.6 94.3 93.9 95.2 93.3 94.1
Estates Monitoring Compliance (%)
Nov 2016
Dec 2016
Jan 2017
Feb 2017
Mar 2017
Apr 2017
May 2017
Jun 2017
Jul 2017
Aug 2017
Sep 2017
Oct 2017
Board
Total 99.9 99.4 99.5 99.0 99.5 99.5 99.7 98.8 99.0 99.5 99.5 99.1
Official Sensitive 20
NHS GREATER GLASGOW & CLYDE
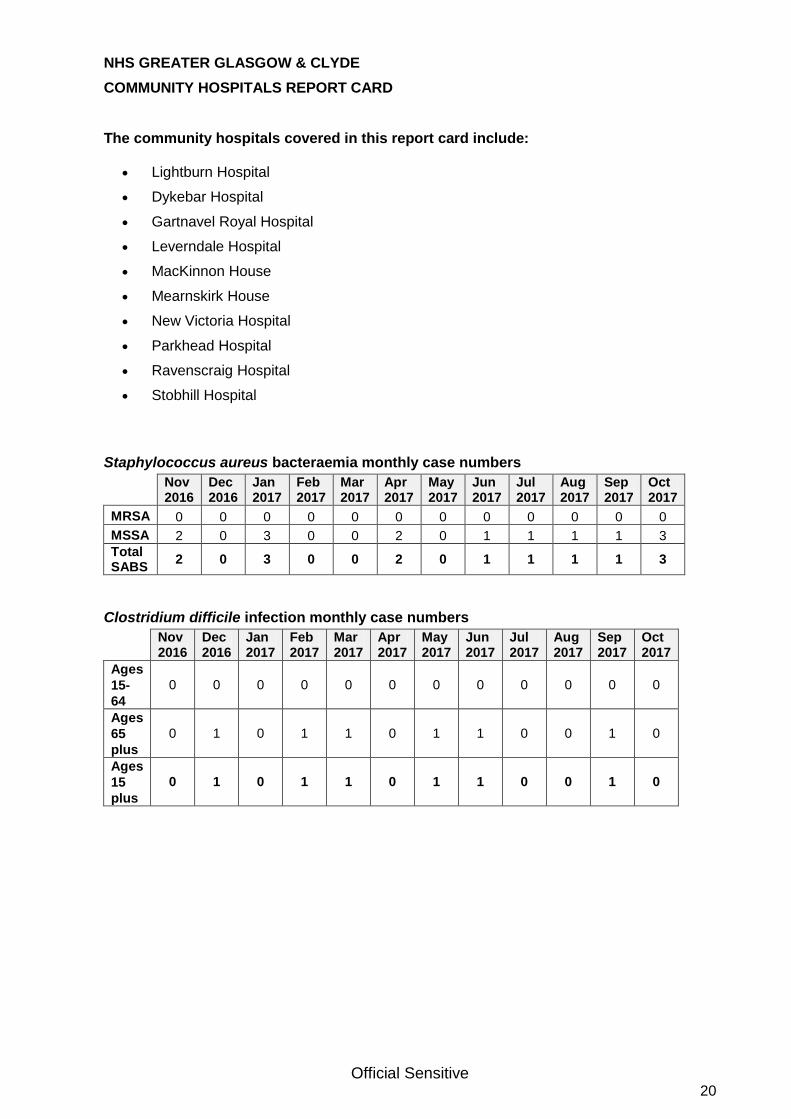
COMMUNITY HOSPITALS REPORT CARD The community hospitals covered in this report card include:
Lightburn Hospital
Dykebar Hospital
Gartnavel Royal Hospital
Leverndale Hospital
MacKinnon House
Mearnskirk House
New Victoria Hospital
Parkhead Hospital
Ravenscraig Hospital
Stobhill Hospital
Staphylococcus aureus bacteraemia monthly case numbers
Nov 2016
Dec 2016
Jan 2017
Feb 2017
Mar 2017
Apr 2017
May 2017
Jun 2017
Jul 2017
Aug 2017
Sep 2017
Oct 2017
MRSA 0 0 0 0 0 0 0 0 0 0 0 0
MSSA 2 0 3 0 0 2 0 1 1 1 1 3
Total SABS
2 0 3 0 0 2 0 1 1 1 1 3
Clostridium difficile infection monthly case numbers
Nov 2016
Dec 2016
Jan 2017
Feb 2017
Mar 2017
Apr 2017
May 2017
Jun 2017
Jul 2017
Aug 2017
Sep 2017
Oct 2017
Ages
15-
64
0 0 0 0 0 0 0 0 0 0 0 0
Ages
65
plus
0 1 0 1 1 0 1 1 0 0 1 0
Ages
15
plus
0 1 0 1 1 0 1 1 0 0 1 0

Official Sensitive 21
NHS GREATER GLASGOW & CLYDE
OUT OF HOSPITAL REPORT CARD Staphylococcus aureus bacteraemia monthly case numbers
Nov 2016
Dec 2016
Jan 2017
Feb 2017
Mar 2017
Apr 2017
May 2017
Jun 2017
Jul 2017
Aug 2017
Sep 2017
Oct 2017
MRSA 1 0 3 0 2 0 0 1 0 0 0 2
MSSA 22 19 15 21 26 28 17 21 19 21 8 20
Total SABS
23 19 18 21 28 28 17 22 19 21 8 22
Clostridium difficile infection monthly case numbers
Nov 2016
Dec 2016
Jan 2017
Feb 2017
Mar 2017
Apr 2017
May 2017
Jun 2017
Jul 2017
Aug 2017
Sep 2017
Oct 2017
Ages
15-64 3 3 5 8 13 8 7 7 12 13 13 12
Ages
65
plus
11 2 10 17 6 7 15 13 16 14 21 10
Ages
15
plus
(Total)
14 5 15 25 19 15 22 20 28 27 34 22
Data for Staphylococcus aureus bacteraemia (SAB) cases:
56% of all Staphylococcus aureus Bacteraemia cases reported in NHSGGC between November 2016 and October 2017 are attributed as Out of Hospital infections. Data for Clostridium difficile Infection (CDI) cases in ages 15 plus:
60% of all CDI cases reported in NHSGGC between November 2016 and October 2017 are attributed as Out of Hospital infections.

Official Sensitive 22
Appendix

Official Sensitive 23
http://www.nhsggc.org.uk/your-health/infection-prevention-and-control/education-training/pvc-insertion-good-practice-video

Official Sensitive 24
GLOSSARY
AMT Antimicrobial Management Team
AOBD Acute Occupied Bed Days
Alert organism alert condition
Any of a number of organisms or infections that could indicate, or cause, outbreaks of infection in the hospital or community.
Bacteraemia Infection in the blood. Also known as Blood Stream Infection (BSI).
CDI Clostridium difficile Infection. Also referred to as C. diff is a Gram-positive spore-forming anaerobic bacterium. C. difficile is the most common cause of gastro-intestinal infection in hospitals. It causes two conditions; antibiotic associated diarrhoea and the more severe and occasionally life-threatening pseudomembranous colitis. Control of the organism can be problematic due to the formation of spores and difficulty in removing them. Patients who have had antibiotics within the last eight weeks are most at risk of acquisition of the organism.
CEL Chief Executive Letter issued by Scottish Government Health Directorates (SGHD)
CRA Clinical Risk Assessment
CVC Central Vascular Catheter
Code of Practice
Code of Practice - The NHS Scotland Code of Practice for the Local Management of Hygiene and
Healthcare Associated Infection issued 2004 contains the components that must be complied with by all NHS HCWs in Scotland. http://www.scotland.gov.uk/Publications/2004/05/19315/36624
GRO General Registers Office
HAI Originally used to mean hospital acquired infection, the official ‘Scottish Government’ term is now Healthcare Associated Infection. These are considered to be infections that were not incubating prior to contact with a
healthcare facility or undergoing a healthcare intervention. It must be noted that HAI infection is not always an avoidable infection. Please note that for S.aureus Bacteraemia surveillance – HAI refers to ‘hospital
acquired cases as per HPS National reporting requirements. See http://www.documents.hps.scot.nhs.uk/hai/sshaip/guidelines/s-aureus/esab-protocol-v2-2014-11.pdf
HCAI Healthcare Associated Infection (for CDI and SAB classification)
HCW Healthcare Worker
HDL Health Department Letter
HDU High Dependency Unit
HEAT Target Health Efficiency and Access to Treatment. Targets set by the Scottish Government.
HFS Health Facilities Scotland
HH Hand Hygiene
HIIAT Hospital Infection Incident Assessment Tool
HIIORT Healthcare Infection Incident and Outbreak Reporting Template
HIS Health Improvement Scotland
HPS Health Protection Scotland
ICN / T / D / M Infection Control Nurse / Team / Doctor / Manager
ICP Infection Control Programme
ICU Intensive Care Unit
ISD Information Services Division A division of National Services Scotland, part of NHS Scotland. ISD
provides health information, health intelligence, statistical services and advice that support the NHS in progressing quality improvement in health and care, and facilitates robust planning and decision making.
KPI Key Performance Indicator
MRSA Meticillin resistant Staphylococcus aureus. A Staphylococcus aureus resistant to first line antibiotics;
most commonly known as a hospital acquired organism.
MSSA Meticillin Sensitive Staphylococcus aureus
OPAT Outpatient Parenteral Antibiotic Therapy
PDS Post Discharge Surveillance (Caesarean Section procedures only)
PFPI Public Focus Patient Involvement
PHPU Public Health Protection Unit
PPI Proton Pump Inhibitors. A group of medications used to decrease gastric acid production.
PVC Peripheral Vascular Catheter
QIF Quality Improvement Facilitator
RRT Renal Replacement Therapy
RSV Respiratory Syncytial Virus. A contagious respiratory infection.
SAB Staphylococcus aureus Bacteraemia
SCN / M Senior Charge Nurse / Midwife
SICP Standard Infection Control Precautions
SGHD Scottish Government Health Directorate
SOP Standard Operating Procedure
SPC Statistical Process Control (Charts)
SSI Surgical Site Infection
TOBD Total Occupied Bed Days
VRE Vancomycin resistant enterococcus - an alert organism. A common organism that can be inherently
resistant to Vancomycin but can also acquire (and transfer resistance) to other organisms. Has caused outbreaks reported in the literature in a variety of high-risk settings, e.g. renal or bone marrow transplant units.