healthcare business intelligence and...
TRANSCRIPT

A N E X P L O R A T O R Y E V A L U A T I O N A N D A S S E S S M E N T O N
T H E V A L U E O F A N A L Y T I C S I N H E A L T H C A R E
HEALTHCARE BUSINESS INTELLIGENCE AND
ANALYTICS
Nick Sullivan, MHA

ABOUT ME
• UNC Grad (‘07 B.A Public Policy, ‘12 Masters Healthcare Administration)
• Gained interest in analytics while working as grad assistant at School of Public Health Business & Finance office
• Currently employed as Administrative Fellow at Novant Health in Charlotte, NC
• Looking to advance knowledge technical, clinical, strategic and financial aspects of healthcare business intelligence
• San Francisco 49er Fan

ABOUT MY EXPERIENCE
• Healthcare is a mammoth industry
• Healthcare is undergoing sweeping and disruptive
changes
• Healthcare leaders are inundated with multiple
competing and uncertain priorities
• Healthcare organizations must learn to do more
with less
• …
• Healthcare will get better.

SHOPPING FOR HOLIDAY GIFTS A LOT LIKE HEALTHCARE?
• What am I going to get for my family this year?
• 2 parents, 4 sisters, 4 nephews, 6 neices, 2 brother in-laws
• How much am I willing to spend in total?
• How old are my nieces and nephews?
• Does that affect whether or not I get them clothes or toys?
• Can I get them the same gifts and not feel bad about it?
• Did they like my gift from last year?
• What information could I use
about my family to make a
better decision?
• Age
• Gender
• Needs
• Wants
• Interests
• Current Trends
• Satisfaction with previous
gifts
• Frequency of use of previous
gifts
Questions + (∑Facts/Beliefs) – Noise = Knowledge Better Decisions Better Outcomes

RELEVANCE TO HEALTHCARE
• Grown Accustom to shaping processes and decisions based on:
• intuition,
• provider preference,
• amount and type of resources available,
• competing priorities,
• vested financial interest and
• incentives aimed at more care is better care (do it all)
• What if we had information to make decisions based on individual
patient characteristics and evidence gleaned from previous
encounters with the disease?
• How do we provide timely, efficient and cost-effective care that
resulted in ultimate patient satisfaction? ANALYTICS

THE RISING TIDE OF DATA
• World becoming awash in data, growth at 60% annually
• Widespread Healthcare EMR implementation will rapidly expand access to data
• How does healthcare make the most of its growing data?

THE VALUE-ADD OF ANALYTICS
• Healthcare Organizations must find ways to converge different types of data
to glean insight on critical aspects of running the enterprise:
• But we already create departmental reports, correct?
Clinical Administrative Financial Operational
Analytics v. Reporting
Business Intelligence Area Reporting Analytics Analyst Primary Function Building Questioning
Use of Visuals Configuring Examining
Data Relationships Consolidating Interpreting
Data Sourcing Collecting Connecting
Data End Game Summarizing Validating
Communication Method “Push” “Pull” Data Lifespan Static Dynamic
Data Orientation Look Back Look Ahead

THE HEALTHCARE ENTERPRISE INTELLIGENCE FRAMEWORK
Staging Data Warehouse Source Data Customization Client
Finance EMR
Lab Pharmacy
HR Payroll
Surgery
Centers
Dept.
Sprdshts
Legacy
Clinical
Sys
Scheduling
Physician
Clinic
Patient
Satisfaction
Market
Data Reg. & P4P
Reqmts.
Extract
Errors
Transform
Load
Clean
Condition
Scrub
Merge
Validate
Confirm
Anomaly Detect
Mapping
Fully Integrated
Standardized
Historical
One Version of Truth
Secure
Metadata
Service
Line
Disease
Specific
KPI’s
Patient
Registries
Strategic
Planning
Service
Line
Costing,
Finance
Operating
Room
Practice
Mgmt.
Multidimensional
Data Mining
Scorecards, Reports,
Dashboards
Graphs & Charts
Ad Hoc Query

KEY ENTERPRISE ELEMENTS
Source Data: data that is critical to running the business.
- Typically operational in nature and built to handle large
numbers of simple, predefined read/write transactions using
OLTP
- Integrated into data warehouse for analytical use (OLAP)
Focus Area Operational System (OLTP)
Data Warehouse (OLAP)
Orientation Application Oriented Subject Oriented
Business Use Used to run business Used to analyze and optimize business
Data Presentation Detailed & Discrete Summarized and refined
Time Orientation Current, Up to Date Snapshot of Data
Data Relationships Isolated Integrated
Frequency of Use Repetitive Access Ad-hoc access
Primary User Business Processer Business Analyst

EXTRACT, TRANSFORM, LOAD (ETL)
ETL: Process of gathering, preparing and integrating data into the
data warehouse
Extraction: data taken in “as-is” format from source
Transform: data cleaned, validated and confirmed for eligibility for
inclusion into data warehouse
Load: maps source data attributes to schema of data warehouse
Most critical part of data warehousing process as
this defines, creates and maintains the integrity
of the enterprise data.

DATA WAREHOUSE
Repository for organizational data, ultimate source for
reporting and analysis:
Subject-oriented
• The data in the data warehouse is organized so that
all the data elements relating to the same real-
world event or object are linked together.
Non-volatile
• Data in the warehouse is never deleted or
replaced. Once the data is in the data warehouse,
it is permanent and kept for reporting purposes.
Integrated
• Contains data from nearly all of the organizations
operational systems.
Time-variant
• Contains a component of time for every
operational data element.
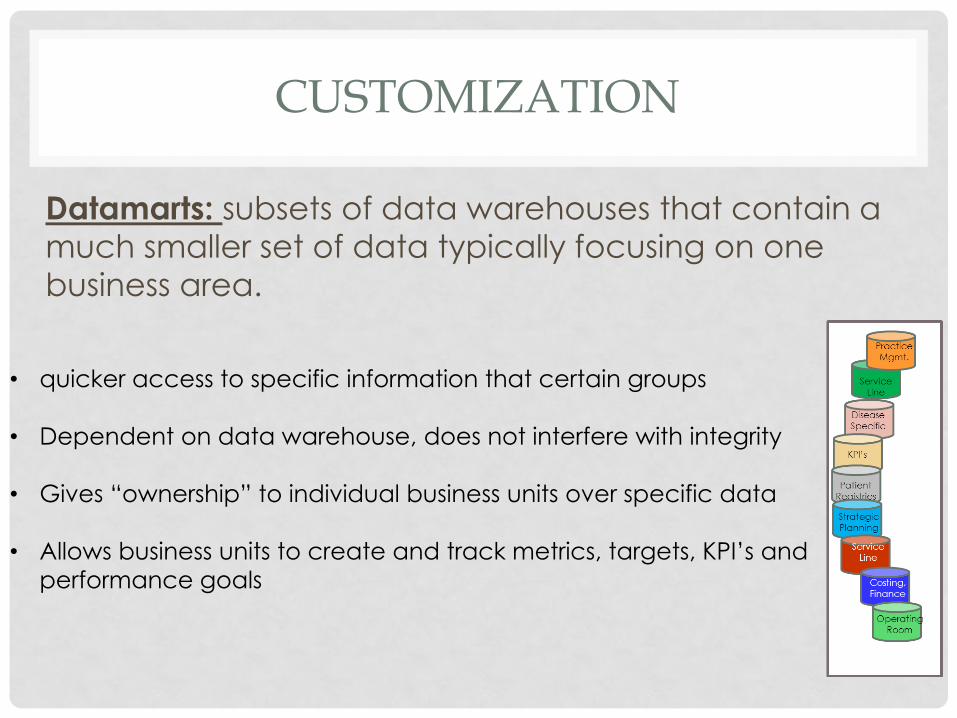
CUSTOMIZATION
Datamarts: subsets of data warehouses that contain a much smaller set of data typically focusing on one
business area.
• quicker access to specific information that certain groups
• Dependent on data warehouse, does not interfere with integrity
• Gives “ownership” to individual business units over specific data
• Allows business units to create and track metrics, targets, KPI’s and
performance goals

CUSTOMIZATION
• Online Analytical Processing (OLAP): software
process that provides a multidimensional view of
enterprise data.
• Fast
• Consistent
• Iterative process
• Reflects familiarity with user understanding of business
• Uses data cubes to create multidimensional views

OLAP CUBE
132
AMI
CHF
COPD
Pneum
A B C D Physician
Dis
ease
22
1
54
42
61 1
33 1 71
12
15 81 10
122 11 19
Provides users the ability to
create relationships and
multidimensional views of
different data sources
Can perform functions such as:
• slicing
• dicing
• pivoting
• rolling up
• drilling down

CLIENT: REPORTING AND ANALYSIS
Ad Hoc Query: Highest level of client
customization. Gives user liberty within certain
constraints to work directly with raw data
Multidimensional Data Mining: Use of OLAP tool
and cube to create various views
Scorecards, Dashboards Reports: pre-defined
views and KPI’s for specific business units and/or
goals. May allow drill down or roll up function
Graphs & Charts: typical visual representation of
predefined metrics and views
Lev
el o
f D
ata
Gra
nu
lari
ty

Patient Protection and Affordability of Care Act
- Signed into law 2010
Focuses on Triple Aim of: Increased Access, Improved Quality,
Cost Reduction
Emphasizes Value-Driven Care and shift from fee-for-service
ANALYTICS AND HEALTH REFORM
Access Quality Cost OLD:
Fee for Service
NEW:
Value Based Care

ANALYTICS AND HEALTHCARE
• Healthcare analytics is intended to improve
decision making. Healthcare Decisions can be
broken into: Tactical, Operational, Strategic
Purpose and Analytical Uses
Goal Types of Measures
Tactical Patient Level
Decisions
Patient Satisfaction Disease Mgmt. Protocol Adherence
Order Set Compliance Episode Profiling
Medication Errors Risk Scoring
Provider Performance Activity Based Costing
Operational Care Process
Stewardship & Cost Management
Care Process Variance Process Mapping
Supply Use Value-Add Analysis
Process Based Costing Care Coordination
Gap Identification
Strategic Planning & Growth
MD Network Analysis Staffing Predictions
Price Setting Pattern and Trend Recognition
Utilization Predictions Agile Marketing
Resource Channeling Community Needs Assessment

DRIVING VALUE
• As reimbursement models
change, focus will shift from
volume to value and
delivering on outcomes.
2014 Reimbursement Model:
Healthcare providers must use
data to measure, track and
improve performance in these
areas.
Value = Quality/Cost
Value Based
Purchasing

USING DATA TO CREATE VALUE
Place analytical focus on three aspects of care:
Process, Cost and Outcomes

Care process and improvement feedback loop

STANDARDIZATION, VARIATION & WASTE
• Standardization: applying uniformity across the enterprise throughout every element of care to
increase likelihood of desired outcome.
• Use data to determine which elements to standardize
• Order sets
• Treatment regimens
• Supplies
• Care channeling
• Disease Management Techniques
• Variation: deviation from standardized processes
• Helps control costs and identify areas for improvement
What works best and
produces the best
outcomes? Let data tell
you, standardize and
deploy.

WASTE
• By standardizing care processes, and applying
analytics, variation is spotted and waste or non-
value adding elements are discovered.
• Equates to a resource that has not yet been discovered or
exploited for its value.
• Increases capacity to perform primary business functions
• Saves time by omitting non-value adding steps
• Decreases cost of providing care

DRILLING DOWN TO REDUCE COSTS
• Healthcare providers must deliver on the cost element of the
Value = Quality/Cost equation.
• Data and drill-down analytics helps remove unnecessary costs
• Processes can be analyzed at different levels:
• Organization (All diabetes patients)
• Population (Females, age 32 -45)
• Patient (Ms. Jones)
2 Annual
visits on
average
15Annual
visits on
average
ED visit most
common
Well-visit most
common All Sickle
Cell Patients
Young
Old

COSTS OF: REPORTING, TIME TO ACTION & HIDDEN INSIGHT
Analytics helps reduce cost by:
1. Reducing reporting costs.
2. Increasing “time to action”.
3. Freeing hidden insight.
Business Leader/Analyst
has goal/question in
mind
Data Analyst validates,
aggregates, integrates,
models, data
Business Leader
Evaluates Strategies for
Solving Problems
Contacts data owner
Owner queues request
Analyst presents to
Information to Business
Leader
Business Decision is
made
Productivity cost incurred to
perform activity
Time to reach decision, “action”
Business Leader/Analyst
has goal/question in
mind
Business Decision is
made
Insight gained from business user
having access to analytics

COMPETING WITH ANALYTICS
Healthcare is no longer “build and they shall come”
- resources have tightened
- patients consumers have choice
• Using data to enhance reputation and recognition
• Appeal to customers with and ability to deliver on
promises and showcase facts
• Provide patients with customized, patient centered
care using data at fingertips.

SELF-SERVICE BUSINESS INTELLIGENCE
1. Who is effectively managed? Why? (Age, Zip, Ethnicity, Payor, Gender)
2. Who’s not, why? (seasonality, facility, comorbidities, procedure, visit frequency, appropriate care relationships, age)
3. What is their average total cost, LOS , and #of tests/visit?
4. Did they acquire any infections? If so What kind?
6. Of those not managed, have they had ED Visits? How Many? Time between visits? Did they get better or worse post ED?
7. Who developed post care complications? Why? (procedure error, wrong test, wrong drug, staff competence, infection)
8. What kind of complications where they?
9. Who was readmitted to hospitals?
10. What was their reason for admission?
11. Did they have intermittent communication with provider? If so, who, what type, how many?
12. What do MD, RN Manager notes say about the patients? Any pattern amongst groups?
13. Were they all from same facility?
14. Were they all from same facility?
No question is a bad question. Putting the power of analytics at the
fingertips of business experts and enabling them to question the data

Question: Why is the Cardiovascular Service Line losing market share to the competitor?
?
Data Request: please provide report that shows market share by:
Age
Ethnicity
Zip Code
Payor Group
Service Type
50 – 64 Cohort 50% Drop in Cases
Begin
billboard
campaign
to market
to seniors
Product and brand
awareness is low
Pt. Scheduling
System shows
Fewer 50-64 age
patients scheduled
Practice Mgr.: MD’s
backlogged due to
elderly throughput
65+ is directly
correlated with
cardiovascular
demand
Problem is not
awareness but
ACCESS
Increase # of nurse
practitioners to
improve throughput
With Analytics: VP Drill down capability
COMPETING WITH ANALYTICS EXAMPLE

Readily identifies patients with specific diseases. Disease "Hotspotting"
•Allows for identifying patients with high cost diseases or patients with potential to worsen due to the presence of a combination of predefined factors. Alert triggers action to monitor patients with targeted follow-up and intervention strategies.
Tracks whether patients received a service or not in a proces of care. Gap Identification
•Removes "chance" from care regimen by hardwiring specific events into process, alerting when a gap is present. Patients can be auto-populated onto a list for specific follow-up for connection to missed event.
Monitors variance from pre-defined episodes of care. Care Episodes
•Monitors activities of predefined episodes of care to avoid overutilization of services and incurrence of unnecessary costs. Episodes are grouped by disease type (Coronary Heart Failure, Chronic Obstructive Pulmonay Disease, Heart Attack, etc.)
Attaches risk score to each patient based on severity of illness and presence of comorbidities.
Risk Scoring
•Creates opportunity for providers to adequately distribute resources to patients most in need. High risk patients may depend on type of condition, medical history, demographic facts, compliance history, transition to home status, etc. This is a predictive modeling mechanism to help providers mitigate risk.
Creates running database or list of patients by disease type to facilitate population health management
Patient Registries
•Allows providers to stratify patients to better understand the clinical dynamics of their disease and its impact on operations and finances. By grouping patients into groups such as high/low cost, high/low utilization, positive/negative outcomes, relationships between clinical activity and outcomes can be created to determine best practices as well as identify patients and processes that need attention.
Identifies when patients expose the system to risk by receiving care from provider's outside of system
Continuity of Care Leakage
•For healthcare organizations that are focused on providing care for the entire patient continuum, when patients leave the system to receive care, the organization becomes exposed to risk. When patients receive care elsewhere, providers have no control over the types of care, outcomes or costs associated with that visit. By creating alerts, providers can be proactive in ensuring that patient outcomes are not jeopardized. By aggregating alerts, providers also gain insight into why patients are leaving the system (access, capacity, lack of follow-up, dissatisfaction, etc.)
Creating instant "location effect" by mapping operational , market and competitive data
GIS Enabled Activity Mapping
•By placing operational data onto a GIS enabled map, healthcare organizations can instantly see how their activity interacts across its primary and secondary service areas. This provides the organization with insight on service area demand, capacity, performance, competitive advantage/disadvantage, demographic alignment and several other location-based.
Alerts, Notifications
and Decision
Support Systems
Speeding up the
decision making
process.

CHALLENGES
• Healthcare Organizations are Overwhelmed with IT priorities • EMR implementation, training and troubleshooting is a huge task
• Data is aplenty and very much unalike • Structured and unstructured data will make integration difficult
• Cultural Barriers will slow the buy-in and uptake process • Business units feel ownership of data, threatened by increased access
• People are naturally resistance to change • Bringing “science” to decision making will take time for people to adopt
• Reimbursement is not a certainty • Data may help with financial vitality but it is not the sole answer

FINAL THOUGHTS
• Governance will play critical role in making BI a reality
• All decisions are highly scrutinized and assessed from the
highest levels of the organization
• Data has revolutionized many industries
• Healthcare is next on the innovation curve
“in times of great change, it is the learners who inherit the future,
the learned usually find themselves equipped to live in a world
that no longer exists”
- Eric Hoffer, Reflections on the Human Condition