healthyhomes 2008
TRANSCRIPT

Can We Design a Reliably Low-Moisture Affordable
House?Presented at The 2008 National Healthy Homes Conference
Baltimore, MarylandBy Melissa Malkin-Weber
Healthy Homes, Healthy Lives

Study PartnersStudy PartnersHUD Office of Healthy Homes and Lead Hazard ControlNational Institutes of Environmental Health Sciences (NIH) UNC School of Medicine Center for Environmental Medicine, Asthma, and Lung BiologyHabitat for HumanityAdvanced Energy
Presentation OverviewPresentation Overview
Origin of the study What kind of houses and what did we do to them?Relative HumidityAllergensVentilationWhere do we look from here?
High Performance HomesHigh Performance Homes
1,500+ SystemVision homes in North Carolina Primarily affordable housing 40% savings on heating and cooling compared to code-built
Can the construction standard Can the construction standard deliver deliver ““healthyhealthy””??
Program houses have promising featuresMoisture Management Combustion safety Planned ventilation
Dilution using outdoor airExhaust
Can they overcome factors like…Exhaust fan use (or not)Building product + furniture emissions Consumer products
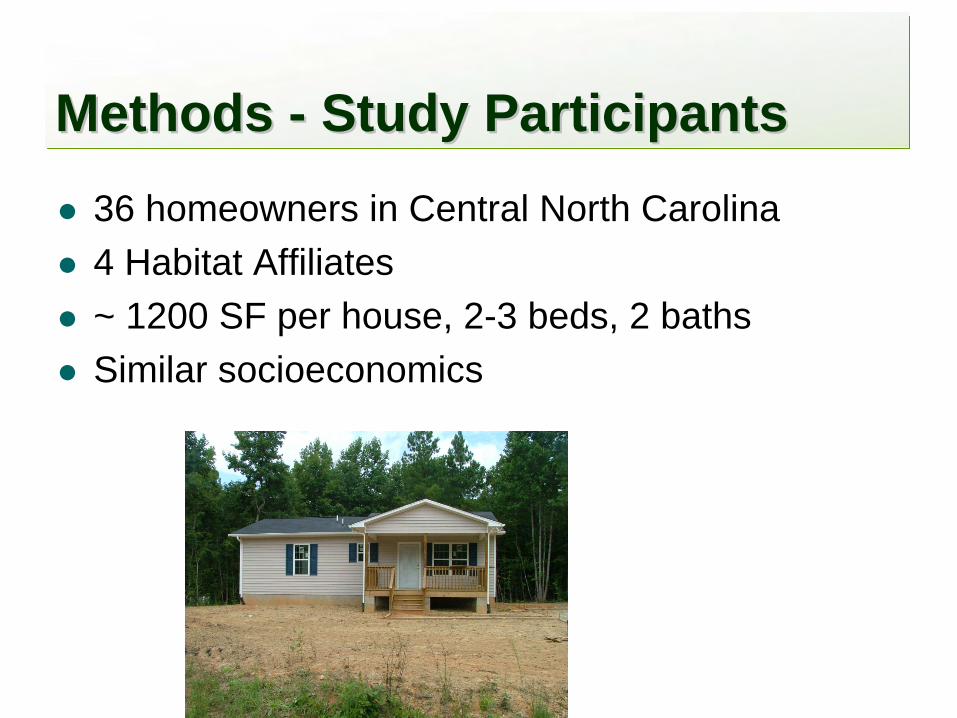
Methods Methods -- Study ParticipantsStudy Participants36 homeowners in Central North Carolina4 Habitat Affiliates~ 1200 SF per house, 2-3 beds, 2 bathsSimilar socioeconomics
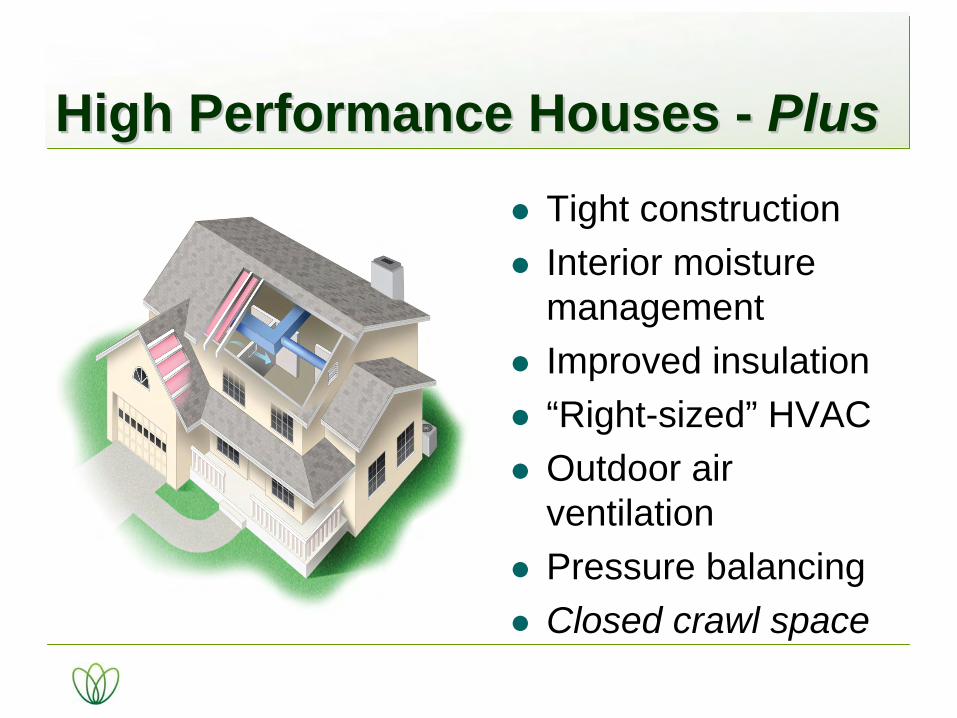
High Performance Houses High Performance Houses -- PlusPlusTight constructionInterior moisture managementImproved insulation “Right-sized” HVAC Outdoor air ventilation Pressure balancingClosed crawl space
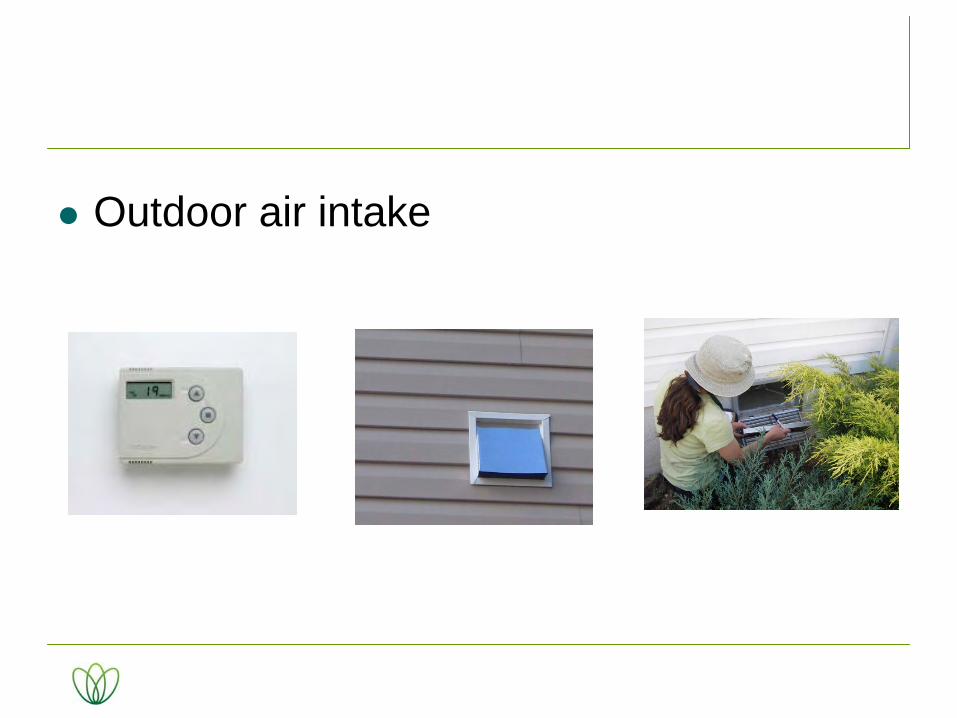
Outdoor air intake
HV
AC
tonn
age
0.00
0.25
0.50
0.75
1.00
1000 1100 1200 1300 1400 1500
TotalConditionedArea
1.5
2
2.5
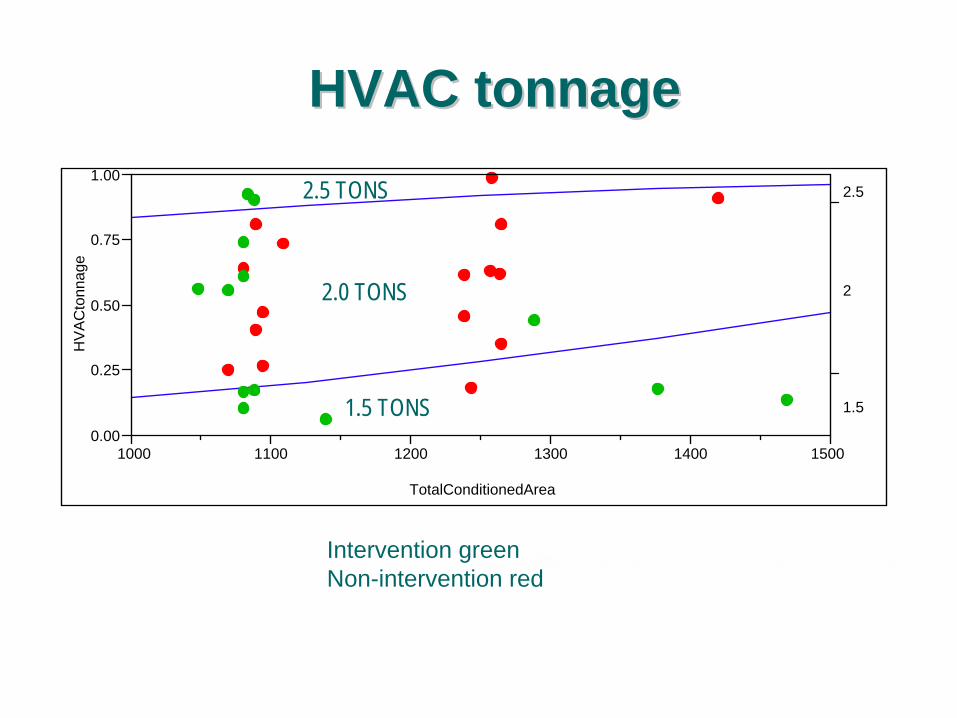
Intervention greenNon-intervention red
HVAC tonnageHVAC tonnage
1.5 TONS
2.0 TONS
2.5 TONS
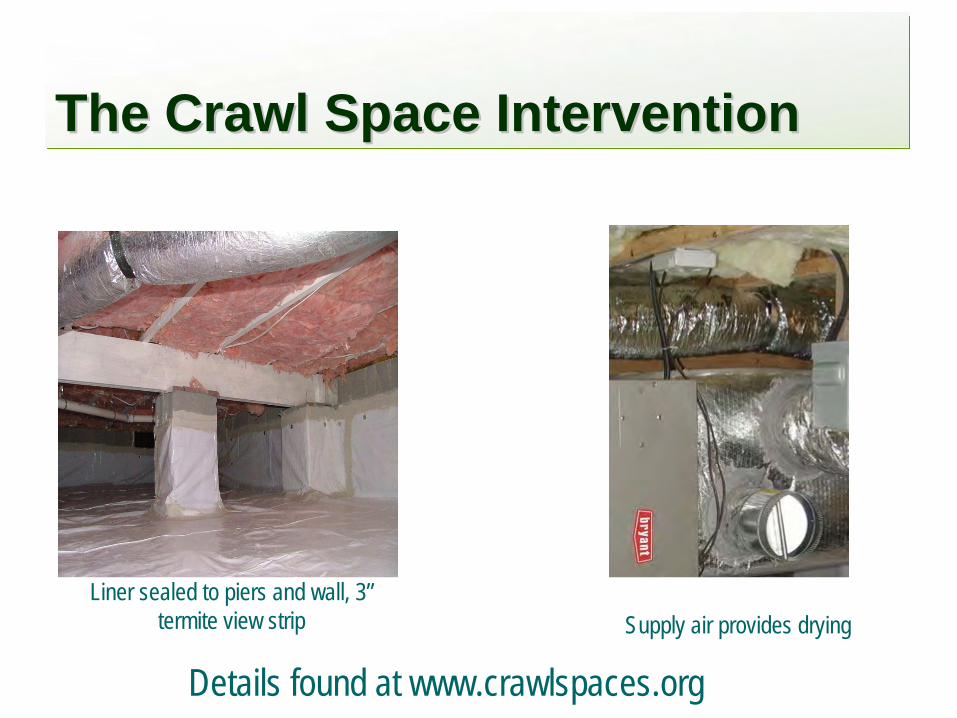
The Crawl Space InterventionThe Crawl Space Intervention
Details found at www.crawlspaces.org
Liner sealed to piers and wall, 3”
termite view strip Supply air provides drying
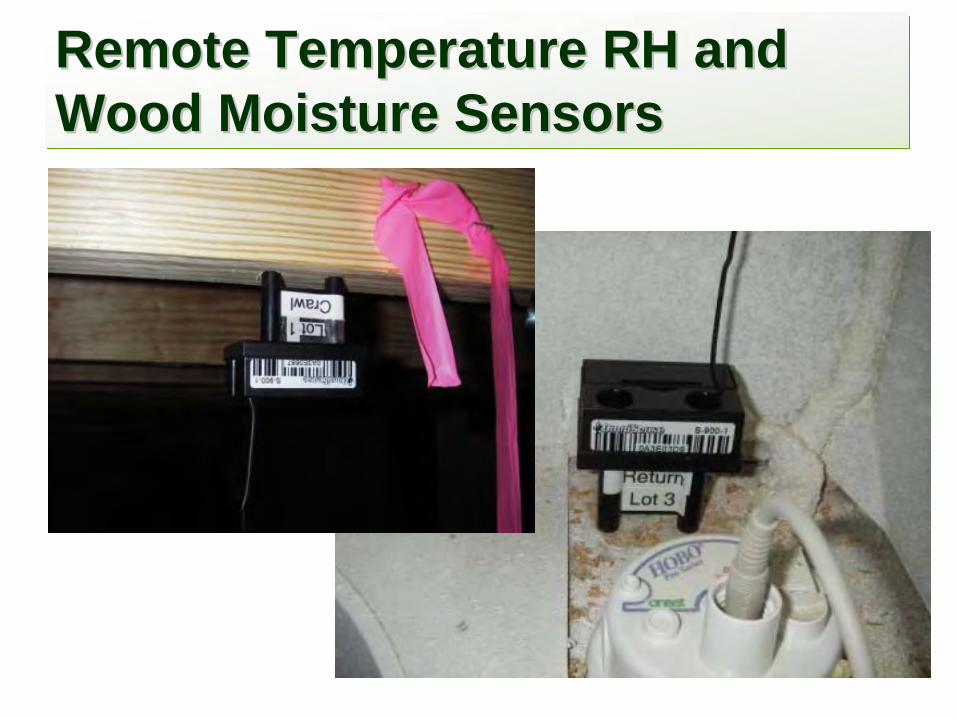
Remote Temperature RH and Remote Temperature RH and Wood Moisture SensorsWood Moisture Sensors

Project MeetingsProject Meetings
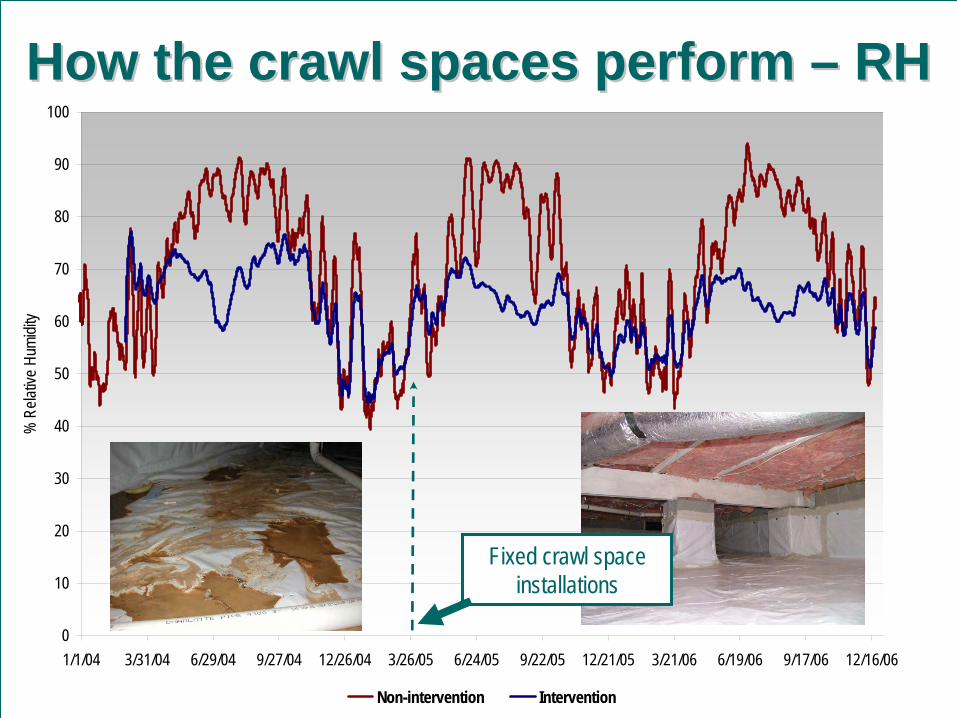
How the crawl spaces perform How the crawl spaces perform –– RHRH
0
10
20
30
40
50
60
70
80
90
100
1/1/04 3/31/04 6/29/04 9/27/04 12/26/04 3/26/05 6/24/05 9/22/05 12/21/05 3/21/06 6/19/06 9/17/06 12/16/06
% R
elativ
e Hum
idity
Non-intervention Intervention
Fixed crawl space installations
Conclusions About RH Conclusions About RH Controlled CrawlControlled Crawl
Maintains RH below 70% -- the “mold suppressing” zoneDemonstrates suppression of moisture load from soil and outdoor airAvoids issues common to southeast wall vented crawls
Moisture Mold, rotTransmission of mold to house
0
10
20
30
40
50
60
70
80
90
100
1/1/04 3/31/04 6/29/04 9/27/04 12/26/04 3/26/05 6/24/05 9/22/05 12/21/05 3/21/06 6/19/06 9/17/06 12/16/06
% R
elativ
e Hum
idity
Non-intervention Intervention
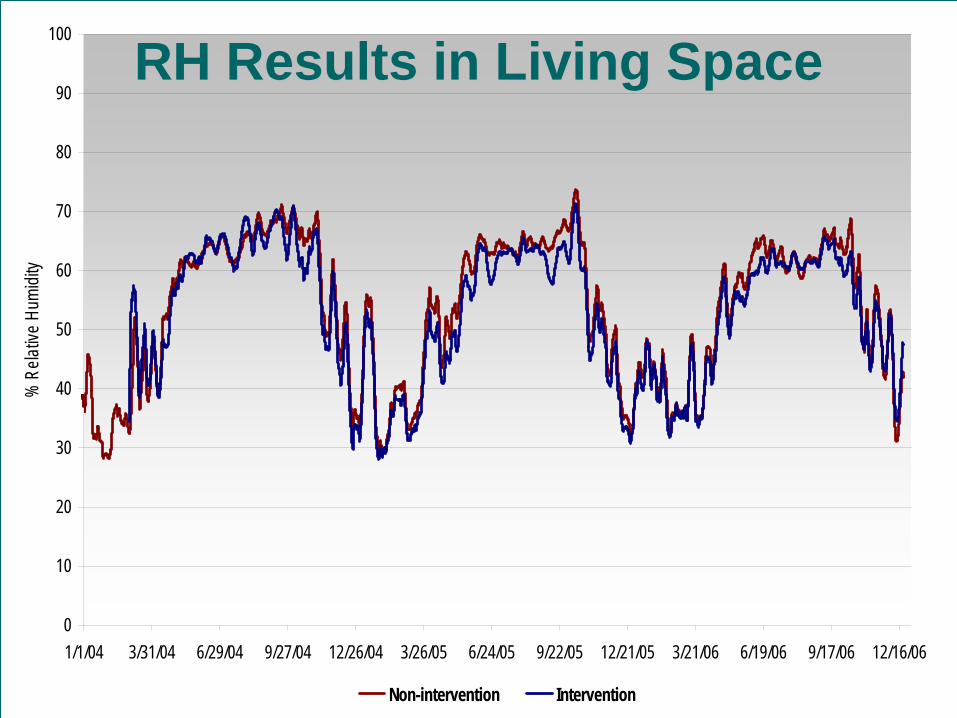
RH Results in Living SpaceRH Results in Living Space
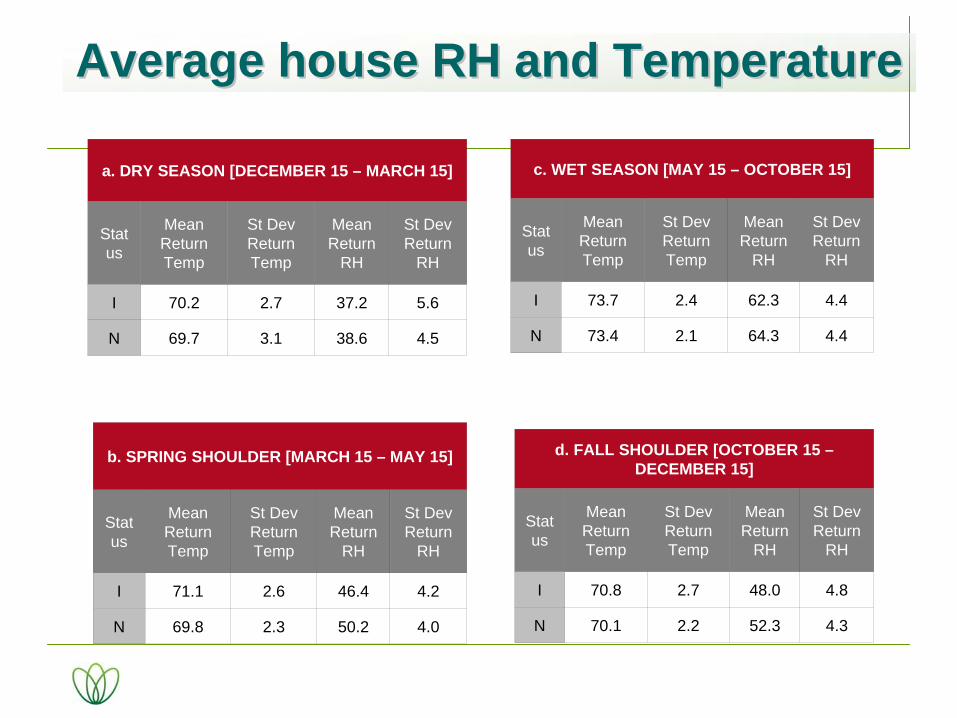
Average house RH and TemperatureAverage house RH and Temperature
a. DRY SEASON [DECEMBER 15 – MARCH 15]
Stat us
Mean Return Temp
St Dev Return Temp
Mean Return
RH
St Dev Return
RH
I 70.2 2.7 37.2 5.6
N 69.7 3.1 38.6 4.5
b. SPRING SHOULDER [MARCH 15 – MAY 15]
Stat us
Mean Return Temp
St Dev Return Temp
Mean Return
RH
St Dev Return
RH
I 71.1 2.6 46.4 4.2
N 69.8 2.3 50.2 4.0
c. WET SEASON [MAY 15 – OCTOBER 15]
Stat us
Mean Return Temp
St Dev Return Temp
Mean Return
RH
St Dev Return
RH
I 73.7 2.4 62.3 4.4
N 73.4 2.1 64.3 4.4
d. FALL SHOULDER [OCTOBER 15 – DECEMBER 15]
Stat us
Mean Return Temp
St Dev Return Temp
Mean Return
RH
St Dev Return
RH
I 70.8 2.7 48.0 4.8
N 70.1 2.2 52.3 4.3
Did we impact relative humidity?Did we impact relative humidity?Crawl space RH stayed below 70%
Expect mold suppression in crawl and reduced mold in house
House RH was not reducedClosed crawl space + outdoor air doesn’t bring the living space to target RHIntroducing outdoor air does not dry the house
Closed crawl couples crawl RH to houseWall-vented crawls remain coupled to outdoor RH
Will Will dehmidificationdehmidification deliver RH deliver RH <50%?<50%?
Phase 2 study preview22 houses
Tight envelopeTight ducts
Intervention houses retrofittedMechanical dehumidificationSpot exhaustOutdoor air intakeUpgraded filtration“Bare bones” closed crawl space
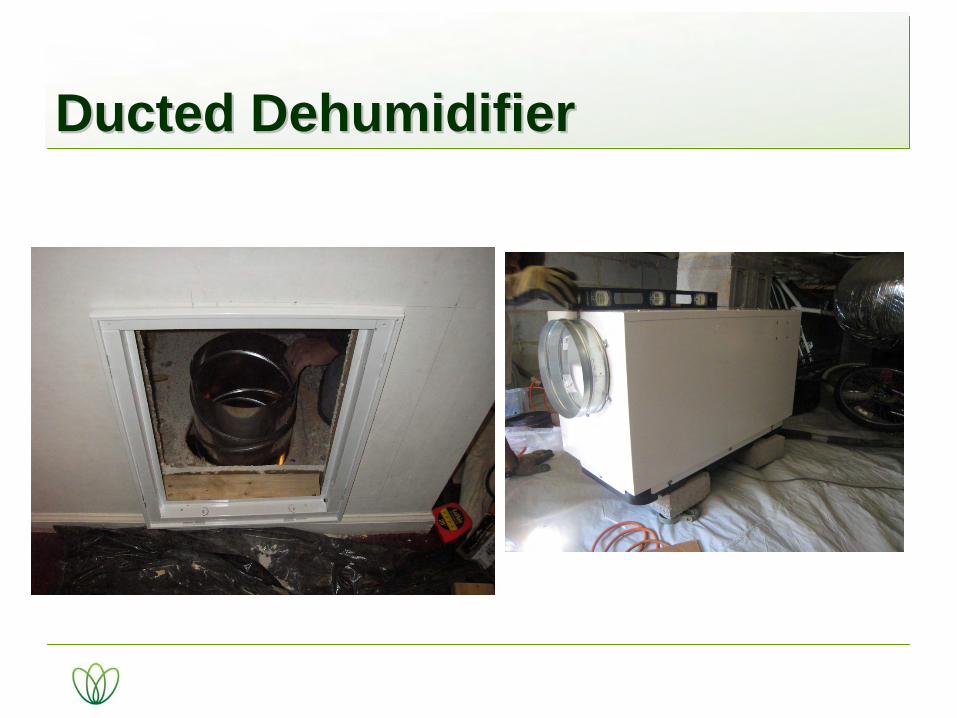
Ducted DehumidifierDucted Dehumidifier
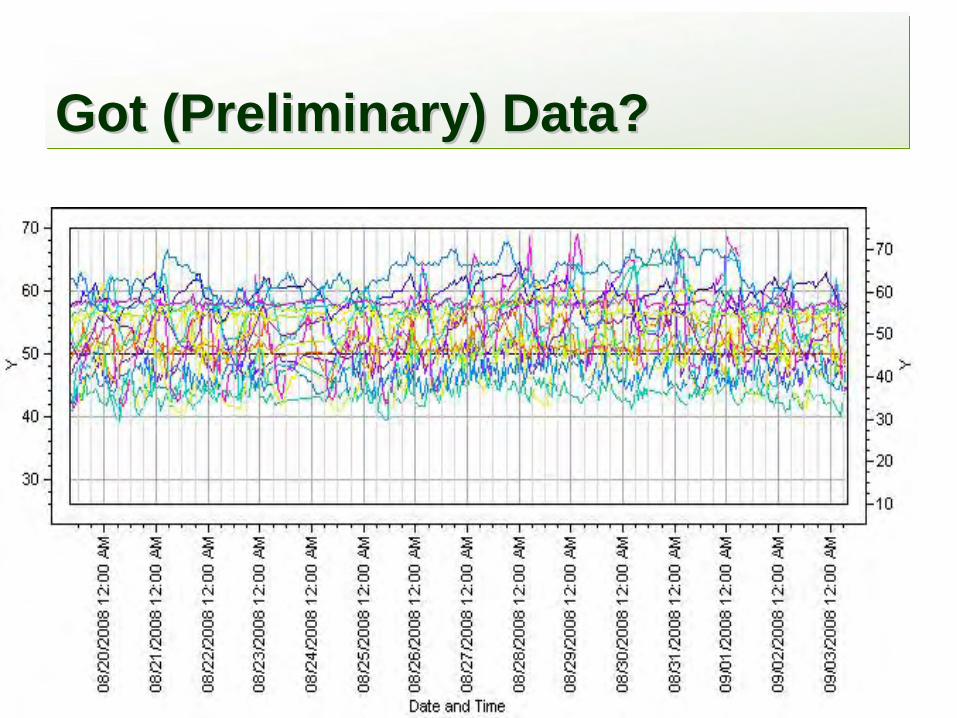
Got (Preliminary) Data?Got (Preliminary) Data?
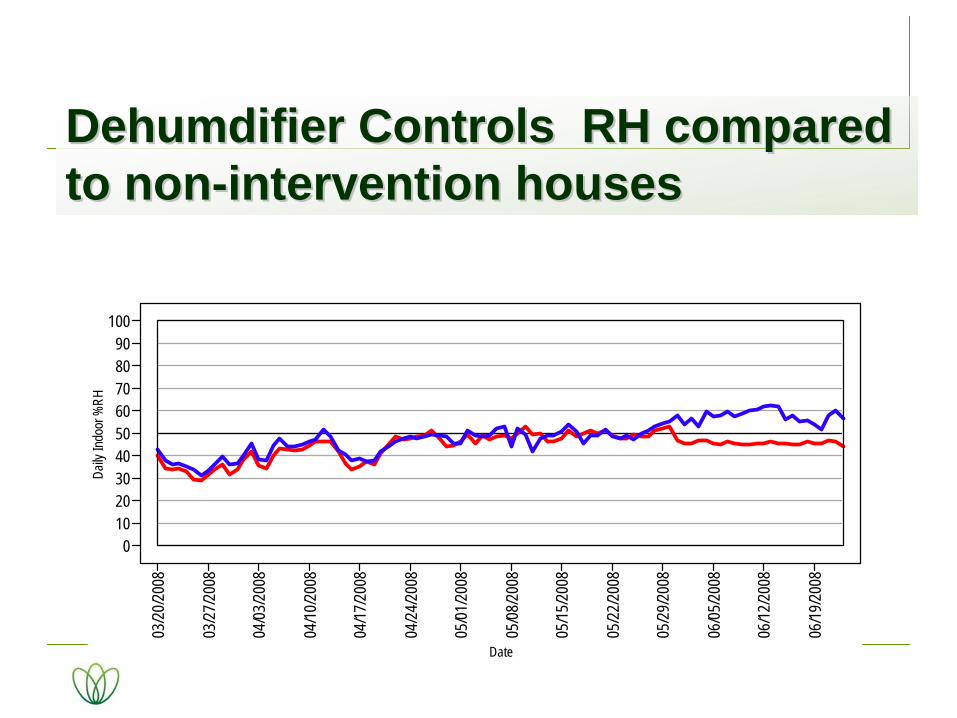
DehumdifierDehumdifier Controls RH compared Controls RH compared to nonto non--intervention housesintervention houses
0102030405060708090
100
Daily
Indo
or %
RH
03/20
/2008
03/27
/2008
04/03
/2008
04/10
/2008
04/17
/2008
04/24
/2008
05/01
/2008
05/08
/2008
05/15
/2008
05/22
/2008
05/29
/2008
06/05
/2008
06/12
/2008
06/19
/2008
Date
AllergensAllergens
Moisture dependant allergensHouse Dust MiteFungus (Alternaria Alternate)
No detectable difference between intervention and control groups
““Honey, Did You Pack The Dust Honey, Did You Pack The Dust Mites?Mites?””
Moving from previous to new homesOnly bedroom floors showed significant drop in dust mite allergen levels
Most other allergen levels show no significant changes during next 18 months
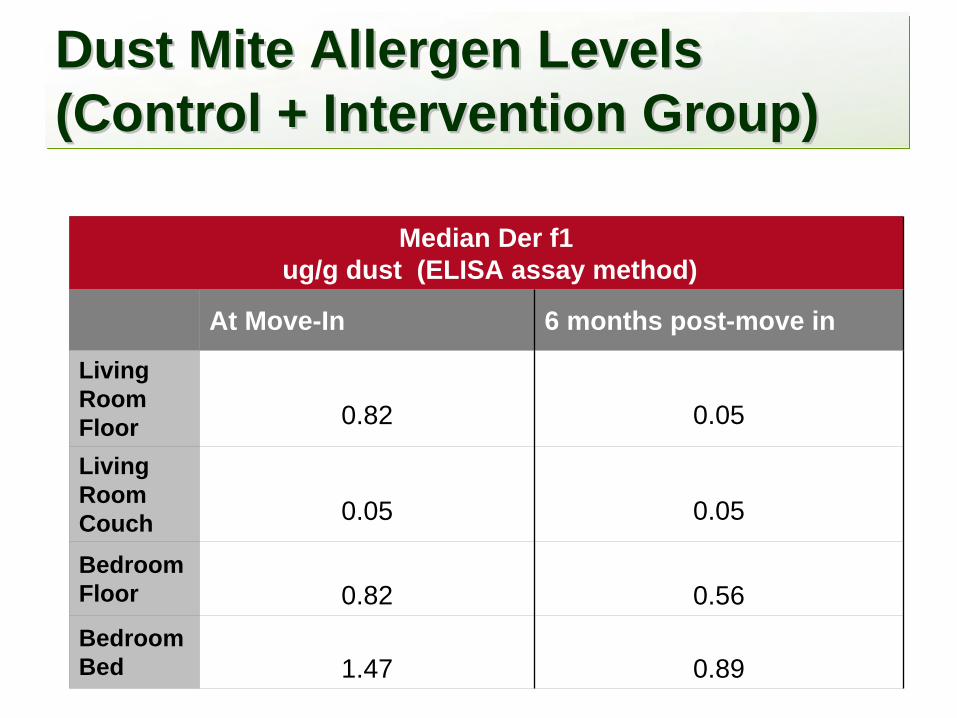
Dust Mite Allergen Levels Dust Mite Allergen Levels (Control + Intervention Group)(Control + Intervention Group)
Median Der f1ug/g dust (ELISA assay method)
At Move-In 6 months post-move in
Living Room Floor 0.82 0.05
Living Room Couch 0.05 0.05
Bedroom Floor 0.82 0.56Bedroom Bed 1.47 0.89
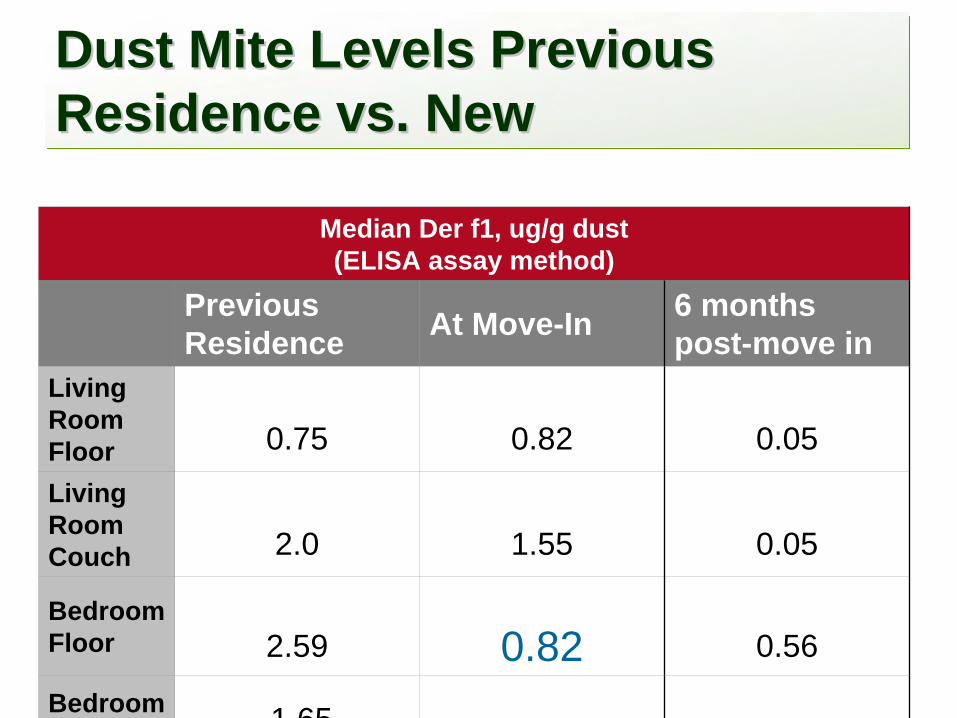
Dust Mite Levels Previous Dust Mite Levels Previous Residence vs. NewResidence vs. New
Median Der f1, ug/g dust (ELISA assay method)
Previous Residence At Move-In 6 months
post-move inLiving Room Floor 0.75 0.82 0.05Living Room Couch 2.0 1.55 0.05
Bedroom Floor 2.59 0.82 0.56
Bedroom 1 65
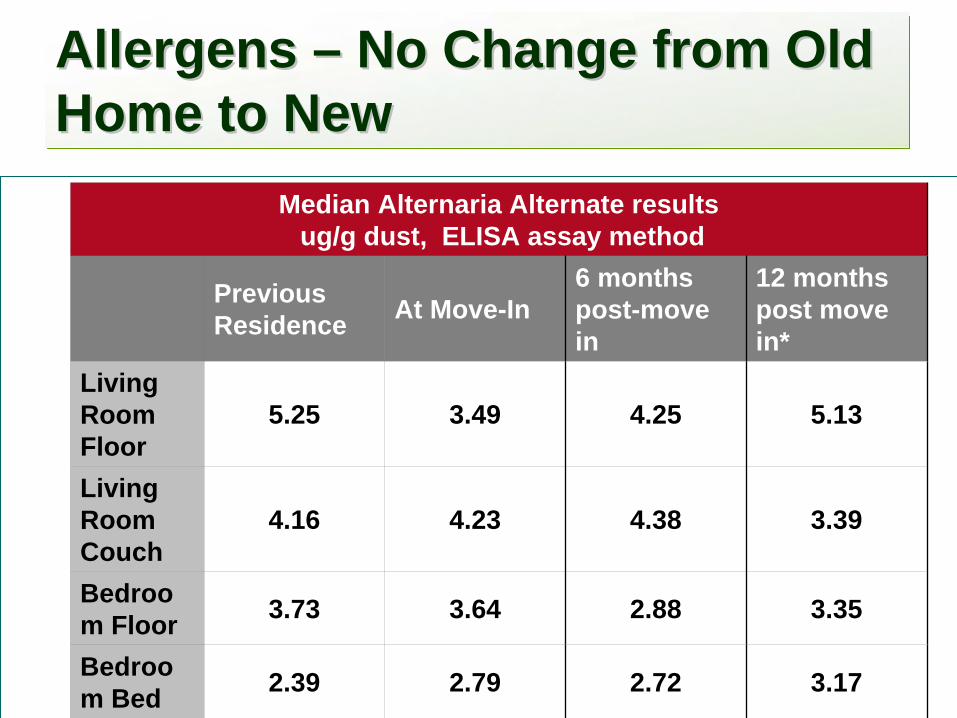
Allergens Allergens –– No Change from Old No Change from Old Home to NewHome to New
Median Alternaria Alternate resultsug/g dust, ELISA assay method
Previous Residence At Move-In
6 months post-move in
12 months post move in*
Living Room Floor
5.25 3.49 4.25 5.13
Living Room Couch
4.16 4.23 4.38 3.39
Bedroo m Floor 3.73 3.64 2.88 3.35
Bedroo m Bed 2.39 2.79 2.72 3.17
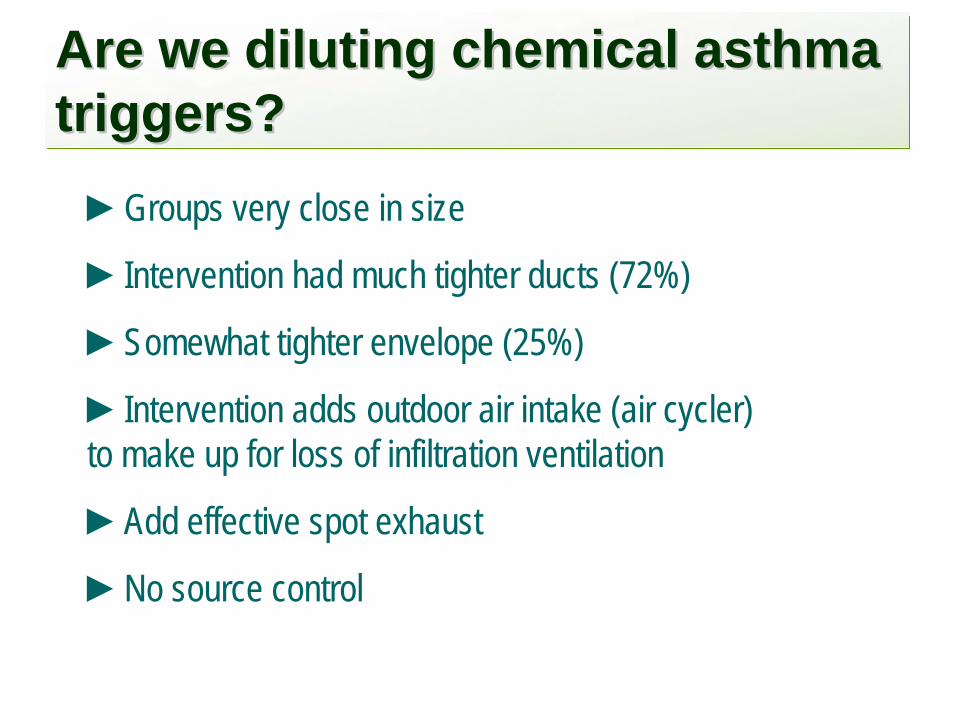
Are we diluting chemical asthma Are we diluting chemical asthma triggers?triggers?►Groups very close in size
►Intervention had much tighter ducts (72%)
►Somewhat tighter envelope (25%)
►Intervention adds outdoor air intake (air cycler) to make up for loss of infiltration ventilation
►Add effective spot exhaust
►No source control
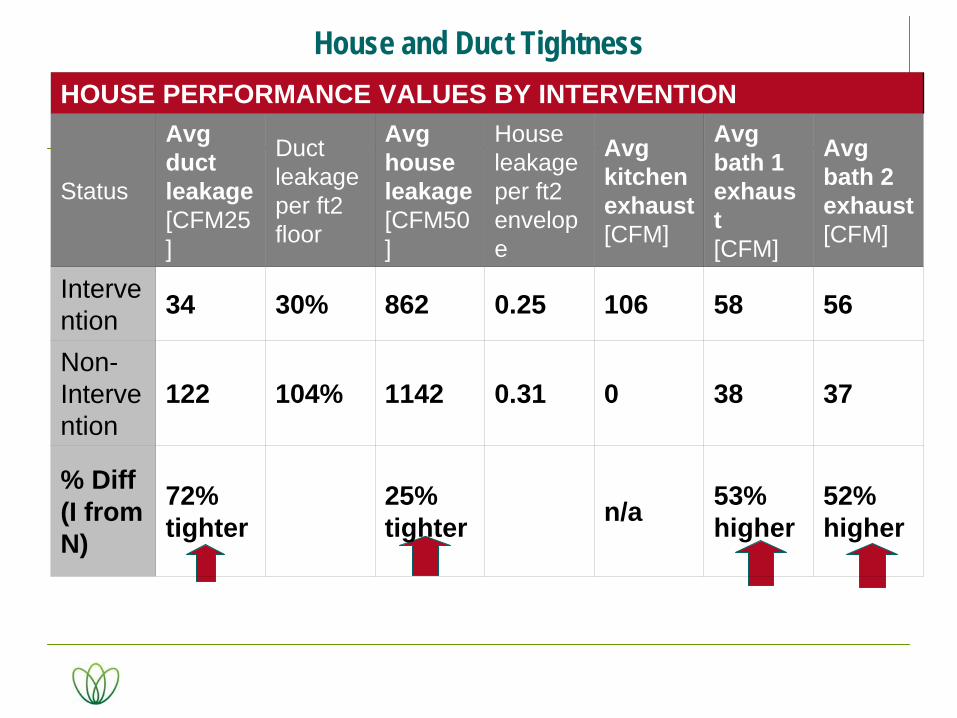
House and Duct TightnessHOUSE PERFORMANCE VALUES BY INTERVENTION
Status
Avgduct leakage[CFM25 ]
Duct leakage per ft2 floor
Avghouse leakage[CFM50 ]
House leakage per ft2 envelop e
Avgkitchen exhaust [CFM]
Avgbath 1 exhaus t[CFM]
Avgbath 2 exhaust[CFM]
Interve ntion 34 30% 862 0.25 106 58 56
Non- Interve ntion
122 104% 1142 0.31 0 38 37
% Diff (I from N)
72% tighter
25%tighter n/a 53%
higher52%higher
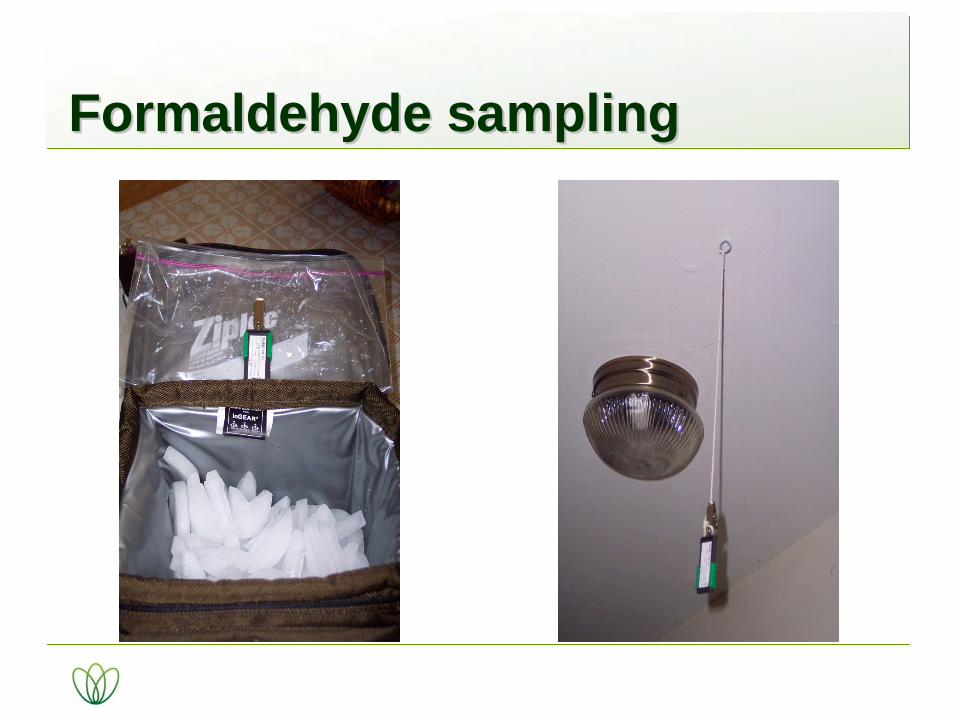
Formaldehyde samplingFormaldehyde sampling

Formaldehyde Levels Formaldehyde Levels –– No Statistical No Statistical Difference Between GroupsDifference Between Groups
AVERAGE FORMALDEHYDE LEVELS
Status Weight [μg/m3]
St Dev[μg/m3]
Weight[ppm]
St Dev[ppm]
I 85 27 0.069 0.022
N 79 31 0.064 0.025
All 82 29 0.067 0.025
Does the ventilation system Does the ventilation system work?work?
Tight intervention houses with outdoor air intake + timer are not higher than leakier non intervention housesMet goal of “do no harm” – did not adversely influence the houses when tightening themIn these houses, mechanical ventilation did not solve the indoor air pollution problem
Phase 2 Phase 2 ---- VentilationVentilation
More precise Air changes per hour Active sampling of formaldehyde
Measure tight houses with and without outdoor air (no air cyclers)Measure tight houses with air cyclersMeasure leakier houses without air cyclers
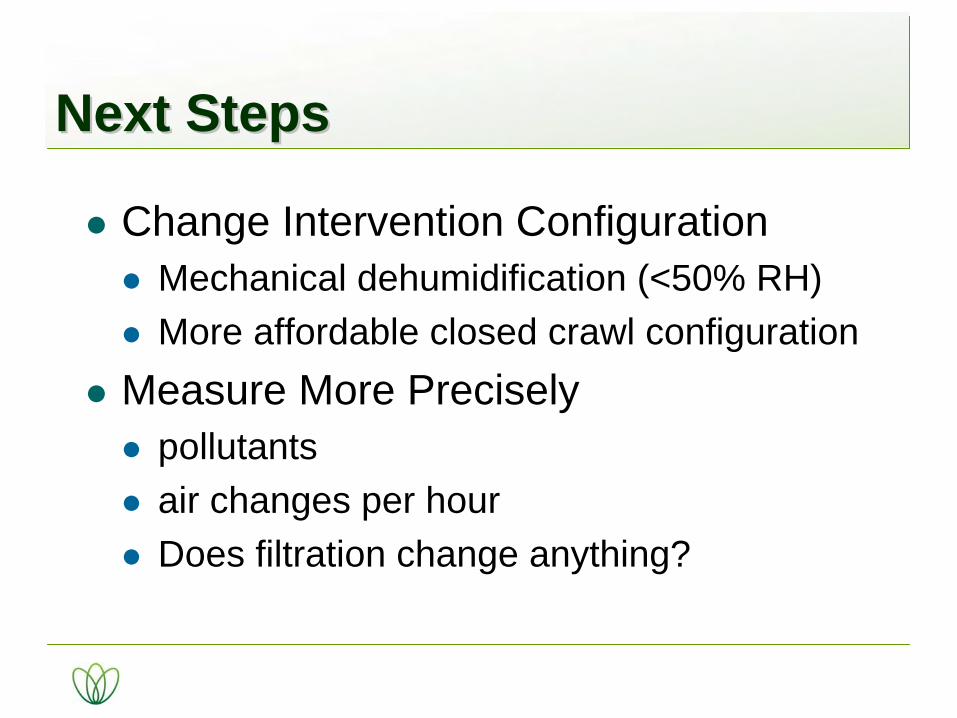
Change Intervention ConfigurationMechanical dehumidification (<50% RH)More affordable closed crawl configuration
Measure More Preciselypollutants air changes per hour Does filtration change anything?
Next StepsNext Steps

Get what works to marketGet what works to market
Market-Ready Specs“Prescription” for a dry house

www.advancedenergy.orgwww.healthierhomes.orgmweber@advancedenergy.org
919 857-9000 [phone]

Following are additional slides with supplementary information that will be discussed further in final report and articles
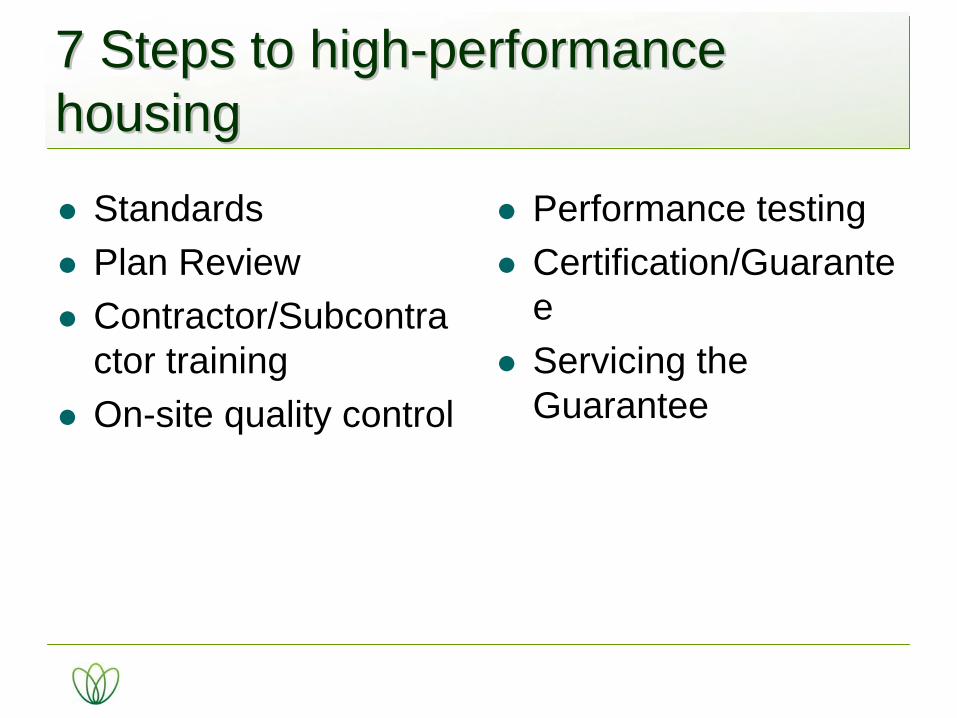
7 Steps to high7 Steps to high--performance performance housinghousing
StandardsPlan ReviewContractor/Subcontractor trainingOn-site quality control
Performance testingCertification/GuaranteeServicing the Guarantee
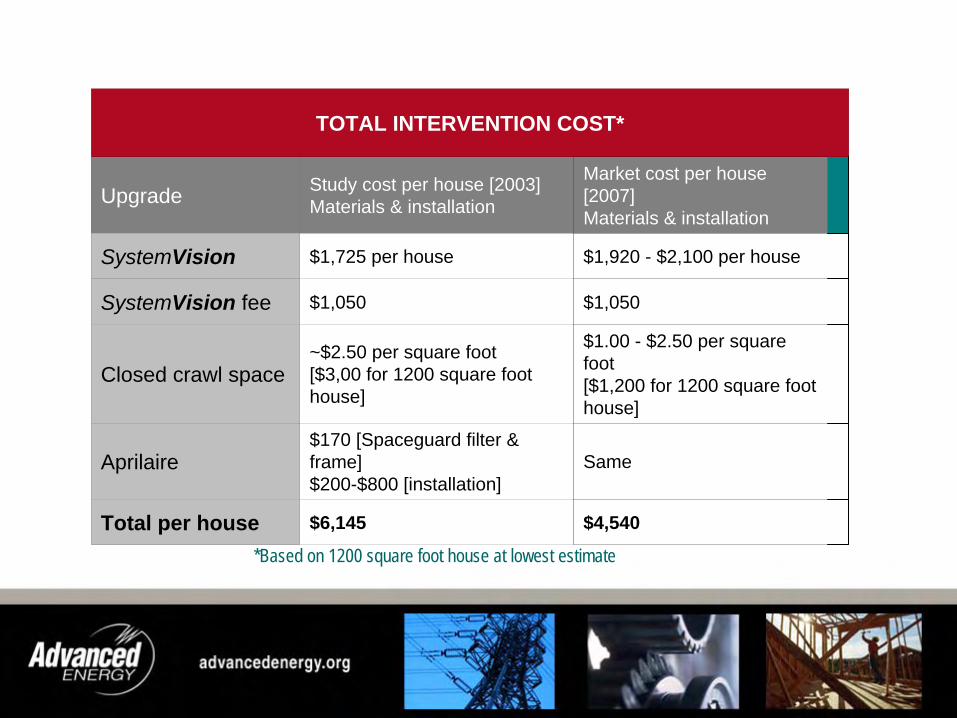
TOTAL INTERVENTION COST*
Upgrade Study cost per house [2003]Materials & installation
Market cost per house [2007]Materials & installation
SystemVision $1,725 per house $1,920 - $2,100 per house
SystemVision fee $1,050 $1,050
Closed crawl space~$2.50 per square foot[$3,00 for 1200 square foot house]
$1.00 - $2.50 per square foot[$1,200 for 1200 square foot house]
Aprilaire$170 [Spaceguard filter & frame]$200-$800 [installation]
Same
Total per house $6,145 $4,540
*Based on 1200 square foot house at lowest estimate
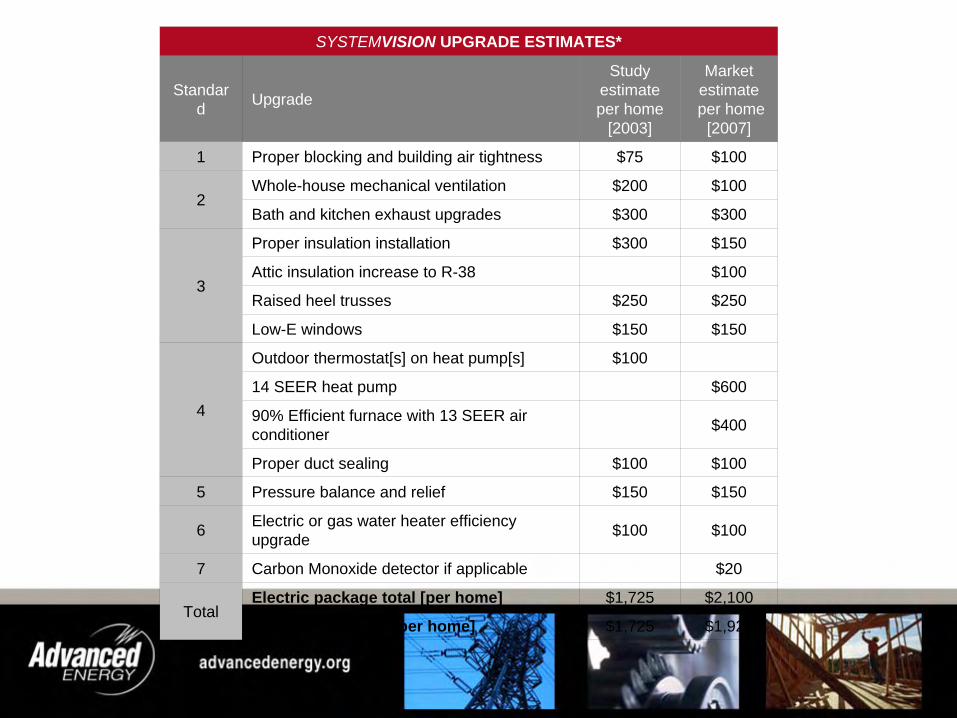
SYSTEMVISION UPGRADE ESTIMATES*
Standar d Upgrade
Study estimate per home
[2003]
Market estimateper home
[2007]
1 Proper blocking and building air tightness $75 $100
2Whole-house mechanical ventilation $200 $100
Bath and kitchen exhaust upgrades $300 $300
3
Proper insulation installation $300 $150
Attic insulation increase to R-38 $100
Raised heel trusses $250 $250
Low-E windows $150 $150
4
Outdoor thermostat[s] on heat pump[s] $100
14 SEER heat pump $600
90% Efficient furnace with 13 SEER air conditioner $400
Proper duct sealing $100 $100
5 Pressure balance and relief $150 $150
6 Electric or gas water heater efficiency upgrade $100 $100
7 Carbon Monoxide detector if applicable $20
TotalElectric package total [per home] $1,725 $2,100
Gas package total [per home] $1,725 $1,920
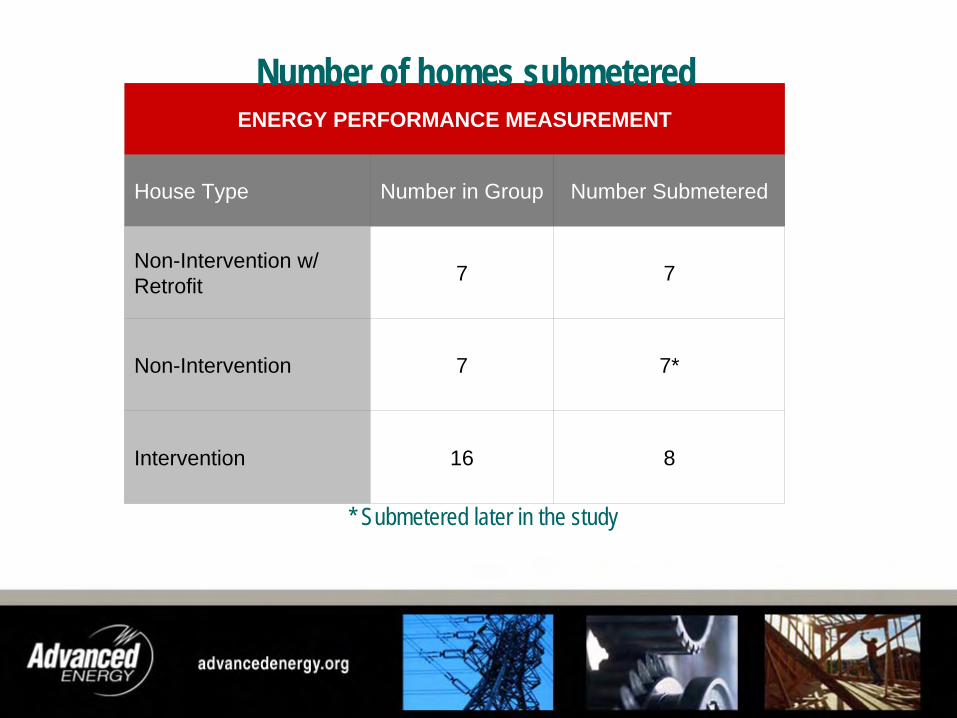
ENERGY PERFORMANCE MEASUREMENT
House Type Number in Group Number Submetered
Non-Intervention w/ Retrofit 7 7
Non-Intervention 7 7*
Intervention 16 8
Number of homes submetered
* Submetered
later in the study
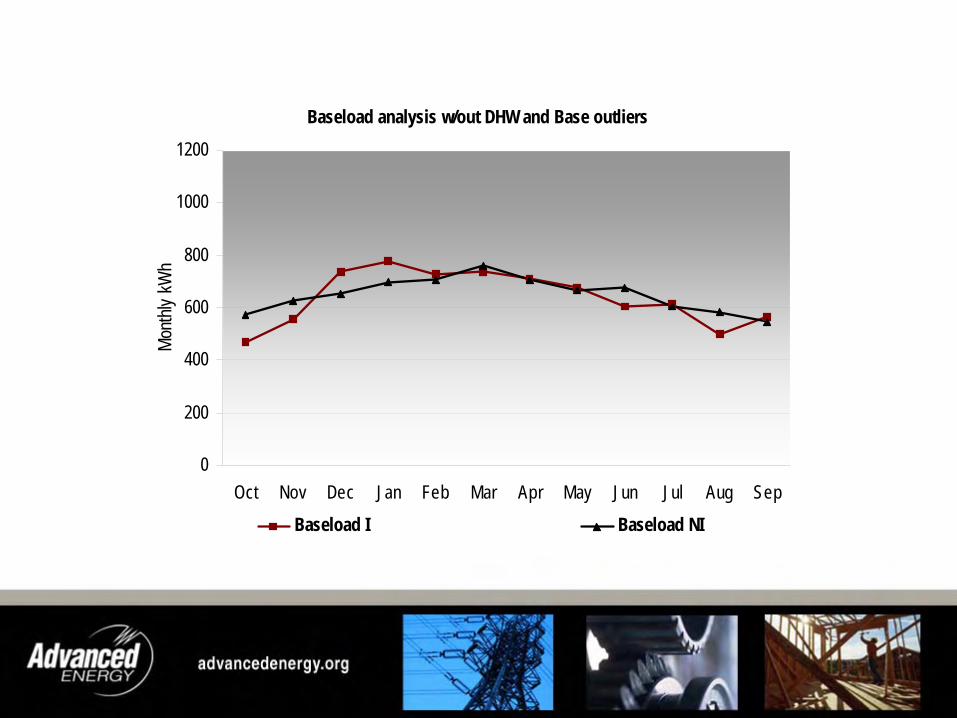
Baseload analysis w/out DHW and Base outliers
0
200
400
600
800
1000
1200
Oct Nov Dec Jan Feb Mar Apr May Jun Jul Aug Sep
Month
ly kW
h
Baseload I Baseload NI
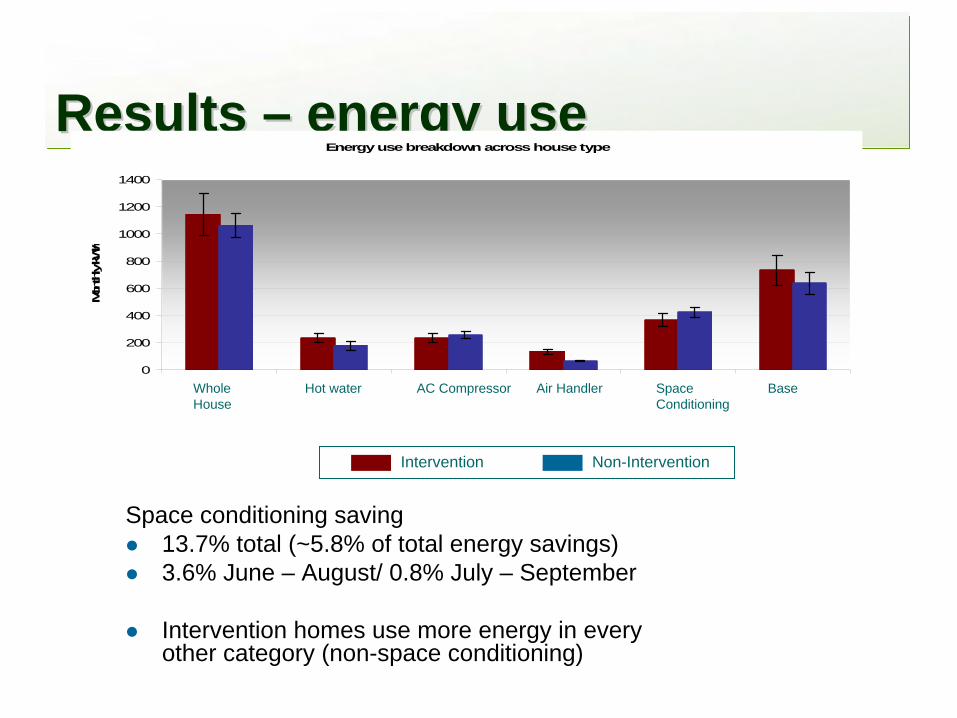
Results Results –– energy useenergy useEnergy use breakdown across house type
0
200
400
600
800
1000
1200
1400
Avg Main Avg DHW Avg Comp Avg AH Avg SC Avg Base
Monthly k
Wh
Intervention Non-Intervention
Space conditioning saving 13.7% total (~5.8% of total energy savings)3.6% June – August/ 0.8% July – September
Intervention homes use more energy in every other category (non-space conditioning)
Hot waterWhole House
AC Compressor
Intervention Non-Intervention
Air Handler Space Conditioning
Base
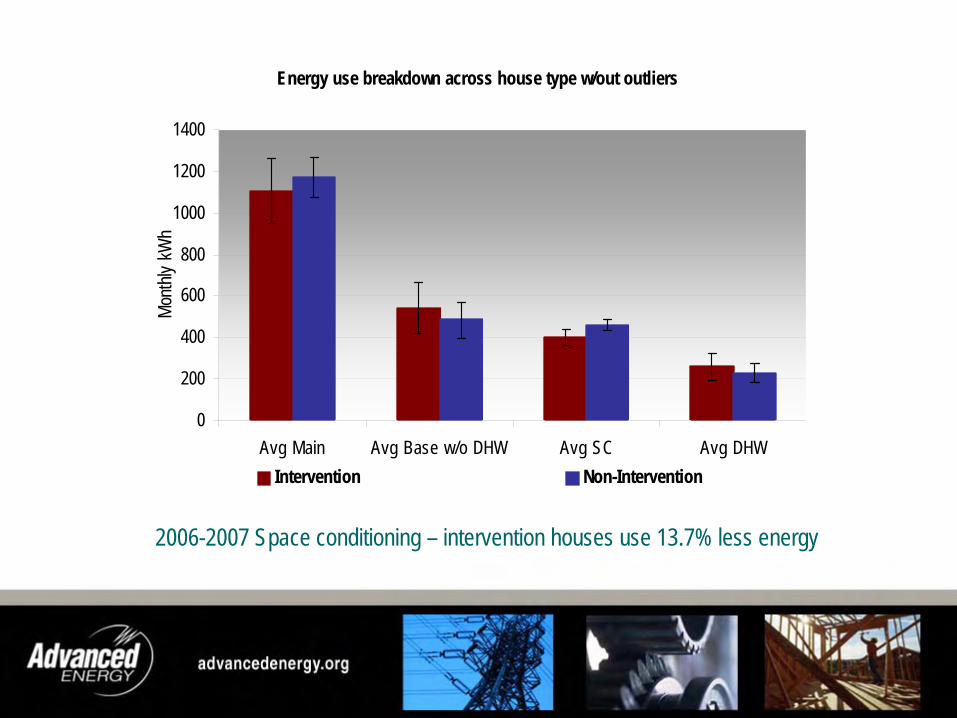
Energy use breakdown across house type w/out outliers
0
200
400
600
800
1000
1200
1400
Avg Main Avg Base w/o DHW Avg SC Avg DHW
Month
ly kW
h
Intervention Non-Intervention
2006-2007 Space conditioning –
intervention houses use 13.7% less energy
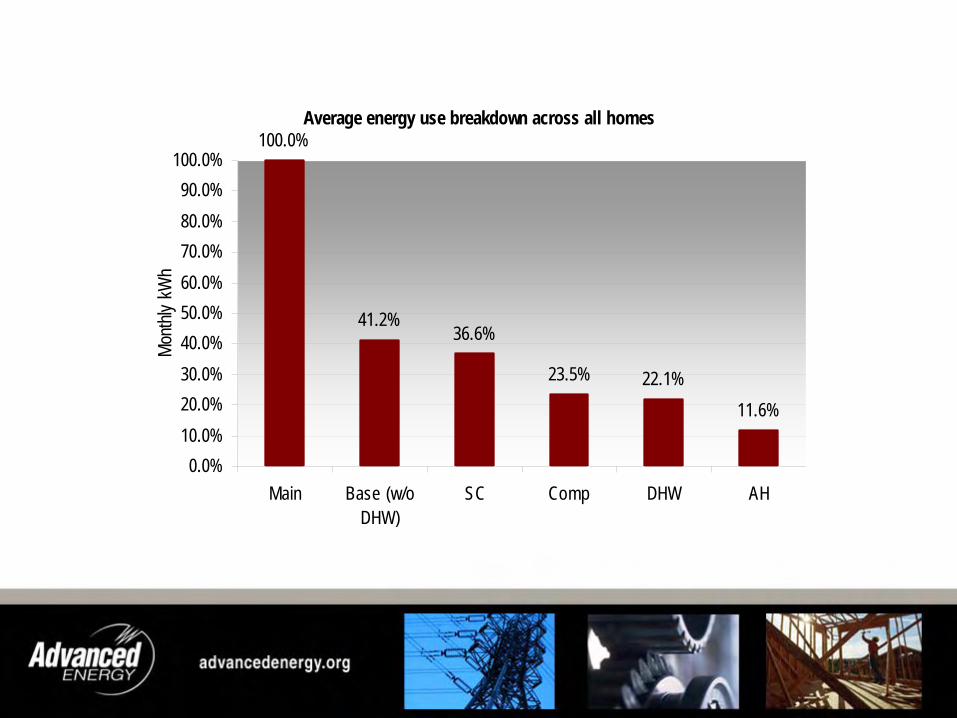
Average energy use breakdown across all homes100.0%
41.2%36.6%
23.5% 22.1%11.6%
0.0%10.0%20.0%30.0%40.0%50.0%60.0%70.0%80.0%90.0%
100.0%
Main Base (w/oDHW)
SC Comp DHW AH
Month
ly kW
h
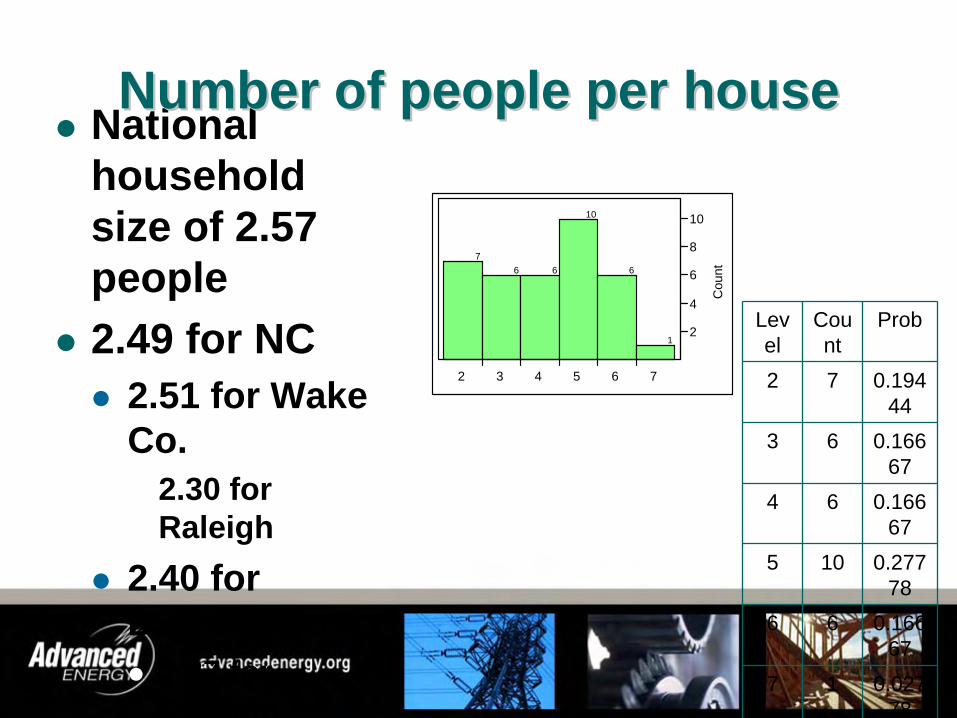
National household size of 2.57 people2.49 for NC
2.51 for Wake Co.
2.30 for Raleigh
2.40 for Durham Co.
2.37 for Durham
Number of people per houseNumber of people per house
76 6
10
6
12
4
6
8
10
Cou
nt
2 3 4 5 6 7
Lev el
Cou nt
Prob
2 7 0.194 44
3 6 0.166 67
4 6 0.166 67
5 10 0.277 78
6 6 0.166 67
7 1 0.027 78
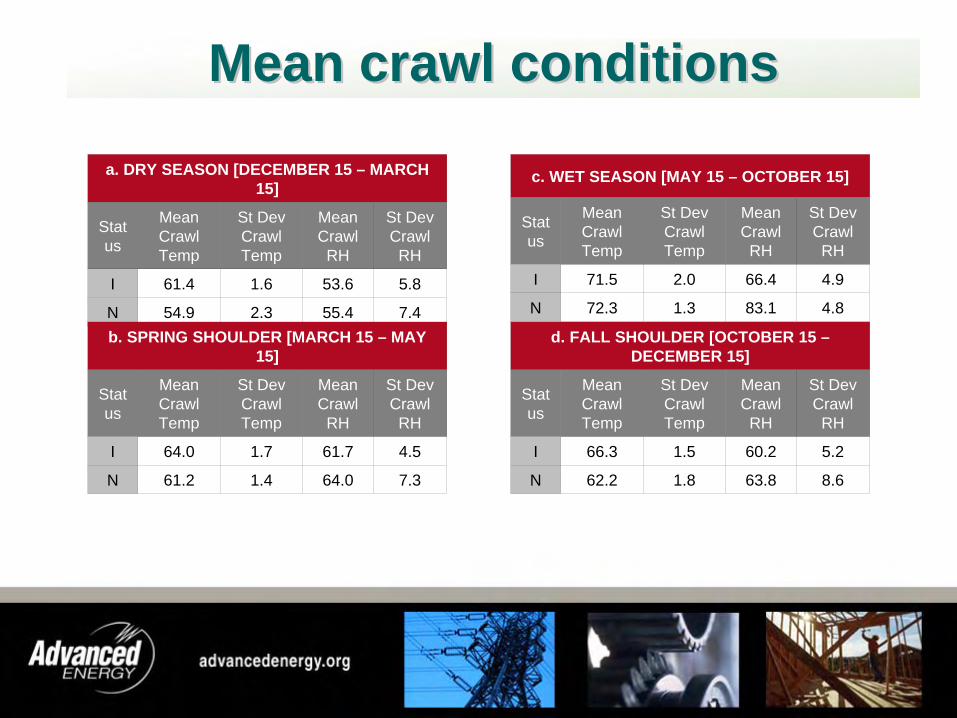
Mean crawl conditionsMean crawl conditions
a. DRY SEASON [DECEMBER 15 – MARCH 15]
Stat us
Mean Crawl Temp
St Dev Crawl Temp
Mean Crawl RH
St Dev Crawl RH
I 61.4 1.6 53.6 5.8
N 54.9 2.3 55.4 7.4b. SPRING SHOULDER [MARCH 15 – MAY
15]
Stat us
Mean Crawl Temp
St Dev Crawl Temp
Mean Crawl RH
St Dev Crawl RH
I 64.0 1.7 61.7 4.5
N 61.2 1.4 64.0 7.3
c. WET SEASON [MAY 15 – OCTOBER 15]
Stat us
Mean Crawl Temp
St Dev Crawl Temp
Mean Crawl RH
St Dev Crawl RH
I 71.5 2.0 66.4 4.9
N 72.3 1.3 83.1 4.8
d. FALL SHOULDER [OCTOBER 15 – DECEMBER 15]
Stat us
Mean Crawl Temp
St Dev Crawl Temp
Mean Crawl RH
St Dev Crawl RH
I 66.3 1.5 60.2 5.2
N 62.2 1.8 63.8 8.6
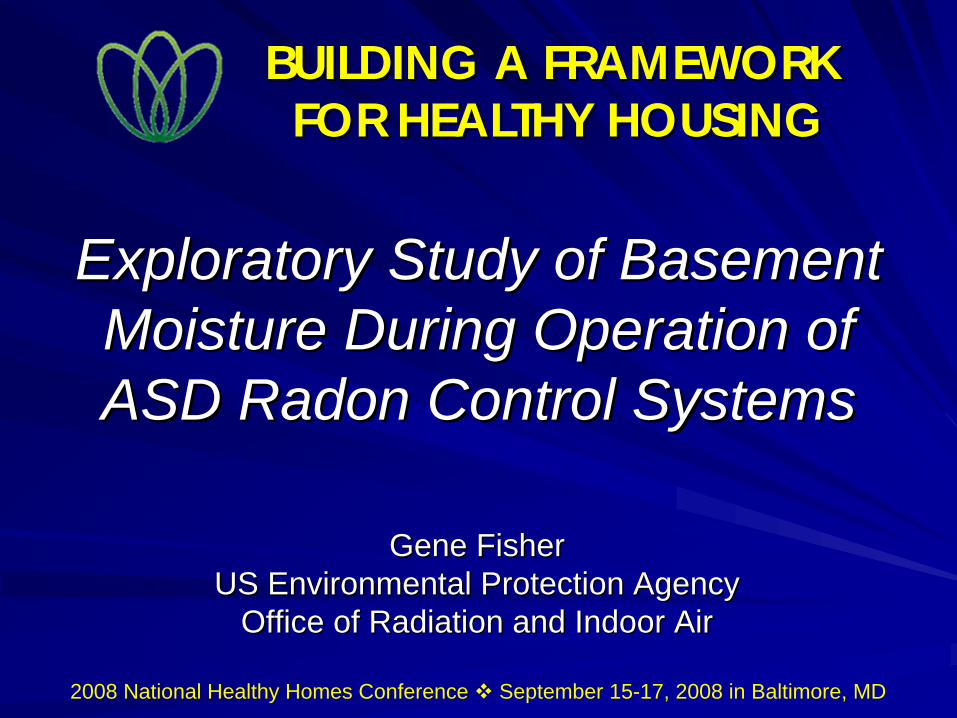
2008 National Healthy Homes Conference September 15-17, 2008 in Baltimore, MD
BUILDING A FRAMEWORK BUILDING A FRAMEWORK FOR HEALTHY HOUSINGFOR HEALTHY HOUSING
Exploratory Study of Basement Exploratory Study of Basement Moisture During Operation of Moisture During Operation of ASD Radon Control SystemsASD Radon Control Systems
Gene FisherGene FisherUS Environmental Protection AgencyUS Environmental Protection Agency
Office of Radiation and Indoor AirOffice of Radiation and Indoor Air
22
Study OverviewStudy Overview::
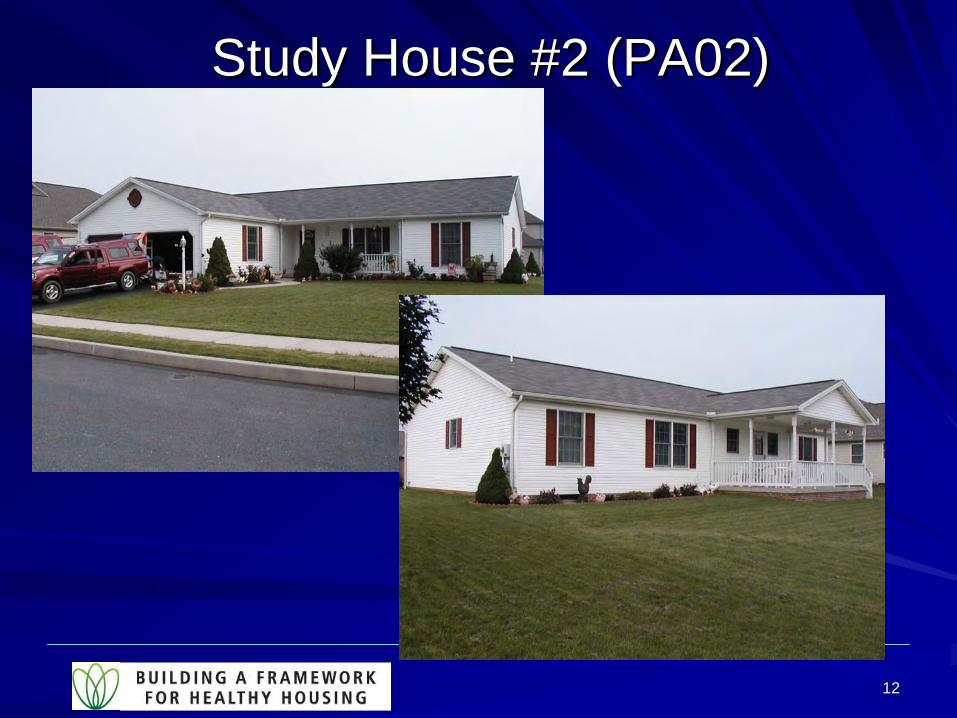
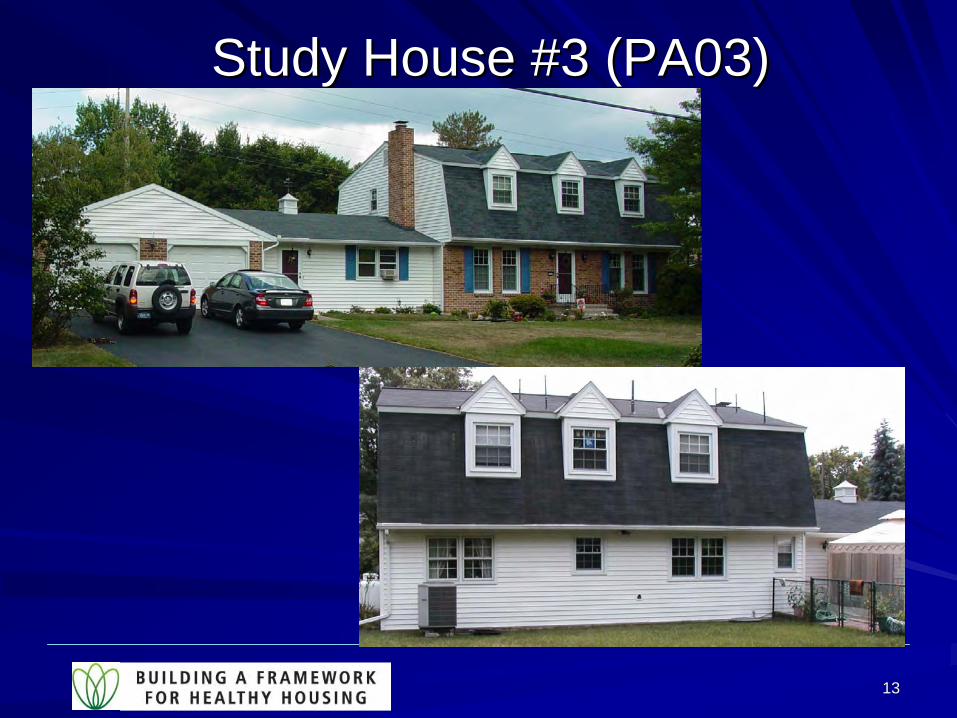
Limited, exploratory study to demonstrate whether Limited, exploratory study to demonstrate whether active soil depressurization (ASD) techniques can active soil depressurization (ASD) techniques can impact moisture entry and control in residential impact moisture entry and control in residential structuresstructuresStudy conducted by Auburn University (SRRTC) via Study conducted by Auburn University (SRRTC) via a Cooperative Agreement with the EPA, awarded in a Cooperative Agreement with the EPA, awarded in July 2004July 2004Three houses with unfinished basements were Three houses with unfinished basements were studied for an 18studied for an 18--month period (Harrisburg, PA)month period (Harrisburg, PA)

33
Study Team MembersStudy Team MembersAuburn UniversityAuburn University::Jan Carrington Jan Carrington -- AdministrationAdministrationJack Hughes Jack Hughes -- Mitigation and Technical SpecialistMitigation and Technical SpecialistBrad Turk Brad Turk -- Principal InvestigatorPrincipal Investigator
PA Department of Environmental Protection (PA DEP)PA Department of Environmental Protection (PA DEP)::Mike Pyles Mike Pyles -- Radon Program ManagerRadon Program ManagerBob Lewis Bob Lewis -- Field SupportField SupportMatt Shields Matt Shields -- Field SupportField Support
Private ContractorPrivate Contractor::Bob Myers Bob Myers -- PA Certified Radon PA Certified Radon MitigatorMitigatorMargaret Margaret MenacheMenache –– UNM, StatisticianUNM, Statistician
US EPAUS EPA::Gene Fisher Gene Fisher -- Project OfficerProject OfficerPatsy Brooks Patsy Brooks -- Region 4 Radon CoordinatorRegion 4 Radon CoordinatorSusie Shimek Susie Shimek -- Past EPA Radon Team LeaderPast EPA Radon Team LeaderPhil Phil JalbertJalbert –– EPA Radon Team LeaderEPA Radon Team Leader
44
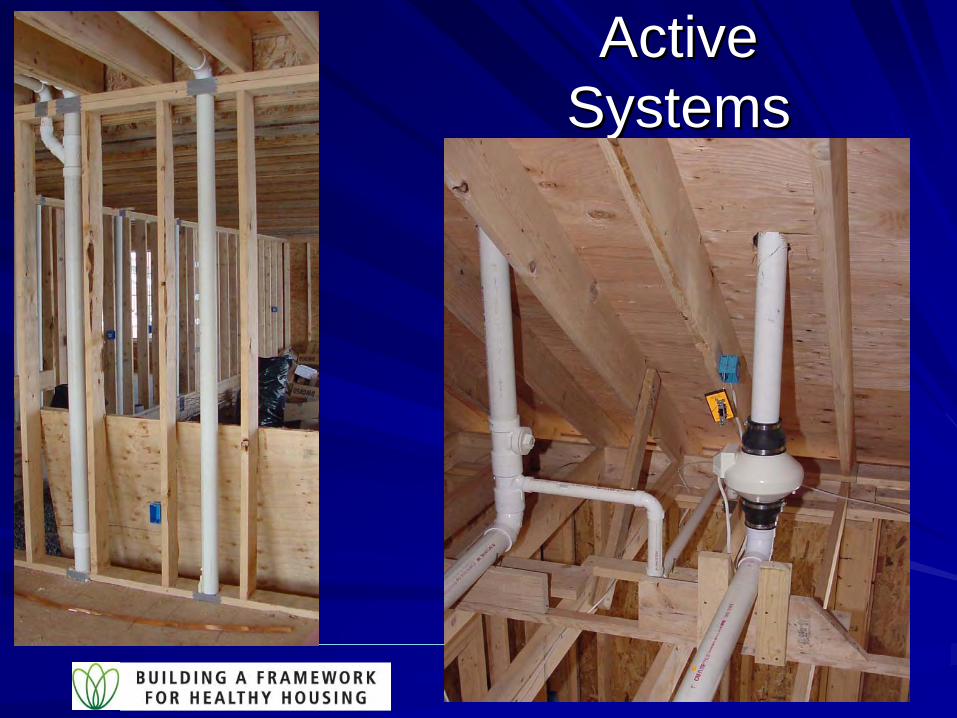
Active Soil DepressurizationActive Soil Depressurization
Reduces radon entry by mechanically creating a Reduces radon entry by mechanically creating a suction beneath the homesuction beneath the home’’s foundation that is s foundation that is stronger than the suction applied by the homestronger than the suction applied by the homeCollects radon prior to entry and exhausts to a Collects radon prior to entry and exhausts to a safe location outside the homesafe location outside the homeSpecific application depends on foundation typeSpecific application depends on foundation type
55
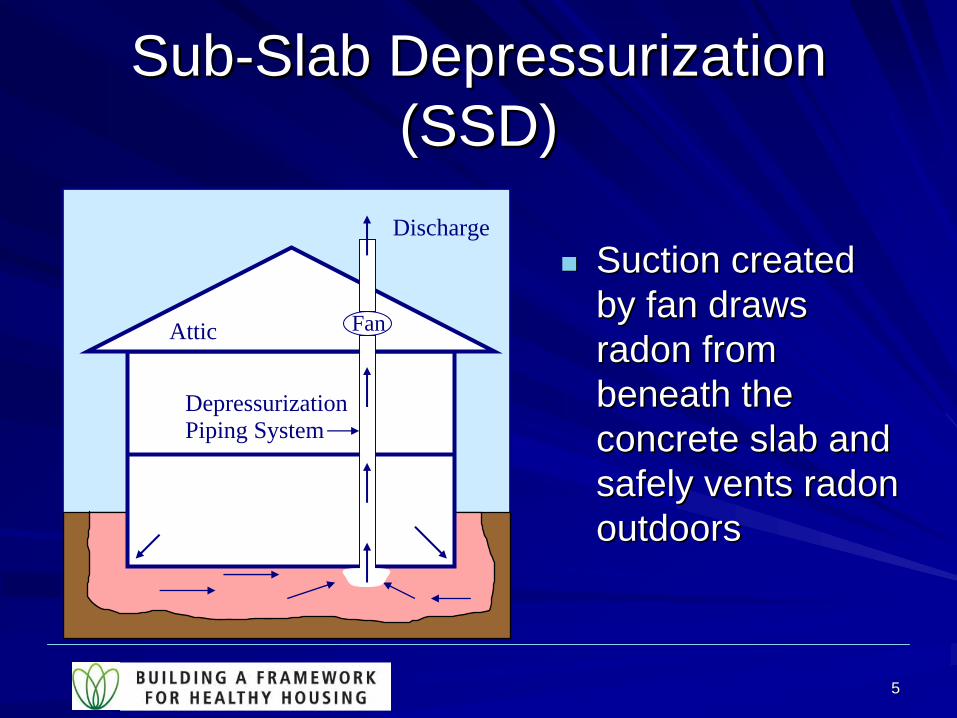
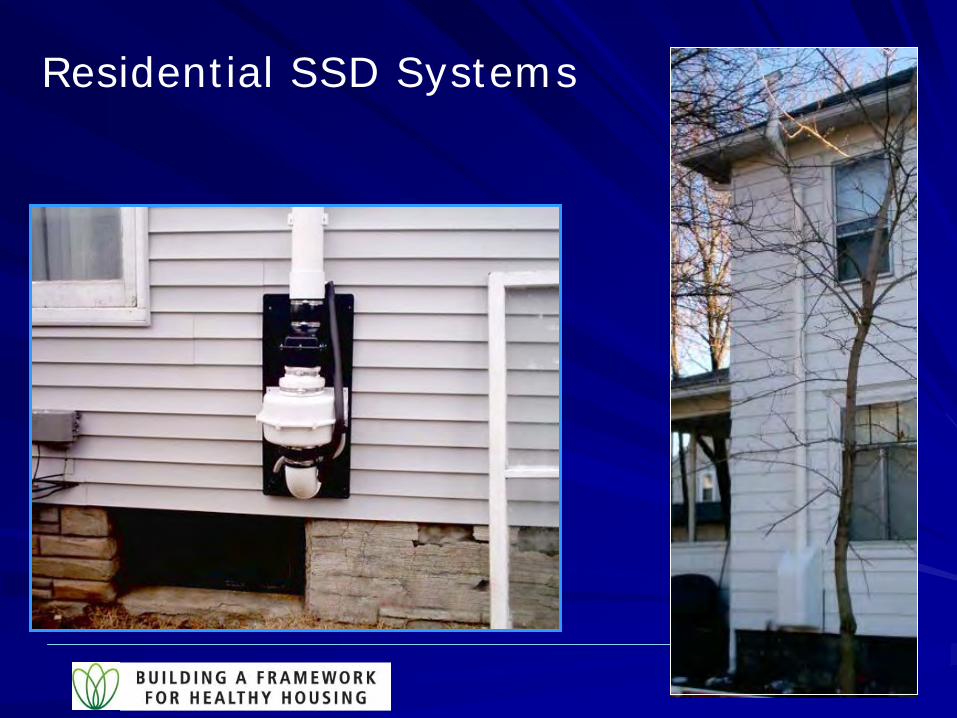
SubSub--Slab Depressurization Slab Depressurization (SSD)(SSD)
Suction created Suction created by fan draws by fan draws radon from radon from beneath the beneath the concrete slab and concrete slab and safely vents radon safely vents radon outdoorsoutdoors
FanAttic
DepressurizationPiping System
Discharge
66
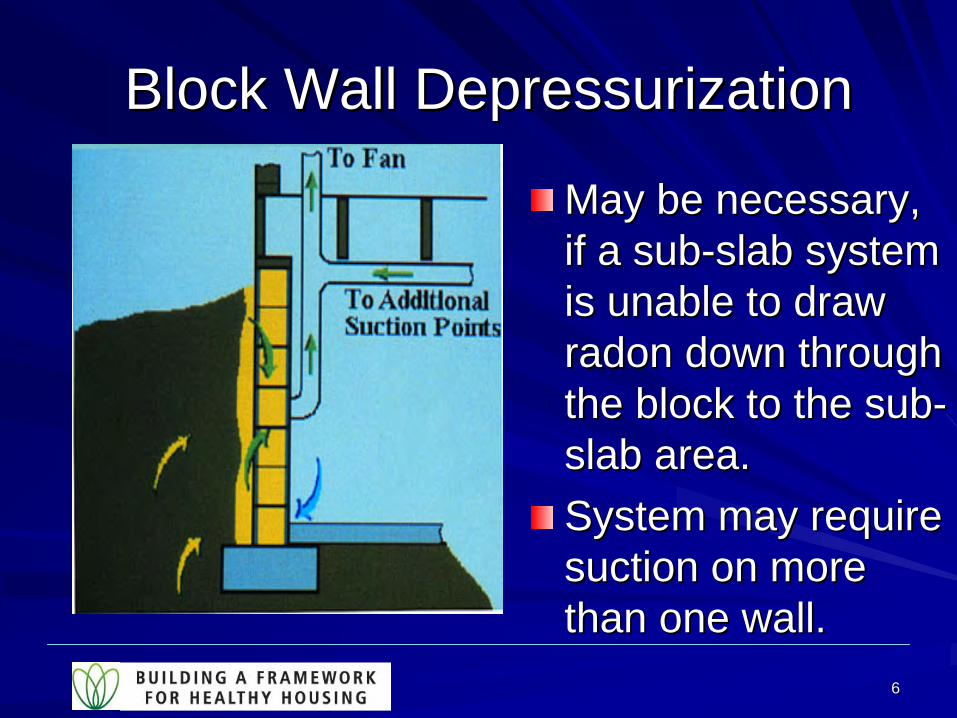
Block Wall DepressurizationBlock Wall Depressurization
May be necessary, May be necessary, if a subif a sub--slab system slab system is unable to draw is unable to draw radon down through radon down through the block to the subthe block to the sub-- slab area.slab area.System may require System may require suction on more suction on more than one wall.than one wall.
77
Active Systems
Active Active SystemsSystems
88
Residential SSD Systems

99
Events Leading Up to the StudyEvents Leading Up to the Study
Anecdotal information dating from 1986Anecdotal information dating from 1986
Literature/model search in 2002Literature/model search in 2002
Experts meeting in June 2003Experts meeting in June 2003
Cooperative Agreement July 14, 2004Cooperative Agreement July 14, 2004
1010
Accomplishments Accomplishments -- First YearFirst YearDeveloped house selection criteriaDeveloped house selection criteria
Developed conceptual modelDeveloped conceptual model
Measurement protocolsMeasurement protocols
Conducted walkConducted walk--through visitsthrough visits
Study houses selected Study houses selected –– criteria compromisedcriteria compromised
Instrumented three PA houses (May, July 2005)Instrumented three PA houses (May, July 2005)
Mitigated three PA houses (July, September 2005)Mitigated three PA houses (July, September 2005)
1111
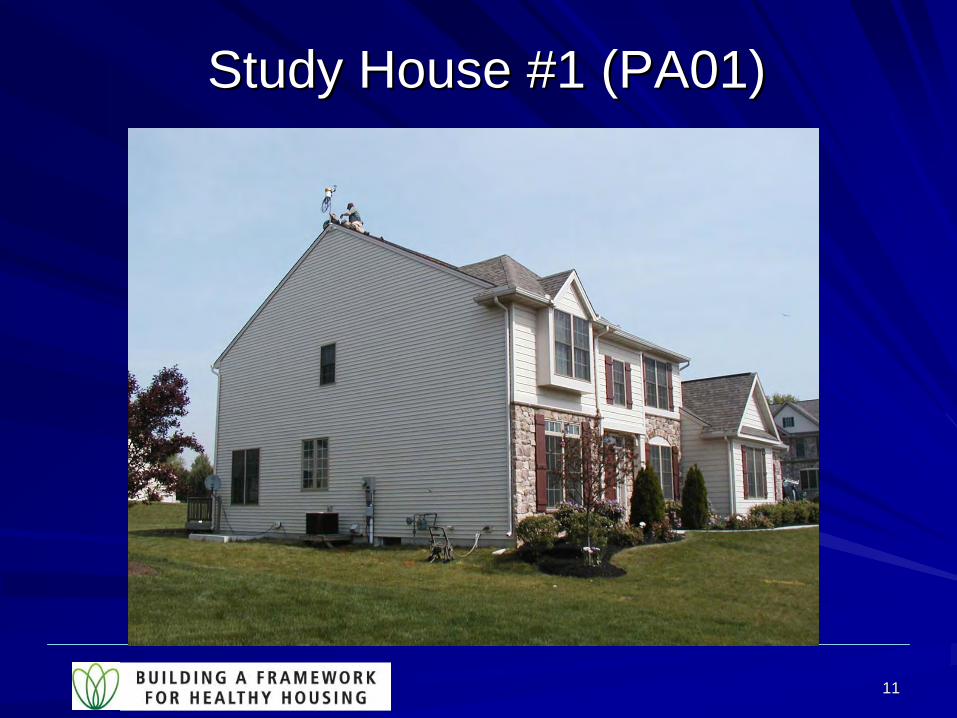
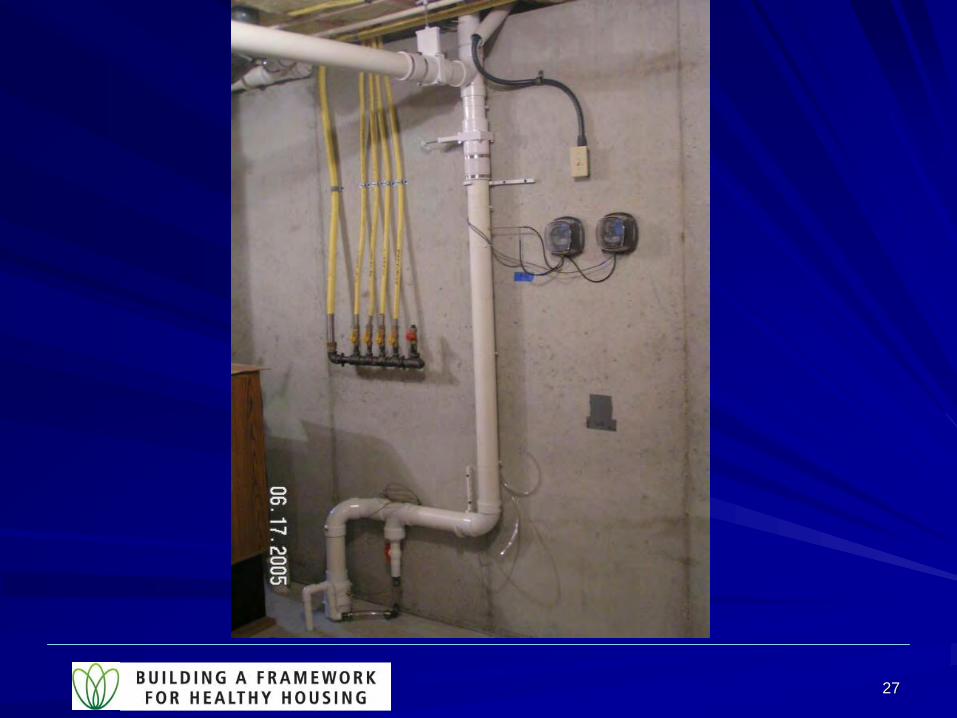
Study House #1 (PA01)Study House #1 (PA01)
1212
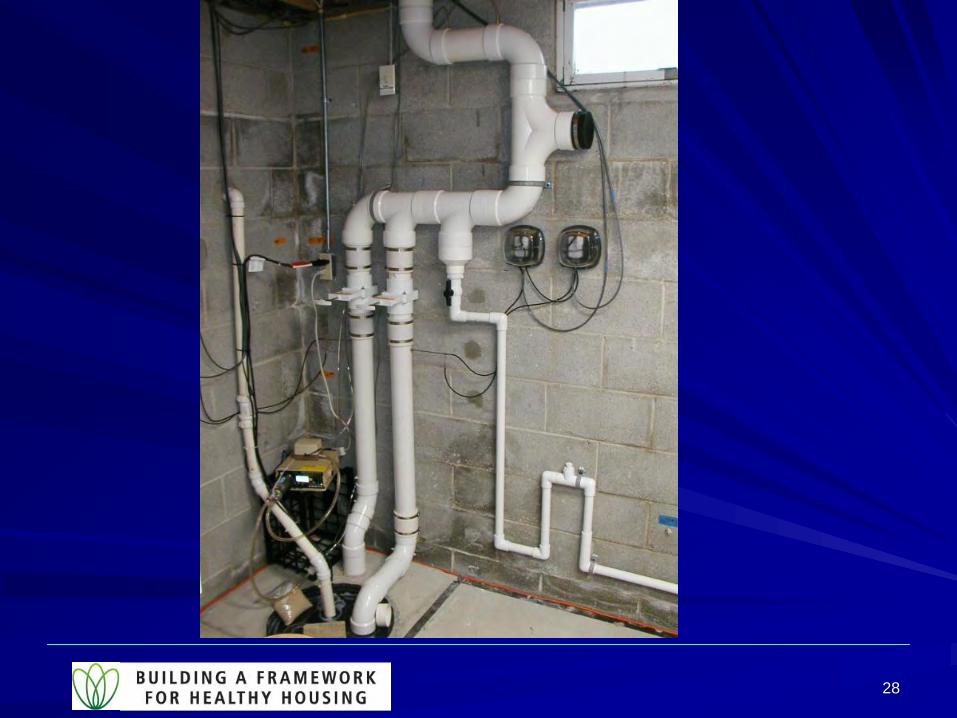
Study House #2 (PA02)Study House #2 (PA02)
1313
Study House #3 (PA03)Study House #3 (PA03)
1414
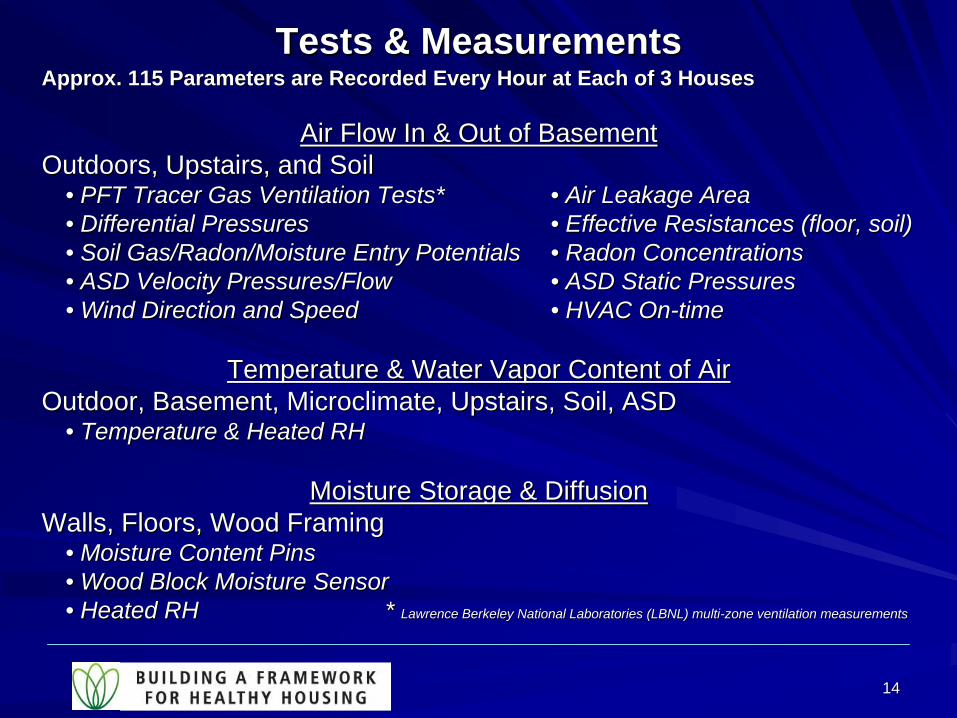
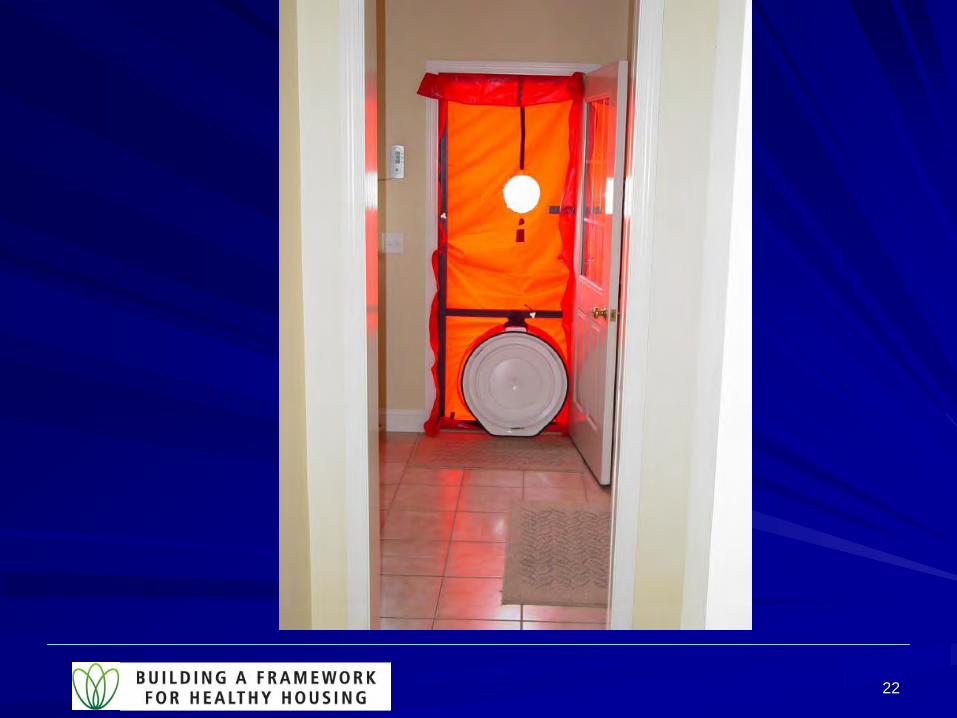
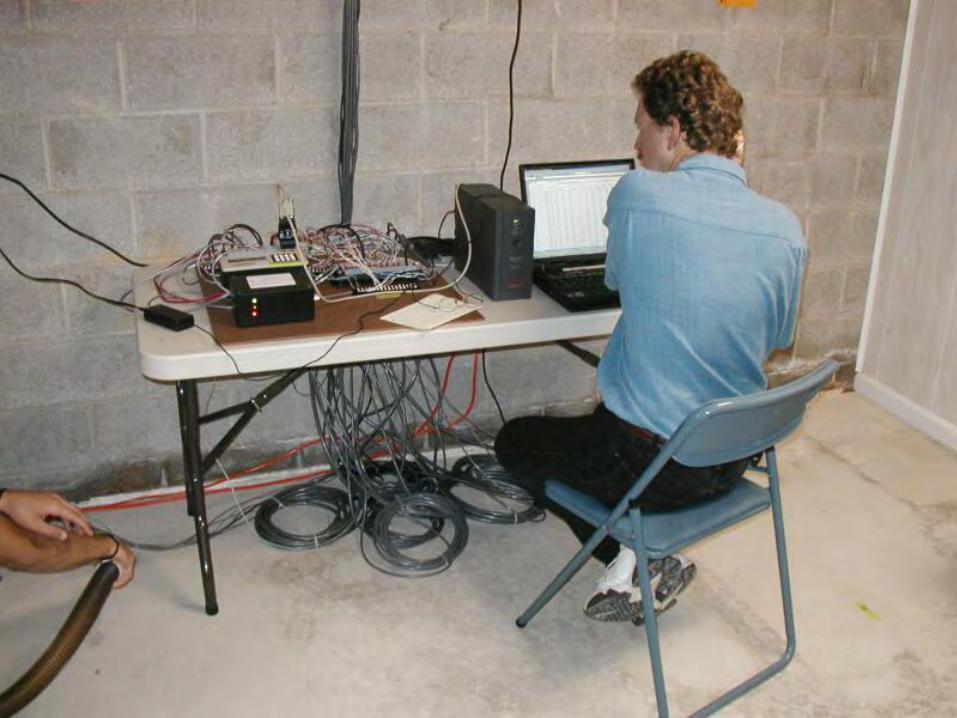
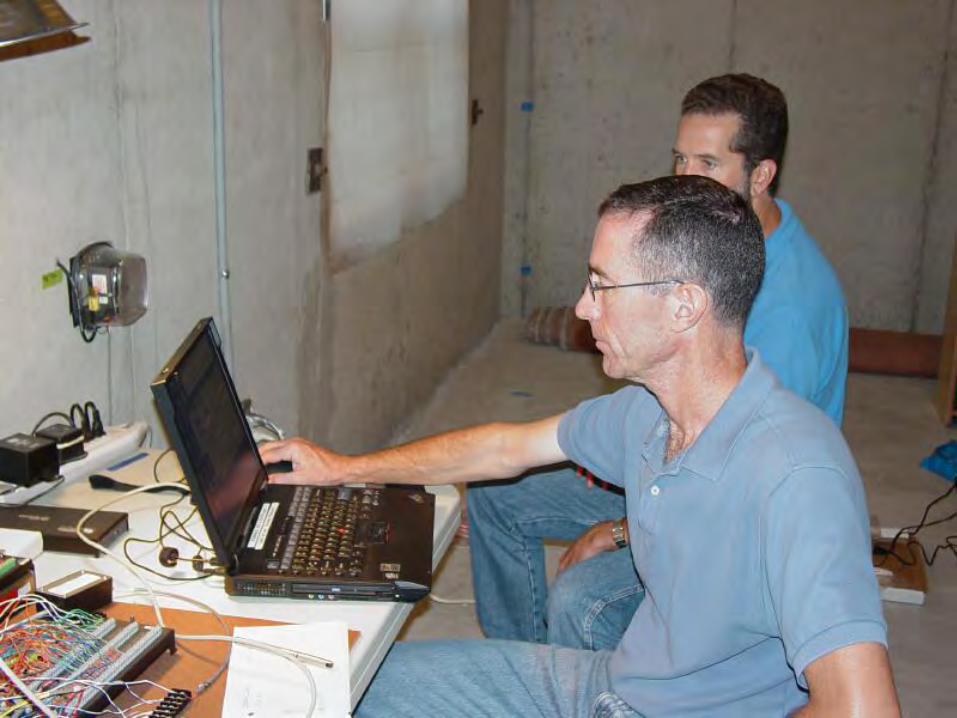
Tests & MeasurementsTests & MeasurementsApprox. 115 Parameters are Recorded Every Hour at Each of 3 HousApprox. 115 Parameters are Recorded Every Hour at Each of 3 Houseses
Air Flow In & Out of BasementAir Flow In & Out of BasementOutdoors, Upstairs, and SoilOutdoors, Upstairs, and Soil
•• PFT Tracer Gas Ventilation Tests*PFT Tracer Gas Ventilation Tests* •• Air Leakage AreaAir Leakage Area•• Differential PressuresDifferential Pressures •• Effective Resistances (floor, soil)Effective Resistances (floor, soil)•• Soil Gas/Radon/Moisture Entry PotentialsSoil Gas/Radon/Moisture Entry Potentials •• Radon ConcentrationsRadon Concentrations•• ASD Velocity Pressures/FlowASD Velocity Pressures/Flow •• ASD Static PressuresASD Static Pressures•• Wind Direction and SpeedWind Direction and Speed •• HVAC OnHVAC On--timetime
Temperature & Water Vapor Content of AirTemperature & Water Vapor Content of AirOutdoor, Basement, Microclimate, Upstairs, Soil, ASDOutdoor, Basement, Microclimate, Upstairs, Soil, ASD
•• Temperature & Heated RHTemperature & Heated RH
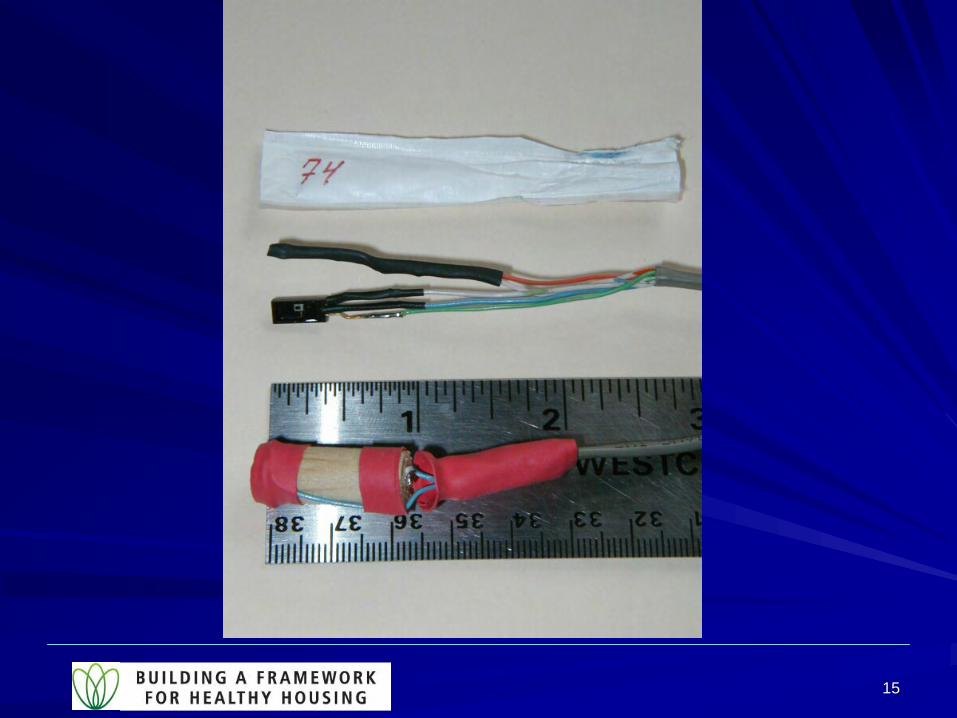
Moisture Storage & DiffusionMoisture Storage & DiffusionWalls, Floors, Wood FramingWalls, Floors, Wood Framing
•• Moisture Content PinsMoisture Content Pins•• Wood Block Moisture SensorWood Block Moisture Sensor•• Heated RH * Heated RH * Lawrence Berkeley National Laboratories (LBNL) multiLawrence Berkeley National Laboratories (LBNL) multi--zone ventilation measurementszone ventilation measurements
1515

1616
1717
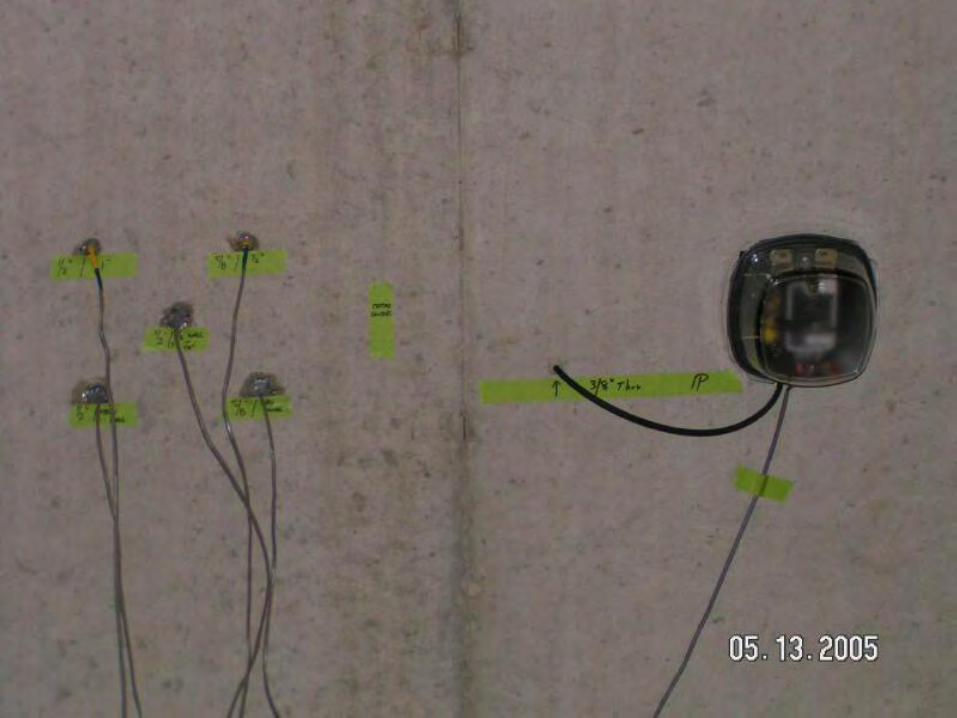
Measurement ClustersMeasurement Clusters
Key measurement locations of temp/RH/moistKey measurement locations of temp/RH/moist–– 4 wall locations4 wall locations–– 2 to 3 slab floor locations2 to 3 slab floor locations
Temp, RH, and moisture content at different depths in Temp, RH, and moisture content at different depths in wall and floor materialswall and floor materials–– Poured wall & block wall configurations differedPoured wall & block wall configurations differed
Also Delta P (all) and Radon (at 2 clusters)Also Delta P (all) and Radon (at 2 clusters)
1818
1919
2020
2121
2222

2323
Multi-tracer Interzonal Flow & Ventilation System

2424
2525
2626
2727
2828

2929
3030
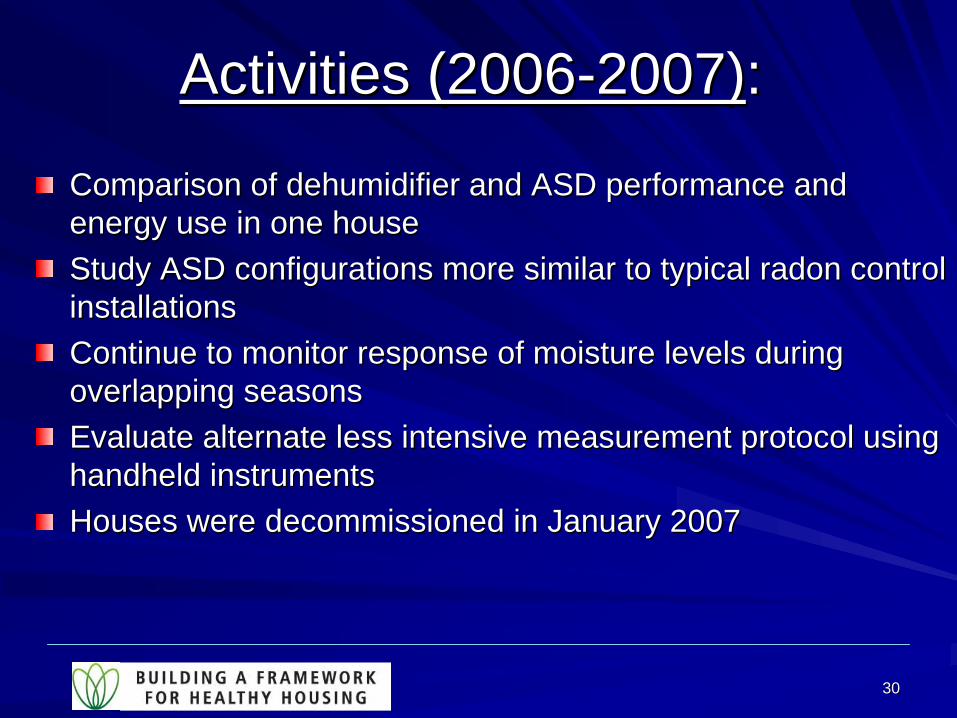
Activities (2006Activities (2006--2007)2007)::
Comparison of dehumidifier and ASD performance and Comparison of dehumidifier and ASD performance and energy use in one houseenergy use in one houseStudy ASD configurations more similar to typical radon control Study ASD configurations more similar to typical radon control installationsinstallationsContinue to monitor response of moisture levels during Continue to monitor response of moisture levels during overlapping seasonsoverlapping seasonsEvaluate alternate less intensive measurement protocol using Evaluate alternate less intensive measurement protocol using handheld instruments handheld instruments Houses were decommissioned in January 2007Houses were decommissioned in January 2007
3131
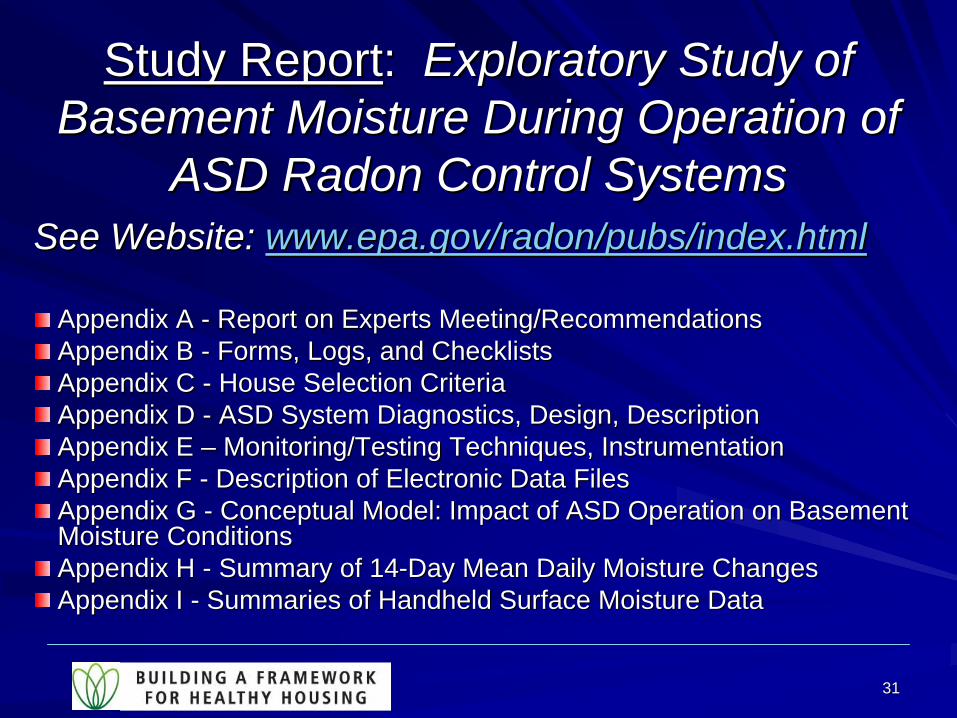
Study ReportStudy Report: : Exploratory Study of Exploratory Study of Basement Moisture During Operation of Basement Moisture During Operation of
ASD Radon Control SystemsASD Radon Control SystemsSee Website: See Website: www.epa.gov/radon/pubs/index.htmlwww.epa.gov/radon/pubs/index.html
Appendix A Appendix A -- Report on Experts Meeting/RecommendationsReport on Experts Meeting/RecommendationsAppendix B Appendix B -- Forms, Logs, and ChecklistsForms, Logs, and ChecklistsAppendix C Appendix C -- House Selection CriteriaHouse Selection CriteriaAppendix D Appendix D -- ASD System Diagnostics, Design, DescriptionASD System Diagnostics, Design, DescriptionAppendix E Appendix E –– Monitoring/Testing Techniques, InstrumentationMonitoring/Testing Techniques, InstrumentationAppendix F Appendix F -- Description of Electronic Data FilesDescription of Electronic Data FilesAppendix G Appendix G -- Conceptual Model: Impact of ASD Operation on Basement Conceptual Model: Impact of ASD Operation on Basement Moisture ConditionsMoisture ConditionsAppendix H Appendix H -- Summary of 14Summary of 14--Day Mean Daily Moisture ChangesDay Mean Daily Moisture ChangesAppendix I Appendix I -- Summaries of Handheld Surface Moisture DataSummaries of Handheld Surface Moisture Data
3232
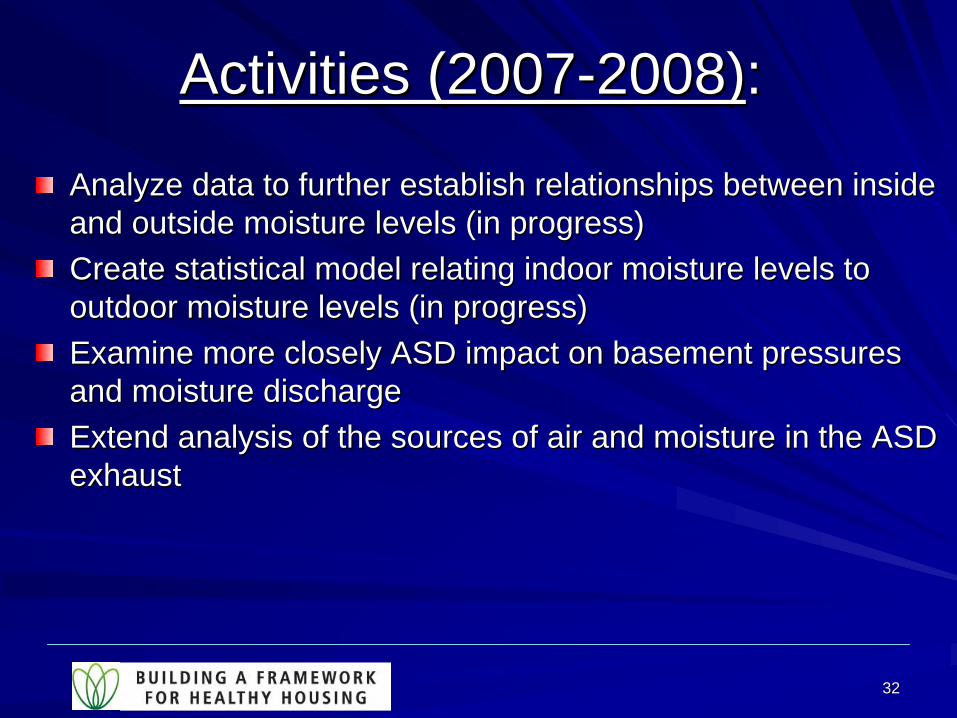
Activities (2007Activities (2007--2008)2008)::
Analyze data to further establish relationships between inside Analyze data to further establish relationships between inside and outside moisture levels (in progress)and outside moisture levels (in progress)Create statistical model relating indoor moisture levels to Create statistical model relating indoor moisture levels to outdoor moisture levels (in progress)outdoor moisture levels (in progress)Examine more closely ASD impact on basement pressures Examine more closely ASD impact on basement pressures and moisture dischargeand moisture dischargeExtend analysis of the sources of air and moisture in the ASD Extend analysis of the sources of air and moisture in the ASD exhaustexhaust
Exploratory Study of Basement Moisture During Operation of
ASD Radon Control Systems: Results & Analysis
Bradley TurkEnvironmental Building Sciences, Inc. - Las Vegas, New Mexico, USA
U.S. EPA Indoor Environments Division -- Project SponsorEugene Fisher, Patsy Brooks, Phil Jalbert, Susie Shimek
Auburn University SRRTCJack Hughes
PA Department of Environmental Protection (PA DEP)Robert Lewis, Michael Pyles, Matthew Shields
University of Waterloo (Ontario, Canada)John Straube
Conceptual Model
• Question: How would ASD affect moisture in basements?
• Premise: ASD could alter air flow patterns into, within, and out of building
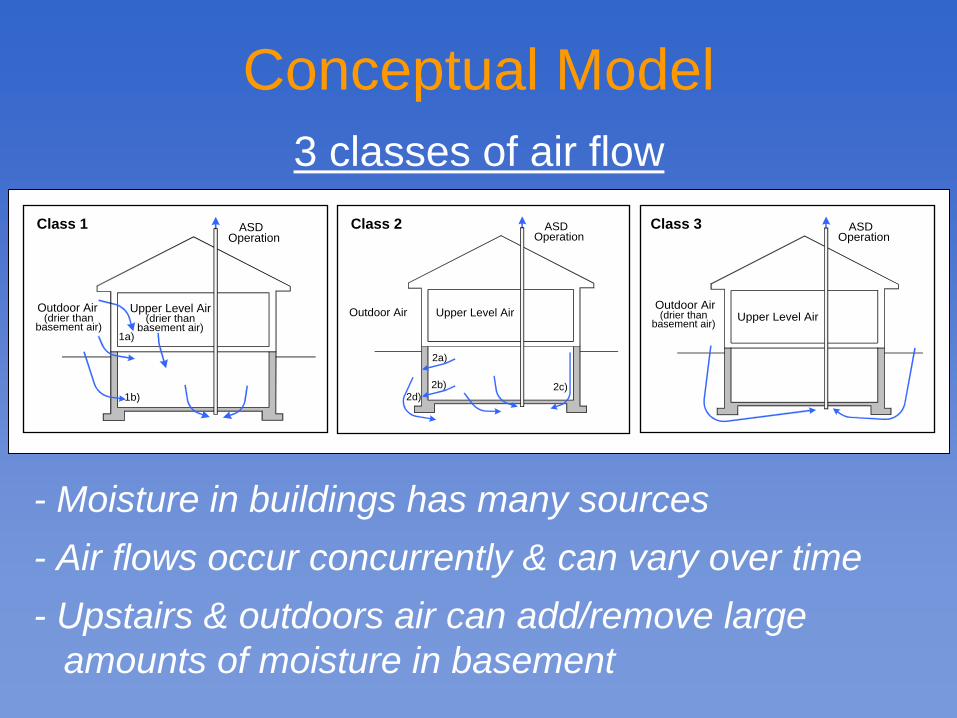
Conceptual Model
ASD Operation
Outdoor Air Upper Level Air (drier than
basement air)(drier than
basement air)1a)
1b)
ASD Operation
Outdoor Air Upper Level Air
2a)
2b)2d)
2c)
ASD Operation
Outdoor Air Upper Level Air (drier than
basement air)
Class 1 Class 2 Class 3
- Moisture in buildings has many sources- Air flows occur concurrently & can vary over time- Upstairs & outdoors air can add/remove large
amounts of moisture in basement
3 classes of air flow
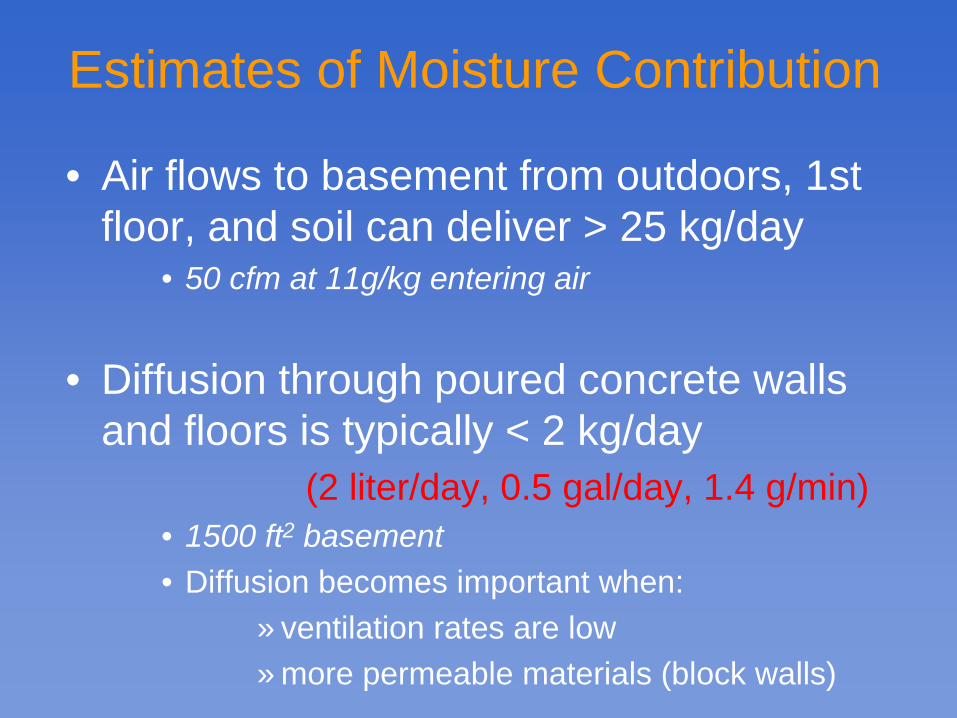
Estimates of Moisture Contribution
• Air flows to basement from outdoors, 1st floor, and soil can deliver > 25 kg/day
• 50 cfm at 11g/kg entering air
• Diffusion through poured concrete walls and floors is typically < 2 kg/day
(2 liter/day, 0.5 gal/day, 1.4 g/min)• 1500 ft2 basement• Diffusion becomes important when:
» ventilation rates are low» more permeable materials (block walls)
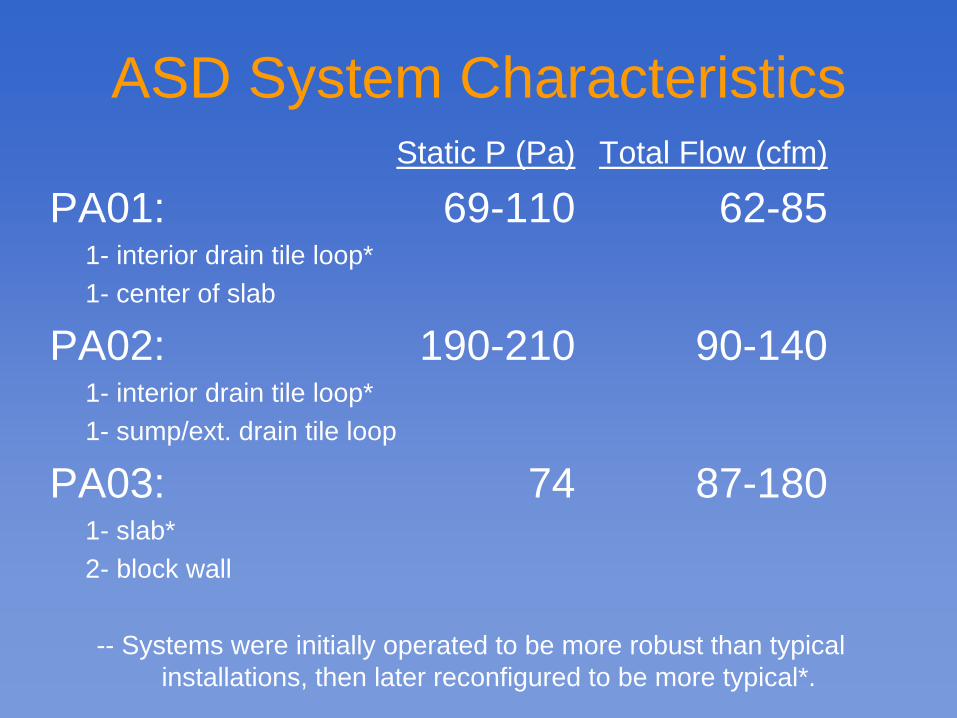
ASD System CharacteristicsStatic P (Pa) Total Flow (cfm)
PA01: 69-110 62-851- interior drain tile loop*1- center of slab
PA02: 190-210 90-1401- interior drain tile loop*1- sump/ext. drain tile loop
PA03: 74 87-1801- slab*2- block wall
-- Systems were initially operated to be more robust than typical installations, then later reconfigured to be more typical*.
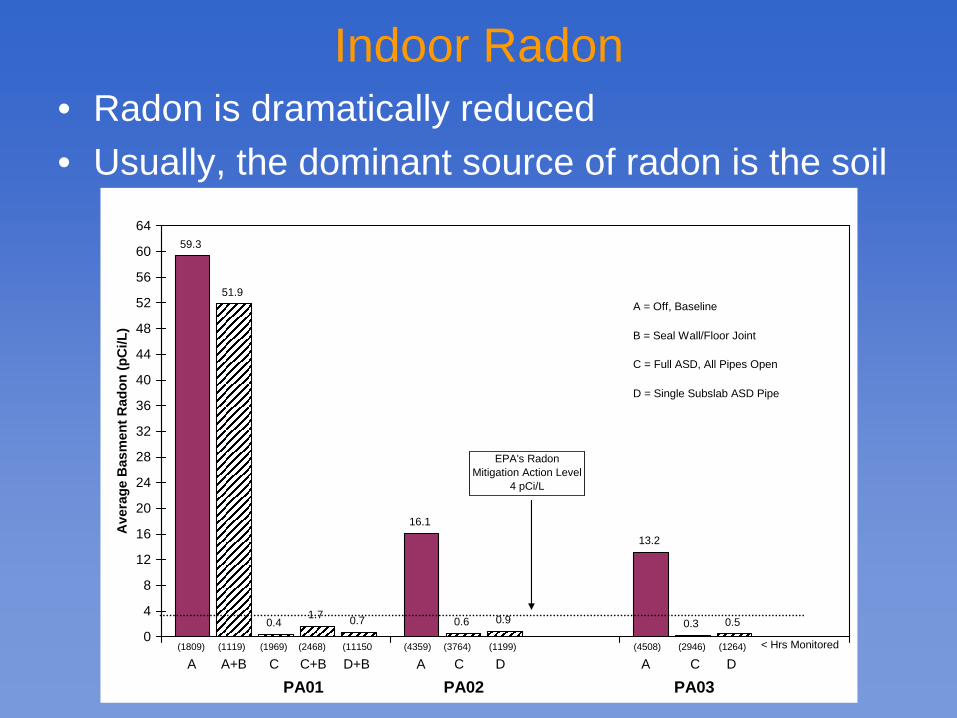
Indoor Radon• Radon is dramatically reduced• Usually, the dominant source of radon is the soil
59.3
16.1
13.2
51.9
0.6 0.30.4 0.9 0.51.7 0.7
0
4
8
12
16
20
24
28
32
36
40
44
48
52
56
60
64
Ave
rage
Bas
men
t Rad
on (p
Ci/L
)
EPA's RadonMitigation Action Level
4 pCi/L
PA01 PA02 PA03
(1809) (1119) (1969) (2468) (11150)
(4359) (3764) (1199) (4508) (2946) (1264)
A = Off, Baseline
B = Seal Wall/Floor Joint
C = Full ASD, All Pipes Open
D = Single Subslab ASD Pipe
A A+B C C+B D+B A C D A C D< Hrs Monitored
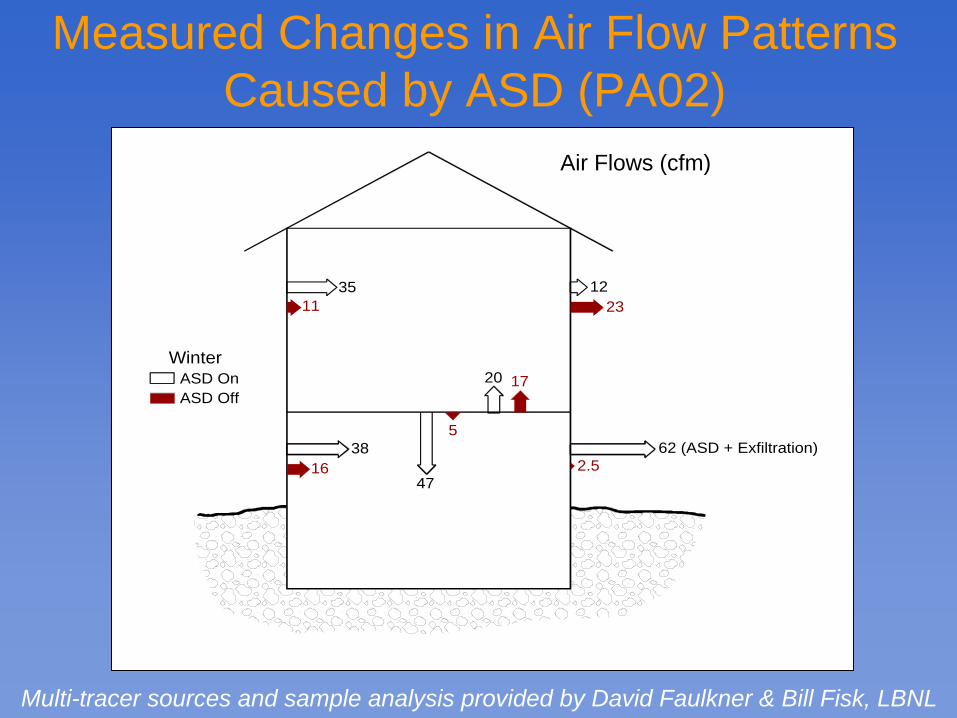
Measured Changes in Air Flow Patterns Caused by ASD (PA02)
1223
3511
62 (ASD + Exfiltration)2.5
3816
47
20
5
17Winter
ASD OnASD Off
Multi-tracer sources and sample analysis provided by David Faulkner & Bill Fisk, LBNL
Air Flows (cfm)
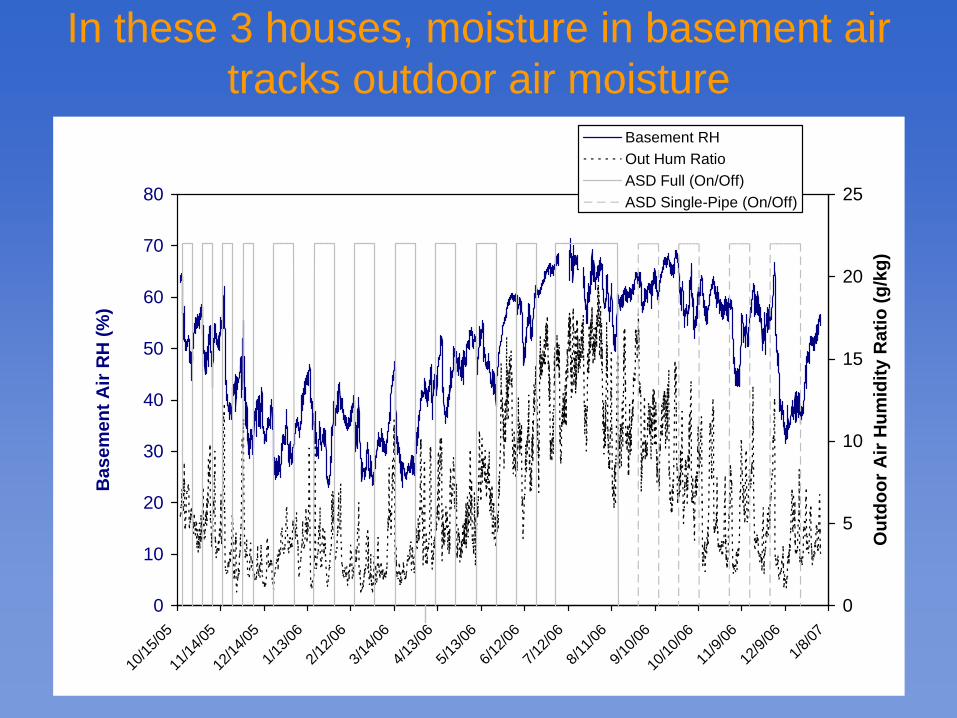
In these 3 houses, moisture in basement air tracks outdoor air moisture
0
10
20
30
40
50
60
70
80
10/15
/0511
/14/05
12/14
/051/1
3/06
2/12/0
63/1
4/06
4/13/0
65/1
3/06
6/12/0
67/1
2/06
8/11/0
69/1
0/06
10/10
/0611
/9/06
12/9/
061/8
/07
Bas
emen
t Air
RH
(%)
0
5
10
15
20
25
Out
door
Air
Hum
idity
Rat
io (g
/kg)
Basement RHOut Hum RatioASD Full (On/Off)ASD Single-Pipe (On/Off)
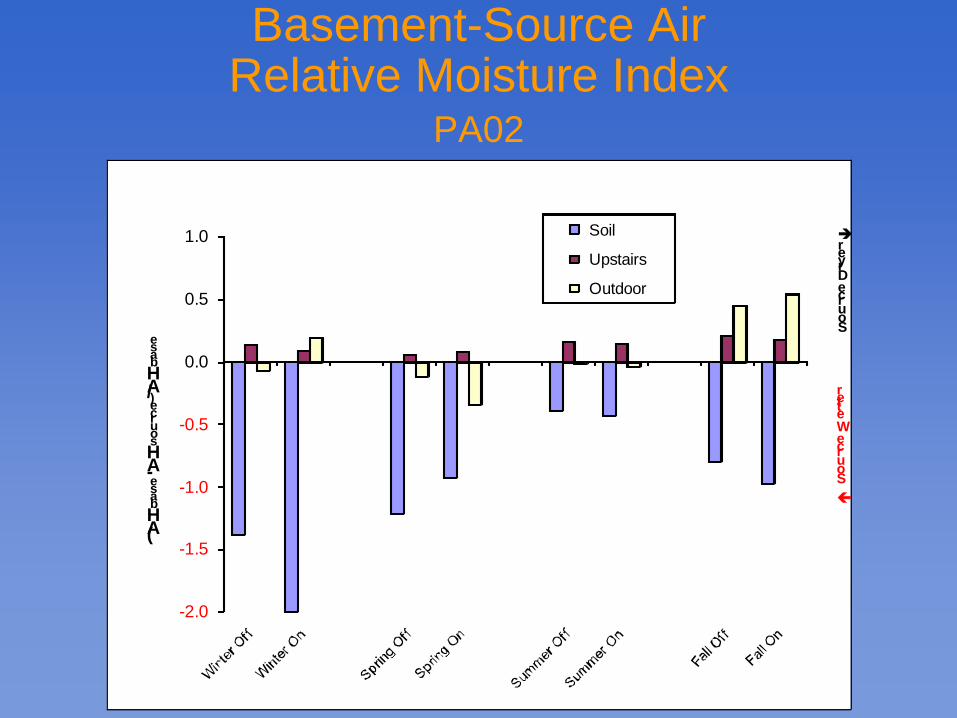
Basement-Source Air Relative Moisture Index
PA02
-2.0
-1.5
-1.0
-0.5
0.0
0.5
1.0
(AHbase-AHsource)/AHbase
Soil
Upstairs
Outdoor
Source Wetter
Source Dryer
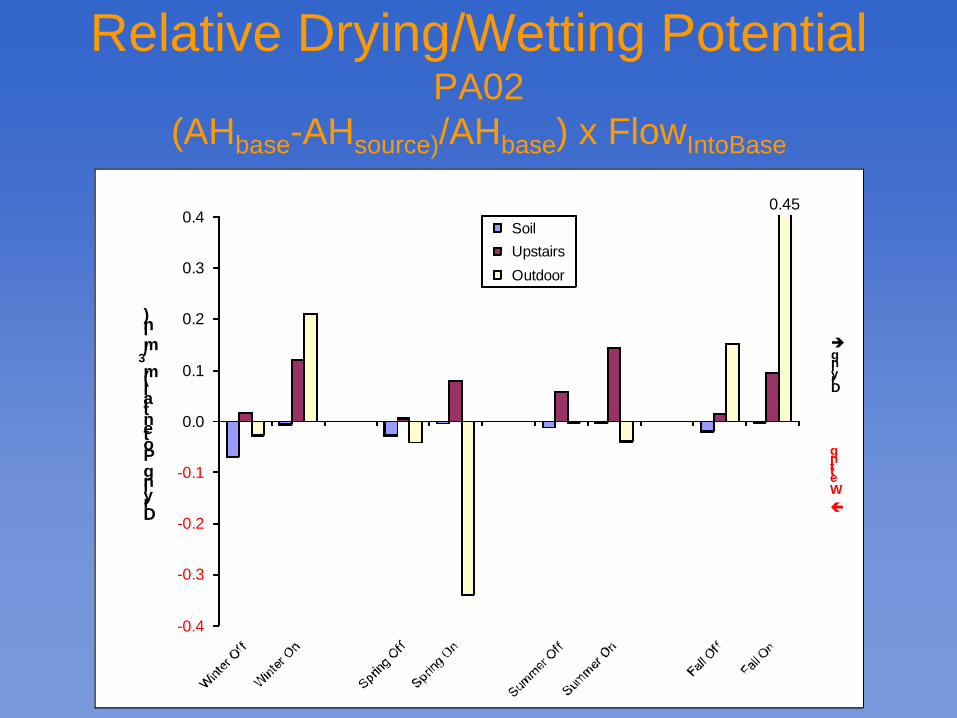
Relative Drying/Wetting Potential PA02
(AHbase -AHsource) /AHbase ) x FlowIntoBase
-0.4
-0.3
-0.2
-0.1
0.0
0.1
0.2
0.3
0.4
Drying Potential (m
3/min)
SoilUpstairsOutdoor
Wetting
Drying
0.45
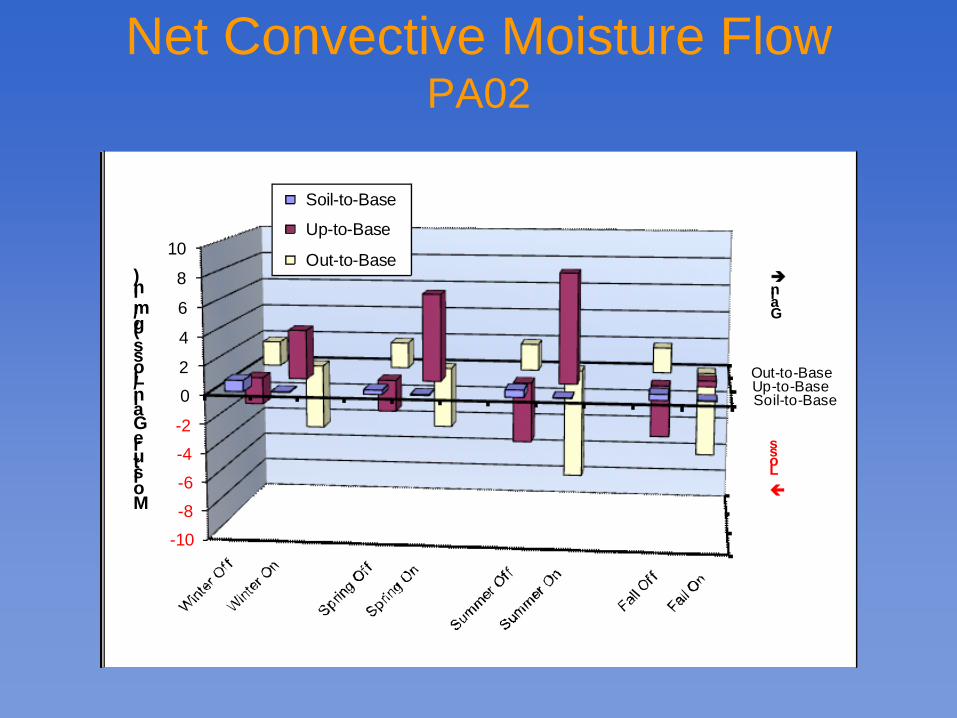
Net Convective Moisture Flow PA02
Soil-to-BaseUp-to-BaseOut-to-Base
-10
-8
-6
-4
-2
0
2
4
6
8
10
Moisture Gain/Loss (g/min)
Soil-to-Base
Up-to-Base
Out-to-Base
Gain
Loss
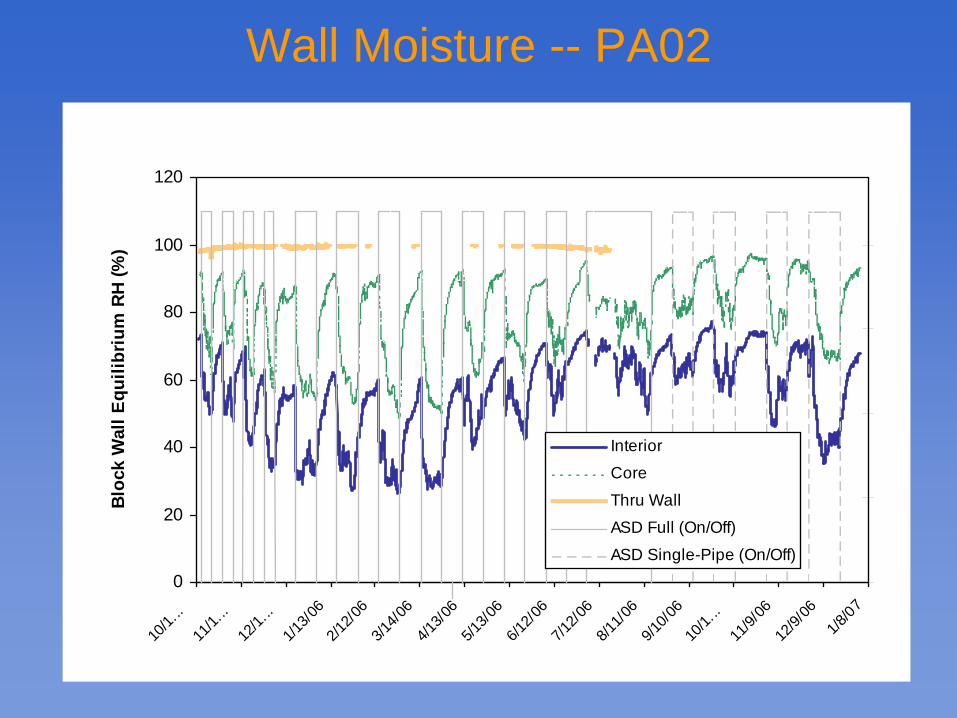
Wall Moisture -- PA02
0
20
40
60
80
100
120
10/1.
..11
/1...
12/1.
..1/1
3/06
2/12/0
63/1
4/06
4/13/0
65/1
3/06
6/12/0
67/1
2/06
8/11/0
69/1
0/06
10/1.
..11
/9/06
12/9/
061/8
/07B
lock
Wal
l Equ
ilibr
ium
RH
(%)
Interior
Core
Thru Wall
ASD Full (On/Off)
ASD Single-Pipe (On/Off)

Mean RH -- PA02 Dec 2005 -- Jan 2007
41.0
60.4
80.6 82
.5
89.8
33.8
41.
6
57.5
80.2
88.9
56.4
73.9
87.2
85.6
91.3
48.7
58.3
74.1
83.2
90.3
60.9
74.1
88.3
86.7 91
.0
61.8
68.1
83.9 87
.1 90.7
0
10
20
30
40
50
60
70
80
90
100
Interior Core Top Middle
Mea
n R
elat
ive
Hum
idity
(%)
ASD OffASD Full OnASD Single-Pipe OffASD Single-Pipe OnSummer -- ASD OffSummer -- ASD Full On
p<.0001
Block Walls Slab Floor
p<.0001
p=0.1888
p<.0001
p<.0001
p<.0001
p<.0001
p<.0001
p<.0001
p<.0001
p<.0001
p=0.3333
p<.0001
p<.0001
p=0.3958
Basement AirSecond 7 days of 14-day, or longer, cycling periods

Autoregression on 1st Seven Days of Each Cycle PA02 Basement Air
0
10
20
30
40
50
60
70
80
10/15
/0511
/13/05
12/13
/051/1
2/06
2/10/0
63/1
2/06
4/11/0
65/1
0/06
6/9/06
7/9/06
8/7/06
9/6/06
10/6/
0611
/4/06
12/4/06
1/3/07
Bas
emen
t Air
RH
(%)
0
5
10
15
20
25
Out
door
Air
Hum
idity
Rat
io (g
/kg)
Measured RHRegress Line - ASD OnRegress Line - ASD OffASD (On/Off)
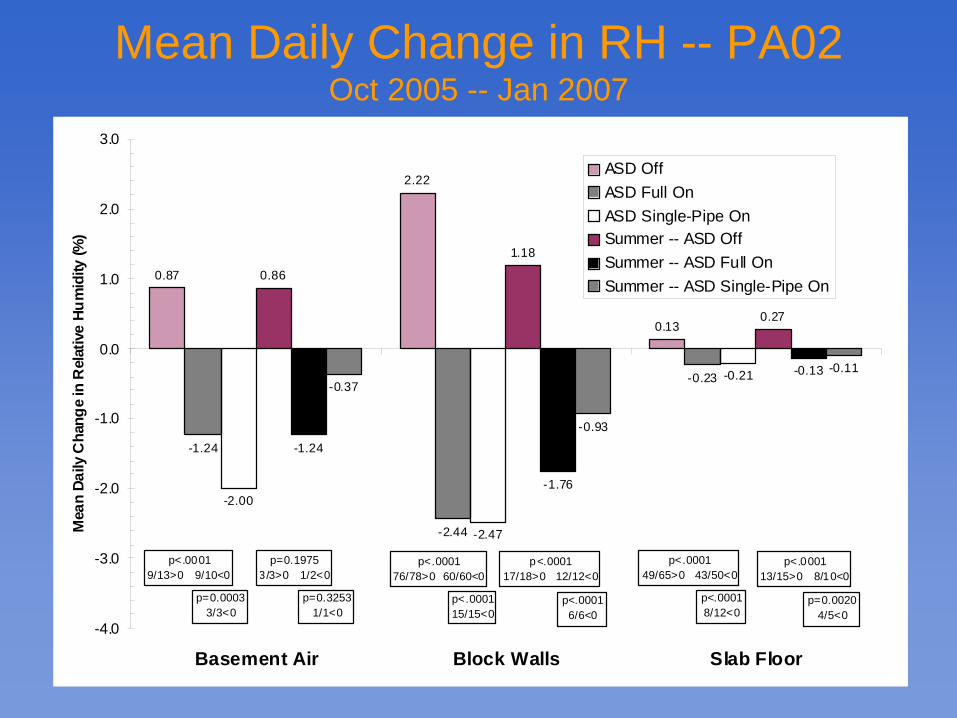
Mean Daily Change in RH -- PA02 Oct 2005 -- Jan 2007
0.87
2.22
0.13
-1.24
-2.44
-0.23
-2.00
-2.47
-0.21
0.86
1.18
0.27
-1.24
-1.76
-0.13-0.37
-0.93
-0.11
-4.0
-3.0
-2.0
-1.0
0.0
1.0
2.0
3.0
Basement Air Block Walls Slab Floor
Mea
n Da
ily C
hang
e in
Rel
ativ
e Hu
mid
ity (%
)
ASD OffASD Full OnASD Single-Pipe OnSummer -- ASD OffSummer -- ASD Full OnSummer -- ASD Single-Pipe On
p<.00019/13>0 9/10<0
p<.000117/18>0 12/12<0
p<.000149/65>0 43/50<0
p=0.00033/3<0
p=0.19753/3>0 1/2<0
p<.000176/78>0 60/60<0
p=0.32531/1<0
p<.00016/6<0
p<.000115/15<0
p<.00018/12<0
p<.000113/15>0 8/10<0
p=0.00204/5<0
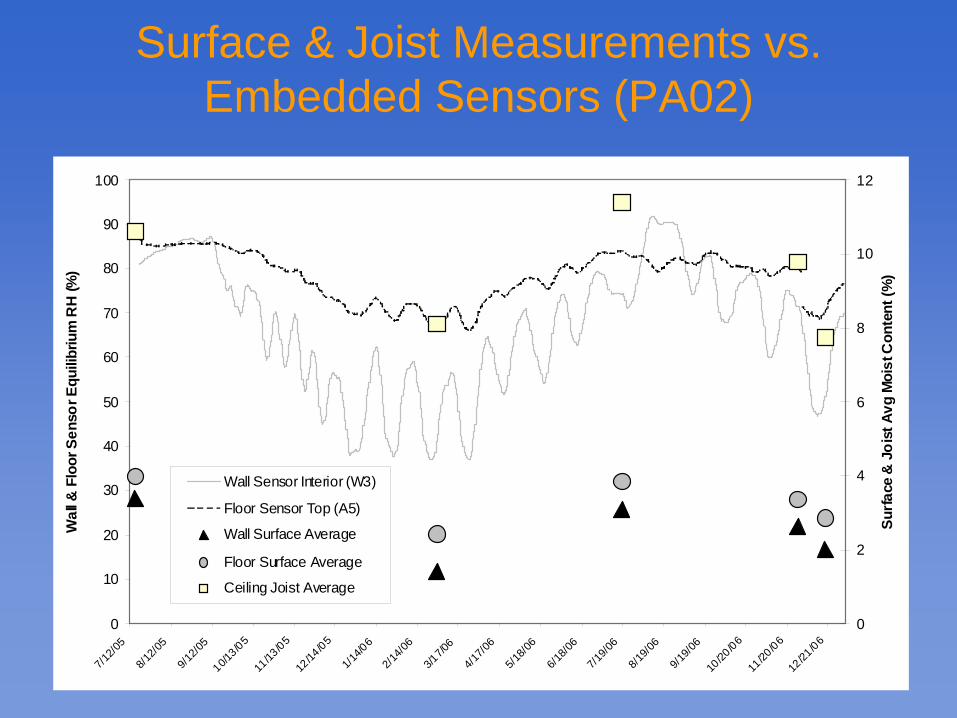
Surface & Joist Measurements vs. Embedded Sensors (PA02)
0
10
20
30
40
50
60
70
80
90
100
7/12/0
5
8/12/0
5
9/12/0
510/1
3/0511
/13/05
12/14
/05
1/14/0
62/1
4/06
3/17/0
6
4/17/0
6
5/18/0
6
6/18/0
67/1
9/06
8/19/0
6
9/19/0
610
/20/06
11/20
/0612
/21/06
Wal
l & F
loor
Sen
sor E
quili
briu
m R
H (%
)
0
2
4
6
8
10
12
Surfa
ce &
Joi
st A
vg M
oist
Con
tent
(%)
Wall Sensor Interior (W3)
Floor Sensor Top (A5)
Wall Surface Average
Floor Surface Average
Ceiling Joist Average
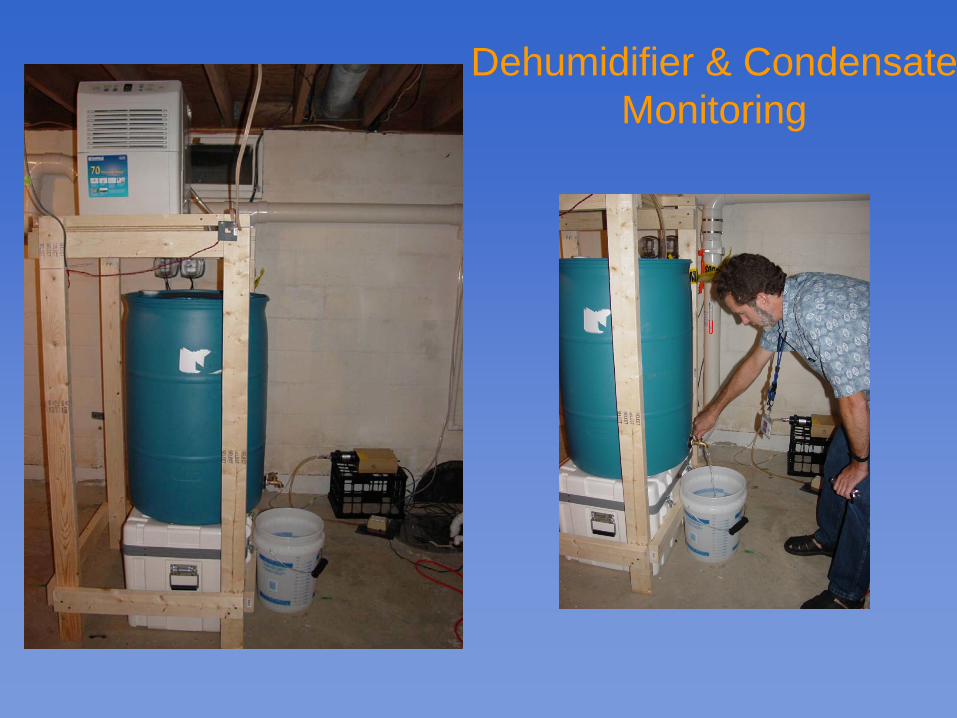
Dehumidifier & Condensate Monitoring
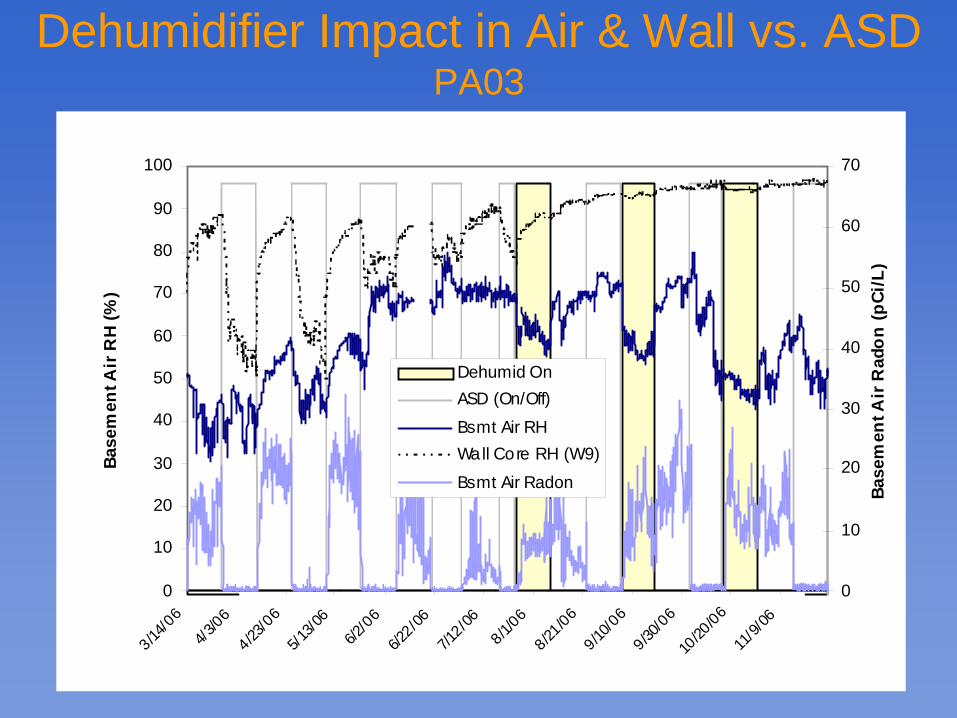
Dehumidifier Impact in Air & Wall vs. ASD PA03
0
10
20
30
40
50
60
70
80
90
100
3/14/0
64/3
/064/23
/06
5/13/0
6
6/2/0
66/2
2/067/1
2/068/1/
068/21
/069/10
/06
9/30/0
610
/20/06
11/9/
06
Base
men
t Air
RH
(%)
0
10
20
30
40
50
60
70
Base
men
t Air
Rad
on (p
Ci/L
)
Dehumid OnASD (On/Off)
Bsmt Air RHWall Core RH (W9)
Bsmt Air Radon
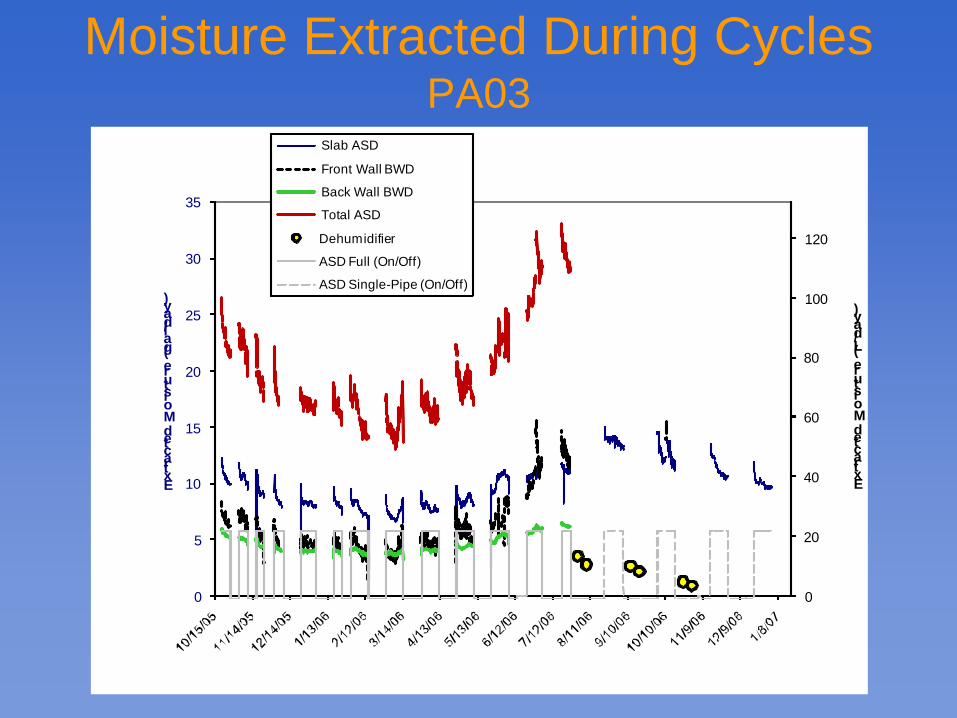
Moisture Extracted During Cycles PA03
0
20
40
60
80
100
120
0
5
10
15
20
25
30
35
Extracted Moisture (L/day)
Extracted Moisture (gal/day)
Slab ASD
Front Wall BWD
Back Wall BWD
Total ASD
Dehumidifier
ASD Full (On/Off)
ASD Single-Pipe (On/Off)
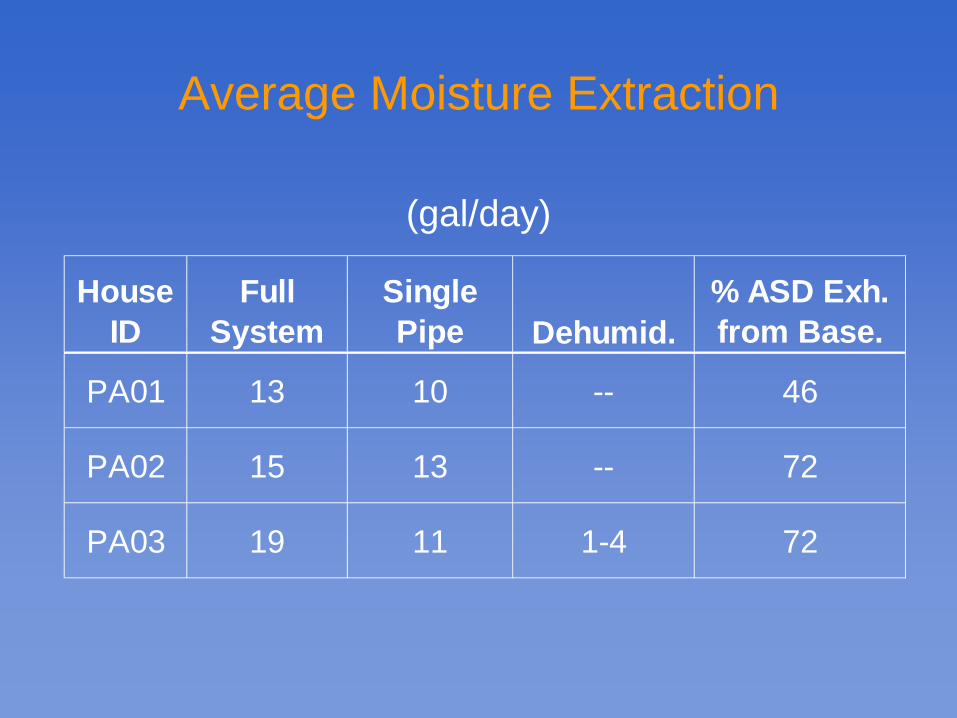
Average Moisture Extraction
(gal/day)
HouseID
FullSystem
SinglePipe Dehumid.
% ASD Exh. from Base.
PA01 13 10 -- 46
PA02 15 13 -- 72
PA03 19 11 1-4 72
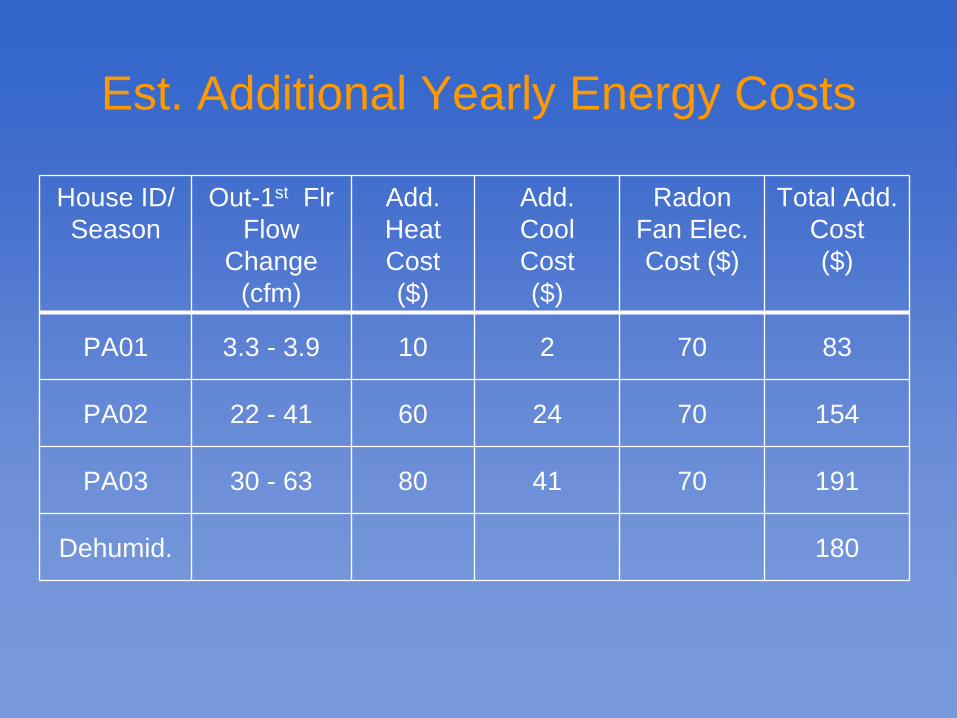
Est. Additional Yearly Energy Costs
House ID/ Season
Out-1st FlrFlow
Change (cfm)
Add. Heat Cost($)
Add. CoolCost($)
Radon Fan Elec. Cost ($)
Total Add. Cost($)
PA01 3.3 - 3.9 10 2 70 83
PA02 22 - 41 60 24 70 154
PA03 30 - 63 80 41 70 191
Dehumid. 180
Summary for These Houses• During non-summer months ASD caused
significant reductions in basement moisture (and likely reduces summer dehumidification)
• ASD robustly controls radon; may affect IAQ and energy use
• Moisture Sources: Soil gas minor contributor, outdoor air moisture appears to dominate ASD effects
• Moisture Drying: Upstairs air, outdoor air (winter)• ASD impact on moisture related to many factors:
air leakage from outdoors, upstairs, and soil, HVAC systems, outdoor conditions, soil types
Summary for These Houses (cont)
• Moisture performance during continuous, long- term operation not studied
• Changes in air flow patterns consistent with model
• ASD can significantly increase outdoor air ventilation by exhaust: pros and cons
• At 1 house: dehumidifier more effective controlling indoor air RH, but ASD also reduced wall moisture
• Dehumidifier extracted approximately 8% to 25% of the moisture removed by the ASD system
Conclusion ASD Can Have Significant Moisture Impact,
But . . .
• ASD designed for radon control may not be optimal for all moisture concerns
• Uncontrolled, additional ventilation may not be desirable
• ASD impact on moisture may not be the same for different climates, seasons, and house construction and systems
Future Research Needs• Results of this study of 3 houses insufficient for
national design & policy guidance• Research framework:
–Enhance conceptual model: predict performance in other climates, house construction & soil types
–Develop simplified field evaluation, test and measurement protocols
–Field validation studies in other regions of US–Monitor microclimate & moisture in wall assemblies (e.g., frame & gypsum board) during ASD
–Examine system performance during continuous long-term operation

Get the Full Report
http://www.epa.gov/radon/pubs/index.html
(about the 6th publication on the list)