heat and mass transfer experiments in the center for...
TRANSCRIPT
Heat and mass transfer experiments in the Heat and mass transfer experiments in the Center for Energy ResearchCenter for Energy ResearchNational University MexicoNational University Mexico
Eduardo RamosHeat and Mass Transfer GroupCenter for Energy Research
National University of Mexico
Institute of Fundamental Technological ResearchPolish Academy of Sciences
23 June 2006

ContentsContents
1. Periodicity and bifurcation in capillary boiling
2. Quasi 2D-vortices generated by the Lorentz force in an electrolyte
3. Natural convection in a centrifuge

1. Periodicity and bifurcation in capillary boiling1. Periodicity and bifurcation in capillary boiling
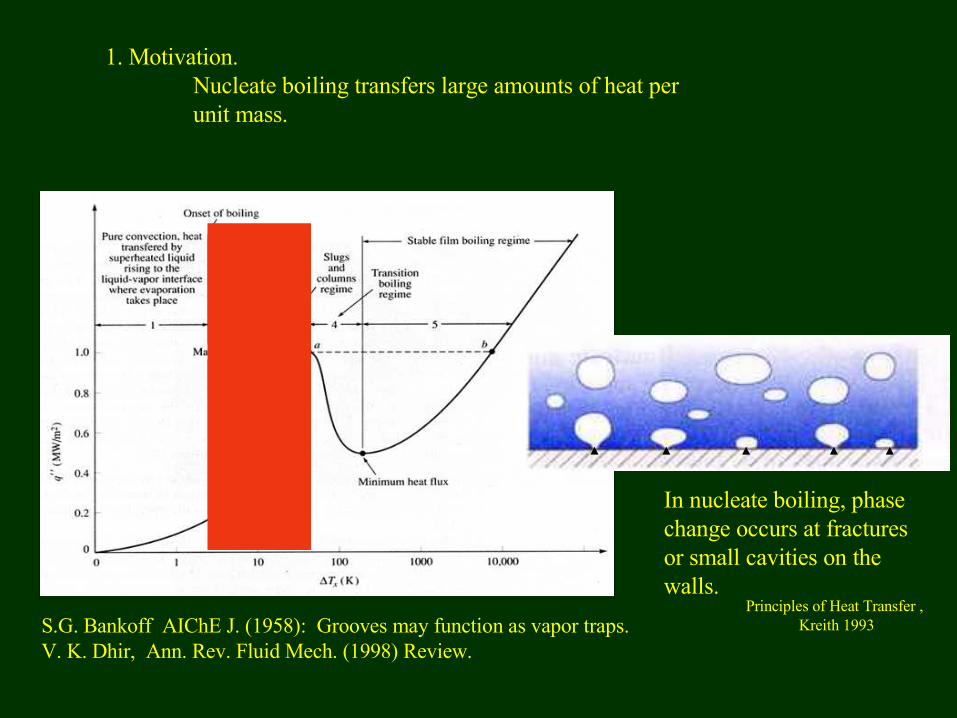
1. Motivation.Nucleate boiling transfers large amounts of heat per unit mass.
S.G. Bankoff AIChE J. (1958): Grooves may function as vapor traps.V. K. Dhir, Ann. Rev. Fluid Mech. (1998) Review.
Principles of Heat Transfer , Kreith 1993
In nucleate boiling, phase change occurs at fractures or small cavities on the walls.
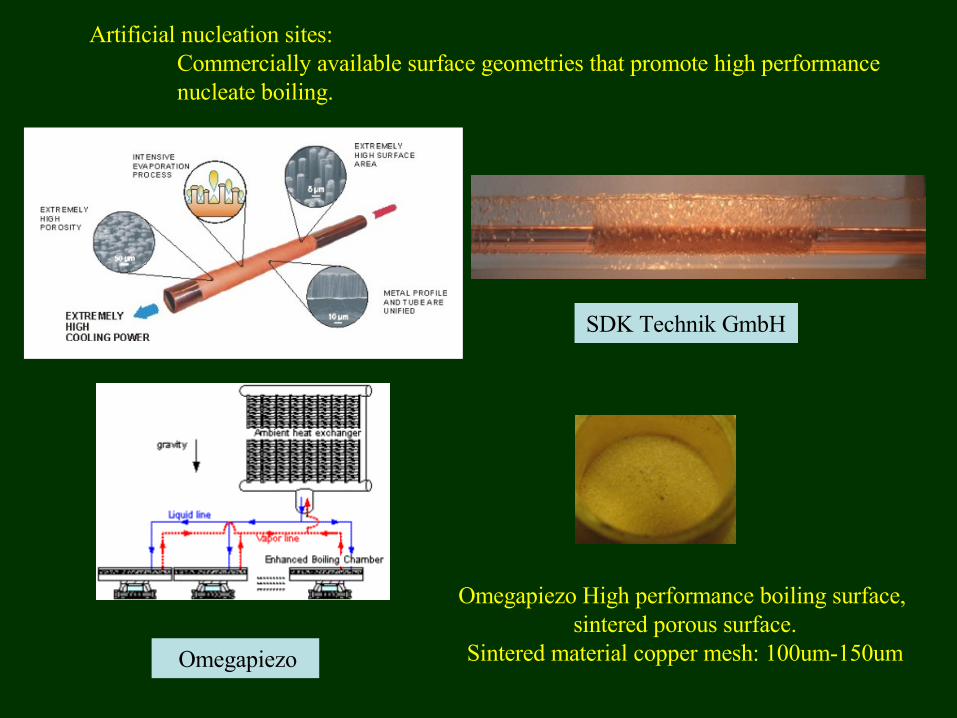
Artificial nucleation sites: Commercially available surface geometries that promote high performance nucleate boiling.
Omegapiezo
Omegapiezo High performance boiling surface, sintered porous surface.
Sintered material copper mesh: 100um-150um
SDK Technik GmbH
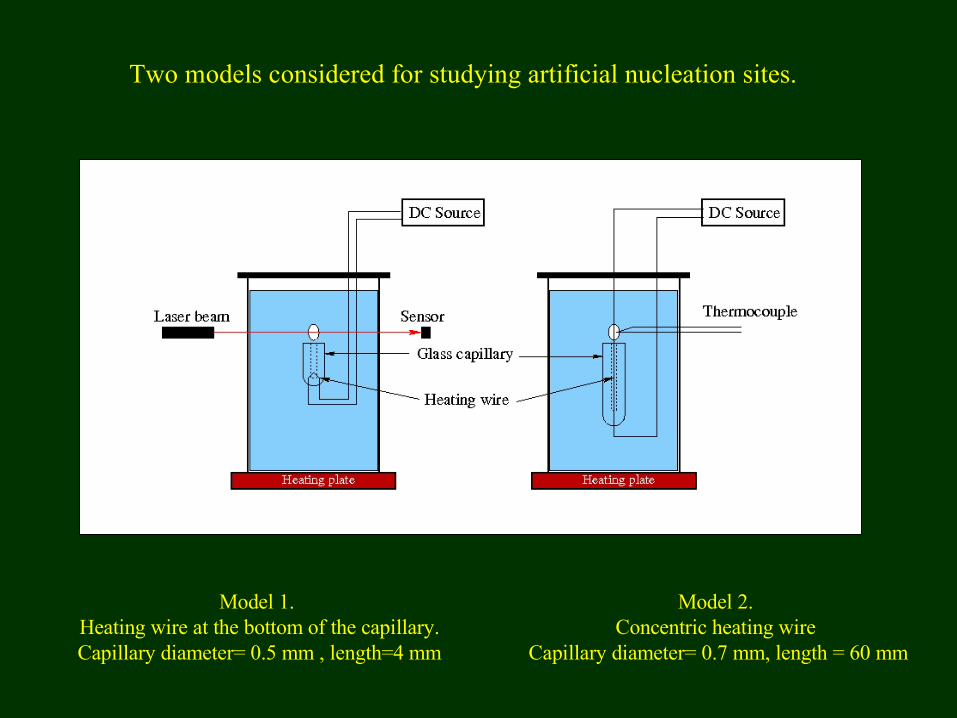
Two models considered for studying artificial nucleation sites.
Model 1. Heating wire at the bottom of the capillary.Capillary diameter= 0.5 mm , length=4 mm
Model 2. Concentric heating wire
Capillary diameter= 0.7 mm, length = 60 mm

Capillary model 1
Diameter 0.85 mm
Diameter 1.4 mm
4 mm

Observations with Model 1: Bubble transit at the tip of the capillary
Long interval between bubbles
Absence of bubble
Presence of bubble
Short interval between bubbles
…LLLSLLLLLSLLL…
time (s)
sign
al o
utpu
t (V
)

Observations with Model 1
Average long interval ~ 0.18 sAverage short interval ~0.075 s
Large interval between bubbles
Small interval between bubbles
Time between bubbles (s)
Cou
nts
Event
Tim
e be
twee
n bu
bble
s (s
)

Visualization
Gra
y le
vel
Gray level monitor
time (s)
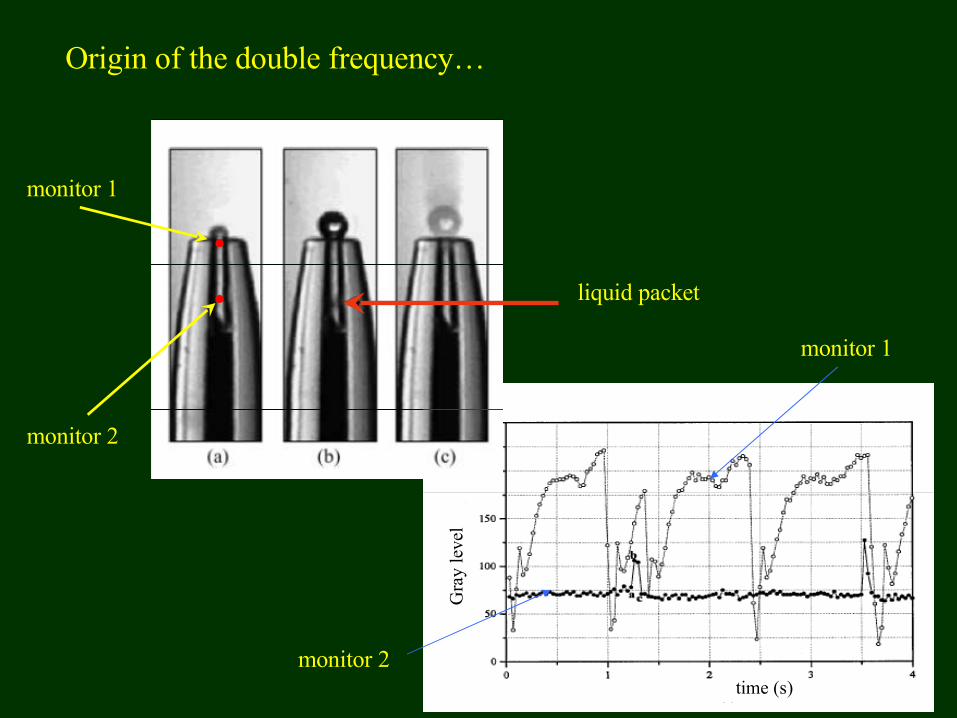
Origin of the double frequency…
liquid packet
monitor 1
monitor 2
monitor 1
monitor 2
Gra
y le
vel
time (s)

…but liquid packet and natural bubble departure sometimes coincide
liquid package
Velocity of the liquid packet inside the capillary
~32 mm/s
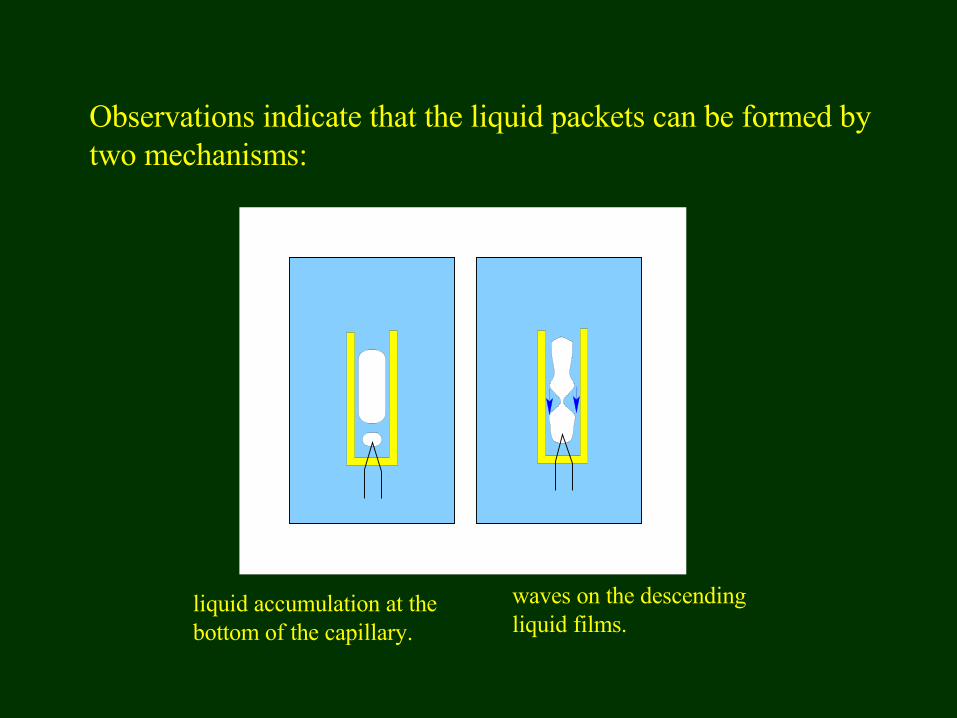
Observations indicate that the liquid packets can be formed by two mechanisms:
liquid accumulation at the bottom of the capillary.
waves on the descending liquid films.

Power spectrum
* 1000 bubbles, 160 packages.
Single bubbles (~5.5 Hz) Short period events (~12 Hz)
|M|
f (Hz)
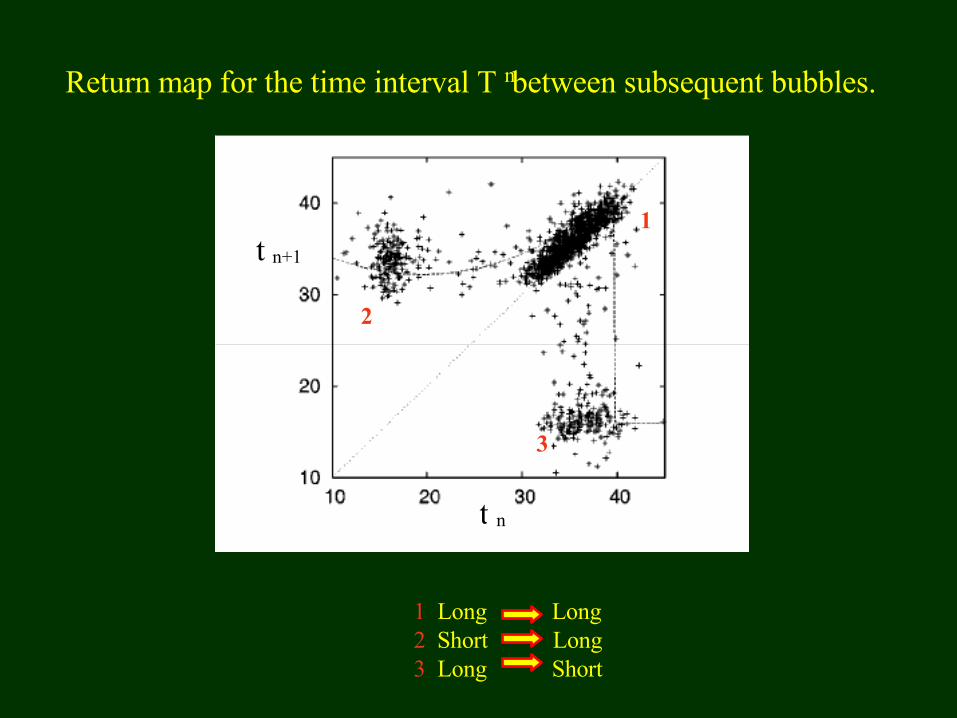
Return map for the time interval T between subsequent bubbles.
1
2
3
1 Long Long2 Short Long3 Long Short
n
t
t
n
n+1
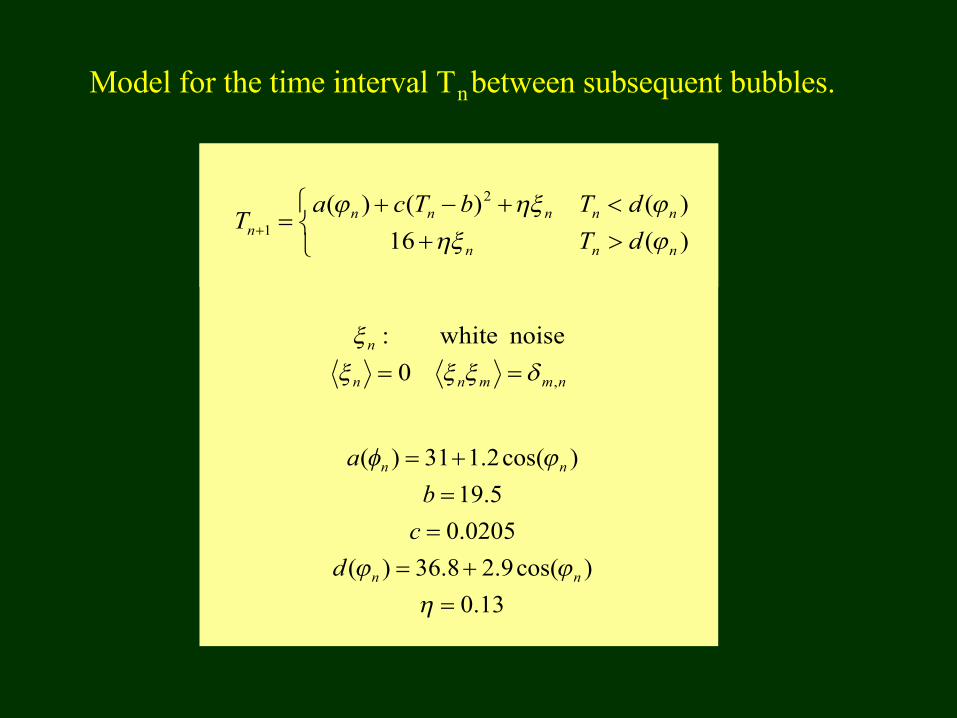
Model for the time interval T between subsequent bubbles.
)(16
)()()( 2
1
nnn
nnnnnn
dT
dTbTcaT
13.0
)cos(9.28.36)(
0205.0
5.19
)cos(2.131)(
nn
nn
d
c
b
a
nmmnn
n
,0
noise white:
n
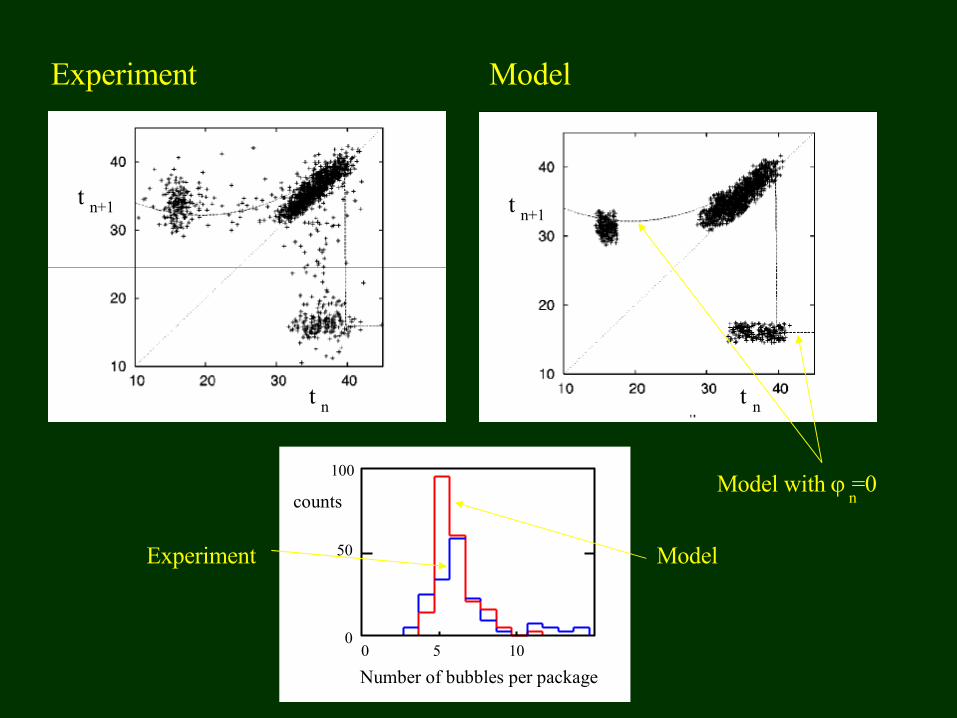
Experiment Model
t
t
t
t
n+1
Model with =0
n n
n+1
n
0 5 10
100
50
0
counts
Number of bubbles per package
Experiment Model
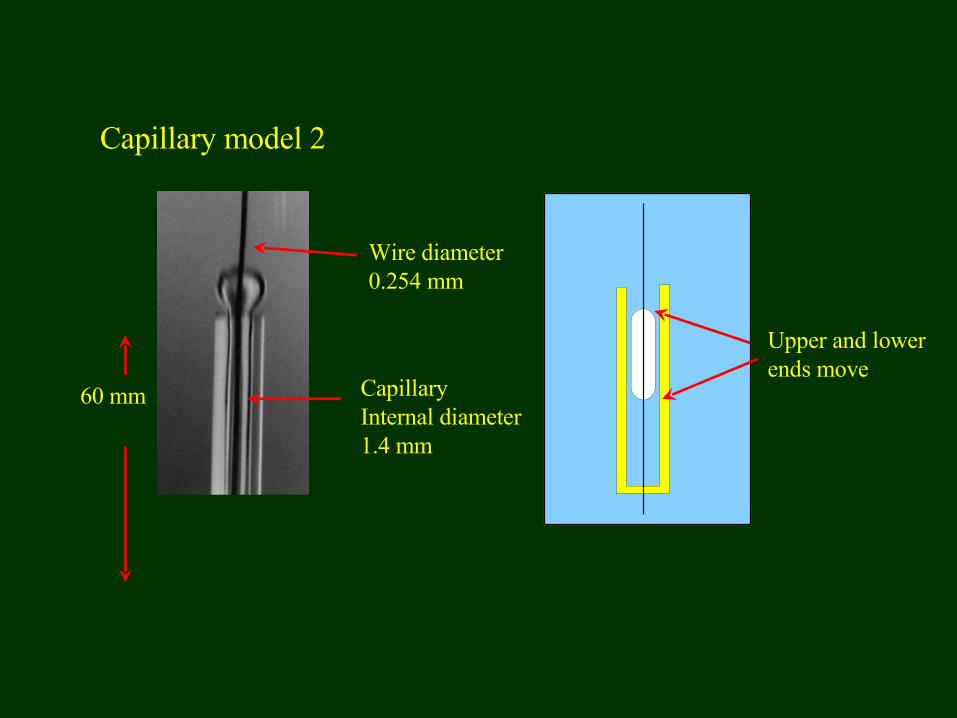
Capillary model 2
Wire diameter 0.254 mm
CapillaryInternal diameter 1.4 mm
60 mm
Upper and lower ends move

Observations with Model 2: Bubble transit at the tip of the capillary
Period doubling a) 15 W/m, b) 18 W/m, c) 22 W/m, d) 24 W/m
a) b)
c) d)
LLLLL
SLSLS LSSSL
The
rmoc
oupl
e ou
tput
(m
V)
time (s)
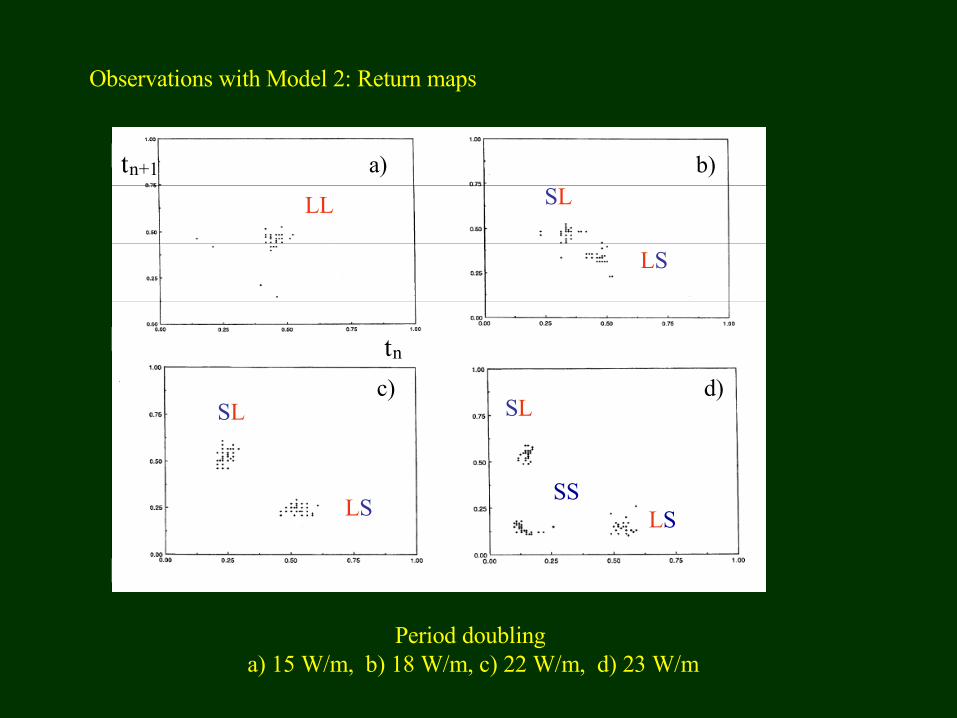
Observations with Model 2: Return maps
Period doubling a) 15 W/m, b) 18 W/m, c) 22 W/m, d) 23 W/m
a) b)
c) d)
LL
SL
LS
SL
LSSS
SL
LS
t
tn
n+1
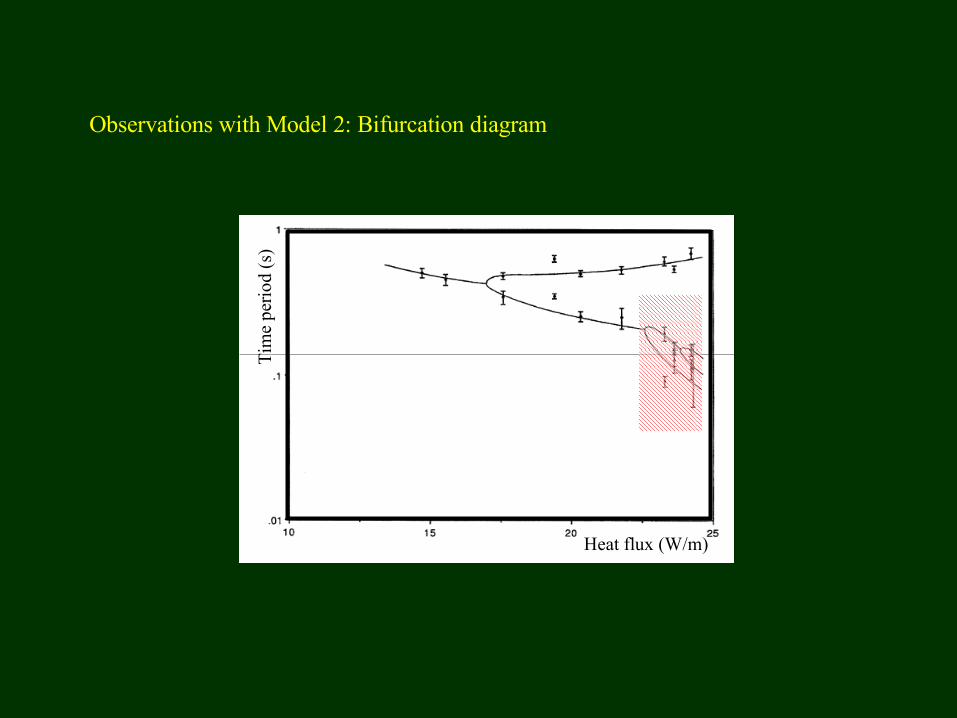
Observations with Model 2: Bifurcation diagram
Heat flux (W/m)
Tim
e pe
riod
(s)

Summary *We studied capillary boiling as a model of artificial nucleation.
* Bubble emission (and heat transfer) depend strongly on the geometry and on the dynamical interaction of liquid and vapor inside the capillary.
* Period doubling of bubble emissions has been observed for long capillaries.

2. Quasi 2D-vortices generated by the Lorentz force 2. Quasi 2D-vortices generated by the Lorentz force in an electrolytein an electrolyte

Electrolyte container
Working fluid: Sodium bicarbonate solutionFluid layer depth: 4 mm
Maximum magnetic field: 0.33 TMagnet diameter: 19 mm
Electrical current : Jo = 5-100 mA
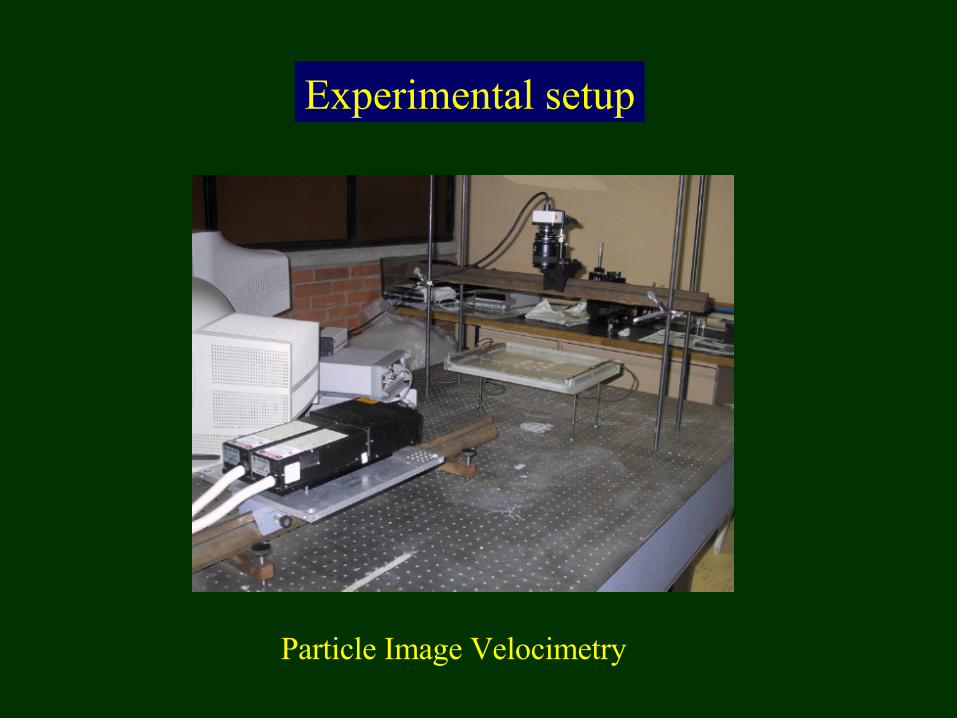
Experimental setup
Particle Image Velocimetry
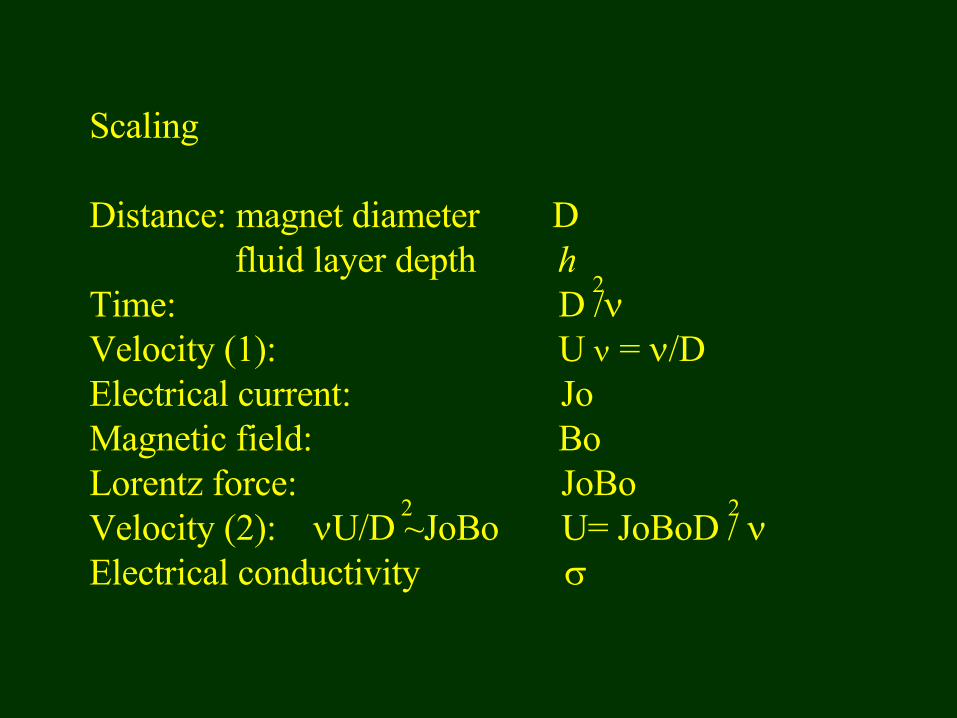
Scaling
Distance: magnet diameter D fluid layer depth hTime: D /Velocity (1): U = /D Electrical current: JoMagnetic field: BoLorentz force: JoBoVelocity (2): U/D ~JoBo U= JoBoD / Electrical conductivity
22
2

Nondimensional parameters
• Reynolds number
Re = UD/ =JoBoD / = U/U• Hartmann number
Ha =Bo D (/)1/2
• Depth of the fluid layerh = h/D
3

Re
0 15 304
Experimental observations.
Ha = 0.3h = 0.21
75

x
y
J Lorentz force o

x
y
4.5 cm
Velocity field, upper layer (z = 3.75 mm)
Jo =25 mA
Ha=0.3
Re=75

Stream lines Jo =25 mA, Re = 75, Ha =0.3
x
y

Velocity
vmax = 6.7 mm/s = 1.05 s-1
Vorticity
Jo =25 mA, Re = 75, Ha =0.3x
y
Composante vitesse v (I=25mA, h=3.5mm, y=y_yeux)
-0.008
-0.007
-0.006
-0.005
-0.004
-0.003
-0.002
-0.001
0
0.001
0.002
0.003
0 5 10 15 20 25 30 35 40 45
x ( mm)
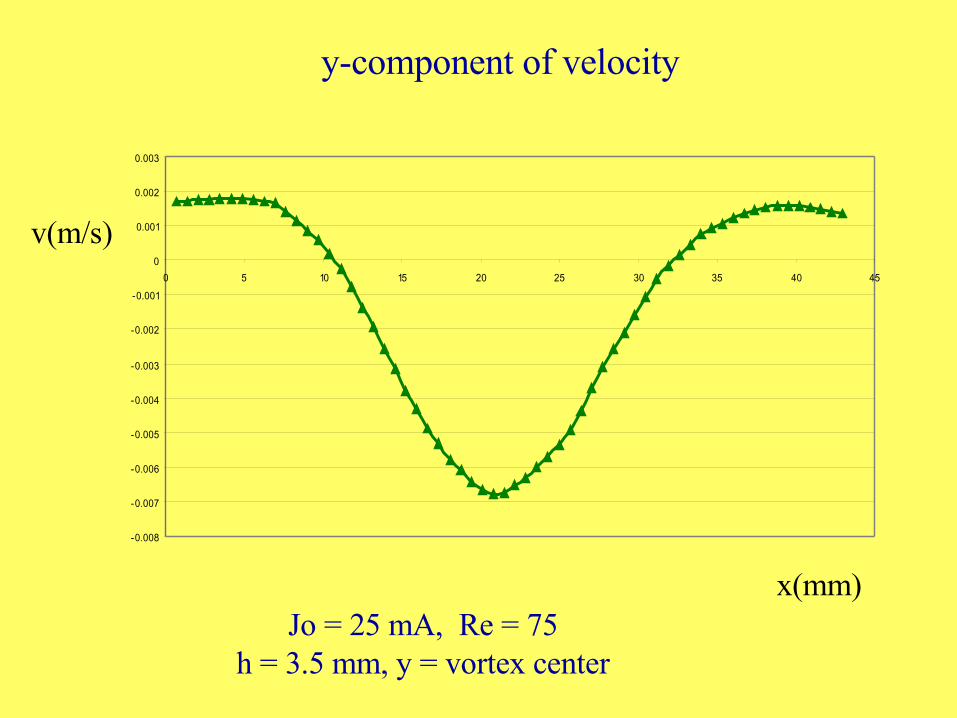
y-component of velocity
v(m/s)
x(mm)Jo = 25 mA, Re = 75
h = 3.5 mm, y = vortex center

Jo = 10 mA, Re=30, Ha=0.3 Jo =100 mA, Re= 304, Ha=0.3
Stream lines

Vitesse = f(I)
y = -8E-07x2 + 0.0002x + 0.0005
0
0.002
0.004
0.006
0.008
0.01
0.012
0.014
0.016
0.018
0 20 40 60 80 100 120
I (mA )
U (m/s)Polynomial (U (m/s))
Maximum velocity vs Jo
Jo (mA)
v(m/s)
15
304
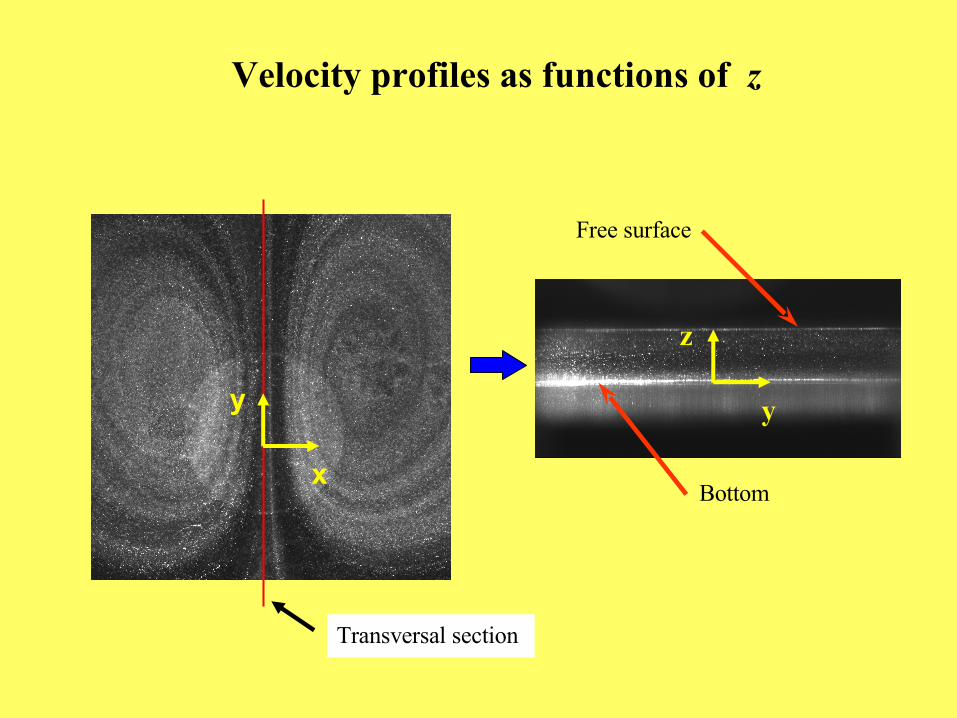
Transversal section
x
y
Velocity profiles as functions of z
y
z
Bottom
Free surface
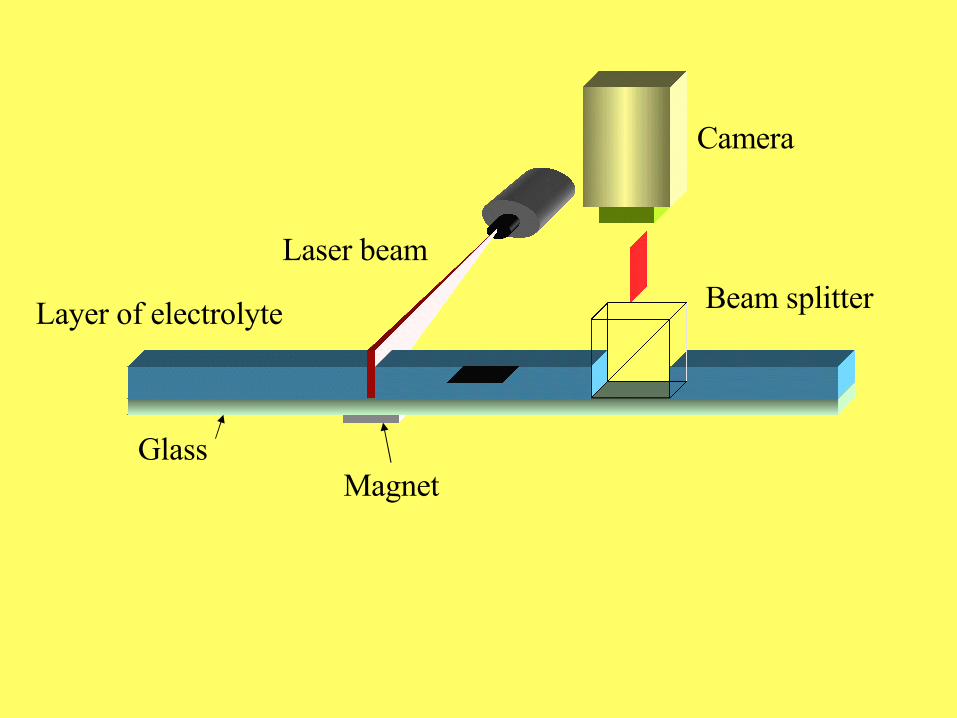
Laser beam
Camera
Beam splitterLayer of electrolyte
GlassMagnet
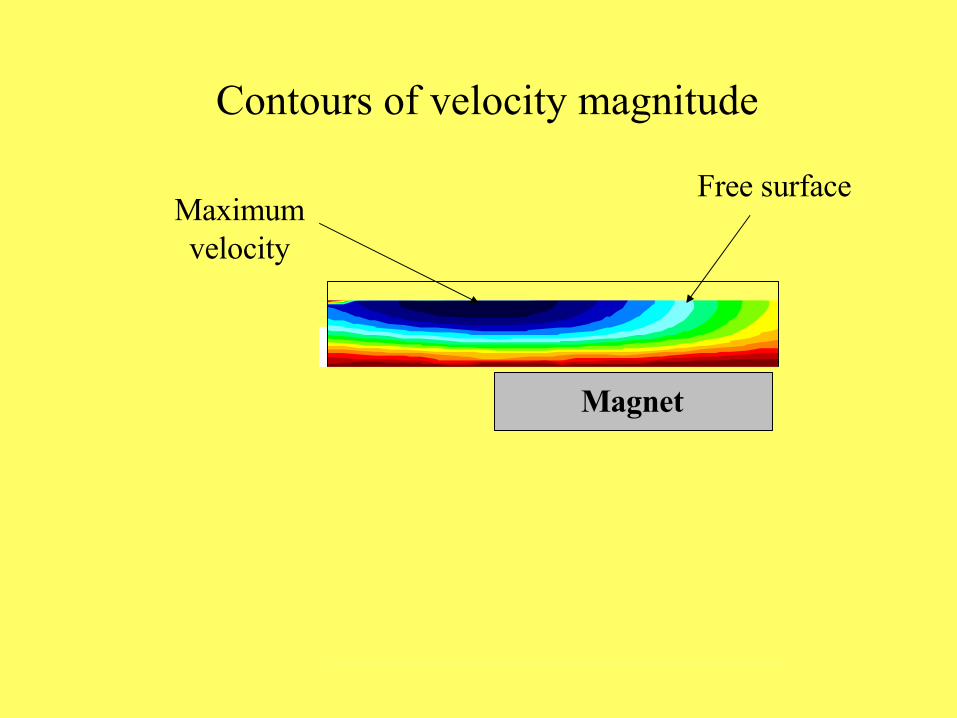
Free surface
Contours of velocity magnitude
Magnet
Maximum velocity
CC
D
Plan laser vertical
Bottom wall
MagnetMagnet

0
0.5
1
1.5
2
2.5
3
3.5
4
0 0.001 0.002 0.003 0.004 0.005 0.006U (m/s)
Centrey=10.1mmy=6.42mmy=3.67mm
Velocity profiles as functions of z
(Upstream of the center of the magnet)
Jo = 25 mA, Re = 75, h = 4mm
z (mm)
v (m/s)

0
0.5
1
1.5
2
2.5
3
3.5
4
4.5
0 0.001 0.002 0.003 0.004 0.005 0.006 0.007U (m/s)
Centrey=- 3.67mmy=- 7.43mmy=- 11.02mmy=- 16.52mm
Velocity profiles as functions of z
(Downstream of the center of the magnet)
Jo = 25 mA, Re = 75, h = 4mm
z (mm)
v (m/s)
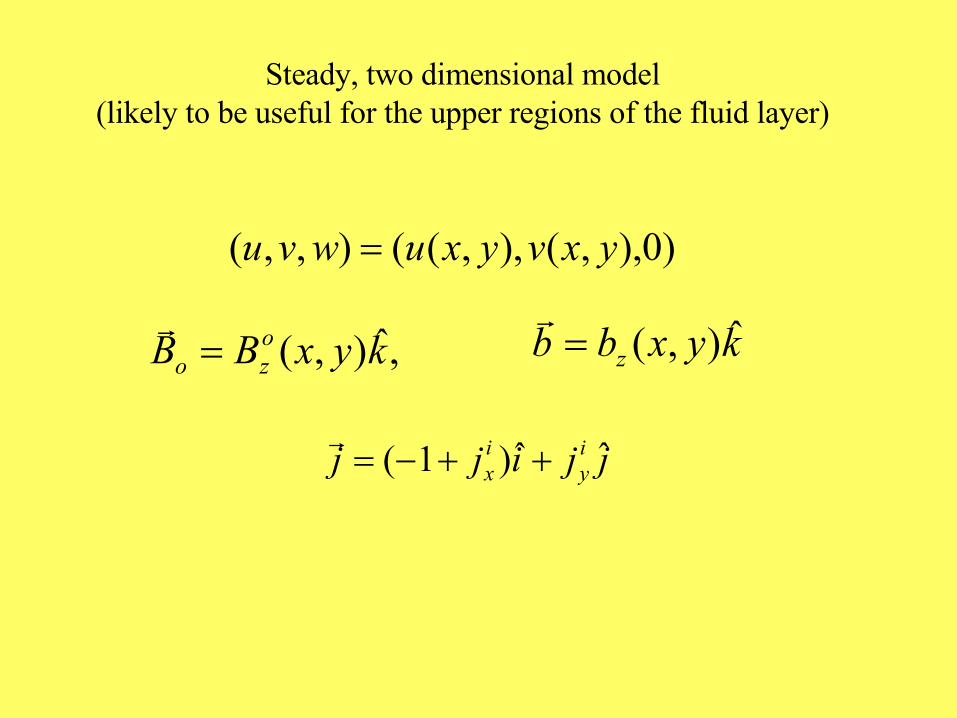
jjijj iy
ix
ˆˆ)1(
,ˆ),( kyxBB ozo
kyxbb zˆ),(
Steady, two dimensional model(likely to be useful for the upper regions of the fluid layer)
)0),,(),,((),,( yxvyxuwvu

Jo
BoUM
x
bMj
y
bMj z
yz
x
020 zz Bub
002 2Re zz Byb
HaBvyp
yv
vxv
utu z
022z
z Bxb
Hauxp
yu
vxu
utu
0
yv
xu
Governing equations, two dimensional model
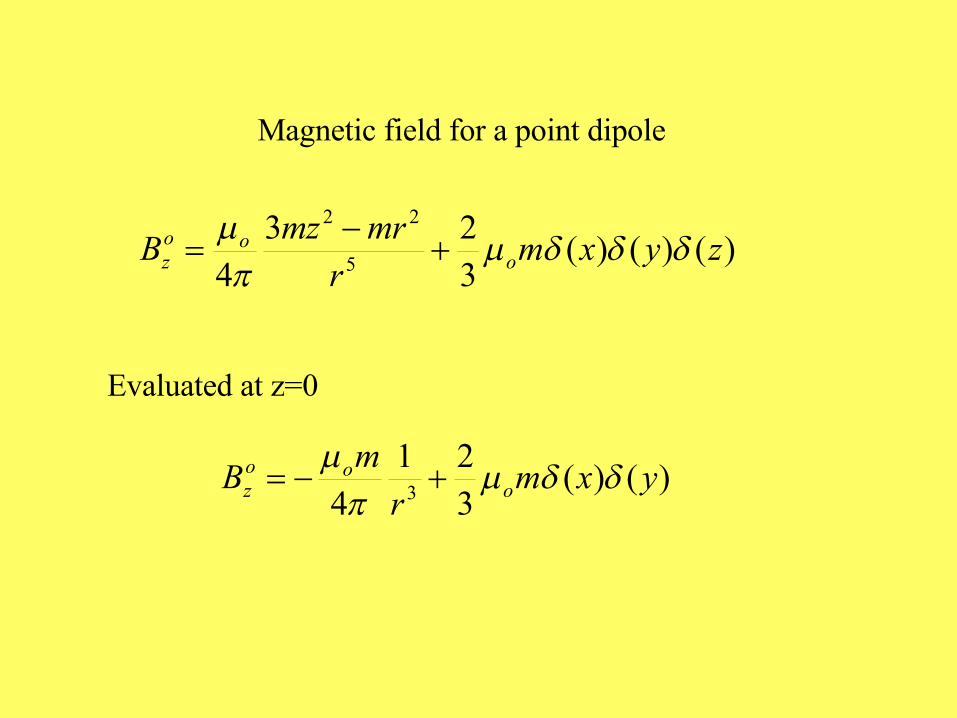
)()()(323
4 5
22
zyxmrmrmz
B ooo
z
Magnetic field for a point dipole
Evaluated at z=0
)()(321
4 3 yxmr
mB o
ooz

020 zz Bub
z 2
xB
yv
xu
tz
zzzz
02 Re
Vorticity equation
Stream function
Magnetic induction
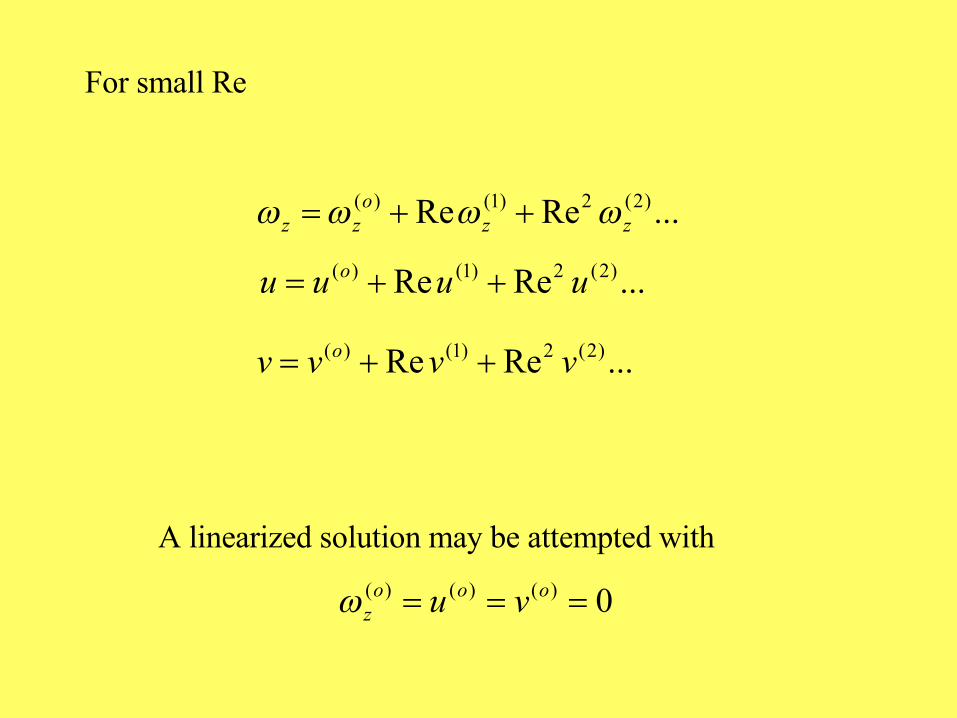
...ReRe )2(2)1()(zz
ozz
For small Re
...ReRe )2(2)1()( uuuu o
...ReRe )2(2)1()( vvvv o
A linearized solution may be attempted with
0)()()( oooz vu

)1()1(2z
xBz
z
02 )1(
Vorticity equation order Re
Stream function
The solution diverges for r=0 and r:
cosln)1( rr
similar to the Stokes paradox
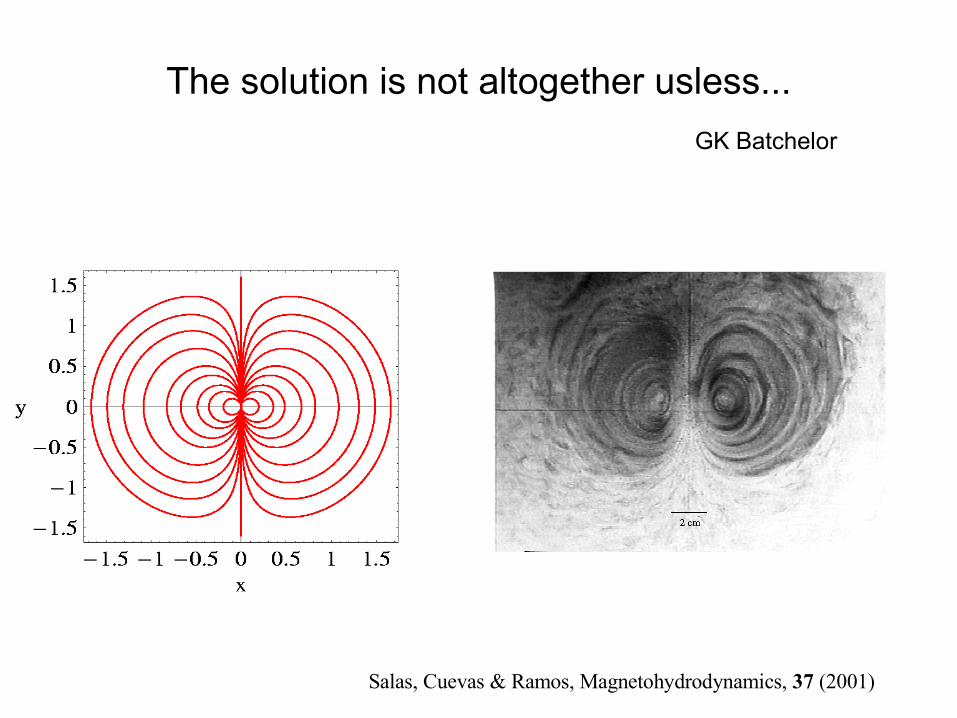
The solution is not altogether usless...
GK Batchelor
Salas, Cuevas & Ramos, Magnetohydrodynamics, 37 (2001)

Numerical solution is required
* Solution to the full system of equations, including induced and nonlinear terms
* Two dimensional physical model like the one
described before, but considering a finite size magnet
* Finite volume discretization method

Re=60, Ha=0.2 Re=300, Ha=0.2
Numerical resultsStream lines dipolar magnetic filed

Re= 30 (60), Ha=0.2
Comparison with experiments

Re=300, Ha=0.2
Comparison with experiments

Summary
*A class of electromagnetically driven flows in shallow fluid layers has been observed.
*For the experimental conditions examined, the influence of the bottom wall extends up to approximately 3 mm.
*A two dimensional model that includes nonlinear effects captures some features of the experimental observations.
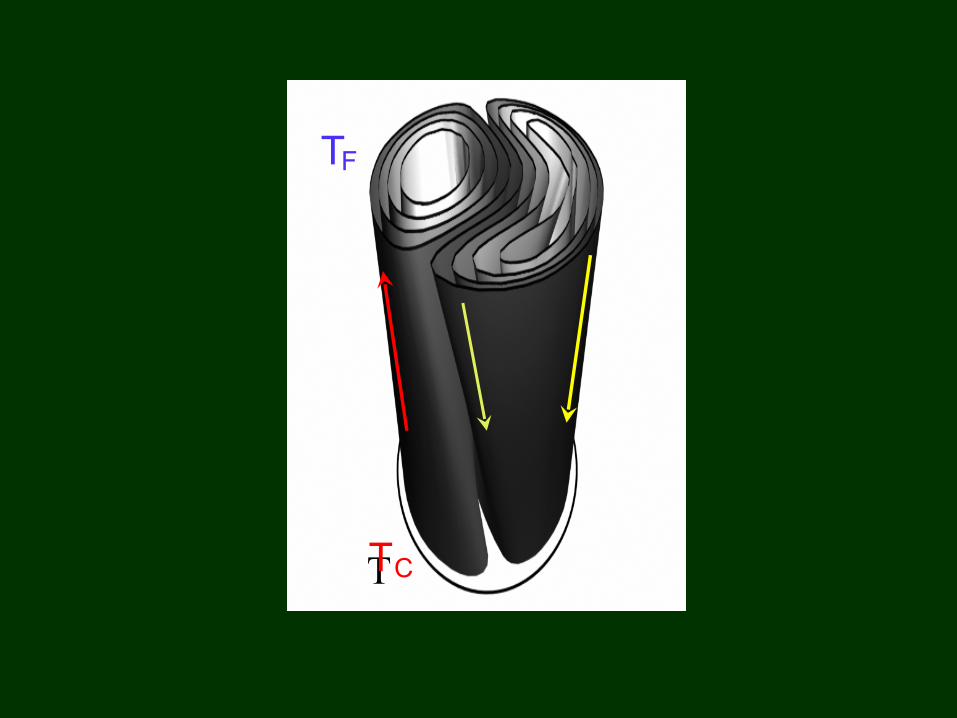
3. Natural convection in a centrifuge3. Natural convection in a centrifuge
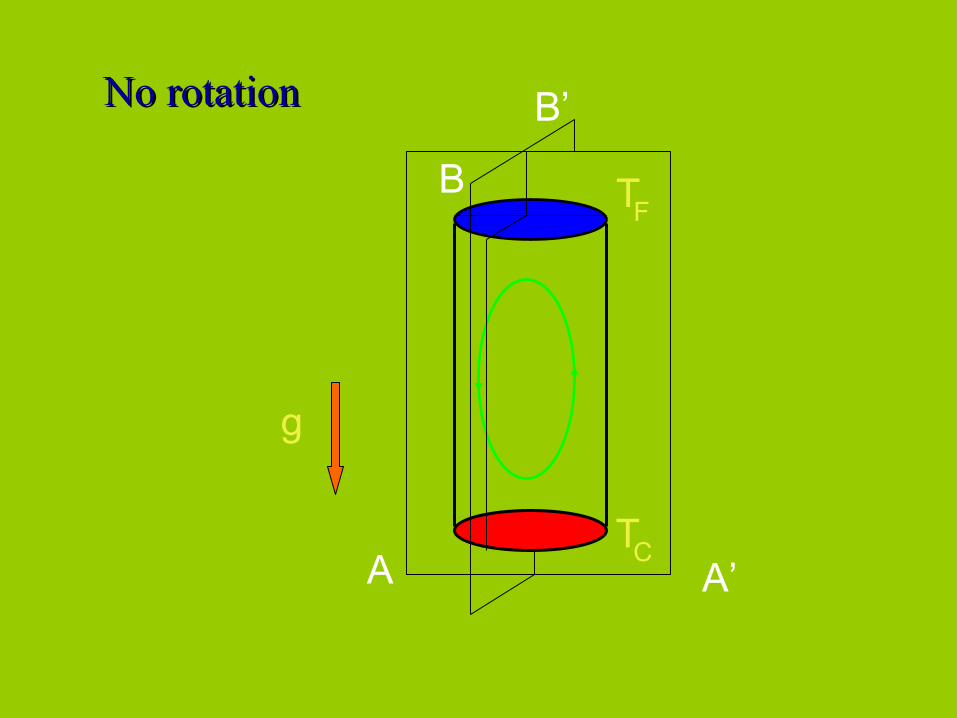
g
TF
TC
No rotationNo rotation
A A’
B
B’
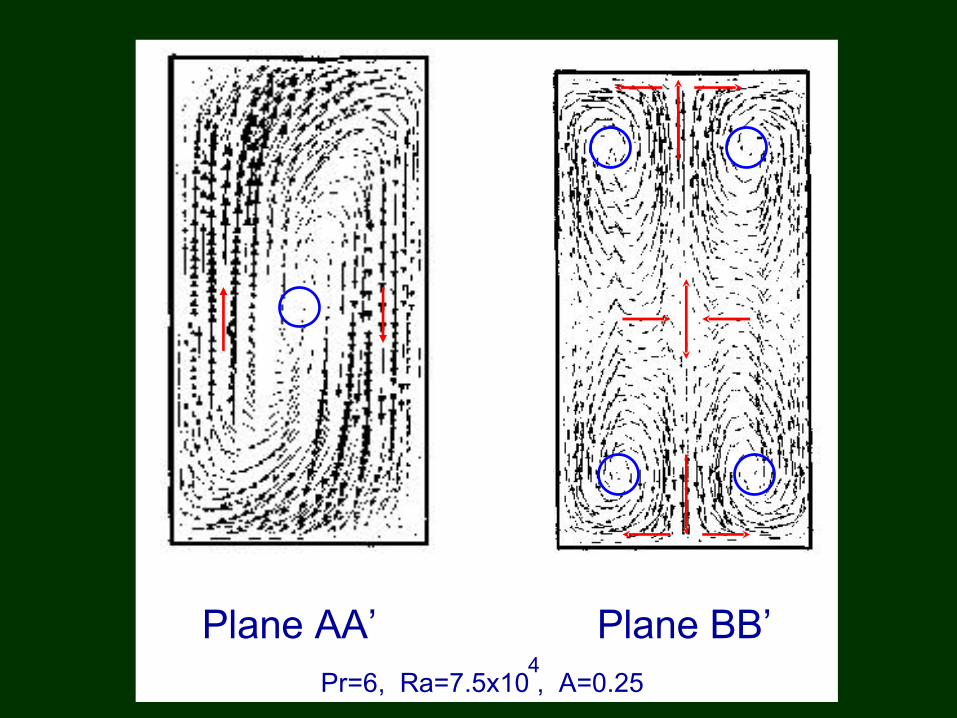
Plane AA’ Plane BB’Pr=6, Ra=7.5x10 , A=0.25
4
TCT
TF

Teórico, Ra~5x10
AA’
5Experimento, Ra=2.5x10
6

Teoría, Ra ~5x10 Experimento, Ra = 2.5 x 10
BB’
5 6
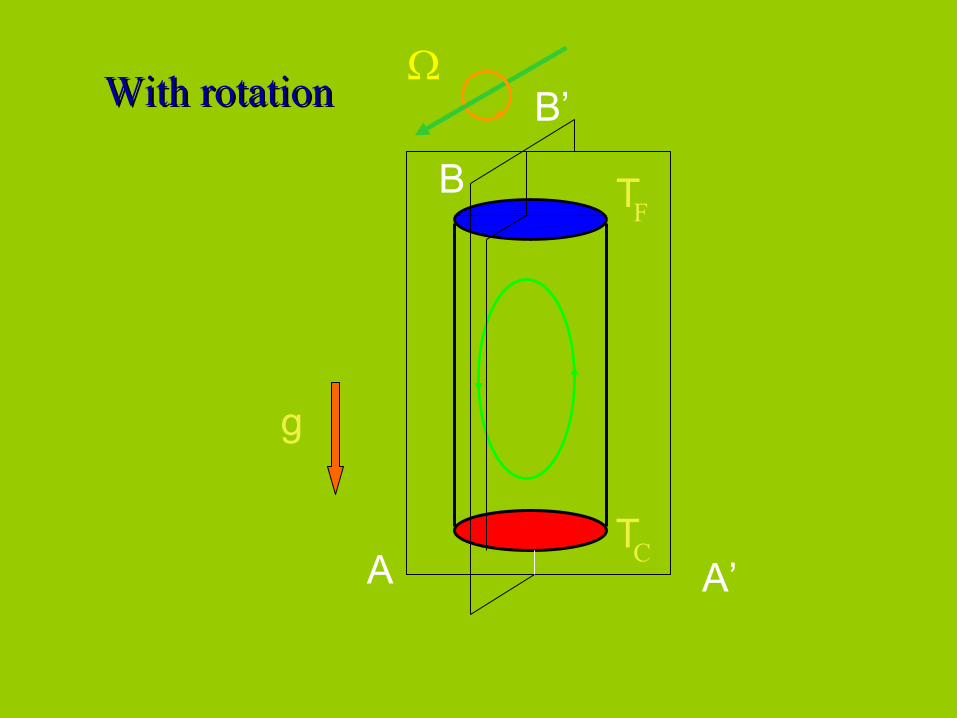
g
TF
TC
With rotationWith rotation
A A’
B
B’
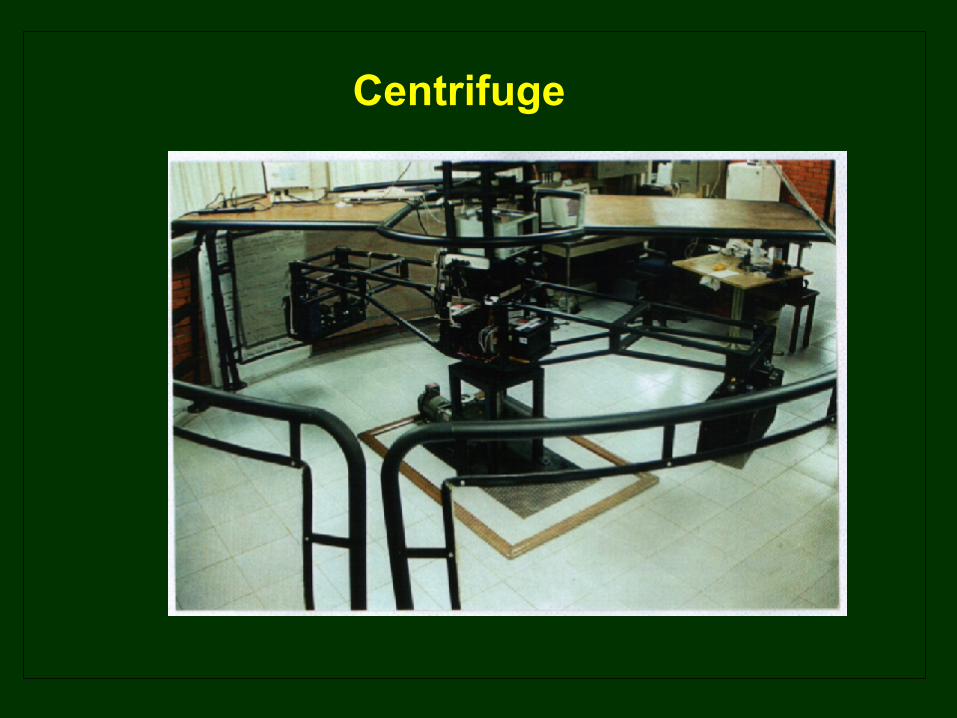
Centrifuge

Pr=6, A=0.28, Ra = 2.5 x 10, Ta = 1.7 x 10 764


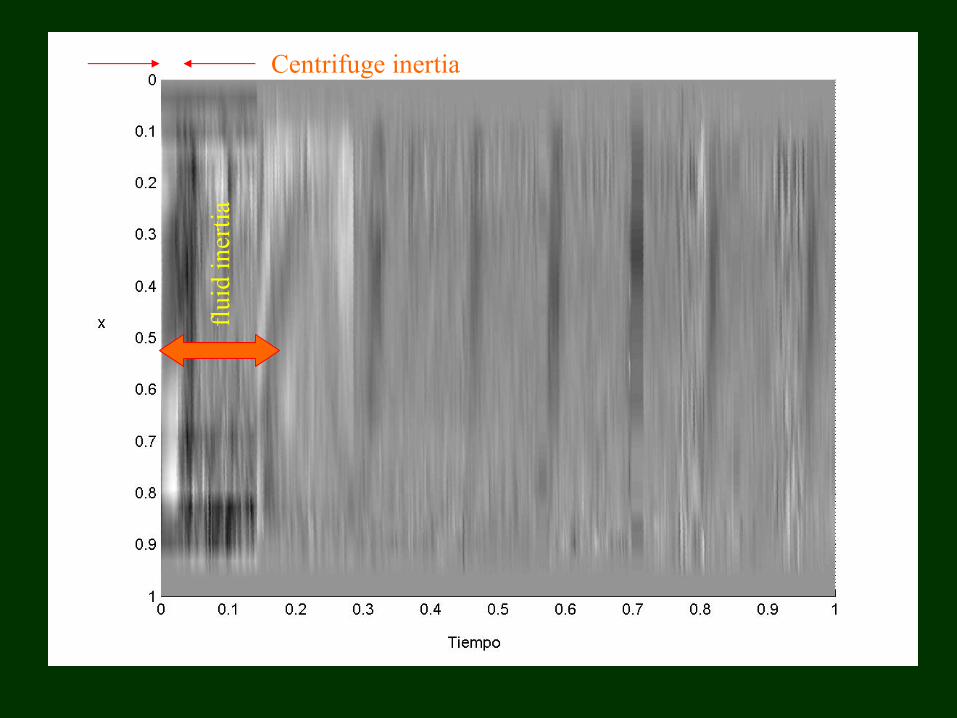
Centrifuge inertia
flu
id in
erti
a

Summary
* No Rotation* No Rotation: One single, no axisymmetric cell (AA’), four vortices (BB’)
* Rotation* Rotation: Time dependent flow, characteristic time 55 s.

The End