heat pump water heater durability testing – phase ii
TRANSCRIPT

ORNL/TM-2004/111
Heat Pump Water Heater Durability Testing – Phase II
May 2004 Prepared by Van D. Baxter R. L. Linkous

DOCUMENT AVAILABILITY
Reports produced after January 1, 1996, are generally available free via the U.S. Department of Energy (DOE) Information Bridge:
Web site: http://www.osti.gov/bridge Reports produced before January 1, 1996, may be purchased by members of the public from the following source:
National Technical Information Service 5285 Port Royal Road Springfield, VA 22161 Telephone: 703-605-6000 (1-800-553-6847) TDD: 703-487-4639 Fax: 703-605-6900 E-mail: [email protected] Web site: http://www.ntis.gov/support/ordernowabout.htm
Reports are available to DOE employees, DOE contractors, Energy Technology Data Exchange (ETDE) representatives, and International Nuclear Information System (INIS) representatives from the following source:
Office of Scientific and Technical Information P.O. Box 62 Oak Ridge, TN 37831 Telephone: 865-576-8401 Fax: 865-576-5728 E-mail: [email protected] Web site: http://www.osti.gov/contact.html
This report was prepared as an account of work sponsored by an agency of the United States Government. Neither the United States government nor any agency thereof, nor any of their employees, makes any warranty, express or implied, or assumes any legal liability or responsibility for the accuracy, completeness, or usefulness of any information, apparatus, product, or process disclosed, or represents that its use would not infringe privately owned rights. Reference herein to any specific commercial product, process, or service by trade name, trademark, manufacturer, or otherwise, does not necessarily constitute or imply its endorsement, recommendation, or favoring by the United States Government or any agency thereof. The views and opinions of authors expressed herein do not necessarily state or reflect those of the United States Government or any agency thereof.

Heat Pump Water Heater Durability Testing – Phase II
Van D. Baxter R. L. Linkous
May, 2004
Prepared by OAK RIDGE NATIONAL LABORATORY P.O. Box 2008 Oak Ridge, Tennessee 37831-6285 managed by UT-Battelle, LLC for the U.S. DEPARTMENT OF ENERGY under contract DE-AC05-00OR22725

ii
Table of Contents Table of Contents .......................................................................................................................... ii List of Figures............................................................................................................................... iii List of Tables ................................................................................................................................ iv Abstract...........................................................................................................................................v 1.0 Introduction..............................................................................................................................1 1.1. Integral HPWH description.......................................................................................................1 Control system ..........................................................................................................................7 Condensate management system (CMS) option .......................................................................8 1.2. Add-on HPWH description.......................................................................................................8 2.0 Test Plan Development ..........................................................................................................11 2.1. Expected ambient operating condition envelope ....................................................................12 2.2. Durability test protocol ...........................................................................................................13 3. The Test Facility......................................................................................................................19 3.1. Primary loop system ...............................................................................................................22 3.2. Secondary loop systems..........................................................................................................24 3.3. Data acquisition and control system .......................................................................................26 4. Test Results and Discussion ....................................................................................................27 4.1. System reliability discussion...................................................................................................29 Component failures..................................................................................................................29 Electrical noise problems ........................................................................................................29 Unit noise problems .................................................................................................................30 Miscellaneous unit quality issues.............................................................................................30 4.2. Unit performance ....................................................................................................................31 Performance characteristics over time .....................................................................................31 Low voltage impacts ................................................................................................................36 Unit efficiencies .......................................................................................................................36 Integral units .......................................................................................................................36 Add-on units........................................................................................................................41 Electric water heater mode efficiency......................................................................................44 Compressor efficiency .............................................................................................................45 4.3. Post-test compressor and HPWH tank examinations..............................................................46 Integral unit tank and condenser wrap examination ................................................................46 Integral unit compressor examination......................................................................................46 Integral unit CMS ....................................................................................................................47 Add-on units.............................................................................................................................48
iii
5. Observations and Recommendations.....................................................................................51 Acknowledgments ........................................................................................................................52 References.....................................................................................................................................53 Appendix A - Integral Heat Pump Water Heater Post Durability Test Examination .........54 List of Figures Figure 1.1 Photograph of the integral, “drop-in” type heat pump water heater (HPWH) unit
evaluated in this durability test phase. .......................................................................................2 Figure 1.2 Cutaway schematic view of the integral HPWH. ..........................................................3 Figure 1.3 New vs. old integral HPWH control board showing changes made in response to
previous durability test findings.................................................................................................6 Figure 1.4 Add-on HPWH package ................................................................................................9 Figure 1.5 Schematic of tank water fitting used with add-on HPWH units....................................9 Figure 2.1 Schematic of integral HPWH test setup showing data instrumentation locations and
control thermistor (T1-T4) locations .......................................................................................14 Figure 2.2 Schematic of add-on HPWH test setup showing data instrumentation locations and
control thermistor (T1 & T2) locations....................................................................................15 Figure 3.1 Overall view of HPWH durability test facility............................................................20 Figure 3.2 Installation of HPWHs inside environmental test chamber.........................................21 Figure 3.3 Schematic of HPWH test facility plumbing connections. ...........................................22 Figure 3.4 Photo of HPWH test facility chiller and primary water storage tank section..............23 Figure 3.5 Schematic of HPWH test facility chiller and primary water storage tank section. .....24 Figure 3.6 Schematic of secondary loop flow control module. ....................................................25 Figure 4.1 Representative cycling behaviors over 6-hour time period. Power consumption,
average tank water temperature, and secondary loop total flow vs. time shown. Cycling rate was approximately 32 cycles/d on average..............................................................................28
Figure 4.2 Add-on unit 1 end-of-cycle discharge, suction, and tank temperature history............31 Figure 4.3 Add-on unit 2 end-of-cycle discharge, suction, and tank temperature history............32 Figure 4.4 Add-on unit 3 end-of-cycle discharge, suction, and tank temperature history............32 Figure 4.5 Add-on unit 4 end-of-cycle discharge, suction, and tank temperature history............33 Figure 4.6 Add-on unit 5 end-of-cycle discharge, suction, and tank temperature history............33 Figure 4.7 Integral unit 6 end-of-cycle discharge, suction, and tank temperature history............34 Figure 4.8 Integral unit 7 end-of-cycle discharge, suction, and tank temperature history............34 Figure 4.9 Integral unit 8 end-of-cycle discharge, suction, and tank temperature history............35 Figure 4.10 Integral unit 9 end-of-cycle discharge, suction, and tank temperature history......... 35 Figure 4.11 Integral unit 10 end-of-cycle discharge, suction, and tank temperature history........36 Figure 4.12. Drain pan and CMS heater on integral unit 9 after durability test run. ...................48

iv
Figure 4.13 Add-on unit condenser surfaces after durability test run showing surface depositions. ..............................................................................................................................49
Figure 4.14 Cross-section of add-on unit condenser 1 at water exit point....................................49 Figure 4.15 Add-on unit compressor power wiring; typical of condition found on units 2-5 after
durability test. ..........................................................................................................................50 Figure A1 Integral HPWH tank with insulation removed showing condenser wrap....................54 Figure A2 Integral unit as received by EMI (typical of all four)..................................................55 Figure A3 View inside upper element access cover .....................................................................55 Figure A4 View inside power connection cover...........................................................................55 Figure A5 Condenser coil wrap at top braze point .......................................................................56 Figure A6 Condenser coil wrap at bottom braze point .................................................................56 Figure A7 Typical sample of foam insulation around condenser .................................................56 Figure A8 Foam insulation around the top of the condenser coil .................................................56 Figure A9 Condition of anode rod and cold water inlet dip tube .................................................57 Figure A10 Tank interior – condition at end of test..................................................................... 57 Figure A11 Condenser wrap and heat transfer compound............................................................57 Figure A12. Glass lining opposite condenser braze point inside tank .........................................58 Figure A13 Non-CMS condensate pan condition .........................................................................58 Figure A14 Condensate pan from CMS unit ................................................................................58 List of Tables Table 1.1. Estimated life expectancies for residential water heaters (WH) for 1998-2002
(source: Appliance Magazine). .................................................................................................1 Table 2.1. Average weekly compressor duty cycles for three field-test HPWHs compared to
weekly hot water demand (Murphy 2002)...............................................................................11 Table 2.2. Design ambient air conditions for the HPWH. ............................................................13 Table 2.3. HPWH test unit data inputs..........................................................................................16 Table 2.4. Operating conditions for each stage of durability test protocol. ..................................17 Table 4.1. Total cycles and approximate operating hours accumulated by each unit during
durability test. ..........................................................................................................................27 Table 4.2. HPWH component failure summary............................................................................29 Table 4.3. Add-on HPWH thermostat set point required for 140-150 °F average tank water
temperature at shutoff. .............................................................................................................31 Table 4.4. Integral HPWH Energy Factor test results..................................................................38 Table 4.5. Steady-state Performance of EMI HPWHs.................................................................40 Table 4.6. Add-on HPWH Energy Factor test results. .................................................................42 Table 4.7. Steady-state Performance of Add-on HPWHs............................................................43 Table 4.8. Energy Factor test results for all tanks in EWH mode................................................45 Table 4.9. Integral HPWH compressor calorimeter test results (130 ºF saturated condensing
temperature; 45 ºF saturated evaporating temperature; 220 Volts, 60 Hz power supply). ......45 Table 4.10. Integral unit compressor posttest component wear evaluation (Doering, 2004) (wear codes: L-slight; 1-mild; 2-moderate; 3-severe). ..................................................................47

v
Heat Pump Water Heater Durability Testing – Phase II Abstract Ten heat pump water heaters (HPWH) were placed in an environmentally controlled test facility and run through a durability test program of approximately 7300 duty cycles (actual cycles accumulated ranged from 6640 to 8324 for the ten units). Five of the units were upgraded integral types (HPWH mounted on storage tank, no pump) from the same manufacturer as those tested in our first durability program in 2001 (Baxter and Linkous, 2002). The other five were “add-on” type units (HPWH with circulation pump plumbed to a separate storage tank) from another manufacturer. This durability test was designed to represent approximately 7-10 years of normal operation to meet the hot water needs of a residence. The integral units operated without incident apart from two control board failures. Both of these were caused by inadvertent exposure to very hot and humid (>135 °F dry bulb and >120 °F dew point) conditions that occurred due to a test loop failure. It is not likely that any residential water heater would be installed where such conditions were expected so these failures are not considered a long-term reliability concern. Two of the integral HPWHs featured a condensate management system (CMS) option that effectively eliminated any need for an evaporator condensate drain, but imposed significant efficiency penalties when operating in high humidity ambient conditions. The add-on units experienced no operational failures (breakdowns with loss of hot water production) during the course of the testing. However, their control systems exhibited some performance degradation under the high temperature, high humidity test conditions – HPWHs would shut off with tank water temperatures 15-20 °F lower than when operating under moderate ambient conditions. One unit developed a refrigerant leak during the test program and lost about 50% of its charge resulting in reduced efficiency. Efficiency measurements on all the integral units and four of the add-on units showed significantly higher efficiencies than conventional electric water heaters (EWH). DOE Simulated Use Tests conducted prior to starting the durability testing resulted in energy factors (EF) of about 2.3 for the integral design and 1.4 for the add-on design compared to the minimum value of 0.86 prescribed for EWHs. Based on the experience from this and the previous durability testing, there is no evidence that strongly suggests that any of the HPWHs suffered significant performance degradation after undergoing over 7000 water heat cycles.

1
Heat Pump Water Heater Durability Testing – Phase II 1. Introduction Reliability is defined as the probability that any product will function without failure under given conditions for a given period of time. In the case of a heat pump water heater (HPWH) or any water heater, the function is the delivery of hot water without falloff in efficiency and without component failure. To define the “given period of time” we examined the lifetime of a typical electric resistance water heater (EWH). Table 1.1 gives estimates reported by Appliance Magazine for 1998-2002 of the time period that the “initial purchaser” of a conventional residential EWH or gas water heater (GWH) would retain the appliance. This “initial” life estimate ranged from 6 to 21 years with an approximate average of 11 years for EWHs. For GWHs, the range was 5 to 14 years with an average of about 9 years. This suggests that customer’ expectations for the average lifetime of any “drop-in” HPWH that replaces a conventional water heater would be no less than 7 years and probably more in the range of 10-12 years. Therefore we determined to conduct accelerated life, or durability, testing to simulate the equivalent of 10 years of use as representative of life expectancy requirements for a HPWH. Table 1.1. Estimated life expectancies for residential water heaters (WH) for 1998-2002
(source: Appliance Magazine)
Electric WHs Gas WHs Year Minimum Maximum Average Minimum Maximum Average
1998a 7 18 13 6 13 10 1999b 6 21 14 5 13 9 2000c 7 15 11 7 10 9 2001d 6 15 11 5 14 8 2002e 6 15 11 5 14 9
a(Appliance Magazine, 1999); b(Appliance Magazine, 2000); c(Appliance Magazine, 2001); d(Appliance Magazine, 2002); e(Appliance Magazine, 2003)
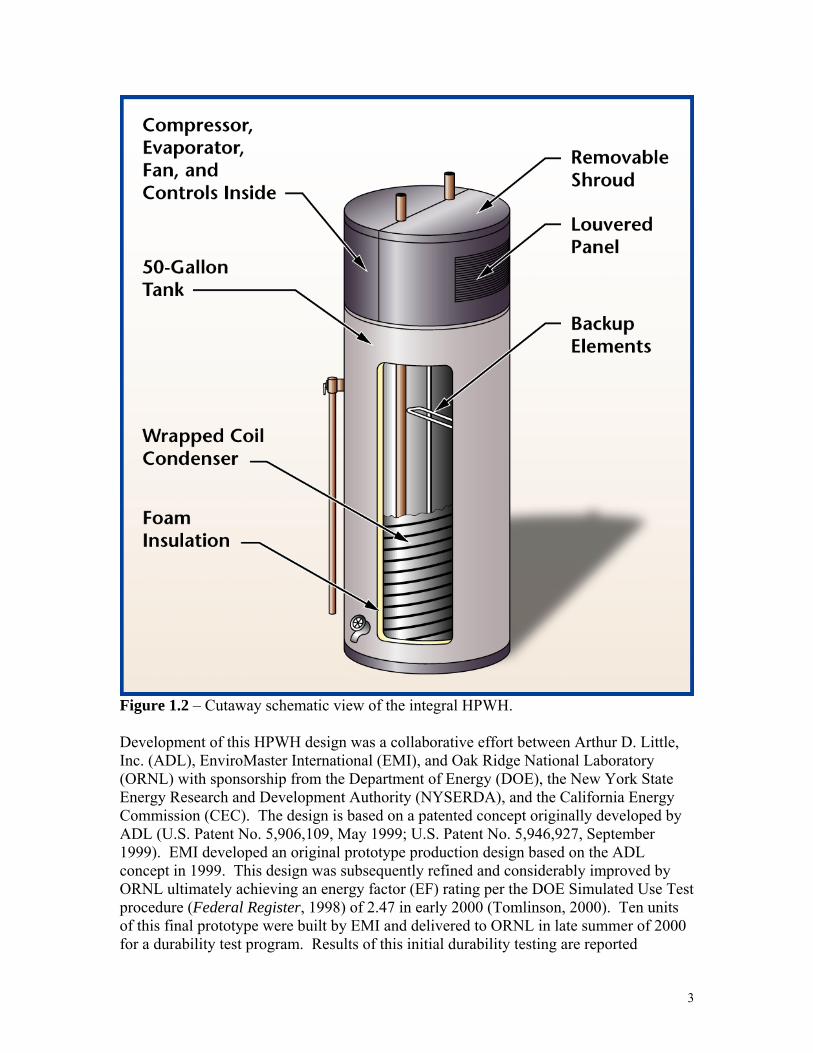
Ten HPWHs were placed in an environmentally controlled test facility and run through a durability test program of approximately 7300 duty cycles. Five of the units were upgraded integral types (HPWH mounted on storage tank, no pump) from the same manufacturer as those tested in our first durability program in 2001 (Baxter and Linkous, 2002). The other five were “add-on” type units (HPWH with circulation pump plumbed to separate storage tank) from another manufacturer. 1.1. Integral HPWH description The integral HPWH examined in this study was intended to be a “drop-in” replacement for conventional EWHs. It is pictured in Figure 1.1 and is shown in schematic cut away view in Figure 1.2. As used in this report, “drop-in” means that the HPWH can be installed virtually anywhere an EWH can be installed utilizing essentially the same installation procedures. It is likely that most HPWH installations will require slightly

2
more time to install than an EWH because of the requirement to provide for drainage of condensate from the HPWH evaporator.
Figure 1.1 – Photograph of the integral, “drop-in” type heat pump water heater (HPWH) unit evaluated in this durability test phase.
3
Figure 1.2 – Cutaway schematic view of the integral HPWH. Development of this HPWH design was a collaborative effort between Arthur D. Little, Inc. (ADL), EnviroMaster International (EMI), and Oak Ridge National Laboratory (ORNL) with sponsorship from the Department of Energy (DOE), the New York State Energy Research and Development Authority (NYSERDA), and the California Energy Commission (CEC). The design is based on a patented concept originally developed by ADL (U.S. Patent No. 5,906,109, May 1999; U.S. Patent No. 5,946,927, September 1999). EMI developed an original prototype production design based on the ADL concept in 1999. This design was subsequently refined and considerably improved by ORNL ultimately achieving an energy factor (EF) rating per the DOE Simulated Use Test procedure (Federal Register, 1998) of 2.47 in early 2000 (Tomlinson, 2000). Ten units of this final prototype were built by EMI and delivered to ORNL in late summer of 2000 for a durability test program. Results of this initial durability testing are reported

4
completely by Baxter and Linkous (2002) and are summarized below. At the same time, another eighteen units were built and sent to ORNL for a DOE national field test program. The field test results are described by Murphy and Tomlinson (2002). Based on the operational experience and test results from the initial 9-½ month durability test of the integral units, the following observations and recommendations were noted.
1. The basic heat pump system hardware seemed very robust. During the entire durability run (and the 3-month pre-test check out period prior to the durability testing) no compressor, fan, or power-switching relay failures were experienced.
2. The units’ efficiency as compared to an EWH baseline was very good. Energy factors (EF) measured under operating conditions approximately those specified by the standard DOE test were about 2x those of conventional electric WHs (1.8 – 2.1 vs. 0.86). EFs of the durability units were also comparable to the average efficiencies experienced by field test units in 16 actual residential applications scattered throughout the US (Murphy and Tomlinson, 2002).
3. Efficiency of durability test HPWHs did not appear to have degraded significantly as a result of undergoing over 7000 repetitive duty cycles.
4. Post-test examination of the test HPWH condenser wrap noted no apparent degradation in the condenser/tank attachment (no sign that condensers had separated from the tank wall). Eight of the ten compressors were torn apart by the compressor manufacturer to check for wear. One component, the crank pin bushing, exhibited a consistent wear pattern in each compressor. In some cases the wear was severe enough to degrade the steam-hardened surface layer of the bushing. Because the sample size was small, and every compressor was affected the same way, the compressor maker was reluctant to give a "passing grade" to the application. [Authors’ comment – We note here that in the first durability test only the heat pump portion of the HPWHs (compressor, evaporator, condenser, fans, & controls) was evaluated. The tank electric elements were bypassed. The unit (#3) that experienced the most severe bushing wear also experienced much higher compressor discharge temperatures than would have occurred had the elements been active and its control system worked properly.]
5. The first generation control system included on the integral HPWHs experienced many problems.
● Sixteen temperature input sensors (thermistors) failed. Since there were four thermistors for each HPWH, this represents a 40% failure rate. All of these failures were related to either a short circuit or open circuit in the spliced connections in the thermistor lead wires of the original design. ● One unit (#3) experienced failures of two control boards. Its discharge temperature sensor also failed which resulted in the compressor reaching discharge temperatures in excess of 250 °F (more than 30 °F higher than the control program normally allows and some 10 °F higher than the compressor manufacturer recommends with R-134a refrigerant).

5
● A number of the units were found to have thermostats (variable resistance potentiometers) that were not secured properly when delivered. ● During pre-test checkout, severe problems were discovered with fluctuating, noisy, electric signal inputs from the temperature sensors and the thermostats. Much of this was determined to be due to 60 Hz noise, which was eliminated by grounding the boards to the HPWH frame. However, random noise spikes continued to occur throughout the check out period and the durability run. The primary cause of these random spikes was felt to be that the control (low voltage) wires were bundled together with the power (high voltage) wires in the durability test units. This problem was exacerbated in the first generation control software by the fact that the program made control decisions based on only single readings of the control inputs. A single errant input could therefore cause an anomalous control action to occur.
The field test units experienced many of these same problems as well (Murphy and Tomlinson, 2002), and all were communicated to the HPWH manufacturer. As a result of the durability and field-testing experience a number of fixes were developed and implemented for the ultimate production units. These include the following.
● The thermistor sensors were upgraded to a more rugged (heavier) model with heavier gauge lead wires, and splices eliminated from the sensor leads. ● Sensor cables were rerouted away from the high voltage power wiring. ● A new control board design was implemented, primarily to reduce manufacturing costs, but also to incorporate features to improve its reliability and to reduce susceptibility to random noise. ● The control program was revised to sample the thermistor and thermostat inputs about 32 times and make control decisions based on the average value. This helps to offset the impact of a single aberrant reading. ● A more vigorous factory quality assurance (QA) program has been implemented to eliminate or minimize occurrences such as unsecured thermostats, control boards, and similar items.
Figure 1.3 illustrates changes that the manufacturer has made to the integral HPWH control board as noted above.

6
Figure 1.3 – New vs. old integral HPWH control board showing changes made in response to previous durability test findings.
7
Control system. The integral HPWH control system is a solid-state, microprocessor based control system based on a design that was originally developed by ADL under CEC sponsorship. Its operation and logic were described in detail in the previous report (Baxter and Linkous, 2002). Its operation is briefly summarized here primarily to describe when the tank electric elements are used since these elements were operational in this durability test. Operation of the optional condensate management system (CMS) is also summarized because two of the durability test units included this option.
The control system is powered from the same 230 V, 60 Hz, single-phase source as the HPWH. The controller does not permit the upper element and lower element to energize simultaneously. It also prevents the compressor and the CMS condensate re-evaporation heater from energizing when either electric element is energized. The software embedded in the microprocessor provides control of the HPWH. Three indicator lights (LEDs) provide a visual indication of whether the compressor (yellow LED), upper element (green LED), or lower element (red LED) is operating. The control system is designed to maximize the use of the heat pump to promote maximum water heating efficiency. Any time the lower tank temperature falls below its set point the heat pump is activated (compressor and fans). Once the lower tank temperature has reached set point the compressor and fans will turn off (normal stop). Seven conditions will cause the control system to shut off the heat pump (compressor and fans) prematurely (before the lower tank set point is reached). 1. The evaporating temperature falls below 25ºF, at which point frost may begin
developing on evaporator coils. The lower electric element is energized to continue heating water. The heat pump will re-start once the evaporating temperature reaches 35°F if the lower element has not satisfied the thermostat.
2. The upper tank temperature falls too low. The upper element is energized to heat the upper portion of the tank. The heat pump restarts once the upper tank temperature reaches its set point.
3. The lower tank temperature has reached 140ºF, but the HPWH thermostat setting has not been reached. In order to limit the discharge pressure and temperature, the heat pump is shut off. The lower element is energized until the HPWH set point temperature is satisfied.
4. If the condensate management system (CMS) option is active and the CMS float switch indicates an overflow condition, the heat pump is shut off. The lower element is energized to heat the tank water. The heat pump will not be reactivated until the condensate in the evaporator drain pan is removed (see CMS description below).
5. The HPWH mode select switch is in the EWH position. The unit will operate as a conventional EWH until the switch position is changed.
6. Anytime the compressor discharge temperature is not between 100ºF and 220ºF following a 3-6 minute period after start-up the unit will be switched to operate in the

8
EWH mode. Very cold water entering the tank is the most likely cause of this situation (compressor failure is another). The lower element will energize to begin heating the bottom of the tank. After a short time delay the control system will attempt to restart the heat pump. This cycle will repeat until the tank water temperature is high enough to sustain heat pump operation (or until the lower set point is reached in event of compressor failure).
7. If the compressor discharge temperature exceeds 220 ºF the compressor will be shut off to avoid operation with excessive refrigerant temperatures. The lower element will be energized to continue heating the tank water. After a delay of 3-6 minutes, the compressor will be restarted if the lower set point has not yet been reached.
Depending upon the surrounding ambient conditions, the evaporator temperature could become excessively high – e.g., in a garage in Houston or Jacksonville, for instance. This could result in overloading the compressor. In order to prevent high evaporating temperatures, the control system employs the following sequence.
1. If the evaporating temperature exceeds 60ºF one of the two evaporator fans is turned off. Normally this will cause the evaporating temperature to drop. The fan will be turned on again once the evaporating temperature drops below 50ºF.
2. If the evaporating temperature continues to rise and exceeds 65ºF the second fan is also turned off. The second fan will be turned on again once the evaporating temperature drops below 55ºF.
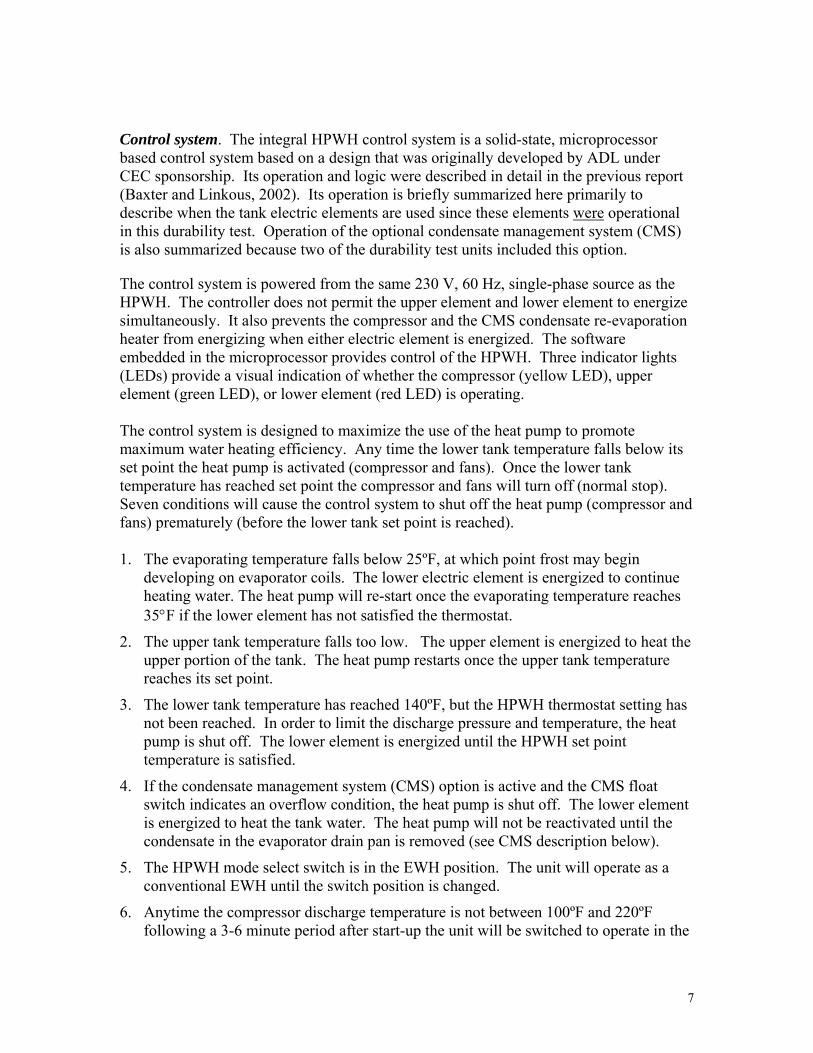
Condensate management system (CMS) option. The control system includes an optional provision to control the level of condensate in the heat pump evaporator drain pan. This option would allow the HPWH to be installed without requiring plumbing to an external drain to remove evaporator condensate. There are two condensate levels that the CMS responds to - a condensate present level and a condensate overflow level. When the CMS indicates there is condensate present (level switch 1 is closed), the control system will energize the CMS heater and one evaporator fan (unless either of the electric elements or the heat pump are on). The heater and fan will remain energized until switch 1 opens, indicating no more appreciable condensate. If the condensate reaches the overflow level (level switch 2 is closed), the compressor is turned off and the lower tank element is activated to finish heating the tank water to set point. Then the control system will energize the CMS heater and one fan. The heater and fan will remain energized until switch 1 opens, indicating that there is no longer any appreciable condensate. 1.2. Add-on HPWH description The add-on HPWH consisted of a relatively compact package (about 12.5 in. wide, 16.5 in. high, and 21 in. deep) containing the compressor, evaporator, evaporator fan, refrigerant-to-water condenser, a circulating pump, and a control unit (Figure 1.4). Water connections on the back of the package are piped to a storage EWH tank via a coaxial
9
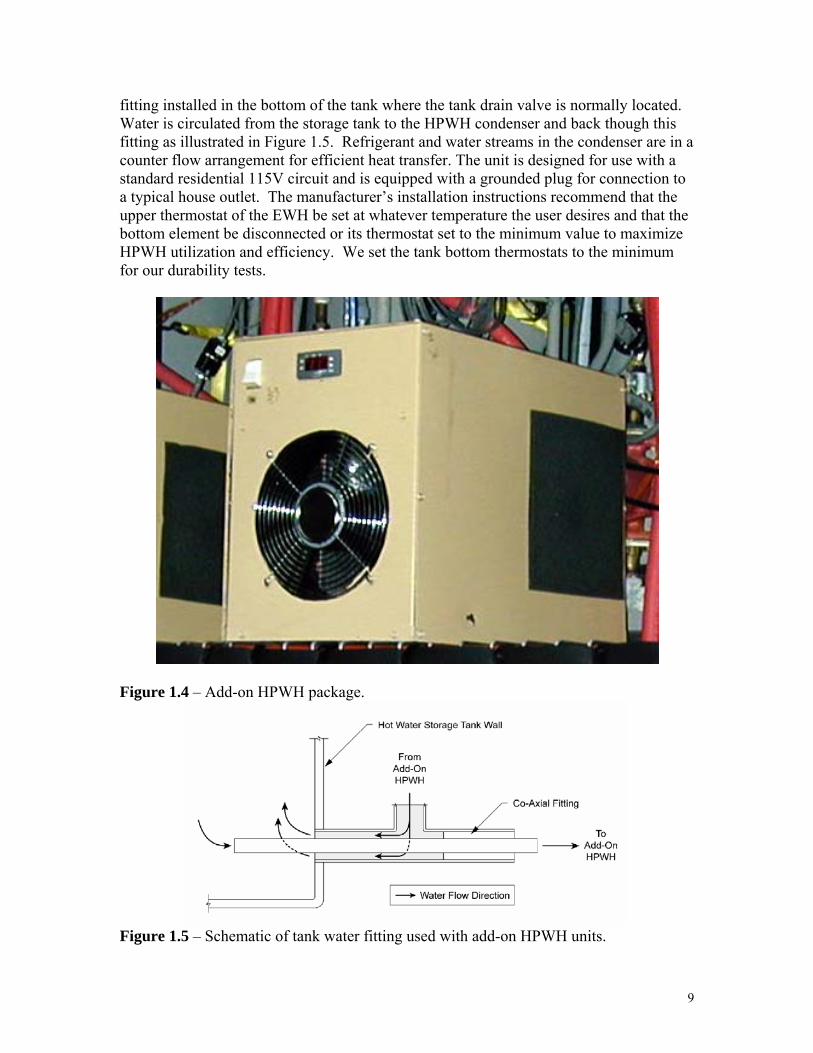
fitting installed in the bottom of the tank where the tank drain valve is normally located. Water is circulated from the storage tank to the HPWH condenser and back though this fitting as illustrated in Figure 1.5. Refrigerant and water streams in the condenser are in a counter flow arrangement for efficient heat transfer. The unit is designed for use with a standard residential 115V circuit and is equipped with a grounded plug for connection to a typical house outlet. The manufacturer’s installation instructions recommend that the upper thermostat of the EWH be set at whatever temperature the user desires and that the bottom element be disconnected or its thermostat set to the minimum value to maximize HPWH utilization and efficiency. We set the tank bottom thermostats to the minimum for our durability tests.
Figure 1.4 – Add-on HPWH package.
Figure 1.5 – Schematic of tank water fitting used with add-on HPWH units.

10
The add-on HPWH control system featured a user-programmable control unit, two temperature sensors (thermistors), and a compressor discharge pressure sensor. Thermistor T1 monitors the water temperature leaving the HPWH unit while thermistor T2 monitors the compressor suction line temperature. The control unit has a digital display and keys to allow the user to adjust water temperature set point and unit operating parameters. Tank water temperature is sensed by operating the pump for a brief period to circulate water from the tank through the HPWH unit. If sensor T1 indicates the water temperature is below the set point by a small differential amount (DIF), the compressor and fan are activated and the HPWH runs until T1 indicates set point has been reached. The DIF parameter basically provides a dead band range around the set point to prevent compressor short cycling during standby periods. For example, if DIF is 2 °F, the HPWH will cycle on when tank water temperature is 2 °F below the set point and continue to run until the tank water temperature is 2 °F above the set point. The set point, differential temperature DIF, time between pump sample rums (t-off), and pump sample run time (t-on) can all be adjusted by the user. Default values are 2 °F for DIF, 15 minutes for t-off, and 1 minute for t-on. Since the HPWH (115V) and the EWH (230V) are not connected to the same electric power circuit both can run at the same time in the event of extra heavy water demands. The control system also includes some system protection functions. In the event that the compressor suction temperature drops below 40 °F, the controls will shut the unit off and run the fan to melt any frost accumulation. The fan defrost runtime (DFT) is user adjustable with a factory default value of 10 minutes. In the event that the compressor discharge pressure becomes excessive, the controls will shut the compressor off for a few minutes to prevent compressor damage. Neither the discharge pressure set point nor the delay time is user adjustable. There is no independent high discharge temperature detection/protection system included in the HPWH control unit. An internal temperature switch included with the compressor provides high temperature protection. This switch will interrupt compressor operation for several minutes if temperatures become excessive.

11
2. Test Plan Development A key measure of reliability is the ability of the system to survive accelerated life tests that compress a number of real world cycles into a manageable time period for laboratory testing. Prior testing of early prototypes of the integral HPWH according to the DOE 24-h Simulated Use Test (a reasonable representation of real-world hot water consumption patterns) indicated that the HPWH would cycle on twice during the 24-hour test period. The lower thermostat would turn the heat pump on after the first hot water draw of the test, and it remained on for an extended period to meet the remaining five hot water draws prescribed by the DOE protocol. During the subsequent recovery period, testing showed that the heat pump turned on once more as internal tank temperatures equilibrated and to replace tank heat losses over this period. Observation of the add-on HPWHs during 24-h tests indicated that they tended to perform in a similar manner. Therefore, assuming the HPWH will undergo an average of two cycles per day in a representative residential application, over a 10-year lifetime the total number of compressor cycles will be (10y)(365 d/y)(2 cycles/d) = 7300 cycles. We therefore prepared a plan to conduct accelerated testing so that in about 200 days of testing, the HPWH could be subjected to 7300 cycles. This estimate of 7300 cycles for a ten-year life was checked against data from the field tests conducted in parallel with the first durability test program (Murphy 2002). An examination of cycling history at three of the test sites indicates that they experienced anywhere from 14-26 compressor cycles per week, with a slight dependence upon hot water usage, i.e., the greater the usage the greater the number of cycles (see Table 2.1). For units with high water use, there can be a number of large hot water demand instances each week when the upper element is used for quick recovery of the top portion of the tank. When this happens, the compressor will shut off until upper tank recovery is complete, then it turns back on to finish heating the remainder of the tank leading to a greater number of compressor cycles. Over a ten-year service life, this range of weekly cycling rates equates to a total of about 7,300 to 13,500 compressor cycles. For sites with low to moderate hot water demand, the 7300 cycle estimate used for the durability testing seems to reasonably represent about 8-10 years of compressor duty cycles. For heavy usage sites, 7300 cycles may represent more like 5-9 years of compressor cycles. Table 2.1. Average weekly compressor duty cycles for three field-test HPWHs compared
to weekly hot water demand (Murphy 2002)
Approximate weekly water use (gallons)
Weekly compressor cycles
Total compressor cycles for ten years operation at average weekly rate
260 14-18 7,280-9,360 490 15-19 7,800-9,880 630 15-26 7,800-13,520

12
2.1. Expected ambient operating condition envelope A HPWH is expected to perform over a range of ambient temperature and humidity, incoming cold water temperature, and hot water delivery temperature. Although exact operating conditions may differ somewhat from the following, we anticipate that the conditions shown below will be close to those experienced in most HPWH locations.
Ambient DBT: 40 °F to 120 °F Ambient RH: 50% to 90% Incoming cold water: 45 °F to 70 °F Hot water delivery temperatures: up to 140 °F (although unit should be able to
function with thermostat at highest setting) The extremes of the ambient temperature range cover temperatures that could be found in garage installations during the summer and winter in various locations in the U.S. The 1% design dry bulb temperature for Las Vegas, for example, is 108 °F, and temperatures in a south or west facing closed garage may be 10-12 °F, or more, higher during solar noon. Design dry bulb temperatures are lower for other U.S. locations. A water heater should not be located where the ambient temperature could fall much below 40 °F. Therefore, the 40–120 °F DBT operating range appears reasonable, and clearly covers HPWH installations in basements and in conditioned spaces within a house. The amount of moisture contained in the ambient air will affect the average evaporating pressure in the HPWH evaporator. If the inlet air moisture level is high enough to form condensate on the coil, the evaporator pressure will be higher than in dry air conditions. The highest evaporating pressures would occur at high inlet air coincident wet bulb and dry bulb temperatures (WBT and DBT). Since the enthalpy of the inlet air is a function of DBT and WBT, we selected total enthalpy of the ambient air as one parameter for determining the evaporation load of the HPWH. We arbitrarily selected several locations in the U.S. and calculated the total enthalpy of the outside air for design days (1% design dry bulb and wet bulb) during the summer. We also estimated the minimum air temperature and humidity that a HPWH would experience if located in a relatively confined space inside the home or in an unconditioned basement. These results are shown in Table 2.2.

13
Table 2.2. Design ambient air conditions for the HPWH.
Garage Installations in:
Jacksonville Las Vegas Austin, Texas Birmingham Boston Fresno, CA San Jose, CA Los Angeles, CACool locations
Design DBT/WBT (°F)/RH (%)
96/79/47 108/71/15 100/78/37 96/78/45 91/75/48 101/70/21 89/66/29 81/64/39 40/35/61
Total Enthalpy (Btu/lb)
42.3 34.4 41.2 41.3 38.3 33.8 30.6 29.1 13.0
Closet locations 50/48.5/90 19.5 Basement locations 80/75/80 38.7
The highest ambient temperature in this grouping of sites is 108 °F and, as mentioned above, a HPWH in an enclosed garage could experience 120 °F. Significant evaporator condensate production would not be expected at such a high ambient temperature condition (barring blockage of air flow) because the evaporator temperature would tend to remain above the air’s dew point temperature. A somewhat lower ambient DBT and higher RH (similar to conditions in Jacksonville, e.g.) would encourage rapid condensate formation since the capacity of the HPWH is high and the WBT reasonably close to the DBT. 2.2. Durability test protocol The durability testing consisted of operating the ten HPWH units in an environmental chamber under a set of ambient conditions representative of the envelope described above that grew progressively harsher with time and number of cycles. Unit components that failed during these tests were to be repaired or replaced so that, as far as possible, all ten units would complete the entire set of tests. Each unit was instrumented as described in Figures 2.1 and 2.2 and in Table 2.3 so that changes in the performance of components as well as the unit as a whole with number of cycles could be determined. Temperature data included three thermocouples on the refrigeration system (compressor discharge, compressor suction, and top of compressor shell) and eight water thermocouples (water in and out plus six temperatures at different levels inside the tank). Data was collected continuously beginning February 11, 2003 and continuing until November 14, 2003.

14
Figure 2.1 – Schematic of integral HPWH test setup showing data instrumentation locations and control thermistor (T1-T4) locations.

15
Figure 2.2 – Schematic of add-on HPWH test setup showing data instrumentation locations and control thermistor (T1 & T2) locations.

16
Table 2.3. HPWH test unit data inputs
HPWH test units
Water Flow
Power
Temperature
Per unit
1
(flow meter, pulse input
type)
1 or 2a
(watt transducers, heat pump
plus electric elements)
11
Total for ten units
10
15a
110
aIntegral units required only 1 watt transducer for both heat pump and tank elements since both operate at 230V.
The goal was to identify design and component weaknesses that could impact the reliability and performance of the HPWH over 10 years of simulated residential use. This required a laboratory “cycle rate” of less than one cycle each hour. Cycling was designed to be continual thereby minimizing compressor off time and maximizing compressor starts. To accomplish this acceleration and to retain real-world tank conditions over each cycle, hot water was introduced into the tank at a rate of 0.2-0.4 gpm to speed tank temperature recovery (see test loop discussion, next section). This provided the acceleration needed to complete the 7300 cycles in under a year while allowing the condenser and tank operate through the same temperature change as in a real-world application. The test facility used for accomplishing this task and for conducting the durability tests is described in Section 3 of this report. In addition to accumulating the 7300 duty cycles, the test protocol was designed to cycle the HPWHs under increasingly severe conditions. The protocol was divided into four periods or stages characterized by different ambient conditions and supply voltages. There was also a brief fifth stage at the end during which post-durability simulated use, or Energy Factor (EF), tests were performed. The planned operating conditions and target number of cycles for each of these protocol stages are summarized in Table 2.4.

17
Table 2.4. Operating conditions for each stage of durability test protocol
Stage Cycles Ambient air conditions HPWH power supply voltage
1 2000 75-80 ºF dry bulb temperature35% RH
115 volts AC – add-on 230 volts AC – integral
2 2000 85 ºF dry bulb temperature 50% RH
115 volts AC – add-on 230 volts AC – integral
3 2000 100 ºF dry bulb temperature 50% RH
115 volts AC – add-on 230 volts AC – integral
4 1200 100 ºF dry bulb temperature 50% RH
15% reduced voltage
5 100 67.5 ºF dry bulb temperature 50% RH
115 volts AC – add-on 230 volts AC – integral
The following sequence was used to accumulate the 7300 compressor duty cycles necessary to simulate 10 years of HPWH operation. Step 1: Set ambient conditions for stage 1 – 75-80 °F DBT and 48 ºF dew point temperature. Set the voltage to the integral HPWHs at 230 VAC and to the add-on units at 115V. Step 2: Set the thermostat of each HPWH so that average tank water temperature is approximately 140-150 °F at the end of each cycle. Step 3: Initiate a hot water draw (10.7 gallons at 1.0-3.0 gpm). Return approximately 58 °F water to the tank during this and all draws. After the draw and with the HPWH operating, introduce hot water at about 150 °F into the top of the tank to supplement condenser heat from the compressor (supplemental hot water feedback). The flow rate for the hot water re-introduced into the top of the tank is controllable so that the thermostat (compressor control) is satisfied in about 40 minutes. This required a flow rate of 0.2-0.4 gpm for the HPWHs tested in this study. Step 4: As soon as the compressor turns off, immediately initiate another draw, repeating Step 3. Step 5: After 13 cycles, initiate a “heavy draw” cycle. The heavy draw is designed to simulate occasional heavy water uses and thereby exercise the upper elements in each tank. Supplemental hot water feedback is used during “heavy draw” cycle recovery as well to limit its duration. We chose the 13-cycle interval for the following reason: Earlier 24-h HPWH tests indicated that the compressor cycled about twice each day. We assumed that in the real world, a heavy water draw from a HPWH would occur about once each

18
week. This suggests that the HPWH would need to recover from a low tank temperature produced by a heavy water draw once every 14 cycles. Step 6: Continue the stage 1 cycling tests (normal draws and the less frequent heavy draws) round-the-clock for approximately 2000 cycles. Step 7: Shift to stage 2 (increase the chamber humidity level to a 63 ºF dew point temperature) and continue the testing regimen described in steps 3-5 for 2000 more cycles. This stage cycles the compressor under higher latent load conditions. Step 8: At approximately 4000 cycles, shift to stage 3 (increase ambient to 100 °F with 78 ºF dew point). The conditions at this stage, somewhat representative of hot and humid garage locations, further increase the load on the compressor. Continue the cycle schedule (steps 3-5) as before for an additional 2000 cycles. Step 9. At approximately 6000 cycles, shift to stage 4 (decrease the power supply voltage by 15% while maintaining the chamber temperature at 100 °F and 78 ºF dew point temperature). Continue cycles as described in Steps 3-5 for 1300 more cycles. The reduced voltage conditions in this stage increase the compressor stator winding currents and temperatures. At the conclusion of the durability tests, ambient and power supply conditions were shifted to stage 5 levels and the EF of each unit was measured according to the DOE Simulated Use Test. Supplemental hot water feedback flow was disabled for these EF tests. Subsequently the compressors were removed and checked for wear in cooperation with the compressor manufacturer. The integral units were returned to the HPWH manufacturer for examination of the condenser/tank adhesion quality, insulation condition and visual check of other components.

19
3. The Test Facility In order to be able to conduct the durability test, a test facility was required with the capability to provide a continuous supply of hot and cold water for the ten test HPWHs and control the cycling schedule as outlined in the test protocol. A search for available facilities prior to the first durability test program in 2000 revealed that none were known to exist that would be capable of executing the protocol described in Section 2, therefore we had to construct a new test stand at ORNL. An overall view of the facility as used for this durability test phase is pictured in Figure 3.1. The environmental chamber pictured in Figure 3.1 was used to establish ambient conditions needed for the durability tests. The ten units were installed in the chamber as shown in Figure 3.2, five on the rack shelf and five on the chamber floor underneath the shelf. To complete the test facility, a system of hot and cold piping loops together with water temperature-conditioning systems was constructed and connected to hot and cold water supply and return headers in the chamber. Each durability test HPWH unit was connected to these headers through a flow control module described later in this section. A summary description of the facility is provided here, but it is described in full detail in the previous durability report (Baxter and Linkous, 2002). The most significant change to the facility for this second durability test run was the addition of a large variable voltage transformer (50 kW capacity) as shown in Figure 3.1. This transformer was needed to allow the electric elements in each of the ten HPWH storage tanks (4.5 kW each) to be operated during this durability test phase. Figure 3.3 shows a schematic of the test stand used for the durability tests. A primary/secondary loop approach was used for providing cold and hot water to each test unit according to its individual demand. This approach was chosen so that each test unit could operate independently of the others. For clarity, Figure 3.3 shows only two HPWH units each with secondary piping. However, the two primary loops (hot and cold) were connected to each of the ten secondary loops.

20
Figure 3.1 – Overall view of HPWH durability test facility.
Environmental chamber
New high power transformer for tank electric elements
Main loop hot water storage tank

21
Figure 3.2 – Installation of HPWHs inside environmental test chamber.
Add-on units
Integral units
Flow control module

22
Figure 3.3 – Schematic of HPWH test facility plumbing connections. 3.1. Primary loop system Figures 3.4 and 3.5 are a photograph and schematic, respectively, of the primary loop system. This system consists of two water circulation loops (one hot and one cold), four storage tanks, and associated conditioning equipment. These loops provide approximately 58 oF water to the HPWH tanks during the 'draw' modes and approximately 150 oF water to the tanks for supplemental hot water feedback (‘supplemental heat’ mode). There are two 120 gallon cold water storage tanks, one 120 gallon hot water storage tank, one 120 gallon buffer tank, two primary circulation pumps (one for each loop), a chiller for primary water temperature conditioning, an outdoor fan coil for chiller heat rejection, and an expansion tank to maintain water system pressure. The hot tank with electrical connections to the two heating element access covers can be seen at the left-hand side of the photo in Figure 3.4. Just to its right is the buffer tank, while the chiller unit is pictured in the foreground. The two cold water tanks are located between the chiller and the buffer tank but are obscured in the photo by the chiller. Two 5500-watt electric heating elements in the hot tank were used to keep the hot loop at operating temperature conditions. The buffer tank was used to provide for flow and pressure balancing between the two primary loops when water removals from the cold loop were greater or less than those from the hot loop. One 4500-watt electric element was used in the buffer tank to keep the top half at approximately 130 °F. The hot and cold piping loops served to provide cold and hot water for the test HPWH draw and supplemental heat modes, respectively. Each consists of large diameter pipe

23
and a circulating pump that maintained a constant flow rate of about 30 gpm during the durability testing. The fittings normally used for electric elements were used for loop piping connections for the two cold tanks and the buffer tank. The cold loop was plumbed, as illustrated in Figure 3.5, such that water is circulated from the bottom of tank 1 to the test units and then returned to the top of tank 2 after picking up supplemental heating water flows.
Figure 3.4 – Photo of HPWH test facility chiller and primary water storage tank section.
Hot tank
Buffer tank
Chiller
Circulating pumps
Main water loop expansion tank

24
Figure 3.5 – Schematic of HPWH test facility chiller and primary water storage tank section. 3.2. Secondary loop systems. Each test HPWH operated independently of all others in its own separate secondary flow loop. The secondary piping circuits were used to control the draw and supplemental water flows for the test HPWH units. Each had a flow control module as shown schematically in Figure 3.6 containing a small circulating pump, a water flow meter, four solenoid valves, a check valve, and metering valves for fine control of the water flow. These flow modules can be seen in Figure 3.2 as attached to their respective test units. Module controls were configured such that in flow position A (‘draw mode’) all solenoid valve coils are energized and in position B (‘supplemental heat mode’) the coils are deenergized. Metering valve A was used to adjust the draw flow rate to the desired 1-3 gpm level. Metering valve B was used to adjust the supplemental hot water flow to approximately 0.2 - 0.4 gpm to achieve 'typical' HPWH cycle times of about 40 minutes (see below). The controller for the HPWH test loop was setup to operate each secondary circuit flow control module as follows.
1. For typical cycles: (a) With the solenoid valves in position A (Figure 3.6), 1-3 gpm water flow was introduced from the cold primary loop to the bottom of the HPWH tank (the draw mode). In this process, hot water from the top of the tank was discharged into the hot primary loop. (b) After 10.7 gallons of cold water were delivered to the HPWH tank (approximately 3 minutes and 34 seconds at 3 gpm), the control system switched the solenoid valves to position B and supplemental heating flow began. Flow rate for this mode (0.2 - 0.4 gpm) was set using metering valve B to achieve a total typical cycle length (from start of one water draw to the start of the next water draw) of about 40 minutes. (c) Supplemental mode flow continued until the HPWH shut off (thermostat set point satisfied). Immediately, the solenoid valves were switched by the loop controller to position A, and the typical cycle was

25
repeated twelve (12) more times until thirteen (13) typical cycles were completed.
Figure 3.6 – Schematic of secondary loop flow control module.
2. For 'heavy draw' cycles (every 14th cycle): (a) After thirteen typical cycles, the draw mode was controlled to
discharge a much larger volume of hot water (about 37 to 40 gallons) from the HPWH tank. After the draw process the solenoid valves were switched to position B and supplemental heat water flow commenced and continued until the HPWH shut off (lower tank thermostat set point satisfied).
(b) Immediately the solenoid valves were switched to position A and a new series of 13 typical and 1 heavy draw cycles began.
This cycle of thirteen typical and 1 heavy draws continued until each test HPWH completed about 7300 water heat cycles. 3.3. Data acquisition and control system An Intellution®, Version 7.0 software system was chosen to provide automatic control of the secondary flow modules and the primary water loop. Analog and digital input hardware from MTL® was used to gather temperature, water flow, and power draw data from the primary instruments and the
26
Intellution software logged and stored the data. Standard commercial specification type T, copper-constantan thermocouples were used for all temperature sensors. All thermocouples were of the immersion type. An Omega model FTB-4605 water flow meter with an accuracy of ± 1.5% was used to measure the draw and supplemental water flows on each flow control module. This meter provided a pulse output of 151.4 pulses/gallon. The Intellution software program was configured to count each typical and heavy draw water heat cycle, compressor cycle, and CMS cycle (for the two EMI units so equipped), and maintained a running total of cycles throughout the test period. A number of changes were made to the system to accommodate testing of the 115V add-on HPWH units. Five 115V circuits were added to the test loop electrical power supply system for the add-on units. Each circuit included a power stat to control the power supply voltage to the HPWH test unit. In addition, five 115V power transducers (Ohio Semitronics model PC5-059CX5) with a 0-1500W range were added to measure the HPWH compressor/fan/pump power. Changes were also made to upgrade the 230V power supply system on the test loop so that the electric elements in each tank (about 4.5 kW each) could be monitored. Ohio Semitronics model PC5-002X5 power transducers with 100:5 current transformers (CT) were used to measure the power draw of the integral HPWHs and the storage tank elements of the add-on HPWHs. One transducer/CT pair was used for each HPWH and had a range of 0-5000 W. Accuracy of the watt transducers used was ± 0.5%. The variable voltage transformer described earlier provided for voltage reduction on each of the ten 230V HPWH circuits during Stage 4 of the test protocol.

27
4. Test Results and Discussion The durability test program commenced on February 11, 2003, and continued until November 14, 2003. Except for a few plant-wide power outages and a few outages caused by low water pressure in the test loop, both the loop and the HPWHs operated continuously. Figure 4.1 shows power, average tank water temperature, and secondary loop water flow for a representative 6-hour period for the test units. Table 4.1 lists total cycles, upper and lower tank electric element cycles, CMS heater cycles (and estimated hours), compressor cycles, and estimated compressor operating hours for each unit. Each upper element cycle is associated with a heavy draw cycle (about every 14th water heat cycle). For the add-on units the compressors and upper elements were able to operate simultaneously. The integral units’ controls deactivated the compressor whenever the upper element was called for, thus there were two compressor cycles for each heavy draw cycle. Lower element cycles were called for by units 6-10 whenever the compressor discharge temperature exceeded the programmed limit (nominally 220 °F) before a water heat cycle was terminated. Occasionally these lower element calls occurred during the middle of a water heat cycle and resulted in an additional compressor cycle as well. For units 7 and 9 there were also several lower element calls during many CMS heater cycles. All lower element cycles occurred during Stages 3 and 4. The lower tank thermostats for the add-on units were set to the minimum value as noted earlier and never operated. Units 7 and 9 accumulated fewer cycles than the other units because the controls did not allow the unit to run when the CMS sensor detected a full condensate pan.
Table 4.1. Total cycles and approximate operating hours accumulated by each unit during durability test.
Unit Total water heat cycles
accumulated
Total compressor
cycles
Upper element cycles
Lower element cycles (est.)
CMS cycles (heater hours)
Compressor operating
hours (est.)
1, add-on 8156 8156 573 - - 5810 2, add-on 7961 7961 535 - - 5730 3, add-on 8115 8115 572 - - 5820 4, add-on 8364 8364 594 - - 5720 5, add-on 8208 8208 573 - - 5760 6, integral 7773 8427 551 2900 - 5490 7, integral 6640 7109 469 320 1044
(1310) 4400
8, integral 7970 8555 565 2500 - 5560 9, integral 6688 7167 468 550 1042
(1280) 4460
10, integral 7467 8153 524 2940 - 5540 The following sections discuss various component problems and failures for the test units, results of post-test examinations of the compressors, condenser wrap, and tanks, and operating characteristics of the units (efficiency, refrigerant operating conditions, etc.).

28
Figure 4.1 – Representative cycling behavior over 6-hour time period. Power consumption, average tank water temperature, and secondary loop total flow vs. time shown. Cycling rate was approximately 32 cycles/d on average.

29
4.1. System reliability discussion Component failures. Table 4.2 provides a summary of the various component failures experienced by the 10 test units over the course of the durability run. There were no compressor failures, fan failures, or compressor or fan relay failures on any of the units (integral or add-on) during the durability test sequence (however, see the discussion under Miscellaneous issues below). In addition there were no control system or component failures at any time while chamber ambient conditions were maintained at the planned Stage 1-4 levels. There was, however, one inadvertent departure from the planned testing conditions that resulted in control failures on two units. Just after Stage 4 started, the main water loop suffered two shutdowns on successive nights due to low water pressure. As a result the dry bulb temperature in the chamber rose to about 135 ºF and the dew point temperature to about 120 ºF. After exposure to this extreme condition for a total of about 12 hours the control boards and evaporator thermistors (T3) on two of the integral units failed. After replacement of these components, both units operated without incident for the remainder of the durability test period.
Table 4.2. HPWH component failure summary Unit
# HPWH
type Integral
unit thermistors
Add-on unit
thermistors
Control system
Refrigerant leaks
1 Add-on 2 Add-on 12/02
(on receipt) 3 Add-on
4 Add-on 5 Add-on 11/25/03
(date repaired) 6 Integral 10/6/03,
T3a 10/6/03 a
7 Integral
8 Integral 9 Integral
10 Integral 10/6/03, T3 a
10/6/03 a
aFailures occurred after exposure to very high temperature & humidity conditions (approximately 135 ºF dry bulb and 120 ºF dew point) for a total of about 12 hours.
Electrical noise problems. During the pre-test check out of the integral test units for proper operation we observed that the problems with aberrant sensor signals caused by electrical noise in the first generation units tested in 2001 appeared to have been eliminated by the new control board and system design. No electrical-noise-related problems occurred with the control systems of either the integral or add-on HPWHs during this test phase.

30
Unit noise problems. No exceptional fan or compressor noise was observed for any of the test units during the durability run. The integral units were quieter than the add-on units. Miscellaneous unit quality issues. When the test units were received from the manufacturers, all were examined for proper operation and for consistency in construction quality. One of the integral units was filled with water and operated for several days to exercise its controls. No operational problems were encountered. The integral units were of very consistent quality. The add-on units exhibited a number of assembly problems that had to be corrected prior to check out and durability testing. These included leaking evaporator drain pans (all units), evaporator fan not secured to unit housing (two units), blocked air outlet (one unit), and poorly secured power cords (two units). In addition, one unit (Unit 2) had a refrigerant leak upon receipt that we had to repair before testing could begin. After leak repair and recharging with 18 oz of R401A per the manufacturer’s specifications, Unit 2 operated normally but apparently suffered from excessive condenser pressure as evidenced by the fact that the high pressure cutout switch would trip and shut the unit off before satisfying the thermostat throughout Stage 1 of the durability testing. We suspected that Unit 2 may have had a partial blockage in its refrigerant circuit causing excessively high condensing pressures leading to the high pressure switch trips. The manufacturer was consulted and agreed to furnish a replacement unit, but the replacement received was apparently damaged either at the factory or during shipping and handling and was not operable. We then decided to remove some charge (about 3 oz) from Unit 2. As a result it operated without constantly tripping the high pressure protect switch through Stage 2 but experienced higher suction superheat levels than the other four add-on units. In Stage 3, unit 2 began to experience premature compressor shutdowns each cycle similar to the experience in Stage 1, but the high pressure switch was not tripping. Compressor shell and discharge temperatures increased significantly in Stage 3 so it is likely that this caused the internal high temperature switch to open and shut off the compressor. (NOTE: Destructive examination of several of refrigerant tube sections in Unit 2 after the durability tests did not reveal any apparent flow blockages. It could be that excess refrigerant charge was responsible for the high pressure switch activation behavior in Stage 1.) The add-on unit controls operated reliably but need adjustment so that the indicated set point temperature accurately reflects the actual average tank water temperature. As shown in Table 4.3, in order to achieve an average tank temperature of about 145 °F at the end of each cycle, the required thermostat set point temperature had to be about 20 °F to 30 °F lower. This could result in potential scalding incidents if left uncorrected. All the problems noted with the add-on units can most likely be traced to inconsistent attention to detail during assembly. A rigorous factory quality assurance program would prevent most if not all such problems.

31
Table 4.3. Add-on HPWH thermostat set point required for 145 °F average tank water
temperature at shutoff Unit # Thermostat set point, °F
1 118 3 128 4 119 5 122
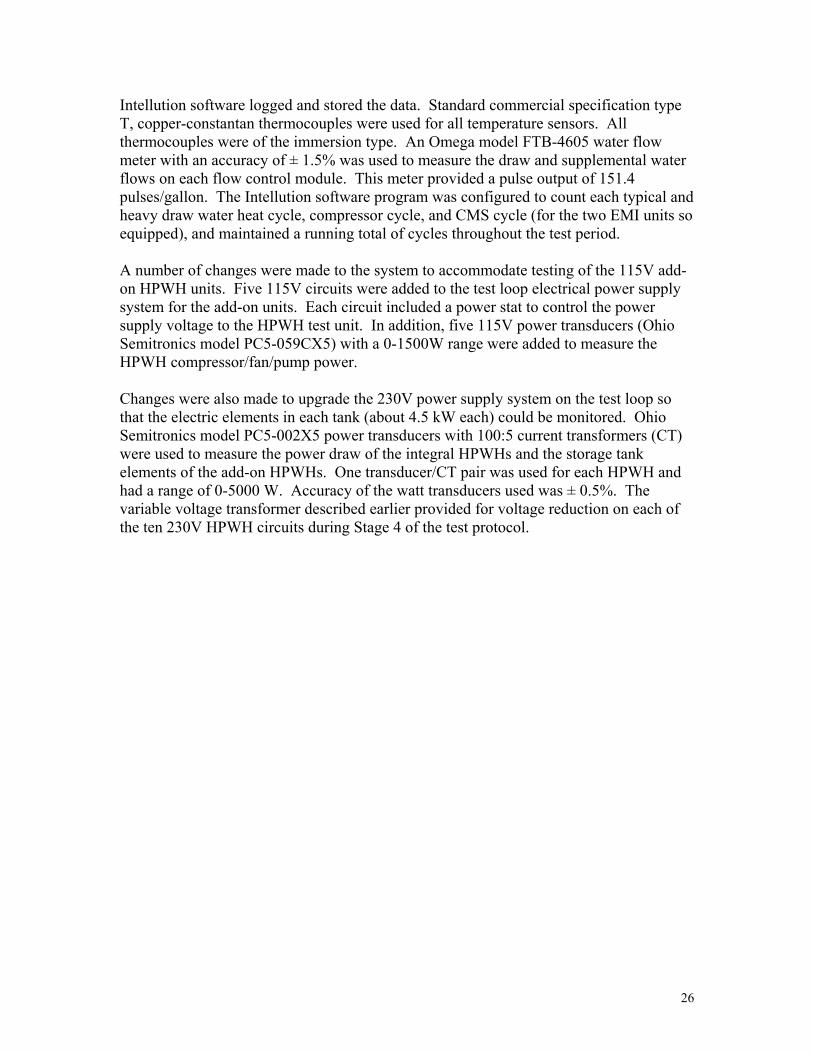
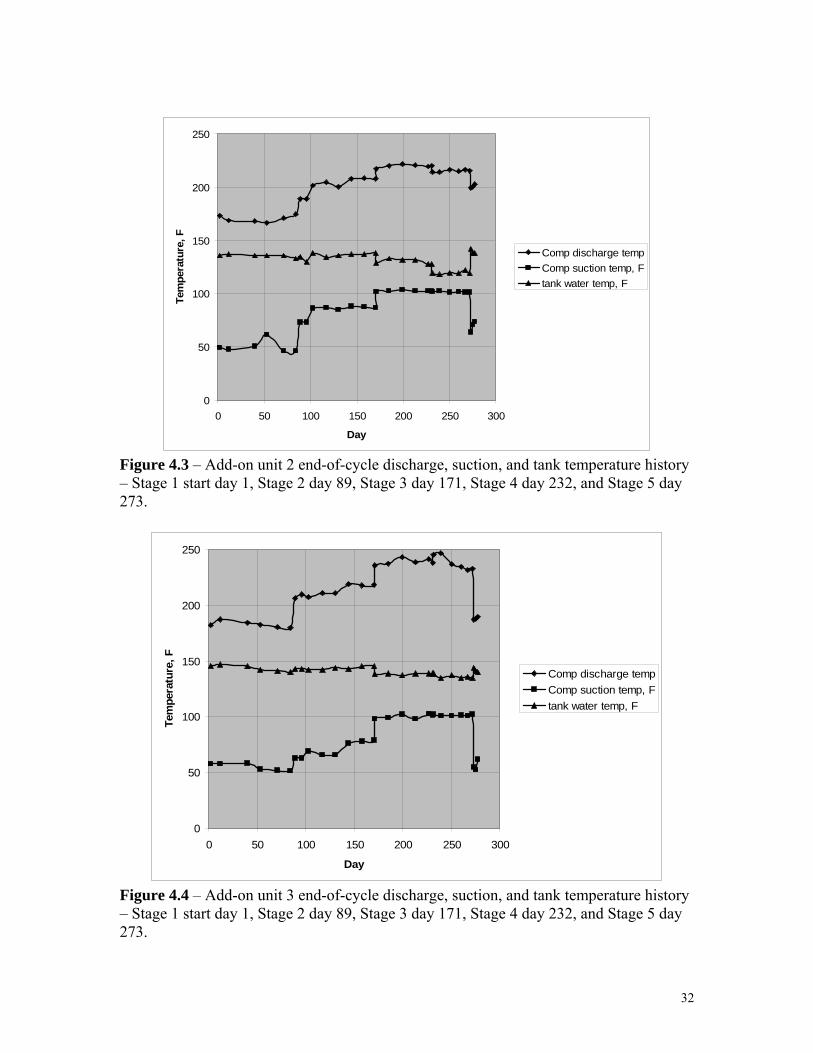
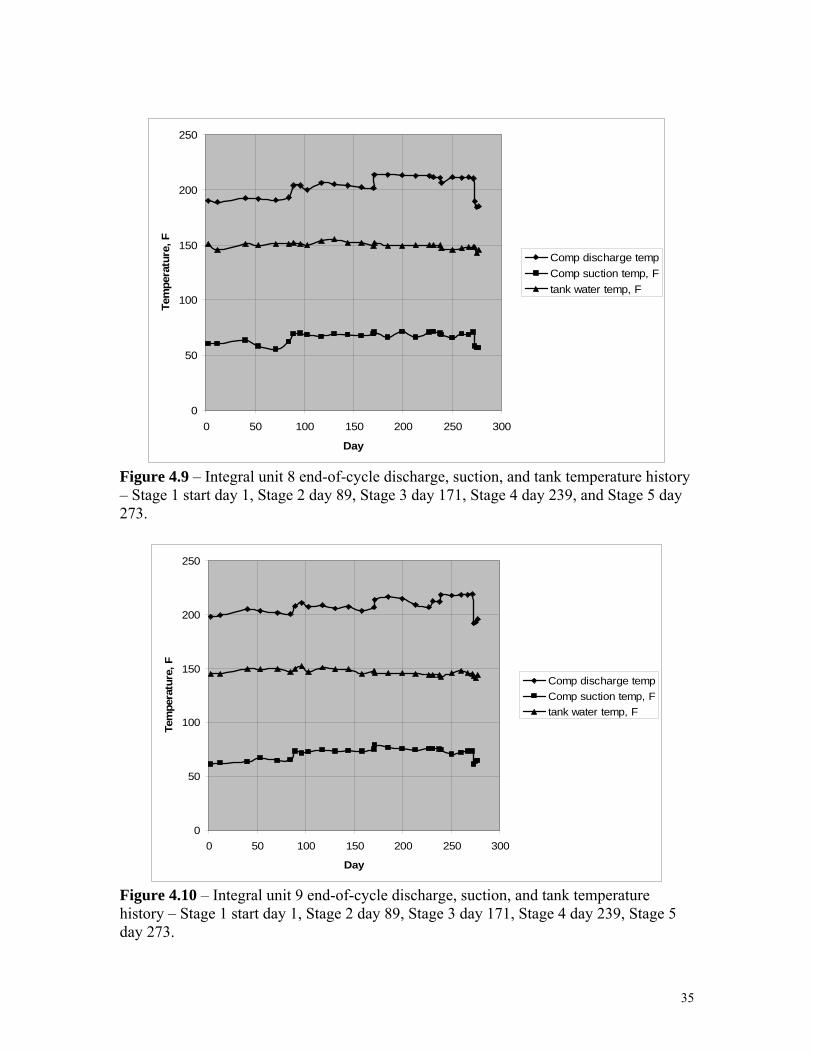
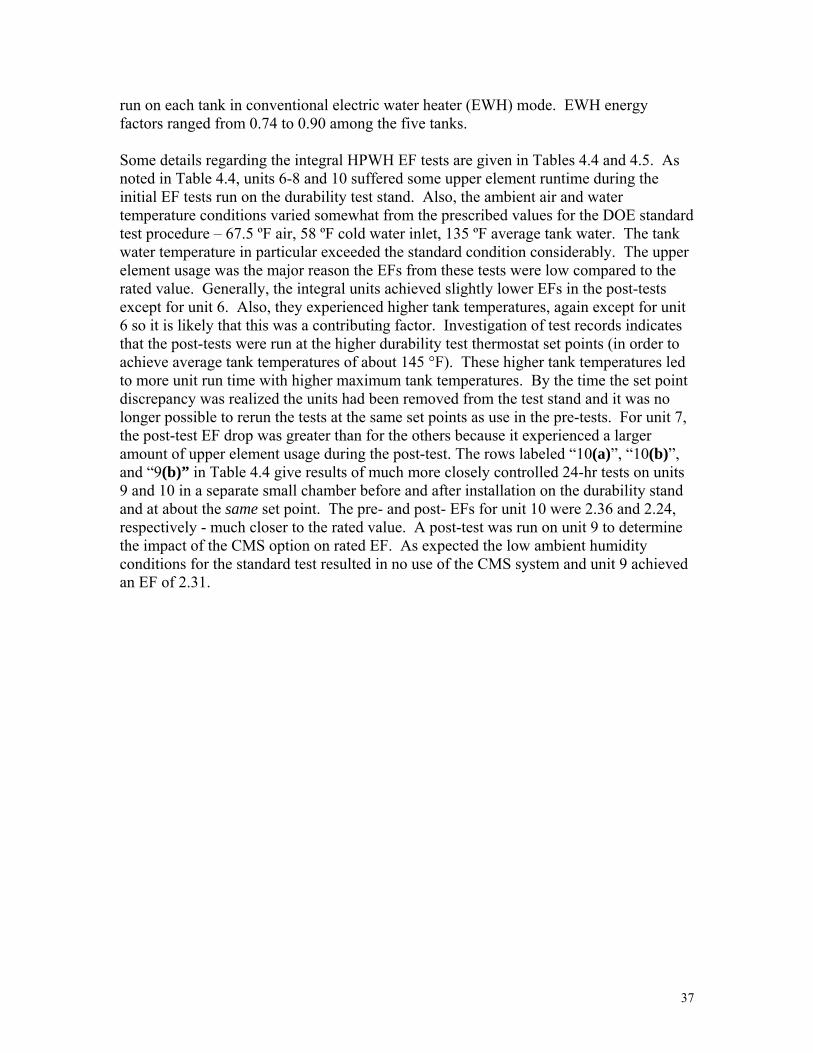
4.2. Unit performance Performance characteristics over time. Figures 4.2 through 4.11 show end-of-cycle trends of discharge and suction temperature and tank water temperature for each test unit. The thermostats for each test unit were all set at the beginning of the durability test to achieve upper tank water temperatures of about 145 ºF. All units except unit 2 (Figure 4.3) maintained this water temperature during Stage 1 of the testing (ambient conditions typical of indoor locations). As noted above, unit 2 ended each cycle via a trip of its high pressure control. In Stages 2 and 3 with increased ambient temperature and humidity, tank temperatures achieved by the add-on units (Figures 4.2-4.6) tended to degrade (by as much as 15-20 °F during Stage 3). The addition of reduced voltage in Stage 4 further reduced the tank temperature levels achieved by Unit 2. This temperature drop did not occur to such a degree in the integral units (Figures 4.7-4.11). All ten units approached Stage 1 conditions during Stage 5 at the close of the durability test run.
0
50
100
150
200
250
0 50 100 150 200 250 300
Day
Tem
pera
ture
, F
Comp discharge tempComp suction temp, Ftank water temp, F
Figure 4.2 – Add-on unit 1 end-of-cycle discharge, suction, and tank temperature history – Stage 1 start day 1, Stage 2 day 89, Stage 3 day 171, Stage 4 day 232, and Stage 5 day 273.
32
0
50
100
150
200
250
0 50 100 150 200 250 300
Day
Tem
pera
ture
, F
Comp discharge tempComp suction temp, Ftank water temp, F
Figure 4.3 – Add-on unit 2 end-of-cycle discharge, suction, and tank temperature history – Stage 1 start day 1, Stage 2 day 89, Stage 3 day 171, Stage 4 day 232, and Stage 5 day 273.
0
50
100
150
200
250
0 50 100 150 200 250 300
Day
Tem
pera
ture
, F
Comp discharge tempComp suction temp, Ftank water temp, F
Figure 4.4 – Add-on unit 3 end-of-cycle discharge, suction, and tank temperature history – Stage 1 start day 1, Stage 2 day 89, Stage 3 day 171, Stage 4 day 232, and Stage 5 day 273.

33
0
50
100
150
200
250
0 50 100 150 200 250 300
Day
Tem
pera
ture
, F
Comp discharge tempComp suction temp, Ftank water temp, F
Figure 4.5 – Add-on unit 4 end-of-cycle discharge, suction, and tank temperature history – Stage 1 start day 1, Stage 2 day 89, Stage 3 day 171, Stage 4 day 232, and Stage 5 day 273.
0
50
100
150
200
250
0 50 100 150 200 250 300
Day
Tem
pera
ture
, F
Comp discharge tempComp suction temp, Ftank water temp, F
Figure 4.6 – Add-on unit 5 end-of-cycle discharge, suction, and tank temperature history – Stage 1 start day 1, Stage 2 day 89, Stage 3 day 171, Stage 4 day 232, and Stage 5 day 273.

34
0
50
100
150
200
250
0 50 100 150 200 250 300
Day
Tem
pera
ture
, F
Comp discharge tempComp suction temp, Ftank water temp, F
Figure 4.7 – Integral unit 6 end-of-cycle discharge, suction, and tank temperature history – Stage 1 start day 1, Stage 2 day 89, Stage 3 day 171, Stage 4 day 239, and Stage 5 day 273.
0
50
100
150
200
250
0 50 100 150 200 250 300
Day
Tem
pera
ture
, F
Comp discharge tempComp suction temp, Ftank water temp, F
Figure 4.8 – Integral unit 7 end-of-cycle discharge, suction, and tank temperature history – Stage 1 start day 1, Stage 2 day 89, Stage 3 day 171, Stage 4 day 239, and Stage 5 day 273.
35
0
50
100
150
200
250
0 50 100 150 200 250 300
Day
Tem
pera
ture
, F
Comp discharge tempComp suction temp, Ftank water temp, F
Figure 4.9 – Integral unit 8 end-of-cycle discharge, suction, and tank temperature history – Stage 1 start day 1, Stage 2 day 89, Stage 3 day 171, Stage 4 day 239, and Stage 5 day 273.
0
50
100
150
200
250
0 50 100 150 200 250 300
Day
Tem
pera
ture
, F
Comp discharge tempComp suction temp, Ftank water temp, F
Figure 4.10 – Integral unit 9 end-of-cycle discharge, suction, and tank temperature history – Stage 1 start day 1, Stage 2 day 89, Stage 3 day 171, Stage 4 day 239, Stage 5 day 273.

36
0
50
100
150
200
250
0 50 100 150 200 250 300
Day
Tem
pera
ture
, F
Comp discharge tempComp suction temp, Ftank water temp, F
Figure 4.11 – Integral unit 10 end-of-cycle discharge, suction, and tank temperature history – Stage 1 start day 1, Stage 2 day 89, Stage 3 day 171, Stage 4 day 239, Stage 5 day 273. Low voltage impacts. The principal impact from low voltage operation in Stage 4 was an increase in compressor discharge and shell temperatures for each unit. This caused no unit failures. The integral units, however, did experience an increased frequency of lower element calls caused when discharge temperatures exceeded the maximum limit. Unit efficiencies. Approximate energy factor (EF) values were measured for each of the test HPWHs at several points during the durability test run. These tests were run according to the DOE Simulated Energy Use Test procedure, (Federal Register 1998) however, the ambient temperature and supply voltage conditions varied from the standard values specified in the procedure. The supplemental hot water feedback flow was inactive during these EF tests. Overall uncertainty of the EF measurement based on the instrumentation accuracies given in section 3.3 is estimated at ±5% (Murphy and Baxter 2004). Summary results are discussed below. Integral units. Initial 24-hour simulated use efficiency tests were completed on each unit (as installed in the durability test loop) shortly after the durability testing commenced in February. These initial tests were run at close to the ambient temperature condition (67.5 ºF) specified for the DOE Simulated Use Test procedure. Energy factors (EF) ranged from 1.6 to 2.1 (Table 4.4). For comparison, the rated EF as backed out from information on the FTC Energy Guide label on the units is about 2.4. Energy factor tests were also
37
run on each tank in conventional electric water heater (EWH) mode. EWH energy factors ranged from 0.74 to 0.90 among the five tanks. Some details regarding the integral HPWH EF tests are given in Tables 4.4 and 4.5. As noted in Table 4.4, units 6-8 and 10 suffered some upper element runtime during the initial EF tests run on the durability test stand. Also, the ambient air and water temperature conditions varied somewhat from the prescribed values for the DOE standard test procedure – 67.5 ºF air, 58 ºF cold water inlet, 135 ºF average tank water. The tank water temperature in particular exceeded the standard condition considerably. The upper element usage was the major reason the EFs from these tests were low compared to the rated value. Generally, the integral units achieved slightly lower EFs in the post-tests except for unit 6. Also, they experienced higher tank temperatures, again except for unit 6 so it is likely that this was a contributing factor. Investigation of test records indicates that the post-tests were run at the higher durability test thermostat set points (in order to achieve average tank temperatures of about 145 °F). These higher tank temperatures led to more unit run time with higher maximum tank temperatures. By the time the set point discrepancy was realized the units had been removed from the test stand and it was no longer possible to rerun the tests at the same set points as use in the pre-tests. For unit 7, the post-test EF drop was greater than for the others because it experienced a larger amount of upper element usage during the post-test. The rows labeled “10(a)”, “10(b)”, and “9(b)” in Table 4.4 give results of much more closely controlled 24-hr tests on units 9 and 10 in a separate small chamber before and after installation on the durability stand and at about the same set point. The pre- and post- EFs for unit 10 were 2.36 and 2.24, respectively - much closer to the rated value. A post-test was run on unit 9 to determine the impact of the CMS option on rated EF. As expected the low ambient humidity conditions for the standard test resulted in no use of the CMS system and unit 9 achieved an EF of 2.31.
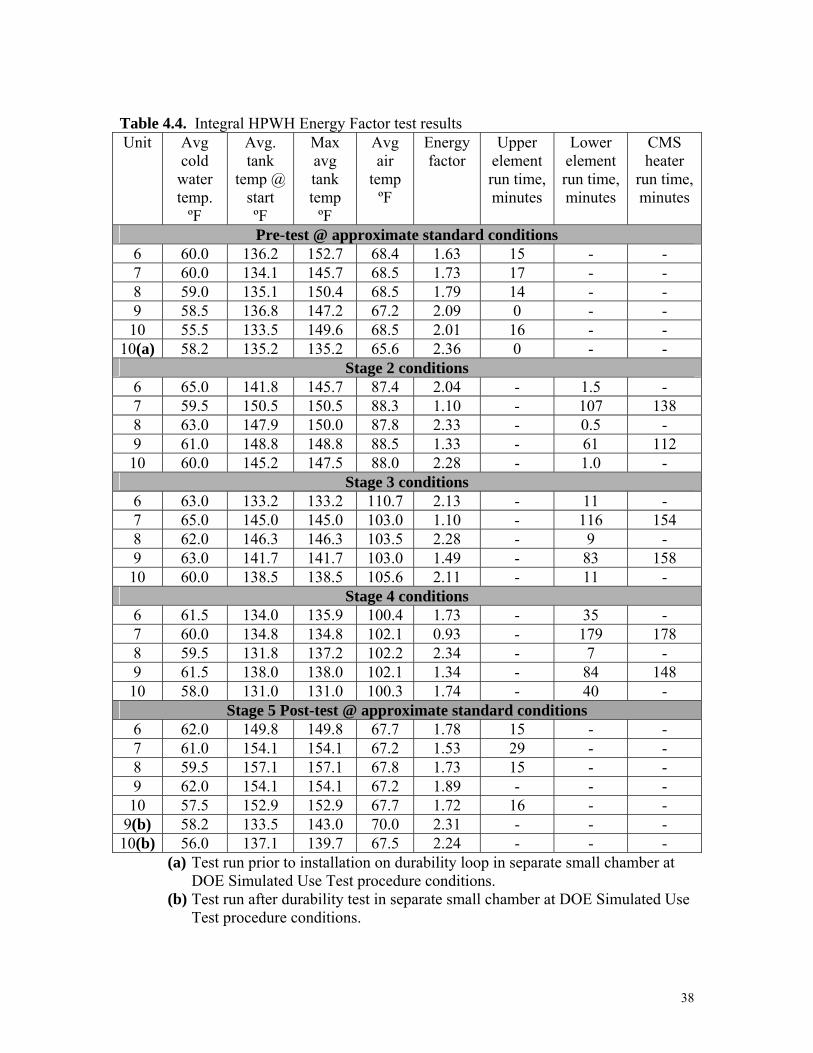
38
Table 4.4. Integral HPWH Energy Factor test results Unit Avg
cold water temp.
ºF
Avg. tank
temp @ start ºF
Max avg tank temp
ºF
Avg air
temp ºF
Energy factor
Upper element run time, minutes
Lower element run time, minutes
CMS heater
run time, minutes
Pre-test @ approximate standard conditions 6 60.0 136.2 152.7 68.4 1.63 15 - - 7 60.0 134.1 145.7 68.5 1.73 17 - - 8 59.0 135.1 150.4 68.5 1.79 14 - - 9 58.5 136.8 147.2 67.2 2.09 0 - - 10 55.5 133.5 149.6 68.5 2.01 16 - -
10(a) 58.2 135.2 135.2 65.6 2.36 0 - - Stage 2 conditions
6 65.0 141.8 145.7 87.4 2.04 - 1.5 - 7 59.5 150.5 150.5 88.3 1.10 - 107 138 8 63.0 147.9 150.0 87.8 2.33 - 0.5 - 9 61.0 148.8 148.8 88.5 1.33 - 61 112 10 60.0 145.2 147.5 88.0 2.28 - 1.0 -
Stage 3 conditions 6 63.0 133.2 133.2 110.7 2.13 - 11 - 7 65.0 145.0 145.0 103.0 1.10 - 116 154 8 62.0 146.3 146.3 103.5 2.28 - 9 - 9 63.0 141.7 141.7 103.0 1.49 - 83 158 10 60.0 138.5 138.5 105.6 2.11 - 11 -
Stage 4 conditions 6 61.5 134.0 135.9 100.4 1.73 - 35 - 7 60.0 134.8 134.8 102.1 0.93 - 179 178 8 59.5 131.8 137.2 102.2 2.34 - 7 - 9 61.5 138.0 138.0 102.1 1.34 - 84 148 10 58.0 131.0 131.0 100.3 1.74 - 40 -
Stage 5 Post-test @ approximate standard conditions 6 62.0 149.8 149.8 67.7 1.78 15 - - 7 61.0 154.1 154.1 67.2 1.53 29 - - 8 59.5 157.1 157.1 67.8 1.73 15 - - 9 62.0 154.1 154.1 67.2 1.89 - - - 10 57.5 152.9 152.9 67.7 1.72 16 - -
9(b) 58.2 133.5 143.0 70.0 2.31 - - - 10(b) 56.0 137.1 139.7 67.5 2.24 - - -
(a) Test run prior to installation on durability loop in separate small chamber at DOE Simulated Use Test procedure conditions.
(b) Test run after durability test in separate small chamber at DOE Simulated Use Test procedure conditions.

39
The 24-hour simulated use tests were repeated for Stages 2, 3, and 4. Two of the five integral units (7 and 9) under test are equipped with an optional condensate management system (CMS) that eliminates requirements for an evaporator condensate drain connection. As can be seen these units exhibited significant efficiency degradation during the high humidity stages of the test protocol due to the CMS operation. The CMS consists of a small (approximately 360 W) heater in the evaporator drain pan that is activated to boil off condensate when the water level in the pan reaches a certain height. If the CMS controls indicate maximum allowable condensate level in the drain pan before hot water set point has been reached, the lower tank element is activated to finish heating up the water. This causes additional energy consumption and loss of performance – the price paid in this instance for the convenience of not having to provide a condensate drain for the HPWH. Stage 2 EF results for these two units were 1.33 for unit 9 and 1.10 for unit 7 (vs. 2.09 and 1.73, respectively, from the earlier tests under standard ambient conditions). In Stages 3 and 4 (much higher ambient humidity), both units achieved similar EF values as in Stage 2. Lower element and CMS heater use increased in the Stage 3 and 4 tests as compared to Stage 2. Stage 2 EFs for units 6, 8, and 10 ranged from 2.04 to 2.33 (vs. 1.63 to 2.09 in the pre-test under near standard conditions). A small amount of lower element runtime was experienced near the end of the tank recovery period for each unit in this stage. All three units experienced higher discharge temperatures in this stage than in the pre tests (Table 4.5). It is likely that each exceeded the maximum allowable discharge temperature embedded in the control software (220 °F), thus causing the lower electric element to have to finish the tank recovery process. Stage 3 EFs for units 6, 8, and 10 ranged from 2.11 to 2.28. Longer lower element run time and higher discharge temperatures were experienced in this stage than in Stage 2. The discharge temperature limit was evidently reached earlier in the recovery process than in Stage 2 accounting for the greater element usage. In Stage 4 units 6 and 10 experienced significant increases in lower element run time and consequent reductions in their EFs. For unit 8, element run time decreased slightly compared to the Stage 3 test. Its Stage 4 EF was similar to the values achieved in Stages 2 and 3. Table 4.5 provides some details about the steady state performance of the units at 130 ºF average water temperature. All the units performed at similar efficiency levels in each stage and COPs increased with increasing air temperature. COPs for the pre- and post-tests were roughly the same indicating that the integral units suffered no performance degradation during the durability test run. The COP increase from Stage 2 to Stage 3 is relatively small. Suction temperatures generally increased with ambient air temperature as well, but again the increase at Stage 3 compared to Stage 2 is small. This is because the integral unit control system modulates the evaporator fans in order to limit the evaporating refrigerant temperature to a maximum of 65 ºF. In stage 4 the steady state efficiencies dropped slightly from the Stage 2 and 3 levels. One factor contributing to this drop is the increase in discharge temperatures seen in this stage caused by increased compressor operating temperatures under the low-voltage operating condition. Steady state values for units 6 and 7 are not reported for Stage 4 because they did not experience steady operating conditions at 130 ºF tank temperature during the EF tests.
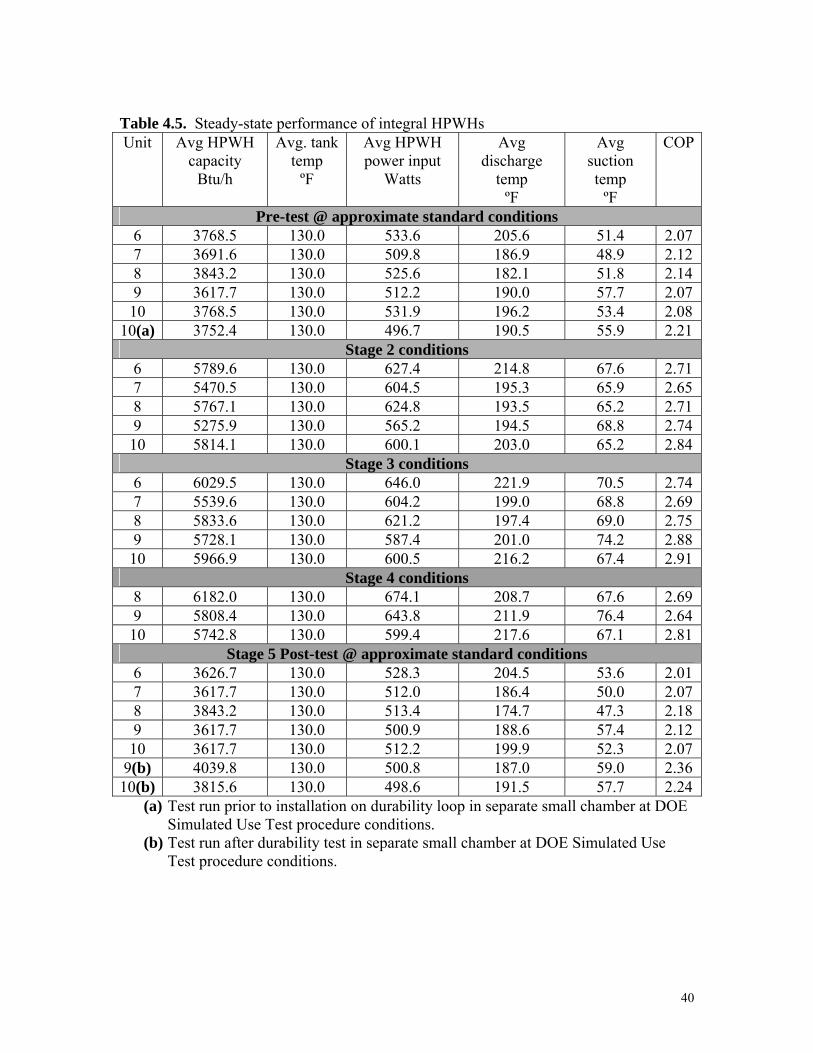
40
Table 4.5. Steady-state performance of integral HPWHs Unit Avg HPWH
capacity Btu/h
Avg. tank temp
ºF
Avg HPWH power input
Watts
Avg discharge
temp ºF
Avg suction temp
ºF
COP
Pre-test @ approximate standard conditions 6 3768.5 130.0 533.6 205.6 51.4 2.07 7 3691.6 130.0 509.8 186.9 48.9 2.12 8 3843.2 130.0 525.6 182.1 51.8 2.14 9 3617.7 130.0 512.2 190.0 57.7 2.07 10 3768.5 130.0 531.9 196.2 53.4 2.08
10(a) 3752.4 130.0 496.7 190.5 55.9 2.21 Stage 2 conditions
6 5789.6 130.0 627.4 214.8 67.6 2.71 7 5470.5 130.0 604.5 195.3 65.9 2.65 8 5767.1 130.0 624.8 193.5 65.2 2.71 9 5275.9 130.0 565.2 194.5 68.8 2.74 10 5814.1 130.0 600.1 203.0 65.2 2.84
Stage 3 conditions 6 6029.5 130.0 646.0 221.9 70.5 2.74 7 5539.6 130.0 604.2 199.0 68.8 2.69 8 5833.6 130.0 621.2 197.4 69.0 2.75 9 5728.1 130.0 587.4 201.0 74.2 2.88 10 5966.9 130.0 600.5 216.2 67.4 2.91
Stage 4 conditions 8 6182.0 130.0 674.1 208.7 67.6 2.69 9 5808.4 130.0 643.8 211.9 76.4 2.64 10 5742.8 130.0 599.4 217.6 67.1 2.81
Stage 5 Post-test @ approximate standard conditions 6 3626.7 130.0 528.3 204.5 53.6 2.01 7 3617.7 130.0 512.0 186.4 50.0 2.07 8 3843.2 130.0 513.4 174.7 47.3 2.18 9 3617.7 130.0 500.9 188.6 57.4 2.12 10 3617.7 130.0 512.2 199.9 52.3 2.07
9(b) 4039.8 130.0 500.8 187.0 59.0 2.36 10(b) 3815.6 130.0 498.6 191.5 57.7 2.24
(a) Test run prior to installation on durability loop in separate small chamber at DOE Simulated Use Test procedure conditions.
(b) Test run after durability test in separate small chamber at DOE Simulated Use Test procedure conditions.

41
Add-on units. Initial 24-hour simulated use efficiency tests were completed for the add-on units (as installed in the durability test loop) shortly after the durability testing commenced. These initial tests were run at close to the conditions specified for the DOE Simulated Use Test procedure. Results are given in Table 4.6. Steady-state performance at 130 °F average tank water temperature is given in Table 4.7. Energy factor tests were also run on each tank in conventional electric water heater (EWH) mode. EWH energy factors ranged from 0.81 to 0.92 among the five tanks. Pre-test EF values for 4 of the units ranged from about 1.3 to 1.5. There was no rated EF value available for comparison. Unit 2 had a much lower EF because its high pressure cut out switch tripped repeatedly during the recovery portion of the 24-hr test and it never satisfied its thermostat set point, thus it consumed much more compressor power. Post-test EFs for add-on units 1 and 3-5 were significantly lower than the pre-test results. The principal reason for this drop is that the tank water temperatures were much higher than in the pre-tests. As in the case of the integral units it was determined that the post-tests were run at the higher durability test thermostat set points. The rows labeled “5(a)” and “5(b)” in Table 4.6 give results of much more closely controlled 24-hr tests run on unit 5 at the same set point in a separate small chamber both before and after it was installed on the durability stand. The EFs from these tests were almost identical (about 1.4) and within the range of values measured for all units in the pre-tests indicating that the overall efficiency (EF) had not degraded significantly over the course of the durability run. However, note that the 5(b) test was run after a refrigerant leak had been repaired. As an additional check a test was run on unit 4 in the small chamber after the durability run and at the same set point as for its initial EF test (row 4(b)). The measured EF for this test was about 1.4, which is in the range of results from the pre-tests conducted on units 1 and 3-5 on the durability test stand (Table 4.6). See discussion about steady-state performance in the following paragraphs. Table 4.7 shows that the 130 °F steady-state COPs from the post-tests were generally slightly lower and discharge temperatures higher than for the pre-tests. This indicates that there may have been some fouling of the tube-in-tube water-to-refrigerant condensers over the course of the 9-month round-the-clock durability test operation. Fouling of the condensers would reduce their effectiveness and lead to higher condensing pressures (and temperatures) and lower performance. In the case of unit 2, recall that we had removed some charge after Stage 1. It, too, exhibited increased discharge temperature but much of this increase could be due to the higher suction temperature (and suction superheat) caused by the reduced charge. Three of the condensers (from units 1, 2, and 3) were sectioned after the testing and indeed there was some evidence of fouling in all three ranging from a dark film to more severe depositions. See discussion in Section 4.3.

42
Table 4.6. Add-on HPWH Energy Factor test results Unit Avg cold
water temp. ºF
Avg. tank temp @ start
ºF
Max avg tank temp
ºF
Avg air temp
ºF
Energy factor
Upper element run time, minutes
Pre-test @ approximate standard conditions 1 48.5 136.9 140.5 67.2 1.32 - 2 55.0 139.5 144.8 67.2 1.08 - 3 53.0 137.1 138.3 67.2 1.44 - 4 54.0 137.4 138.4 67.2 1.45 - 5 53.5 134.0 134.4 67.2 1.52 -
5(a) 58.2 135.2 135.2 66.3 1.37 - Stage 2 conditions
1 60.5 145.6 145.6 87.8 1.34 - 2 65.5 141.4 141.4 88.0 1.26 - 3 63.5 144.7 144.7 88.0 1.47 - 4 62.0 142.5 142.5 88.1 1.51 - 5 61.5 143.0 143.0 88.1 1.51 -
Stage 3 conditions 1 59.5 125.2 125.6 103.9 1.63 - 2 61.0 131.3 134.7 110.6 1.29 - 3 60.5 137.4 137.4 110.6 1.69 - 4 58.0 128.4 136.2 103.7 1.70 - 5 59.5 136.1 136.1 110.7 1.58 -
Stage 4 conditions 1 59.5 123.4 123.8 101.7 1.52 - 2 62.0 126.7 134.7 101.7 1.28 - 3 62.0 133.7 137.6 112.5 1.65 - 4 60.0 127.7 132.0 101.7 1.61 - 5 60.5 131.7 137.3 101.7 1.52 -
Stage 5 Post-test @ approximate standard conditions 1 57.0 144.8 148.6 67.3 1.09 - 2 60.0 142.6 142.6 67.4 1.05 - 3 60.5 140.9 143.1 67.2 1.24 - 4 58.0 141.0 142.8 67.4 1.28 - 5 58.5 139.9 140.0 67.3 1.27 -
4(b) 56.1 134.9 140.6 69.6 1.43 - 5(b) 59.1 139.5 139.5 69.2 1.36 -
(a) Test run prior to installation on durability loop in separate small chamber at DOE Simulated Use Test procedure conditions.
(b) Test run after durability test (after repairing refrigerant leak on Unit 5) in separate small chamber at DOE Simulated Use Test procedure conditions.

43
Table 4.7. Steady-state performance of add-on HPWHs Unit Avg
HPWH capacity
Btu/h
Avg. tank water temp
ºF
Avg condenser water temp
ºF
Avg HPWH power input Watts
Avg discharge
temp ºF
Avg suction temp
ºF
COP
Pre-test @ approximate standard conditions 1 4376.3 130.0 124.5 892.6 146.4 41.0 1.44 2 5168.2 130.0 126.1 1048.5 155.0 42.8 1.44 3 4985.1 130.0 125.0 867.8 167.5 52.3 1.68 4 5105.7 130.0 125.5 893.1 149.1 45.3 1.68 5 4760.2 130.0 128.8 873.8 152.7 39.8 1.60
5(a) 4843.7 130.0 - 905.8 154.9 42.4 1.57 Stage 2 conditions
1 6783.2 130.0 129.1 1027.1 178.4 59.2 1.93 2 5468.7 130.0 127.3 1061.5 198.8 85.2 1.51 3 6549.3 130.0 125.0 960.8 195.3 64.6 2.00 4 6783.2 130.0 130.4 1001.6 177.7 70.2 1.99 5 6783.2 130.0 126.7 947.3 175.8 55.0 2.10
Stage 3 conditions 2 6058.0 130.0 130.0 1114.2 218.1 102.4 1.59 3 7043.6 130.0 132.0 1078.4 228.4 98.2 1.91 4 7292.0 130.0 132.4 1083.4 203.0 88.7 1.97 5 8183.0 130.0 133.5 1151.0 216.1 91.1 2.08
Stage 4 conditions 3 7345.7 130.0 134.3 1140.0 237.6 101.3 1.89 4 6950.2 130.0 130.6 1062.8 200.8 82.7 1.92 5 7123.0 130.0 129.9 1046.4 204.4 79.4 2.00
Stage 5 Post-test @ approximate standard conditions 1 4522.2 130.0 125.8 939.2 163.4 42.3 1.41 2 5320.2 130.0 123.8 997.4 186.4 61.4 1.56 3 4888.8 130.0 126.8 914.2 178.6 51.1 1.58 4 4942.3 130.0 125.2 918.9 163.0 42.1 1.58 5 3768.5 130.0 128.0 798.4 175.0 68.6 1.38
4(b) 5034.1 130.0 129.1 925.0 161.5 47.8 1.59 5(b) 4630.1 130.0 129.7 899.7 165.1 43.2 1.51
(a) Test run prior to installation on durability loop in separate small chamber at DOE Simulated Use Test procedure conditions.
(b) Test run after durability test (after repairing refrigerant leak on Unit 5) in separate small chamber at DOE Simulated Use Test procedure conditions.
44
Note that the post-test COP drop for unit 5 was considerably greater than for the other add-on units. In addition to increased discharge temperature it experienced a large increase in its suction temperature compared to units 1, 3, and 4. This together with its reduced power consumption compared to the pre-test case indicated that it might have lost some refrigerant during the durability run. We examined the unit for refrigerant leaks after the durability run and found that there was a small crack in the expansion device (capillary tube). This resulted in the loss of about 50% of the unit’s charge and contributed to its performance loss. As noted earlier, this leak was repaired before the 5(b) test was run. 24-hour simulated use tests were also done for Stages 2, 3, and 4 conditions. In Stage 2 units 1 and 3-5 achieved Energy Factors (EF) ranging from 1.34 – 1.51. This is very similar to the results in the pre-tests. Unit 2 (running with higher superheat than the other four) achieved an EF of 1.25 under the stage two conditions. This is about a 20% improvement over the 1.08 achieved in the initial tests. The improvement can be attributed mostly to the fact that, after removing some charge as noted earlier, the unit no longer suffered from repeated trips of its high pressure cutout switch. Steady-state performance increased significantly for units 1 and 3-5 due to the higher ambient air temperature (evaporator heat source). Unit 2 efficiency increased only slightly. Again, recall that about 3 oz of refrigerant was removed from this unit prior to Stage 2 to alleviate high discharge pressures. Therefore it operated with higher suction temperatures and suction superheat levels than the other four units in stages 2-5. Stage 3 EFs for units 1 and 3-5 showed an increase over the pre-test and Stage 2 values probably reflecting the fact that tank standby losses under the high ambient conditions of Stage 3 were much lower. Steady-state efficiencies in stage 3 did not change appreciably compared to Stage 2 results. The add-on units do not control the evaporator fan speed as the integral units do thus allowing the suction (and thereby the discharge) temperature to continue to increase with ambient temperature. This results in increased compressor loading which will tend to offset some or all of the efficiency advantage inherent from the higher ambient air temperature (evaporator heat source). EFs and steady-state efficiencies in Stage 4 (low voltage operation) were slightly lower than for Stage 3. Stage 3 steady state values for unit 1 and Stage 4 values for units 1and 2 are not reported because they did not experience steady operating conditions at 130 ºF tank temperature during the EF tests. Electric water heater mode efficiency. As noted earlier, each of the test unit water tanks was subjected to a 24-hr Simulated Use test prior to the beginning of the durability test program (no EWH mode tests were run after the durability testing). Results are summarized in Table 4.8. The measured EFs for tanks 1-5 (used with the add-on HPWHs) operating in standard EWH mode ranged from 0.81 - 0.92. One tank (#2) had the low value and the other four averaged 0.88 (.85 - .92) with the variation within the measurement uncertainty band. Tanks 6-10 (integral HPWHs) operating in EWH mode had EFs ranging from 0.74-0.90. Again one unit (#7) had the 0.74 value while the other four averaged 0.84 (.80-.90) and the variation was generally within the uncertainty of the

45
measurement. Tests 5a and 10a were run in the smaller chamber with much better control of test conditions. These resulted in an EF of 0.85 for tank 10 and 0.90 for tank 5. Tanks 1-5 were standard, off-the-shelf 50-gal electric water heaters. The integral unit tanks were made by the same tank manufacturer but had somewhat less foam insulation than the standard tanks (due to primarily to the presence of the condenser wrap on the bottom half of the tank and also the tank temperature sensor wire conduit, both installed by the HPWH manufacturer before adding the foam insulation to the tank). This most likely accounts for the slightly lower EF values seen for tanks 6-10 as compared to tanks 1-5.
Table 4.8. Energy Factor test results for all tanks in EWH mode
Tank Energy Factor Tank Energy Factor1 0.85 6 0.81 2 0.81 7 0.74 3 0.92 8 0.85 4 0.87 9 0.90 5 0.89 10 0.80 5a 0.90 10a 0.85
a - Test run prior to installation on durability loop in separate small chamber at DOE Simulated Use Test procedure conditions.
Compressor efficiency. After completing the durability testing compressors were removed from four of the integral units. These were returned to the compressor manufacturer for performance testing and tear down analysis (section 4.1). Results of calorimeter tests are given in Table 4.9 along with the manufacturer’s reference values (for new compressors).
Table 4.9. Integral HPWH compressor calorimeter test results (130 ºF saturated condensing temperature; -10 ºF saturated evaporating temperature; 220 Volts, 60 Hz
power supply)
Compressor Test date Capacity(Btu/h)
Power (Watts)
EER (Btu/Wh)
6 April 2004 851.33 215.00 3.96 7 April 2004 833.62 210.01 3.97 8 April 2004 853.41 216.00 3.95 9 April 2004 800.31 205.88 3.89
Referencea - 840.00 215.30 3.90 a Manufacturer’s reference performance in “as new” condition.

46
4.3. Post-test compressor and HPWH tank examinations Integral unit tank and condenser wrap examination. The information presented in this section came primarily from John Hoyt (2004) of EMI (HPWH manufacturer). Four of the five integral HPWHs were cut apart to examine the post-test condition of the condenser and tank. A full report is included in Appendix A and highlights are listed here. These examinations have revealed that the condensers on all of the units remained tightly attached to the tank walls. The condenser wrap is anchored at each end by spot welding or brazing the copper tubing to the tank wall. All of these braze points appeared tight and in good condition. The heat transfer mastic was of a creamy, peanut-butter-like consistency when first applied. After the durability run, the mastic was observed to be somewhat darker in color and to have hardened to a wax-like consistency. There were no signs of crumbling or other breakdown. The glass lining on the inside surface of the tanks appeared to be in very good shape. There was a slight change in the texture of the lining inside the tank opposite the two condenser braze points. However, the lining did not become separated from the tank wall, and did not show evidence of corrosion at the braze points. There was a light uniform coating of scale (most likely CaCO3 (calcium carbonate) or other “hard water related” precipitate) adhering to the tank inside wall. However, since the durability testing was conducted using a closed test loop where the water was repeatedly recirculated, this is not considered to be indicative of what may happen in real residential installations where the water has a high degree of dissolved mineral content. The foam insulation showed no evidence of degradation apart from some discoloration of the insulation that was in direct contact with the top of the condenser coil and the discharge line. Integral unit compressor examination. Table 4.10 provides the compressor manufacturer’s qualitative assessment of the condition of four of the integral unit compressors following the durability run. The wear severity index (WSI) in the last column of Table 4.10 is an approximate average of the wear experienced by each of the compressor components. It is calculated using the following equation developed by the manufacturer for wear evaluation of their own compressor life test results (Doering, 2002).
WSI(i) = [n1(i) + 9n 2(i) + 16n 3(i)]/[n 1(i) + 3n 2(i) + 4n 3(i)], where
i = ith component, n1 = # of mild wear occurrences, n2 = # of moderate wear occurrences, n3 = # of severe wear occurrences, and

47
n = n1 + n 2 + n 3 = total number of compressors in test sample. This approach is designed to weight severe and moderate occurrences much more heavily than mild occurrences in the WSI. If WSI across a given sample is between 1.00 and 2.00, the result is considered good. A range of 2.01 to 3.00 is considered tolerable and anything over 3.01 is considered unacceptable. The bushing component showed the greatest wear in this sample just as it did during the first round of testing (Baxter and Linkous 2002). However, this time the wear pattern differed among the four units and was not considered a long term problem. The compressor manufacturer’s conclusion from the wear evaluation was that all the compressors in this small sample were in “good” condition overall after the durability testing.
Table 4.10. Integral unit compressor posttest component wear evaluation (Doering, 2004) (wear codes: L-slight; 1-mild; 2-moderate; 3-severe)
Compressor 6 7 8 9 Wear
Severity Indexa
Component piston top 1 1 1 1 1.00 piston bottom 1 1 1 1 1.00 cylinder top 1 1 1 1 1.00 cylinder bottom 1 1 1 1 1.00 thrust collar 1 1 1 1 1.00 thrust bearing 1 1 1 1 1.00 crankshaft journal 1 1 1 1 1.00 main bearing 1 1 1 1 1.00 connecting rod end 1 1 1 1 1.00 wrist pin 1 1 1 1 1.00 Bushing 2 2 2 1 2.80 crank pin 2 1 1 1 2.00 discharge valve LCLb LCL LCL LCL 1.00 Springs 1 1 1 1 1.00 spring holder 1 1 1 1 1.00
a weighted average value of wear for component with moderate and severe occurrences weighted more heavily than mild or slight occurrences b CL – coloring
Analyses of used oil from the four compressors indicated no appreciable degradation according to the compressor manufacturer’s report (Doering 2004). Integral unit CMS. Examination of the evaporator drain pans on the two integral units equipped with the optional CMS system revealed a large amount of rust-like deposition on the CMS heater and residue on the drain pan surface. These deposits developed after about 1000 repetitive cycles and 1300 hours of operation of the CMS heater during the hot and humid portions of the durability run. Figure 4.12 illustrates the corrosion found

48
on unit 9. No such deposits were found on units 6, 8, or 10, none of which had the CMS option.
Figure 4.12. Drain pan and CMS heater on integral unit 9 after durability test run. Add-on units. Three of the condensers (from units 1, 2, and 3) were sectioned after the testing to check for evidence of fouling. Figure 4.13 shows sections from the condensers that illustrate the range of surface conditions found. The most severe fouling observed occurred at the point where water exits and refrigerant enters (hottest point) the heat exchanger. The condenser from unit 3 showed fairly heavy, whitish deposits at this point. Condenser 2 exhibited a less heavy and darker deposition at this same point. Deposition on condenser 1 surface at this point was whitish but not as heavy as for condenser 3 (see Figure 4.14). On most of the surfaces, only a darkish film deposition was observed. The scale build up was most likely due to calcium carbonate (CaCO3) precipitation from the water in the test loop. This will likely be a problem for these type tube-in-tube condensers depending upon the hardness of the local water. It can be limited somewhat (but not eliminated) by limiting the maximum hot water set point temperature (perhaps 120 to 130 °F or less). This will limit the water temperature in the condenser and reduce deposition rates. During this durability test water temperatures in the condensers of the add-on units exceeded 145 °F.
CMS heater

49
Figure 4.13. Add-on unit condenser surfaces after durability test run showing surface depositions.
Figure 4.14. Cross-section of add-on unit condenser 1 at water exit point.
Water exit point, condenser 3
Water exit point, condenser 2
Mid- point, condenser 3
Mid- point, condenser 1

50
As noted in the previous section, unit 5 developed a crack in its capillary tube, which resulted in the loss of about 50% of its refrigerant charge. The crack developed near the end of the durability test period. Since none of the other add-on units suffered any similar problem nothing definitive can be said about the cause of this particular incident. The tube in that unit may simply have had an inherent weakness. Or continual vibration over the course of the repetitive on/off cycling during the durability test could have caused a fatigue failure, however no excessive vibration of the capillary tube was noted during observations of unit operation with the cover off. One other thing we noted in the post examination was that insulation on the electric power wire leading from the compressor relay to the compressor had apparently been overheated and in some cases burned off on units 2-5. Figure 4.15 illustrates this condition on unit 3. The insulation is seen to be somewhat charred and some has flaked off. Wire conditions were similar on units 2, 4, and 5. No problem was seen on unit 1. Switching to a wire size capable of greater current capacity would eliminate this problem.
Figure 4.15. Add-on unit compressor power wiring; typical of condition found on units
2-5 after durability test.
Compressor relay
Power wire to compressor
51
5. Observations and Recommendations Based on the operational experience and test results from the 9-month durability run, the following observations and recommendations are noted. The basic heat pump system hardware seems to be very robust for both the integral and add-on units. During the entire durability run no compressor, fan, or electric failures were experienced. All of the units reliably produced hot water throughout all stages of the test protocol.
1. The units’ efficiency as compared to an EWH baseline was very good.
Energy factors (EF) of the add-on units measured using the standard DOE test procedure was about 1.4 (about 60% better than the minimum required of EWHs, 0.86). The integral units had EFs of 2.3 – 2.4 (about 260% higher than the EWH minimum).
2. Efficiency of the integral HPWHs did not appear to have degraded significantly as a result of undergoing over 7000 repetitive duty cycles.
3. Energy factors for the add-on units did not appear to degrade significantly as indicated from results of standard tests before and after the durability test. However, small steady-state efficiency degradations (about 2-6%) were seen on four of the units most likely due to fouling caused by scale buildup on the waterside surface of their tube-in-tube refrigerant-to-water condensers. The scale build up was most likely due to calcium carbonate (CaCO3) precipitation from the water in the test loop. This will likely be a problem for HPWHs with these type tube-in-tube condensers depending upon the hardness of the local water. It can be limited somewhat (but not eliminated) by limiting the maximum hot water set point temperature (perhaps 120 to 130 °F or less). This will limit the water temperature in the condenser and reduce deposition rates. During this durability test water temperatures in the condensers of the add-on units exceeded 145 °F regularly.
4. One of the add-on units (#5) developed a leak in its capillary tube late in the durability test that resulted in loss of about 50% of its refrigerant charge. This caused about an 8-10% steady-state efficiency loss. Since none of the other add-on units suffered any similar problem nothing definitive can be said about the cause from these results alone. Following normal assembly procedures for capillary tubes and instituting a rigorous quality assurance procedure to verify correct assembly should minimize any such occurrences.
5. Assembly quality of the add-on units was inconsistent from unit to unit. A number of problems were noted when the units were received. These included leaking evaporator drain pans, evaporator fan not secured to unit housing, blocked air outlet, and poorly secured power cords. In addition one unit (Unit 2) had a refrigerant leak upon receipt. A rigorous factory quality assurance program could have prevented all of these occurrences and is highly recommended.

52
6. Post-test examination of the CMS-equipped integral HPWHs revealed a considerable amount of rust-like deposits on both the CMS condensate heaters and the evaporator drain pans. The units without the CMS exhibited no deposits in their drain pans. In all other respects the integral unit tanks and heat pump components appeared to have suffered no degradation during the testing (see Appendix A). Examination of the integral unit compressors (by the compressor manufacturer) after the tests revealed no loss in efficiency and no significant wear compared to “as new” units.
7. The control system of the integral HPWHs operated reliably throughout the test. The only problems occurred after a test loop outage resulted in inadvertent exposure of the units to extremely hot and humid conditions (>135 °F dry bulb and >125 °F dew point). Two control boards and two temperature sensors failed after 12 hrs exposure to these conditions. However, it is not likely that a residential water heater will be installed where such ambient conditions are expected to be prevalent. So this is not considered to be a long-term reliability problem.
8. The add-on unit controls did not experience any failures that caused unit shutdown or cessation of hot water production throughout the test period. The temperature indicator however did not accurately reflect the actual tank water temperature. For the five units we tested the controller temperature indication was from 20 °F to 30 °F lower than the actual tank average water temperature at thermostat shutoff. This situation could lead to increased risk of scalding if a user were to choose a 130 °F set point for instance. In addition, the controllers experienced a set point drift during Stages 3 and 4 (hot and humid ambient conditions). During those stages the controllers consistently shut the HPWHs off at tank temperatures of up to 10-15 °F lower than in Stages 1 and 2. See Figures 4.2 – 4.6. It is essential that the controller temperature indicator be calibrated to accurately indicate the real tank water temperature before the product leaves the factory. This should be a part of the recommended quality assurance program.
Acknowledgments The authors wish to acknowledge Richard Orrison, U. S. Department of Energy for his enthusiastic support of this durability testing effort and John Tomlinson for his perseverance and leadership of the HPWH development efforts at ORNL. Appreciation is expressed to John Hoyt, EMI, who provided the five integral HPWHs for the test program. Hoyt also personally conducted much of the post-test examination work of the integral HPWH condensers and tanks as reported in Appendix A. Ryan Doering, Embraco NA, provided crucial assistance in the post-test examination of the HPWH compressors. Duane Hallowell of Nyle Special Products provided assistance in evaluating add-on unit results. This report is an account of research sponsored by the U. S. Department of Energy, Office of Building Technology, State and Community Programs under contract number DE-AC05-00OR22725 with UT-Battelle LLC.

53
References Appliance Magazine, 22nd Annual Portrait of the U.S. Appliance Industry, Vol. 56, No. 9, pg 79, September 1999. Appliance Magazine, 23rd Annual Portrait of the U.S. Appliance Industry, Vol. 57, No. 9, pg 79, September 2000. Appliance Magazine, 24th Annual Portrait of the U.S. Appliance Industry, Vol. 58, No. 9, pg 55, September 2001. Appliance Magazine, 25th Annual Portrait of the U.S. Appliance Industry, Vol. 59, No. 9, pg 79, September 2002. Appliance Magazine, 26th Annual Portrait of the U.S. Appliance Industry, Vol. 60, No. 9, pg 79, September 2003. Baxter, V. D. and R. L. Linkous, Durability Testing of a Drop-In Heat Pump Water Heater, ORNL/TM-2002/92, May 2002. Doering, R., Embraco NA. Personal communication to Van D. Baxter, January 18, 2002. Doering, R., Embraco NA. Personal communication to Van D. Baxter, May 17, 2004. Federal Register/ Vol. 63, No. 90/ Monday, May 11, 1998/ Rules and Regulations/ pp 26012 – 26015. Hoyt, J., EnviroMaster International (EMI). Personal communication to Van D. Baxter, February 4, 2004. Murphy, R. W., personal communication to Van Baxter, November 2001. Murphy, R. W. and J. J. Tomlinson, Field Tests of a “Drop-In” Residential Heat Pump Water Heater, ORNL/TM-2002/207, September 2002. Murphy, R. W. and V. D. Baxter, “Accelerated Life Test and Field Test Performance Results for an Integral Heat Pump Water Heater,” to be published in Proceedings of the International Mechanical Engineering Congress & Exposition, November 13-19, 2004. Tomlinson, J. J., Transmittal letter to E. R. Kweller (DOE), March 2000. U.S. Patent No. 5,906,109, “Heat Pump Water Heater and Storage Tank Assembly,” May 25, 1999. U.S. Patent No. 5,946,927, “Heat Pump Water Heater and Storage Tank Assembly,” September 7, 1999.

54
Appendix A - Integral Heat Pump Water Heater Post Durability Test Examination
Source: Hoyt, 2004.
A1.0 Introduction: When the durability test run was complete, ORNL returned tanks numbered 6,7,8,and 9 (Tank # 10 remained at ORNL) on January 22, 2004 to the manufacturer (EMI) for examination, and one unit remained at ORNL for reference. Compressors were removed from the units and returned to the compressor manufacturer (Embraco) for separate evaluation. Tanks #6 and #8 used a standard condensate drain as a means of disposing condensate produced by the heat pump. Tanks #7 and #9 were equipped with a factory-installed condensate management system (CMS), in which a small electric resistance heater is used to boil off condensate that is collected in the drain pan. Each tank was dissected, and thoroughly examined for degradation of components and assembly processes. Figure A1 illustrates one of the tanks with metal shell and foam insulation removed to show the condenser wrap.
Figure A1. Integral HPWH tank with insulation removed showing condenser wrap.

55
A2.0 Observations common to all units: A2.1.0 External Observations – Figures A2-A4 are a typical representation of the four units that were returned to EMI. No evidence of condensate leakage, or water infiltration was present inside the element covers or at the electric power connection point (Figures A3 and A4).
Figure A2. Integral unit as received by EMI (typical of all four).
Figure A3. View inside upper element access cover.
Figure A4. View inside power connection cover.
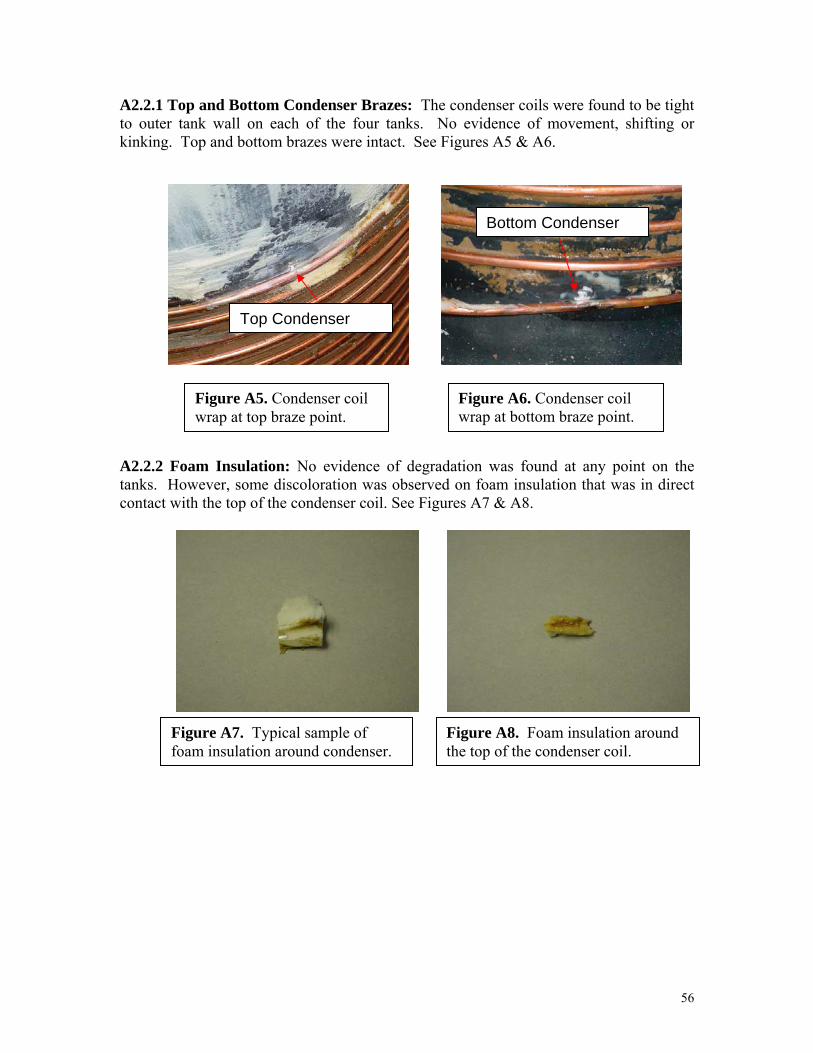
56
A2.2.1 Top and Bottom Condenser Brazes: The condenser coils were found to be tight to outer tank wall on each of the four tanks. No evidence of movement, shifting or kinking. Top and bottom brazes were intact. See Figures A5 & A6.
A2.2.2 Foam Insulation: No evidence of degradation was found at any point on the tanks. However, some discoloration was observed on foam insulation that was in direct contact with the top of the condenser coil. See Figures A7 & A8.
Bottom Condenser
Top Condenser
Figure A5. Condenser coil wrap at top braze point.
Figure A6. Condenser coil wrap at bottom braze point.
Figure A8. Foam insulation around the top of the condenser coil.
Figure A7. Typical sample of foam insulation around condenser.

57
A2.2.3 Sediment / Scale: Anode rods on all units were essentially dissolved, with the exception of the steel core, and approximately 6” of anode at the bottom. See Figure A9. The thin (approximately 1/8”) coating of sediment / scale that is shown in Figure A10 is typical of what was present on all tanks
A2.2.4 Plastic Shrink Wrap: Shrink wrap was applied to the condenser wrap prior to foaming the tanks to prevent the foam insulation from entering area between condenser coil and tank wall. It was found to be slightly brittle, but intact.
A2.2.5 Heat Transfer Compound: This compound is applied between the condenser and tank wall to enhance heat transmission. It was found to be slightly discolored, but remained in place and had solidified to a wax-like texture. See figure A11.
Anode Rod
Dip Tube
Resistance Elements
Sediment & Scale on interior tank wall
Figure A9. Condition of anode rod and cold water inlet dip tube.
Figure A10. Tank interior – condition at end of test.
Figure A11. Condenser wrap and heat transfer compound.

58
A2.2.6 Glass Lining: A slight change in the texture of the glass lining inside the tank was noted opposite the condenser braze points. See the highlighted section in Figure A12. The glass lining did not become separated from the tank wall, and did not show evidence of degradation or corrosion at the braze points.
A3.0 Observations NOT common to all units:
Condensate drain pan: Condensate drain pans from units #6 and #8 (gravity drain) had a slight coating of scale, and minor surface rust formation where condensate came in contact. See Figure A13. Condensate drain pans from units #7 and #9 (condensate management system – CMS) had a heavy coating of rust present on the drain pan, and heater where condensate came in contact. See Figure A14.
Figure A12. Glass lining opposite condenser braze point inside tank.
Figure A13. Non-CMS condensate pan condition.
Figure A14. Condensate pan from CMS unit.

59
A4.0 Summary -
The overall condition of the units appeared to be very good considering they were in operation for a time frame equivalent to 10 years. Observations and findings from this examination were similar to those of the first durability test. Concerns regarding the degradation of the foam insulation, glass lining of the tank, and integrity of condenser brazes have proven to be unfounded.