heathfield stage 1 surface water management plan
TRANSCRIPT

Heathfield Stage 1 Surface Water Management Plan
Final Report
April 2015
East Sussex County Council
County Hall
St Anne's Crescent
LEWES
East Sussex
BN7 1UE

i
JBA Project Manager Rachel Huitson-Little Aberdeen House South Road Haywards Heath West Sussex RH16 4NG
Revision History
Revision Ref / Date Issued Amendments Issued to
Draft Report v1 / February 2014
N/A
Tom Schindl (East Sussex County Council) Early issue - still requires final JBA QA and sign off
Draft Report v2 / February 2014
Minor text amendments (following internal QA)
Tom Schindl (East Sussex Country Council
Final Report v3 / March 2014
Minor text amendments (following ESCC review)
Tom Schindl (East Sussex County Council)
Draft Report v4 / April 2014 “Way Forward” section amended following ESCC review
Tom Schindl (East Sussex County Council)
Final Draft v5 / April 2015 Further text amendments undertaken by ESCC
Tom Schindl (East Sussex County Council)
Contract This report describes work commissioned by Nick Claxton, on behalf of East Sussex County Council, by a letter dated 15/03/2013. East Sussex’s representative for the contract was Tom Schindl. Jenny Hill and Matthew Roberts of JBA Consulting carried out this work.
Prepared by .................................................. Jennifer Hill BSc MSc
Analyst
Reviewed by ................................................. Rachel Huitson-Little MSc CEnv MCIWEM C.WEM
Director
Purpose This document has been prepared as a Draft Report for East Sussex County Council. JBA Consulting accepts no responsibility or liability for any use that is made of this document other than by the Client for the purposes for which it was originally commissioned and prepared.
JBA Consulting has no liability regarding the use of this report except to East Sussex County Council.
Acknowledgements JBA would like to acknowledge and thank Wealden District Council, Southern Water, the Environment Agency and East Sussex County Council for all their assistance during this project.

ii
List of Figures Figure 1-1: A map to identify the location of ordinary watercourses in Heathfield ................... 3
Figure 1-2: A figure to illustrate the integration of flood mechanisms. ..................................... 4
Figure 1-3: A map of Heathfield, the underlying geology and the surrounding constraints to development. ........................................................................................................ 5
Figure 3-1: The GeoPDF flood risk and recorded flooding incidents in Heathfield. ................. 12
Figure 3-2: A map of the flooding hotpot - Waldron Thorns ..................................................... 14
Figure 3-3: A photo from the site visit to Waldron Thorns showing a completely blocked gulley grate. .............................................................................................................. 15
Figure 3-4: A conceptual model to explain the surface water runoff problem in Heathfield ...... 15
Figure 3-5: A map of the flooding hotpot - Meadow Way ......................................................... 16
Figure 3-6: A map of area covered by the surface water flood risk quantification analysis ..... 17
Figure 3-7: The total number of receptors affected by deep water flooding at a 1 in 200 year return periods ................................................................................................... 19
Figure 4-1: Strategic development areas identified in Heathfield. ............................................ 20
Figure 5-1: Action plan flow diagram, applicable where asset condition has been attributed as the flood source. .................................................................................................. 26
List of Tables Table 1-1 Report layout ............................................................................................................. 7
Table 2-1 Partners involved in the SWMP process ................................................................... 8
Table 2-2 Stakeholders involved in the SWMP process ........................................................... 8
Table 2-3 Catchment data and data supplier ............................................................................ 9
Table 2-4 Flood risk modelling data and supplier ...................................................................... 9
Table 2-5 Data quality scoring system ...................................................................................... 10
Table 2-6 Received data and allocated quality score ................................................................ 10
Table 3-1 Source of flooding colour coding system .................................................................. 12
Table 3-2 Sewer flooding incidents, colour coding system ....................................................... 13
Table 3-3 Number of receptors in Heathfield at risk from surface water flooding ..................... 17
Table 3-4 Number of receptors in Waldron Thorns, Heathfield at risk from surface water flooding ..................................................................................................................... 18
Table 3-5 Number of receptors in Meadow Way, Heathfield at risk from surface water flooding ..................................................................................................................... 18
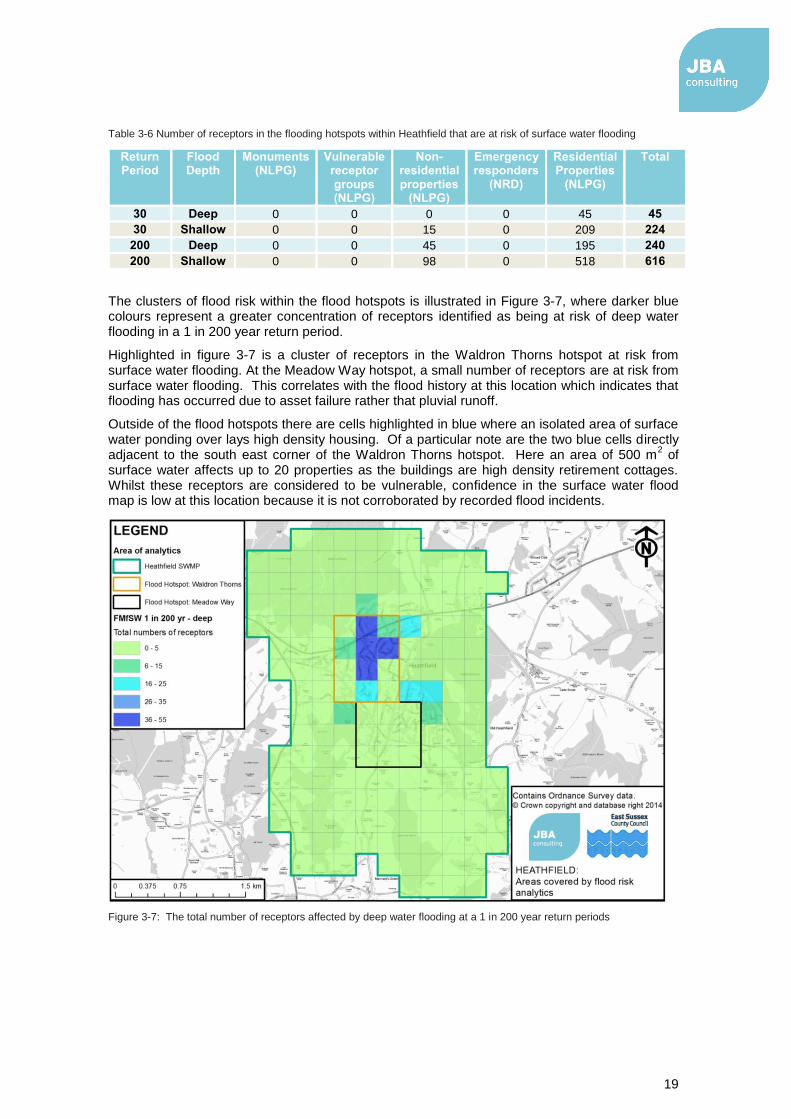
Table 3-6 Number of receptors in the flooding hotspots within Heathfield that are at risk of surface water flooding .............................................................................................. 19
Table 5-1 Asset condition grade assessment taken from the Condition Assessment Manual ...................................................................................................................... 25
Table 5-2 Site specific actions priories according to repeated incidents occurring after 2000……………………………………………………………………………..…..27

iii
Abbreviations AONB .............................. Area of Outstanding Natural Beauty
AStGWF .......................... Areas Susceptible to Ground Water Flooding
AStSWF .......................... Areas Susceptible to Surface Water Flooding
BGS ................................ British Geological Society
CAM ................................ Condition Assessment Manual
CFMP .............................. Catchment Flood Management Plan
CIL .................................. Community Infrastructure Levy
DAP ................................. Drainage Area Plan
DRN ................................ Digital River Network
FRA ................................. Flood Risk Assessment
ESCC .............................. East Sussex County Council
FMfSW ............................ Flood Map for Surface Water
LLFA ............................... Lead Local Flood Authority
LFRMS ............................ Local Flood Risk Management Strategy
NLPG .............................. National Land and Property Gazetteer
NRD ................................ National Receptors Database
RFCC .............................. Regional Flood and Coastal Communities
RMA ................................ Risk Management Authority
SAB ................................. SUDS Approving Body
SDA ................................. Strategic Development Area
SFRA .............................. Strategic Flood Risk Assessment
SUDS .............................. Sustainable Drainage Systems
SWMP ............................. Surface Water Management Plan
uFMfSW .......................... updated Flood Map for Surface Water

Contents
Executive Summary ................................................................................................................. .Error! Bookmark not defined.
List of Figures……………………………………………………………………………….…….…..ii
List of Tables……………………………………………………………………………...……...……ii
Abbreviations……………………………………………………………………………..…………..iii
1 Introduction ................................................................................................................. 1
1.1 What is a surface water management plan .................................................................. 1 1.2 Summary of aims and objectives .................................................................................. 1 1.3 Stages of SWMP development ..................................................................................... 2 1.4 Sources of flood risk ..................................................................................................... 2 1.5 Study area .................................................................................................................... 4 1.6 Using this report ............................................................................................................ 7
2 Preparation .................................................................................................................. 8
2.1 Partnership approach ................................................................................................... 8 2.2 Data collation and review.............................................................................................. 8 2.3 Source Pathway Receptor ............................................................................................ 11
3 Communicating the risk ............................................................................................. 11
3.1 GeoPDF ........................................................................................................................ 11 3.2 Priority areas ................................................................................................................. 14 3.3 Quantifying surface water flood risk ............................................................................. 16
4 Planning ....................................................................................................................... 20
4.1 Local Development Framework .................................................................................... 20
5 SWMP Action Plan ...................................................................................................... 21
5.1 Monitoring the Action Plan ............................................................................................ 21 5.2 Communicating the Action Plan ................................................................................... 21 5.3 Using SUDs .................................................................................................................. 22 5.4 Strategic options ........................................................................................................... 23 5.5 Quick wins .................................................................................................................... 24 5.6 Generic actions ............................................................................................................. 24 5.7 Location specific actions ............................................................................................... 27 5.8 Site specific actions ...................................................................................................... 28 5.9 Future revisions ............................................................................................................ 28 5.10 Way forward .................................................................................................................. 28
Appendices............................................................................................................................... 29
A Appendix - Data Register and Quality Score ........................................................... 29
B Appendix - GeoPDF .................................................................................................... 29
C Appendix - Flood History Table………………………………………………...…………29
D Appendix - Site Specific Action Plan ........................................................................ 29

1
1 Introduction
1.1 What is a surface water management plan
A Surface Water Management Plan (SWMP) is a study to understand the flood risk that arises from local flooding, which is defined by the Flood and Water Management Act 2010 as flooding from surface water runoff, groundwater and ordinary watercourses.
SWMPs are led by a partnership of flood risk management authorities who have responsibilities for aspects of local flooding, including the County Council, Local Authority, Sewerage Undertaker, Internal Drainage Boards and other relevant authorities.
Heathfield has been identified as an area potentially at risk of local flooding in the East Sussex Local Flood Risk Management Strategy (LFRMS).
The purpose of a SWMP is to identify what the local flood risk issues are, what options there may be to prevent them or the damage they cause and who should take these options forward. This is presented in an action plan which lists the partners who are responsible for taking the various options forward. The action plan, which will be reviewed periodically, is agreed by all project partners to tackle the flood risks that are identified.
This SWMP was commissioned by East Sussex County Council (ESCC) to investigate the local flood risks across the urban centre of Heathfield as part of its remit for strategic oversight of local flood risk management in East Sussex, under the Flood and Water Management Act 2010.
1.2 Summary of aims and objectives
The aims and objectives of the Heathfield Stage 1 (Risk Assessment Phase) SWMP are:
1. Establishment of a local partnership.
2. The collection and collation of a comprehensive flood history for relevant local flood risk sources.
3. The identification, collation and mapping of all available flood data and its availability for future use, including an assessment of the reliability of the data.
4. The identification, where possible from the available data, of flood-prone areas.
5. The identification of areas where existing data may be missing, compromised or unreliable as a consequence of inappropriate local assumptions, additional local features (such as flood barriers) or for any other reason together with options to improve confidence in the overall outcome.
6. The identification of areas where flood risk originates from a combination of sources (for example from rivers and highway run-off).
7. Identification of any proposed or allocated developments within the study area together with the likely impact on flood risk that they may have.
8. The preparation of source pathway receptor models for all the risks and sources that have been identified.
9. The identification of any “easy win” opportunities that may become apparent without further work being considered necessary. These may include changes to planning policies or simple flood defence measures.
10. To provide the relevant local planning authorities with data in a form to support the review of their strategic flood risk assessments.
11. To provide a clear plan for further work that may be considered necessary to manage or improve clarity of the flood risks identified in the report. These should include, but are not limited to, ownership of the actions required for risk mitigation, a timescale for these actions together with indicative capital costs.

2
1.3 Stages of SWMP development
The SWMP was prepared across a series of three stages, as follows:
Preparation: Building a partnership of risk management authorities (RMAs). Gathering evidence of and information about flooding.
Risk Assessment: Undertaking a coarse assessment of flood risk to determine the highest risk locations and the key issues upon which the action plan should focus, using publicly available datasets in combination with local records of flooding.
Action Plan: Preparation of an action plan that identifies a range of recommended actions for the reduction of flood risk across the SWMP area. The action plan will:
outline the actions required and where and how they should be undertaken;
set out which partner(s) or stakeholder(s) is/are responsible for implementing the actions and who will support them;
provide indicative costs; and
identify priorities.
1.4 Sources of flood risk
One of the purposes of a SWMP is to identify what the local flood risk issues are, and to summarise the flood history and predicted flood risk to the area. Flood risk can arise from a number of sources, as listed within this section.
1.4.1 Watercourses
Main River
A Main River is any watercourse which is designated as such on the Environment Agency's Main River Map, and for which the Environment Agency has responsibilities and powers. Main Rivers are generally the larger arterial watercourses but smaller watercourses can be designated if they pose a significant flood risk. Where fluvial flooding from main rivers is the sole source of flooding, it is the responsibility of the Environment Agency. Actions to mitigate fluvial flooding from Main River are outside the scope of a SWMP, and are addressed in a Catchment Flood Management Plan (see section 1.5.1), or other local more detailed studies. However, consideration of Main River flooding should be made in SWMPs to examine how fluvial flooding interacts with other, local flood sources.
In Heathfield, none of the watercourses have been designated as Main Rivers.
Ordinary Watercourse
An Ordinary Watercourse is a statutory type of watercourse in England and Wales. They include rivers, streams, ditches, drains which do not form part of a main river. Wealden District Council has permissive powers to carry out works on ordinary watercourses. ESCC has responsibilities in relation to consenting and enforcement.
The Waldron Gill is an Ordinary Watercourse flowing through Heathfield (Figure 1-1). Additionally there are two unnamed watercourses which drain the south east of the town; these have been termed Drain 1 and Drain 2 in Figure 1-1 for reference.

3
Figure 1-1: A map to identify the location of ordinary watercourses in Heathfield
1.4.2 Sewers
Sewers describe the below ground infrastructure for the conveyance of waste water. They are categorised by the type of waste water they remove. The categories include:
Foul sewer;
Surface Water sewer;
Combined sewer; and
Treated effluent.
Foul sewers and treated effluent both convey waste water. Surface water sewers convey collected pluvial runoff and combined sewers convey a mix of both foul water and surface water.
Southern Water is responsible for the sewer networks in this area. As partners in the SWMP process, Southern Water has provided records of their assets in Heathfield.
Heathfield is part of a larger network including Horam, Broad Oak and Cross-in-Hand which is served by Vine Cross sewage treatment works. The sewer records indicate that there is a separate sewer system for the waste and surface water runoff. The foul water network conveys industrial and household waste water. Areas local to the ordinary watercourses are also served by a surface water sewer system to convey pluvial runoff, these networks then discharge to the watercourses.
The records do not show any combined sewer network. In some instances, this would mean that all the areas not covered by surface water sewers are drained to soakaways. However, the Wealden Group geology is fairly impermeable and not very compatible with the use of soakaways, therefore widespread use is unlikely. It has been assumed that some of the sewers labelled as foul network, where there is not an accompanying surface water sewer, in fact

4
receive a combination of waste water and surface runoff. This is unconfirmed with local data, and further investigation would be beneficial.
For the purpose of this study, the surface water sewer network is the main emphasis.
Sewer flooding from the foul water network is the sole responsibility of Southern Water. However, foul water flooding has been considered in the SWMP to examine interactions between foul sewer surcharge and other local flood sources. A storm response on a foul water sewer network is often caused by misconnections from the surface water network. Therefore, by addressing the surface water issues in the catchment this in some cases can help relieve problems on the foul water network.
It should be noted that a spill of foul or combined sewage presents a local water quality issue. Despite water quality not being the principal driver for this project, a SWMP could provide a framework for improving the quality of water. Actions resulting from this SWMP such as SuDS could result in an improvement in quality of water.
1.4.3 Surface water
Surface water flooding occurs when rainfall fails to infiltrate to the ground or enter the drainage system. Ponding generally occurs at low points in the topography. The likelihood of flooding is dependent on not only the rate of runoff but also the condition of the surface water drainage system (i.e. surface water sewers, ESCC Highways drains and gullies, open channels, ordinary watercourses and SuDS).
1.4.4 Integrated flood risk
In an urban environment such as Heathfield, flooding mechanisms are closely related or integrated. The flood mechanisms and how they interact has been conceptualised in Figure 1-2.
Figure 1-2: A figure to illustrate the integration of flood mechanisms.
1.5 Study area
Heathfield is a small market town in the district of Wealden. Expansion of the town is limited by the surrounding High Weald Area of Outstanding Natural Beauty (AONB). As a result, the recent growth has been focused in the town.
The underlying geology is Ashdown Formation which is primarily composed of sandstone, siltstone and Weald Clay. This relatively impermeable geology encourages surface water runoff. There are no superficial deposits in Heathfield.

5
The unnamed watercourses (referred to in this document as Drain 1 and Drain 2) drain the east of Heathfield and converge at Old Mill Pond, south of Heathfield to form the upper reaches of Cuckmere River. The Waldron Ghyll originates in Heathfield and according to Environment Agency’s river network data, the source is in residential curtilage along the back of Downsview, the Ghyll then flows southwards where it discharges to the Cuckmere River.
The small, urbanised upstream catchment and the impermeable geology cause these watercourses to respond quickly to rainfall. This ‘flashy’ response facilitates wash off of surface sediment and erosion of the bed of watercourses. As a result bank erosion and sediment deposition are common problems in Heathfield. Despite erosion not being the principal driver for this project, the cause of erosion is surface runoff and the resultant deposition of sediment blocking drainage networks. As a result, surface water runoff has a direct impact on erosion rates and the subsequent mobilisation, transportation and deposition of sediment erosion influences surface water flooding. Therefore, actions resulting from this SWMP such as land use changes could result in a reduction of erosion and sediment transport.
A map of the study area, describing the geology and the local restrictions to development is shown in Figure 1-3.
Figure 1-3: A map of Heathfield, the underlying geology and the surrounding constraints to development.
Currently, no hydrological analysis or hydraulic modelling has been undertaken for any of the watercourses in Heathfield.
1.5.1 Catchment Flood Management Plan
A Catchment Flood Management Plan (CFMP) is a high-level planning strategy document through which the Environment Agency works with key decision makers within a river catchment to identify and agree policies to secure the long-term sustainable management of fluvial flood risk. Heathfield falls within the High Weald policy unit of the Cuckmere and Sussex Havens CFMP.
The proposed actions relevant to Hailsham are:

6
Work with Wealden District Council to influence spatial development with the aim of ensuring no net increase in run-off from new developments; and
Work with Wealden District Council and the water companies to develop a SWMP for Heathfield to review capacity and vulnerability of groundwater, soil percolation, watercourses, foul and surface water sewers and consider the effects of new development.
1.5.2 National mapping
The Environment Agency has undertaken a number of national scale modelling and mapping projects to understand relative flood risk across England and Wales.
Fluvial
The flood map of fluvial flood risk in England and Wales was originally created on a national scale for all the main rivers. The mapping is continually updated as more detailed, local flood mapping studies are undertaken by the Environment Agency. As discussed in section 1.4.1, flooding from fluvial (main river) sources alone is not within the scope of a SWMP, but this mapping can be useful to examine how and if flood risk from different sources combine to produce a flood event. As there are no main rivers in Heathfield, the fluvial flood maps are not applicable to this SWMP.
Surface Water
There are two sources of information available from the Environment Agency, relating to the identification of potential surface water flood risk in Heathfield. These are:
Areas Susceptible to Surface Water Flooding (AStSWF) - Since July 2009, these maps have been available to Local Resilience Forums and Local Planning Authorities, and provided a starting point in understanding the broad areas where surface water flooding is likely to be an issue.
Flood Maps for Surface Water (FMfSW) - These followed on from the AStSWF maps and provide a more realistic representation than the AStSWF maps in many circumstances. The Environment Agency considers this to be the national source of information
1. The Stage 1 SWMP utilised this dataset.
It should be noted that shortly prior to finalising the SWMP, the Environment Agency had updated the national surface water mapping. The updated Flood Map for Surface Water (uFMfSW) is the result of a more refined modelling methodology which aims to provide more accurate representation of surface water flood risk across England and Wales.
Ground Water
Areas Susceptible to Ground Water Flooding (AStGWF) are identified in a 1 kilometre square grid of England and Wales. It shows the proportion of each grid square where the geological and hydro-geological conditions show that groundwater might emerge
2.
1.5.3 Drainage Area Plan (DAP)
A Drainage Area Plans (DAP) has been undertaken by Southern Water corving the area draining to Heathfield sewage treatment works. A DAP includes building and verifying a model of the sewer network. For the Heathfield DAP, only the foul water network has been modelled as this represents a greater risk and larger investment than the surface water sewer system for Southern Water. Therefore, the results from the DAP used in the SWMP refer solely to flooded foul water manholes.
1 Environment Agency (2012) Flooding from Surface Water - available at http://www.environment-
agency.gov.uk/research/planning/109490.aspx 2 Environment Agency (2012) Areas Susceptible to Ground Water Flooding - available at
http://www.geostore.com/environment-agency/WebStore?xml=environment-agency/xml/dataLayers_ASGWF.xml

7
1.6 Using this report
Table 1-1 has been produced as a directory to this report. The description forms an overview of the contents of each chapter.
Table 1-1 Report layout
Section Description of contents
1. Introduction This section defines objectives of the Stage 1 SWMP and describes the background of the study area.
2. Preparation
This section provides a summary of the key partners consulted, data collected and a brief summary of the historic flooding collected. It introduces the source-pathway-receptor model and outlines how local sources of flood risk have been assessed.
3. Communicating the Risk This section details how the data outcomes of this SWMP have been summarised. It introduces the use of GeoPDFs.
4. Planning This section summarises development areas in Heathfield and what the flood risk from local sources is.
5. Sustainable Drainage Systems This section provides an introduction to SuDS, what systems could be appropriate in Heathfield and the potential benefits.
6. SWMP Action Plan Provides details of the generic and location specific Action Plan and potential funding opportunities.
Appendix A - Data Review Spreadsheet listing of the data provided by the key partners for use in this project and a score according to data quality.
Appendix B - Mapping GeoPDFs
Appendix C - Flood History Table Spreadsheet listing the flood incidents recorded in Heathfield referenced with a unique ID.
Appendix D - Location specific action plans Spreadsheet listing of actions associated with each flood history point referenced with a unique ID.
Other deliverables Shapefiles and Arc Projects as a map package

8
2 Preparation
2.1 Partnership approach
Within Heathfield, flood risk is managed by multiple agencies, including the County Council, the District Council, the Environment Agency and Southern Water. Often, urban flooding is caused by multiple mechanisms, which fall under the jurisdiction of different agencies. Therefore, a holistic approach is required to manage a flooding issue. As such partnership working is a key emphasis in East Sussex's SWMP process.
To fully understand flood risk in Heathfield the SWMP has strived to collate all the available records of flood history and modelling of flood risk. This data has been collected from the project partners. Using this data, an action plan has been drawn up which attributes specific project partners as owners of the action. Again, the importance of partner engagement is crucial here so that agreed actions are followed through to completion.
The partnership approach also enables effective resource allocation and efficiencies to be achieved by sharing common duties between co-operating agencies.
2.1.1 Project partners
For the purpose of this project, partners are defined as organisations with responsibility for the decision that needs to be taken to manage flood risk. The partners involved in the Heathfield SWMP are listed in Table 2-1.
Table 2-1 Partners involved in the SWMP process
Organisation Representative(s)
East Sussex County Council Nick Claxton, Tom Schindl and Revai Kinsella
Wealden DC Drainage Engineer Graham Kean
ESCC Highways Mark Andrew
Environment Agency Peter Waring
Southern Water Mike Tomlinson
The project partners have supplied the data to inform this SWMP and have been attributed as action owners in Section 5 of the SWMP Action Plan.
In addition to the above, additional stakeholders have been involved in the SWMP. These parties are not responsible for managing flood risk but do hold information useful to the SWMP process. These stakeholders are listed in Table 2-2.
Table 2-2 Stakeholders involved in the SWMP process
Organisation Representative
Wealden District Council Marina Brigginshaw (Planning Policy Manager)
Heathfield and Waldron Parish Council Diana Francis (Clerk)
National Flood Forum Paul Cobbing (Chief Executive)
2.2 Data collation and review
With the assistance of, East Sussex County Council, JBA Consulting received data from each key partner in various forms.

9
The majority of the data was supplied as GIS points with associated attributes. As mapping is an effective method for communicating the risk, it was decided to keep the data in this format and add to the records with new data collected from other sources. The geo-spatial element of the data allowed for sensibility checking, for example, are fluvial flooding points near a watercourse.
The quality of this data was summarised according to a scoring system which is based on the scoring from the SWMP technical guidance. A full list of data and its associated score is located in Appendix A. In summary, catchment data has been provided by East Sussex County Council and the Environment Agency. A list of catchment data is displayed in the table below.
Table 2-3 Catchment data and data supplier
East Sussex County Council Environment Agency
Aerial photography LIDAR
Postcode polygons Main river centreline
Bedrock and superficial deposits geology (under licence from BGS)
Digital River Network (DRN)
Gully point locations Aquifer designation
Flood risk maps based on national scale modelling have been provided by the Environment Agency. Southern Water has also provided their Drainage Area Planning (DAP) model outputs. See Table 2-4 for a list of flood risk mapping.
Table 2-4 Flood risk modelling data and supplier
Environment Agency Southern Water
Areas susceptible to ground water flooding
Heathfield DAP Model Results: 30 year and 50 year return periods
Areas susceptible to surface water flooding
Flood map for surface water: 30 year and 200 year return periods
Fluvial flood map: 100 year and 1000 year return period
Flood history records were provided to East Sussex County Council by the project partners. Data included, but was not limited to include: the Wealden flood event database which was used for the Eastbourne and Wealden SFRA Stage 1 and has subsequently been maintained by Wealden District Council, the ESCC Highways PEM register of reported flood instances and Southern Water's Sewer Incident Report Form.
A list of all the data received for the Heathfield SWMP is available in Appendix A.
2.2.1 Data quality scoring
Uncertainty can arise throughout any risk assessment and risk management process. Types of uncertainty can include:
Model - models may not be accurate or complete;
Environmental - natural variability may not represent conceptual model assumptions;
Knowledge – scientific data may be incomplete;
Sample - sample measurements may be inaccurate or the validity may be questionable;
Data - data may be extrapolated or interpolated from other sources;
Scenario - scenarios might not fully describe the problem.

10
Understanding the uncertainty is an important part of the SWMP process, as decisions are made based on the findings. It is important that all project partners and stakeholders are clear about what the limitations of the findings are before making decisions on the level of investment (resources and funding) that may be needed in the future.
The SWMP technical guidance emphasises the importance of understanding the quality of the data used to inform the SWMP. The guidance presents a scoring system to rank the data according to its quality. For Heathfield Stage 1 SWMP, this scoring system has been modified. The modified scoring system (in Table 2-5) was required because the majority of the data received a quality score of 2 and assumptions made with the data scored 3. The result was nothing to distinguish between value of the data sources. Therefore, a refined scoring system was developed to provide a more informative data score.
Table 2-5 Data quality scoring system
Data Quality Score
Description Sub-category
1 Best possible, no better data available
N/A
2 Data with known deficiencies
2a) the known deficiencies are missing or duplicated data
2b) the known deficiencies are missing and duplicated data
3 Assumption based on available data
3a) Assumptions confirmed with local data
3b) Assumed data confirmed by cross referencing with other records
3c) Assumed data based on a single dataset
4 Educated guess based on experience
N/A
Under this scoring system all supplied data received a data quality scoring system of 1 or 2. Information that has been assumed from the data received scores of 3 or 4. The sub-categorisation of the data score distinguishes the relative quality of the data or the confidence in the assumption.
This confidence scoring system can be applied to the received data, the source-pathway-receptor model and the selected hotspot areas.
The flood history data used to inform this SWMP has been scored according to the data which was provided, and that which was missing. Table 2-6 lists the data used and the data quality score associated with it.
Table 2-6 Received data and allocated quality score
Data Data Quality Score
Highways flood report 2a
Wealden flood incidents 2a
SFRA flood problem points 2b
Southern Water SIRF 1
Fire and Rescue 2b
Environment Agency 1
ESCC flooded culverts 2a
ESCC flood memory survey responses 1

11
2.3 Source Pathway Receptor
The Source-Pathway-Receptor model is a concept that can provide an understanding of all sources of flood risk. It is particularly useful in this context as it can be used to generalise the data gathered from numerous sources.
Source - the origin of flood water.
Pathway - a route or means by which a receptor can be affected by flooding.
Receptor - something that can be adversely affected by flooding.
Having applied the Source-Pathway-Receptor model it is possible to mitigate the flood risk by addressing the source (often very difficult), blocking or altering the pathway and/or removing the receptor e.g. steer development away.
2.3.1 Applying the source-pathway-receptor model
The information contained within each flood history table consists of varying sources of data. Data collected by Wealden District Council and Southern Water contain specifics on the flood source, the pathway and the receptor. In these instances applying the source-pathway-receptor model can be informed completely from recorded data and requires no assumptions.
Data from ESCC Highways always documents the receptor and includes a description which often (but not always) explains the flood source and pathway. Whereas data from the emergency services lists the receptor and occasionally the flood source but not the flood pathway. Applying the source-pathway-receptor model to these data requires an element of assumption. Assumptions can be made based on the location of the flood point.
Cross referencing missing data with local, complete data can reduce the uncertainty surrounding assumptions. As a result, the confidence in assumptions can vary.
3 Communicating the risk
For the SWMP to be an effective document, the risk needs to be clearly communicated. The Heathfield Stage 1 SWMP is a tool to communicate the flood risk in Heathfield and will be made available on the County Council’s website.
3.1 GeoPDF
GeoPDFs have been used as the vehicle to communicate risk and flood history. The advantage of using maps is that a lot of data can be displayed in a manner which is easily viewed. The advantage of using a PDF is that it cannot be edited. A GeoPDF embodies both advantages and in addition, enables some basic GIS software functionality. A GeoPDF can be opened in any PDF viewer, software which is freely available.
The GIS functionality includes selecting layers to switch off or on, and jumping between map extents and attribute tables. It was important to this study that the GeoPDF be simple to use for communications with non GIS using project partners. An introduction page was also built in to explain how the GeoPDF works.
3.1.1 Data displayed
The GeoPDF summarises all the relevant data collected as part of this study. This includes, recorded flooding, predicted flood risk and catchment data such as mapping. The GeoPDF produced for all of Heathfield is shown in Figure 3-1.

12
Figure 3-1: The GeoPDF flood risk and recorded flooding incidents in Heathfield.
Flood history
The flood history points have been compiled from all the data received. The source-pathway-receptor model was applied to each point and the total number of repeated flood incidents was tallied. This enabled the point to be thematically mapped. The colour of the flood point was dependent on the flood source, whereas the size of the flood point was dependent on the frequency of the flood incidents recorded at that location, from the same source. The colour coding and scaling allows a lot of data to be communicated simultaneously, in a clear and decipherable way. The colour coding addresses objective 6 as clusters of flood history points of different colours indicates flood risk combined sources. The scaling of flood history points by frequency addresses objective 4 as large flood points indicate flood prone areas.
The flood sources are descriptive of both the type of flooding (e.g. fluvial) and the type of asset (e.g. highway culvert). This sub division has been made so that the Risk Management Authority (RMA) responsible for the flooding incident is easily identified.
All the flood sources used in Heathfield SWMP are listed in Table 3-1. This also includes the colour coding system used in the GeoPDF.
Table 3-1 Source of flooding colour coding system
Flood Source Symbol
Fluvial: ordinary watercourse
Ground Water
Surface Water: drainage ditch
Surface Water: highway culvert
Surface Water: highway gulley
Surface Water: pluvial runoff
Other Flooding Source

13
The size of the points depends on a number of instances and have accordingly been divided into three categories:
A low frequency event with only one or two incidents is represented by a small point;
A mid frequency event with three to four incidents recorded is represented by a medium point; and
A high frequency event with five plus incidents is represented by a large point.
This scaling system has been added to the GeoPDF to instantly show reoccurring flood mechanisms. This helps to prioritise actions.
Sewer flooding incidents are represented by polygons of the affected postcode, rather than points on the effected house. This is an approach taken by Southern Water to protect its customers' confidentiality. Therefore, the same colour and scaling system cannot be used as the flood point data. Instead, the regions have been colour coded by source of flooding and number of occurrences. The polygon outline is coloured by flood source, where brown represents foul water flooding and blue represents combined water flooding. The polygon interior is coloured corresponding to the number of recorded incidents following a traffic light system.
A low frequency event with only one or two incidents is green;
A mid frequency event with three to four incidents recorded is amber;
A high frequency event with five plus incidents is red.
This colour coding system is demonstrated in Table 3-2.
Table 3-2 Sewer flooding incidents, colour coding system
Flood source Number of recorded incidents
Colour code
Foul water sewer flooding
1 - 2
3 - 4
5 +
Combined sewer flooding
1 - 2
3 - 4
5 +
Please note that a legend in the GeoPDF explains all these coding systems so this GeoPDF is a standalone document.
Flood risk data
The predicted flood risk from surface water is represented by the Flood Map for Surface Water (FMfSW). The return periods displayed are the 30 year and the 200 year but only the predicted flooding exceeding 30 centimetres is displayed. It has been decided to display only the deep flooding to illustrate the areas at the greatest predicted risk.
The Areas Susceptible to Surface Water Flooding (AStSWF) has not been displayed. This has been decided because the FMfSW is sufficient to convey the risk from surface water.
The Areas Susceptible to Ground Water Flooding (AStGWF) has not been added to the GeoPDF as this layer shows no risk within the study boundary.
The risk of manhole flooding from the foul water network is represented by Southern Water's model outputs. Manholes flooded during the 30 year return period have been displayed. The 50 year return period was also supplied but analysis found that representing both return periods would not add any further understanding as the same number of manholes flood on both events.
Catchment layers
Additional mapping layers have been added for context. These include the Digital River Network (DRN) which shows all watercourses and a study boundary delimitating the areas of interest has been marked.

14
3.2 Priority areas
The flood history points have been overlapped with predicted flood risk mapping, supplied by the Environment Agency or Southern Water. Together, the reported flood incidents and predicted flood risks identify flooding clusters where the risk is concentrated. These are the priority areas.
To illustrate the priority areas these have been highlighted on the GeoPDF in red rectangles. To see the recorded and predicted flood risk to the priority area more clearly, a zoomed in extent of each priority area is available when the user clicks within any of the red rectangles on the GeoPDF. Hyperlinked to each of the flood history layers is an attribute table of all the flood points from each source. This provides further information on the flood pathway and receptor and also a description of the site specific action, referenced using unique identifiers. The addition of attribute tables to the GeoPDF is a valuable addition for linking data together in one location.
The flooding hotspots have been allocated names to indicate the area covered. A list of the areas and their risks can be found below.
3.2.1 Waldron Thorns
This flood hotpot covers the Waldron Thorns, Tilsmore Road and Ghyll Road (see Figure 3-2).
Figure 3-2: A map of the flooding hotpot - Waldron Thorns
The residential street of Waldron Thorns is very steep; a longitudinal gradient exists as the northern end is higher than the southern end. There is also a lateral gradient as the western side is higher than the eastern side. The steep gradient and impermeable land cover as a consequence of development produce conditions that generate increased surface runoff. Consequentially there are multiple locations of surface water flooding from pluvial runoff, some of which are repeated incidents e.g. SWPR11. Information from Heathfield and Waldron Parish Council indicated that the runoff problem was caused when a new development was constructed off Tilsmore Road. During construction, the drainage infrastructure was not in place and as a result runoff occurred during heavy rain. The last incident of flooding on Waldron Thorns was recorded in 2007. A site visit to Waldron Thorns showed that the highway drainage network is compromised and not performing to its specified designed as illustrated in Figure 3-3.

15
Figure 3-3: A photo from the site visit to Waldron Thorns showing a completely blocked gulley grate.
The rapid rate of surface runoff draining towards Waldron Ghyll has repeatedly caused erosion in this area. It is likely that the complete blockage of these gullies is related to the deposition of sediment load created by the erosion. This is summarised in Figure 3-4.
Figure 3-4: A conceptual model to explain the surface water runoff problem in Heathfield
Consequently, if measures were to be taken to reduce the volume and intensity of surface water runoff, it could lead to a reduction in erosion. This in turn would decrease sediment mobilisation and deposition, resulting in the reduced likelihood of blockages to the drainage network.
As a result suggesting an action which solely involves jetting this network only provides short term relief. Whilst the initial action should be to clear the network as it is not performing as to its operational design; a follow up action should be to address the underlying issue which is erosion as a consequence of pluvial runoff.

16
Low frequency sewer flooding has occurred on Waldron Thorns. Again, this emphasises the importance of managing surface water at this location.
3.2.2 Meadow Way
This flood hotspot covers Meadow Way, Sandy Cross and Ghyll Road (see Figure 3-5). This area also covers Waldron Ghyll and an unnamed watercourse known as ‘Drain 2’.
Figure 3-5: A map of the flooding hotpot - Meadow Way
Individual incidents of surface water flooding have been recorded at numerous locations across this hotspot. The flooding has predominately been caused by blocked highway gullies, but also compromised highway culverts on Waldron Ghyll and Drain 2. On Meadow Way there has been a high frequency (five recorded incidents) of surface water sewer flooding incidents. This suggests that controlling surface water runoff at this location would significantly reduce such flooding. The underlying problem in the Meadow Way hotspot, as with Heathfield on the whole, is the deposition of mobilised sediment entering and thus compromising the performance of the drainage network. Addressing this issue by reducing the erosion rate via land use management practices including surface water source control, may be the best way to achieve surface water flood risk management.
3.3 Quantifying surface water flood risk
Using JBA's impact analysis software – Frism (Floor Risk Metrics), predicted flood risk in Heathfield has been quantified. The analysis has been based on the Flood Map for Surface Water which is national scale mapping. The analysis includes all the available return periods and flood depths which are 1 in 30 year, deep (greater than 0.3 metres) and shallow (greater than 0.1 metres) flooding and 1 in 200 year, deep (greater than 0.3 metres) and shallow (greater than 0.1 metres) flooding. Please note, all the receptors counted as at risk from deep water flooding, will also be counted as at risk from shallow water flooding.

17
3.3.1 Quantifying surface water flood risk in Heathfield
The areas analysed are the town of Heathfield and within the town, the two hotspot areas as shown in Figure 3-6.
Figure 3-6: A map of area covered by the surface water flood risk quantification analysis
The receptors were extracted from the National Land and Property Gazetteer (NLPG) which is the brand name for the compilation of local authority addressing datasets. Receptors have been categorised into the following: monuments, vulnerable receptors, non-residential properties and residential properties. In this instance, vulnerable receptors include education institutions, care homes, sheltered accommodation and vital services such as electricity sub-stations and water treatment works. Emergency responders have also been identified from the National Receptor Database (NRD) and included in the assessment. Table 3-3 displays the receptor count at risk from surface water in the town of Heathfield as a whole.
Table 3-3 Number of receptors in Heathfield at risk from surface water flooding
Return Period
Flood Depth
Monuments (NLPG)
Vulnerable receptor groups (NLPG)
Non-residential properties
(NLPG)
Emergency responders
(NRD)
Residential Properties
(NLPG)
Total
30 Deep 0 0 1 0 101 102
30 Shallow 0 0 16 0 301 317
200 Deep 0 0 46 0 294 337
200 Shallow 0 0 100 0 794 894
In Heathfield, there is no predicted surface water flood risk to monuments, vulnerable receptor groups or emergency responders. However, there is considerable predicted risk to properties. In particular, the risk of shallow water flooding to residential properties is very high – three times the number of properties experiencing deep water flooding at the same return period. Additionally, non-residential properties are also at risk of surface water flooding. Although there are few non residential properties at risk at a 30 year return period, this increases to 100 properties affected by shallow water flooding at a 1 in 200 return period. Table 3-4 displays the number of receptors predicted to flood within the Waldron Thorns flood hotspot.

18
Table 3-4 Number of receptors in Waldron Thorns, Heathfield at risk from surface water flooding
Return Period
Flood Depth
Monuments (NLPG)
Vulnerable receptor groups (NLPG)
Non-residential properties
(NLPG)
Emergency responders
(NRD)
Residential Properties
(NLPG)
Total
30 Deep 0 0 0 0 42 42
30 Shallow 0 0 15 0 188 203
200 Deep 0 0 45 0 186 231
200 Shallow 0 0 87 0 425 512
The Waldron Thorns hotspot is bounded by Heathfield High Street to the north. Therefore, this hotspot covers a mix of residential and commercial land uses. The predicted risk within the Waldron Thorns hotspot shows 90% of the non-residential properties at risk from a 30 year rainfall event in Heathfield fall within this area. At a 200 year event this proportion remains high - just under half.
Proportionally the number of residential properties is not as significant in terms of Heathfield as a whole. However, the property count at risk remains high, particularly those households at risk of shallow flooding - 123 at a 30 year return period and 189 at a 200 return period.
Table 3-5 displays the number of receptors predicted to flood within the Meadow Way flood hotspot.
Table 3-5 Number of receptors in Meadow Way, Heathfield at risk from surface water flooding
Return Period
Flood Depth
Monuments (NLPG)
Vulnerable receptor groups (NLPG)
Non-residential properties
(NLPG)
Emergency responders
(NRD)
Residential Properties
(NLPG)
Total
30 Deep 0 0 0 0 3 3
30 Shallow 0 0 0 0 21 21
200 Deep 0 0 0 0 9 9
200 Shallow 0 0 11 0 93 104
The Meadow Way hotspot covers a predominately residential area. As a result, the number of non-residential properties predicted to be at risk from surface water flooding is low. Only 11 non-residential properties are found to be at risk from shallow water flooding in a 1 in 200 year event.
Most of the predicted risk in Meadow Way hotspot is to residential properties. Table 3-5 shows that the number of properties predicted to be at risk from deep flooding is low; three at risk in a 30 year return period and six at a 200 year return period. The number of properties at risk from shallow water flooding is greater, up to 87 on a 200 year event.
3.3.2 Summarising the surface water flood risk
The flooding hotspots have been selected because they represent clusters of observed and predicted flooding. In Heathfield, the Waldron Thorns hotspot has the majority of the flood risk, whereas the Meadow Way hotspot has been identified because it represents a cluster of recorded history points.
Table 3-6 illustrates that the total number of receptors predicted to be at risk of surface water flooding within the Waldron Thorns and Meadow Way accounts for around 70 % of the total receptors at risk within Heathfield, except deep water flooding at the 30 year return period which has a more varied distribution across the town.
19
Table 3-6 Number of receptors in the flooding hotspots within Heathfield that are at risk of surface water flooding
Return Period
Flood Depth
Monuments (NLPG)
Vulnerable receptor groups (NLPG)
Non-residential properties
(NLPG)
Emergency responders
(NRD)
Residential Properties
(NLPG)
Total
30 Deep 0 0 0 0 45 45
30 Shallow 0 0 15 0 209 224
200 Deep 0 0 45 0 195 240
200 Shallow 0 0 98 0 518 616
The clusters of flood risk within the flood hotspots is illustrated in Figure 3-7, where darker blue colours represent a greater concentration of receptors identified as being at risk of deep water flooding in a 1 in 200 year return period.
Highlighted in figure 3-7 is a cluster of receptors in the Waldron Thorns hotspot at risk from surface water flooding. At the Meadow Way hotspot, a small number of receptors are at risk from surface water flooding. This correlates with the flood history at this location which indicates that flooding has occurred due to asset failure rather that pluvial runoff.
Outside of the flood hotspots there are cells highlighted in blue where an isolated area of surface water ponding over lays high density housing. Of a particular note are the two blue cells directly adjacent to the south east corner of the Waldron Thorns hotspot. Here an area of 500 m
2 of
surface water affects up to 20 properties as the buildings are high density retirement cottages. Whilst these receptors are considered to be vulnerable, confidence in the surface water flood map is low at this location because it is not corroborated by recorded flood incidents.
Figure 3-7: The total number of receptors affected by deep water flooding at a 1 in 200 year return periods

20
4 Planning The purpose of this section is to examine the risk of flooding (from local sources) to allocated development sites. This information can then be used by project partners and the planning authority within Wealden District Council so strategic planning decisions can be made in conjunction with flood risk. It should be noted that areas identified for development could be subject to change as the planning process progresses.
4.1 Local Development Framework
Wealden District Council issued plans for Strategic Development Areas (SDAs) in 20123. This
document identified sites for development and dates of key milestones. Areas within Heathfield identified for development are displayed in Figure 4-1.
Figure 4-1: Strategic development areas identified in Heathfield.
However, further communication with Wealden District Council planning department has confirmed that SDA 11 has not been taken forward to the adopted plan.
Despite no strategic development areas being adopted in Heathfield, infill development on a small scale could occur as a result of ad hoc planning applications. These 'windfall' sites are not planned by the authority but may still be permitted. It should be noted that a Flood Risk Assessment (FRA) is a Statuary Requirement for any planning application of an area greater than one hectare. Therefore, the affect of flood risk to any windfall development sites exceeding 1 hectare, should be assessed prior to construction.
3 Wealden DC Local Development Framework - Strategic Sites DPD - Issues and Options Consultation Paper

21
5 SWMP Action Plan This section sets a plan for managing the identified flood risk. The action plan uses all the information collated during the SWMP process to recommend measures to manage the flood risk in Heathfield. The actions have been developed according to the flood mechanism.
5.1 Monitoring the Action Plan
It is proposed that the monitoring and reporting on the implementation of the action plan will be undertaken locally with partners expected to take forward actions independently, and convene as and when appropriate.
5.2 Communicating the Action Plan
The action plan has been produced as a table. The details specified are:
Unique ID: to allow cross reference with the flood history point or polygon;
Action: an outline of the mitigation measure required;
Action Owner: sets out which partner or stakeholder is responsible for implementing the actions;
Action Supporter: sets out which partner of stakeholder will support the implementation of the action;
Indicative Costs: sets out the price band of the action;
Identifies priorities: sets out the prioritisation of actions.
Please note that in the context of Action Owner, departments within East Sussex County Council have been distinguished from one another. The Communities, Economy and Transport department, undertakes lead local flood authority duties and has been referred to as East Sussex County Council. However, the highways authority also sits within the Communities, Economy and Transport department and is referred to as ESCC Highways.
5.2.1 Prioritising the actions
A suitable action has been set for every flood point on the Heathfield GeoPDF. However, to enable affective delivery of the action plan, it has been sub-divided according to priority. The prioritisation process considered:
the date of the last recorded incident;
the frequency of recorded flooding; and
the vulnerability of the receptors.
For example, some of the records are 20 years old. It would be misleading to discount these records as it may be that a similar storm has not occurred subsequently. However, if flooding has not occurred since the 1990s then it is not considered an immediate priority. Therefore, the action plan has been divided by records pre and post 2000. Furthermore, actions which are documented as complete in the records have been listed in an additional table so work is not duplicated. In addition, if a flood incident is a reoccurring problem (has been reported more than twice) its prioritisation is increased. Finally, the vulnerability of the receptor was also considered in the assessment of action priority. For example, where internal flooding of dwellings was recorded, this was ranked above recorded flooding on industrial curtilage.
There are four classifications of action priority: high, medium, low and complete. All of the high priority actions correspond to recent flood records which have a high frequency or affect a more vulnerable receptor. The medium priority can be older records, if the incident has a high frequency or vulnerable receptor. The low priority actions refer to one off flood events, generally old records and low vulnerability receptors. The completed actions had been added to include where work has already been undertaken, to avoid duplicating efforts.

22
5.2.2 Indicative costs
Indicative costs are broad ranges of how much an action could cost. The cost ranges are provided:
Low: £0 - £5,000
Medium: £5,001 - £10,000
High: > £10,001
5.3 Using SUDs
Surface water flooding is exacerbated by urbanisation. This is because natural, permeable land uses are replaced with impermeable surfaces. Sustainable Drainage Systems (SuDS) mimic natural systems and provide solutions to surface water runoff and pollution. As such, using SuDS in Heathfield could help mitigate surface water flooding.
SuDS is an over arching term for various surface water management devices. The devices perform tasks such as capturing rain water, retain surface water or filter pollutants and some SuDS techniques are multipurpose. Together, the sequence of SuDS components forms a SuDS management train.
5.3.1 Source control
Heathfield has experienced repeated incidents of surface water flooding. However, as the source of surface water flooding is rainfall it is often difficult to manage - especially in an area with steep topography such as Heathfield. Using source control SuDS as a measure to reduce the generation of surface water could be beneficial in Heathfield. If existing land use was modified, it could reduce the rate and volume of surface water run off that causes soil erosion, which eventually deposits into the drainage network.
Source control measures include permeable paving, green roofs and rainwater harvesting. Due to the relatively impermeable geology underlying Heathfield, it is likely that infiltration dependent SuDS options such as permeable paving would be ineffective. However, green roofs and rainwater harvesting could be effective in this area.
Southern Water offers a rebate to customers if they remove their contribution to the surface water sewer system. Therefore any customer who operates source control could benefit financially. Furthermore, under the "your water meter" campaign Southern Water offer a 20% discount on water butts to private residents and free water butts to schools and community groups
4. One disadvantage of using source control as a surface water mitigation measure is that
it is reliant on public engagement and uptake of the scheme.
5.3.2 Retention
As discussed in Section 1.5, the Waldron Ghyll rises rapidly in response to rainfall. Adopting retentions SuDS could temporarily store water and therefore delay the catchment response, producing a lower but more prolonged peak water level in the watercourses. Applying a retention SuDS action could alleviate both flooding from surface water and fluvial flooding.
However, retention SuDS devices require space and suitable land is scarce in Heathfield. As a result, retrofitting retention devices is impractical. There are no strategic development areas being taken forward in Heathfield. Therefore, incorporating retention SuDS as part of development proposals at Heathfield is not possible.
5.3.3 Infiltration
SuDS that infiltrate into the ground rely on the subsurface to accept and store surface water. Therefore, the physical properties of the ground are important when selecting where infiltration SuDS are appropriate.
The geology underlying Heathfield is Ashdown Formation which is part of the Wealden Group. The Ashdown Formation comprises of sandstones, siltstones and mudstones. The uppermost
4 Southern Water (2013) Available at - http://www.yourwatermeter.com/waterbutt

23
layer is sandy and allows for some infiltration. However, the lower layers (50 cm below ground level) are more clayey and permit less infiltration. Therefore, it is unlikely that infiltration SuDS will be affective in Heathfield.
5.4 Strategic options
Strategic options have been developed to address the integrated flood mechanisms operating in the flood hotspots.
5.4.1 Waldron Thorns
Surface water pluvial runoff is a persistent problem on Waldron Thorns. One recommended measure is to use source control to reduce and manage surface water runoff. Southern Water operates schemes to promote source control so the recommended action is to promote these schemes to the residents of Waldron Thorns. Schemes include;
Your Water Meter - which subsidises water butts for customers
Rebate from water bills is surface water contribution is reduced.
A site visit to Heathfield identified that highway gulley asset performance was a serious issue. The recommended action for Waldron Thorns is two-stage. The first action recommended is East Sussex highways team jet or rod the gulley network because it is currently un-operational.
Action: East Sussex highways team to clean gulley network on Waldron Thorns
A follow on action should be to address the underlying issue of pluvial runoff and resulting erosion. There is an opportunity to reduce the need for regular maintenance by reducing the sediment transferred in the runoff. This may be achieved by land management practices to reduce the rate of erosion. Therefore, it is recommended that an investigative study on erosion in Heathfield be undertaken by East Sussex County Council. The study would include erosion prediction through assessing the available flow energy (as computed by a channel slope and discharge stream power index) and comparing it against published bank erosion threshold values. The outcome of this study would be the identification of locations where the introduction of land use and/or water flow management may slow the flow through the landscape.
Action: East Sussex County Council and the highways authority to undertake an erosion study focused on identifying land management solutions which will control sediment entering the highway gulley network and ultimately reduce surface water flooding.
5.4.2 Meadow Way
Five instances of surface water sewer flooding have been recorded on Meadow Way. Four instances of flooding as a result of blocked gullies confirm that the infrastructure designed to carry away surface water is struggling during storm conditions. East Sussex highways asset database lists 17 gulleys that are 50 % blocked but not cleaned because maintenance teams were unable to gain access due to parked cars or the grates being jammed. Consequently, it is recommended that East Sussex highways team revisits this site and undertake the required maintenance. Furthermore, it is recommend that Southern Water inspects the condition of its assets to ensure that the surface water drainage network is operating at full capacity and where appropriate undertake remedial works.
Action: Southern Water and East Sussex highways team to undertake asset inspection and any required maintenance on Meadow Way.
At this hotspot, two highway culverts, were identified as being blocked, resulting in decreased conveyance and at risk of causing a flood problem. Its is recommended that the Waldron Gill culvert under Ghyll Road and the culvert conveying 'Drain 2' under Sandy Cross Lane should be prioritised for maintenance by East Sussex highways team.
Action: East Sussex highways team to prioritise culvert maintenance on Ghyll Road and Sandy Cross Lane.

24
With pluvial runoff and blocked gullies being a reoccurring theme across the Meadow Way hotspot, the management of surface water runoff generation and erosion rates would be of benefit at this location. Consequently, it is recommended that Southern Water promote their ongoing scheme 'Your Water Meter' to the residents of Meadow Way, Theobalds Green and Sand Cross Lane.
Action: Southern Water to promote 'Your Water Meter' to residents at Meadow Way, Theobalds and Sand Cross Lane.
In addition, it is recommended that East Sussex County Council undertake an erosion study. The output of which should be land management practices that would address the erosion issue at this site. Land management techniques to manage flood risk potentially applicable in Heathfield include; controlling headwater drainage, creating new woodlands and slowing down water flows through steep valleys
Action: East Sussex County Council and the highways authority to undertake an erosion study focused on finding land management solutions which will control sediment entering the highway gulley network and ultimately reduce surface water flooding.
5.5 Quick wins
One objective of the SWMP was to identify where short term actions could quickly resolve a known flood problem in Heathfield. Studying the flood history in Heathfield has shown that surface water runoff is a significant issue, and that poor performance of highway drainage contributes to the problem. East Sussex highways team keep a database of the location and condition of all known assets. A quick win that has been identified is to address those assets known to be blocked but have not been cleaned as access was blocked by parked cars.
In Heathfield there are 43 gullies which are 75 - 100 % blocked and have not been cleaned. The defects which prevented clearing include; jammed grid, blocked outlet, under a hedge or under a parked car. As a quick win, it is recommended that East Sussex Highways team clean the 15 gullies recorded to be 75 - 100 % blocked but were not cleaned as cars were parked over them. This is of particular importance in both Waldron Thorns and Meadow Way flood hotspots where maintenance of highways assets has been identified as a priority.
5.6 Generic actions
Some of the actions derived during this SWMP are applicable to multiple or all of the flood points in Heathfield. These actions have been termed Generic Actions.
5.6.1 On-going maintenance of the partnership
To successfully undertake the action plan and continue to improve the management of flood risk in Heathfield, it is important to maintain the links between the risk management authorities involved in the production of the SWMP. The on-going partnership will discuss the implementation of the proposed actions, review opportunities for operational efficiency and to review any legislative changes. It is proposed that the monitoring and reporting on the implementation of the action plan will be undertaken locally and it is expected that partners will take forward actions independently, and convene as and when appropriate.
5.6.2 Asset maintenance
Where there are repeated occurrences of flooding from a single mechanism, standardised actions for flood mitigation have been created to generate efficiencies.
When a flood event has been attributed to poor asset condition it is possible that a resolving action has been undertaken, but not documented in the available records. Therefore, an initial action of asset inspection is required for these flood points. Any further action required is dependent on the outcome of that inspection. As the action required from a flood point caused

25
by poor asset condition formed a process, a process diagram has been created. This action can be applied to all flood points with a source related to asset condition.
The Environment Agency has published a Condition Assessment Manual5 (CAM) as guidance to
visually assessing asset condition. This guidance was developed for high level asset condition of Environment Agency assets. It is expected that the visual grading may lead to additional actions, including specialist asset inspection or maintenance works.
CAM is promoted for adoption by the Environment Agency's partners; Lead Local Flood Authorities. Therefore, this guidance has been adapted for use by East Sussex in this action plan. The CAM classifies condition grades as described in Table 5-1.
Table 5-1 Asset condition grade assessment taken from the Condition Assessment Manual
Grade Rating Description
1 Very Good Cosmetic defects that will have no effect on performance
2 Good Minor defects that will not reduce the overall performance of the asset
3 Fair Defects that could reduce performance of the asset
4 Poor Defects that would significantly reduce the performance of the asset. Further investigation needed.
5 Very Poor Severe defects resulting in complete performance failure.
This rating system has been adopted into the asset condition assessment so the flow diagram follows best practice and utilises guidance on assessing asset condition. The action plan flow diagram is shown in Figure 5-1.
5 Environment Agency (2006) Conditional Assessment Manual. Rio House: Bristol.

26
Figure 5-1: Action plan flow diagram, applicable where asset condition has been attributed as the flood source.
The final action on this flow diagram is the application of an asset management plan. This step has been identified to keep all County Council owned assets in full operational condition in preparation for a rainfall event. This is particularly important in Heathfield as it responds quickly to rainfall. Therefore, there is no lead time to undertake emergency works at the onset of a

27
rainfall event. As a result, the assets should maintain a good level of serviceability at all times, in preparation for a large rainfall event.
5.7 Location specific actions
A full list of actions is available in Appendix D. The following table highlights some of the prioritised actions for Heathfield. These actions are shortlisted because they have repeated incidents, recent occurrences and have a high consequence.
Table 5-2 Site specific actions priories according to repeated incidents occurring after 2000
Un
iqu
e ID
Ho
tsp
ot
Acti
on
Acti
on
Ow
ner
Acti
on
Su
pp
ort
er
Sta
tus
Ind
icati
ve
Co
st*
Pri
ori
ty**
SFSW02 Meadow Way
Inspect asset condition. If condition is poor or there is a blockage, undertake necessary remedial works.
Southern Water
Recent record
Low - medium
High
SWPR07 Waldron Thorns
Promote "Your Water Meter" campaign in Heathfield to encourage source control.
Southern Water
East Sussex County Council
Recent record
Low - medium
High
SWPR11 Waldron Thorns
Promote "Your Water Meter" campaign in Heathfield to encourage source control.
Southern Water
East Sussex County Council
Recent record
Low - medium
High
Numerous
Commission a study to improve understanding of erosion mechanisms in Heathfield to inform possible land use management practices to control sediment deposition and related surface water flooding.
East Sussex County Council
Wealden District Council
Recent record
Low - medium
High
*Indicative costs Low: £0 - 5,000, Medium: £5,001 - 10,000, High: £10,001 +
**Priority Low: take action when medium priority actions are complete, Medium: take action when high priority actions are complete, High: take immediate action
These prioritised actions primarily address flooding from surface water. The surface water flooding has been caused by extreme rainfall running off impermeable areas or poor

28
performance of highway assets. Where rainfall has generated overland flow, methods of source control have been promoted under Southern Water's existing scheme "Your Water Meter". Where asset condition has caused flood incidents, the resulting action is the implementation of the asset inspection maintenance flow diagram. .
5.8 Site specific actions
As stated above, an action has been devised for each point in Heathfield. For continuity and usability, the location specific action plans have been linked directly to the flooding hotspot GeoPDF. The flood incidents outside of hotspots also have an action, although this is not dynamically linked with the GeoPDF. The accompanying GIS data and appendix tables all contain a unique ID for each flood incident. As a result it is possible to cross reference between data sources. A full list of the site specific actions is in Appendix D.
5.9 Future revisions
Assuming a continuation of partnership working in East Sussex, the steering group is well positioned to respond to future changes. There may be circumstances which might trigger a review and/or an update of the action plan in the interim, for example:
Occurrence of a surface water flood event;
Additional data or modelling becoming available, which may alter the understanding of risk within the study area;
Outcome of investment decisions by partners is different to the preferred option, which may require a revision to the action plan; and
Additional (major) development or other changes in the catchment which may affect the surface water flood risk.
5.10 Way forward
Whilst East Sussex County Council has taken the responsibility for leading on the Stage 1 SWMP, it is recommended that the responsibility for monitoring the progress of the action plan and maintaining the links between the partners would be better served at the local level. Thus the immediate next step should be the organisation of a meeting between the County Council and Wealden District Council, with a view to inviting the SWMP partners and action owners to discuss the prioritisation of actions; the continuance of the partnership; and the potential for delegating the monitoring of the action plan to parish council and/or community groups.
It is also recommended that the progress of the SWMP to the more detailed stages should be focused on the identified hotspots which are areas where repeated flood incidents have been recorded together with high predicted flood risk. For the Heathfield SWMP, the hotspots recommend for further detailed assessments and continuation to the option stage are:
Waldron Thorns; and
Meadow Way.
In addition to the progression of the SWMP process, the Stage 1 SWMP has also identified a need for the establishment of a programme of ‘preventative maintenance measures’ for highway drainage, suggesting critical areas for prioritisation.
Finally, as part of an iterative process of revision, the outputs of the SWMP should be incorporated into future revisions of the East Sussex local flood risk management strategy.

29
Appendices
A Appendix - Data Register and Quality Score
B Appendix - GeoPDF
C Appendix - Flood History Table
D Appendix - Site Specific Action Plan
NB. Appendix A-D are separate documents

Carbon Footprint
A printed copy of the main text in this document will result in a carbon footprint of 199g if 100% post-consumer recycled paper is used and 157g if primary-source paper is used. These figures assume the report is printed in black and white on A4 paper and in duplex.
JBA is aiming to reduce its per capita carbon emissions.
Copyright © Jeremy Benn Associates Limited 2016
Offices at Coleshill
Doncaster
Edinburgh
Haywards Heath
Limerick
Newcastle upon Tyne
Newport
Saltaire
Skipton
Tadcaster
Thirsk
Wallingford
Warrington
Registered Office South Barn
Broughton Hall
SKIPTON
North Yorkshire
BD23 3AE
t:+44(0)1756 799919 e:[email protected]
Jeremy Benn Associates Ltd Registered in England
3246693
Visit our website
www.jbaconsulting.com