heathrow airport limited › content › dam › heathrow › web › ...heathrow (sp) limited...
TRANSCRIPT
News release
1
Heathrow (SP) Limited The Compass Centre, Nelson Road,
Hounslow, Middlesex TW6 2GW
T: +44 (0)20 8745 7224
W: heathrow.com
22 February 2018
Heathrow (SP) Limited
Results for the year ended 31 December 2017
• Heathrow grew at its fastest rate in five years in 2017, helping Britain’s economy to thrive by welcoming a record 78 million passengers (+3.1%) while retaining its position as Europe’s top-rated major airport for the third year running
• Heathrow continues to deliver for the UK with a 10.2% increase in cargo volumes promoting more British trade growth, support for British jobs with close to £700 million invested in the airport over the year and new services to Portland and Santiago
• Strong financial performance underpins Heathrow’s expansion plans, with revenues of £2,884 million up 2.7% and Adjusted EBITDA of £1,760 million up 4.6% reflecting lower operating costs and strong retail growth while passenger charges decreased by 2.0%
• Over £1.0 billion in debt financing completed, enhancing resilience and simplifying Heathrow’s debt financing arrangements
• Significant progress on expanding Heathrow, with the airport’s first planning consultation underway, a shortlist of logistics hubs around Britain to help build it, the government committing to a vote in Parliament this summer and the CAA progressing the expansion regulatory framework
At or for year ended 31 December 2017 2016 Change (%)
(£m unless otherwise stated)
Revenue 2,884 2,807 2.7
Adjusted EBITDA(1) 1,760 1,682 4.6
EBITDA(2) 1,909 1,726 10.6
Cash generated from operations 1,733 1,652 4.9
Cash flow after investment and interest(3) 484 387 25.1
Pre-tax profit(4) 217 267 (18.7)
Heathrow (SP) Limited consolidated net debt(5) 12,372 11,908 3.9
Heathrow Finance plc consolidated net debt(5) 13,674 13,005 5.1
Regulatory Asset Base 15,786 15,237 3.6
Passengers (million)(6) 78.0 75.7 3.1
Retail revenue per passenger (£)(6) 8.45 8.09 4.5 Notes 1-6: see page 2
John Holland-Kaye, Chief Executive Officer of Heathrow, said:
“Heathrow had a fantastic 2017 – welcoming a record 78 million passengers, giving our best service ever and offering better value for our passengers with lower airport charges. But while we are squeezing out small bits of growth, our rivals in France and Germany are overtaking us – for Britain to thrive post-Brexit, the Government needs to crack on with Heathrow expansion as quickly as possible with a vote in Parliament before the summer.”
2
Notes (1) Adjusted EBITDA is earnings before interest, tax, depreciation and amortisation, certain re-measurements and exceptional items
(2) EBITDA is earnings before interest, tax, depreciation and amortisation
(3) Cash flow after investment and interest is cash generated from operations after net capital expenditure and net interest paid
(4) Pre-tax profit is before exceptional items and certain re-measurements
(5) Nominal net debt is excluding intra-group loans and including inflation-linked accretion
(6) Changes in passengers and retail revenue per passenger are calculated using unrounded passenger numbers
Heathrow (SP) Limited owns Heathrow airport and together with its subsidiaries is referred to as the Group. Heathrow Finance plc, also referred to as Heathrow Finance, is the parent company of Heathrow (SP) Limited.
For further information please contact Heathrow Media enquiries Weston Macklem +44 7525 825516 Investor enquiries Christelle Lubin +44 7764 805761
Conference call to be held for creditors and credit analysts on 22 February 2018 at 3.00pm (UK time), 4.00pm (Central European time), 10.00am (Eastern Standard Time), hosted by John Holland-Kaye, Chief Executive Officer and Javier Echave, Chief Financial Officer. Dial-in details: UK local/standard international: +44 (0)33 3300 0804; UK Toll-Free: 0800 358 9473; North America: +1 631 9131 422 U.S. Toll-free +1 855 85 70686. Participant PIN code: 05015284# Dial in access list http://events.arkadin.com/ev/docs/NE_W2_TF_Events_International_Access_List.pdf The presentation can be viewed at the Investor Centre at heathrow.com/company and online during the event at: https://arkadin-event.webex.com/arkadin-event/onstage/g.php?MTID=ea5cca61805b8ef2c57e89a2d93ffaecc
using event password: 301212137. Disclaimer These materials contain certain statements regarding the financial condition, results of operations, business and future prospects of Heathrow. All statements, other than statements of historical fact are, or may be deemed to be, “forward-looking statements”. These forward-looking statements are statements of future expectations and include, among other things, projections, forecasts, estimates of income, yield and return, pricing, industry growth, other trend projections and future performance targets. These forward-looking statements are based upon management’s current assumptions (not all of which are stated), expectations and beliefs and, by their nature are subject to a number of known and unknown risks and uncertainties which may cause the actual results, prospects, events and developments of Heathrow to differ materially from those assumed, expressed or implied by these forward-looking statements. Future events are difficult to predict and are beyond Heathrow’s control, accordingly, these forward-looking statements are not guarantees of future performance. Accordingly, there can be no assurance that estimated returns or projections will be realised, that forward-looking statements will materialise or that actual returns or results will not be materially lower than those presented. All forward-looking statements are based on information available at the date of this document, accordingly, except as required by any applicable law or regulation, Heathrow and its advisers expressly disclaim any obligation or undertaking to update or revise any forward-looking statements contained in these materials to reflect any changes in events, conditions or circumstances on which any such statement is based and any changes in Heathrow’s assumptions, expectations and beliefs. These materials contain certain information which has been prepared in reliance on publicly available information (the “Public Information”). Numerous assumptions may have been used in preparing the Public Information, which may or may not be reflected herein. Actual events may differ from those assumed and changes to any assumptions may have a material impact on the position or results shown by the Public Information. As such, no assurance can be given as to the Public Information’s accuracy, appropriateness or completeness in any particular context, or as to whether the Public Information and/or the assumptions upon which it is based reflect present market conditions or future market performance. The Public Information should not be construed as either projections or predictions nor should any information herein be relied upon as legal, tax, financial or accounting advice. Heathrow does not make any representation or warranty as to the accuracy or completeness of the Public Information. All information in these materials is the property of Heathrow and may not be reproduced or recorded without the prior written permission of Heathrow. Nothing in these materials constitutes or shall be deemed to constitute an offer or solicitation to buy or sell or to otherwise deal in any securities, or any interest in any securities, and nothing herein should be construed as a recommendation or advice to invest in any securities. This document has been sent to you in electronic form. You are reminded that documents transmitted via this medium may be altered or changed during the process of electronic transmission and consequently neither Heathrow nor any person who controls it (nor any director, officer, employee not agent of it or affiliate or adviser of such person) accepts any liability or responsibility whatsoever in respect of the difference between the document sent to you in electronic format and the hard copy version available to you upon request from Heathrow. Any reference to “Heathrow” means Heathrow (SP) Limited (a company registered in England and Wales, with company number 6458621) and will include its parent company, subsidiaries and subsidiary undertakings from time to time, and their respective directors, representatives or employees and/or any persons connected with them.

3
Heathrow (SP) Limited Consolidated results for the year ended 31 December 2017 Contents 1 Review of the year ..................................................................................................................................... 4 2 Key business developments ...................................................................................................................... 5
2.1 Mojo ................................................................................................................................................... 5 2.2 Transforming customer service ......................................................................................................... 5 2.3 Beating the plan ................................................................................................................................. 6 2.4 Sustainable growth ............................................................................................................................ 7 2.5 Key management changes .............................................................................................................. 10
3 Financial review ....................................................................................................................................... 10 3.1 Basis of presentation of financial results ......................................................................................... 10 3.2 Income statement ............................................................................................................................ 10 3.3 Cash flow ......................................................................................................................................... 13 3.4 Recent financing activity .................................................................................................................. 14 3.5 Financing position ............................................................................................................................ 15 3.6 Pension scheme .............................................................................................................................. 17 3.7 Outlook ............................................................................................................................................. 17
Appendix 1 Financial information .................................................................................................................... 18 Consolidated income statement .................................................................................................................. 18 Consolidated statement of comprehensive income ..................................................................................... 19 Consolidated statement of financial position ............................................................................................... 20 Consolidated statement of changes in equity .............................................................................................. 21 Consolidated statement of cash flows ......................................................................................................... 22 General information and accounting policies............................................................................................... 23 Notes to the consolidated financial information ........................................................................................... 24
Appendix 2 Presentation of retail revenue....................................................................................................... 31
4
1 Review of the year
2017 was a record year at Heathrow during which we made excellent progress toward delivering our vision: to give passengers the best airport service in the world. We maintained strong momentum across the four priorities underpinning our vision: making Heathrow a great place to work, transforming our service to passengers and airlines, beating the business plan over the current regulatory period and operating and growing Heathrow sustainably today and in the future. The success of our vision is bound to attracting, retaining and developing high quality talent. This is why making Heathrow a great place to work and creating careers where people can fulfil their potential is at the very heart of our strategic priorities. In 2017, 74% of our colleagues (2016: 78%) rated themselves engaged: a particularly strong outcome as the company-wide survey was run as an industrial action ballot was taking place. Heathrow was also voted one of The Sunday Times’ Top 30 Best Big Companies to Work For. We took great pride in becoming the UK’s first airport to be a fully accredited Living Wage employer. We rolled out our Digital Workplace to our central functions as we continue evolving toward a more agile responsive organisation, further empowering our colleagues. We delivered an outstanding service to our passengers during our busiest year on record. We achieved an excellent 4.18 out of 5.0 score in the global Airport Service Quality survey in Q4 2017 while we achieved record levels of baggage connections and departures punctuality. Passengers voted Heathrow ‘Best Airport in Western Europe’ for the third year running and ‘Best Airport for Shopping’ globally for the eighth consecutive year at the 2017 Skytrax World Airport Awards. Lastly, we were named the world’s best airport for security in the inaugural awards from International Airport Review. In 2017, a record 78.0 million passengers chose to travel through Heathrow, up 3.1% on 2016 - the single best endorsement of our strategy. This was our seventh successive annual record and was enabled by record load factors. Passengers benefitted from an even greater choice in terms of destinations with new long haul services to Barbados, New Orleans, Portland, Qingdao and Santiago. Heathrow also delivered for the UK, supporting British trade with a significant increase in cargo volumes, up 10.2% on last year. 2017 was also about continuing to beat the plan on both revenues and costs as we remain well on track to deliver £900 million of revenue and cost improvements over the current regulatory period to the end of 2018. Our strong focus on operating efficiencies continued with headline operating costs down marginally despite welcoming an additional 2.3 million passengers and a significant pick up in inflation. On the revenue side, we are seeing more passengers participating in our retail offering and each of them is spending more. As a result of all these dynamics, revenues were up 2.7% to £2.9 billion. We raised over £1.0 billion in debt financing paving the way to simpler debt financing arrangements and enhancing our resilience ahead of expansion. Heathrow’s expansion really moved into delivery mode in 2017 following the Government’s backing for our plans in late 2016. We are already making good progress toward delivering this once-in-a-generation boost for Britain’s economy, one that will help secure the country’s economic future as an outward looking nation. The government considers Heathrow expansion as strategically important for the UK and intends to submit its Airports National Policy Statement, the key legislative enabler for expansion, to a vote in Parliament in the first half of 2018. We continue engaging with our regulator and airline stakeholders to define the regulatory framework that will enable expansion that is affordable, sustainable and financeable. Finally, in January 2018, we launched our first planning consultation. The consultation outlines our emerging proposals and options to deliver an expanded Heathrow while keeping our commitments to local communities and meeting strict environmental tests. It is the opportunity for our local community and the broader public to help us shape Heathrow’s future.

5
2 Key business developments
2.1 Mojo
We are committed to making Heathrow a great place to work and our efforts are showing results. In 2017 our colleagues voted us one of The Sunday Times’ Top 30 Best Big Companies to Work For. Our commitment to personal development saw 211 colleagues promoted internally, demonstrating that our focus on retaining and developing talent is working, with a further 3,191 taking part in training and personal growth programmes. We also launched five diversity networks, so colleagues can be their best by being themselves. Our new Digital Workplace rolled out, helping those who work here to connect – on any device, anywhere, at any time, and we launched a salary sacrifice scheme for green cars, giving colleagues big discounts on sustainable travel. Our commitment to giving something back saw 932 colleagues and Team Heathrow partners take part in events to raise over £350,000 for our charity partners. These events included our annual midnight marathon on our northern runway and ‘race the plane’, where 351 participants from Team Heathrow raced an Air Canada flight to Toronto on exercise bikes, raising £101,000 in the process.
2.2 Transform customer service
In 2017, we continued to deliver a world-class passenger service achieving a record annual average score of 4.16 out of 5.0 and an excellent 4.18 out of 5.0 score in the fourth quarter in the global Airport Service Quality (‘ASQ’) survey. Heathrow has been ranked first among major European hub airports for service quality in this survey for thirteen successive quarters. In addition, 82% of passengers surveyed rated their Heathrow experience ‘Excellent’ or ‘Very Good’ (2016: 84%). Heathrow received other recognitions for its high service standards, being named the ‘Best Airport in Western Europe’ for the third consecutive year at the Skytrax World Airport Awards. The award, voted for globally by passengers, came in addition to Heathrow being voted ‘Best Airport for Shopping’ for the eighth consecutive time. Improving passengers’ journeys through the airport remains one of our key priorities. Passengers continue to enjoy efficient queuing to pass through security, passing through central security within the five minute period prescribed under the Service Quality Rebate (‘SQR’) scheme 97.3% of the time (2016: 97.0%) compared with a 95% service standard. The service quality regime penalty threshold was not triggered in 2017 in respect of any performance standard and for the first time in the current regulatory period, we earned a modest level of bonuses under the SQR scheme. Punctuality improved with a record 80.2% of flights departing within 15 minutes of schedule (2016: 78.8%). Baggage performance improved significantly with the misconnect rate down to 10 bags per 1,000 passengers (2016: 14), reflecting our enhanced operational resilience. Heathrow achieved its best ever monthly baggage performances of 7 bags per 1,000 passengers in February 2017 and 8 bags per 1,000 passengers in 3 other separate months, beating the previous record of 9 bags per 1,000 passengers set in October 2016. Over a million passengers with reduced mobility travelled through Heathrow in 2017. Last summer, we agreed new service levels with our supplier that took effect in January 2018; they will enhance our performance and transform these passengers’ experience. In September 2017, we also launched an improvement plan which includes steps we are now taking to better monitor and report our performance, conduct accredited disability awareness training and engage with disability groups going forward.
6
2.3 Beat the plan
2.3.1 Q6 business plan
Our business plan for the current regulatory period (‘Q6’) is intended to improve customer service, strengthen operational resilience and deliver an ambitious programme of cost efficiencies and revenue growth. We are on track to substantially deliver the cost efficiencies and additional commercial revenues built into our plan. As a result, by the end of 2018, we will have secured £900 million of incremental EBITDA over the period.
2.3.2 Passenger traffic
Heathrow’s passenger traffic by geographic segment for the year ended 31 December 2017:
(Millions) 2017 2016 Change (%)(1) UK 4.8 4.6 3.3 Europe 32.4 31.7 2.4 North America 17.4 17.2 1.1 Asia Pacific 11.3 10.8 4.5 Middle East 7.6 7.0 9.5 Africa 3.2 3.2 0.2 Latin America 1.3 1.2 5.5
Total passengers(1) 78.0 75.7 3.1 (1) Calculated using unrounded passenger numbers
In the year ended 31 December 2017, we welcomed a record breaking 78.0 million passengers (2016: 75.7 million), a rise of 3.1% on prior year on a total of 471,082 passenger flights (2016: 470,764). Our traffic growth was primarily enabled by average load factor increasing by 2 percentage points to 78.0% (2016: 76.0%) partly driven by an increase in UK inbound demand, influenced by the depreciation of sterling, particularly from the Middle East and Asia Pacific. The average number of seats per passenger aircraft rose 0.4% to 212.3 (2016: 211.5). The increase in the number of flights reflects the immediate benefit of a scheme we launched in the fourth quarter of 2017 to boost utilisation of our limited spare capacity which drove a net increase in the final quarter of over 1,300 flights. Passengers benefitted from an even greater choice in 2017 with new domestic services operated by Flybe, new international destinations including Barbados, New Orleans, Portland, Qingdao and Santiago and more services and additional seats per flight to the Middle East and Asia. Intercontinental traffic was the key geographic driver of our traffic growth, increasing 3.6%, with load factors improving significantly. Intercontinental traffic growth was particularly robust on routes serving the Middle East where passenger numbers increased 9.5% supported by flights and larger aircraft, including additional A380 services from Emirates, Etihad and Qatar Airways, and more flights, including additional services from Oman Air. The 4.5% rise in Asia Pacific traffic was driven by substantial growth in load factor on existing routes serving Malaysia and new or increased services to Thailand, Philippines and Vietnam. North American traffic rose 1.1% mainly benefitting from increased load factors. Latin American traffic grew 5.5%, due to more flights and fuller aircraft serving the region. European traffic increased by 2.4% due to fuller, larger planes with notable growth on routes to Italy, Russia, Belgium, Denmark, Netherlands and Portugal with over 70,000 extra passengers in each market. Flybe’s new Scottish services contributed to the 3.3% growth in domestic traffic. In January 2018, Heathrow announced a £15 discount on airport charges for domestic flights, a 50% increase in the discount put in place in 2017. The new initiative will provide even better value to our passengers and support our plans to enhance domestic connectivity by making domestic routes more commercially viable for our airlines. Over 30% of the UK’s non-EU exports by value pass through Heathrow today. In the twelve months ended 31 December 2017, cargo volumes were up 10.2% to 1.7 million tonnes, one of the strongest periods in the last 5 years in terms of year on year growth, with notable increases on North America and the Middle East.
7
2.3.3 Investing in Heathrow
We invested £687 million in 2017 on a variety of programmes to improve the passenger experience, airport resilience and work through a broad asset replacement programme. We also continued to develop our plans for expanding Heathrow for which investments amounted to approximately £80 million in 2017. We expect expansion-related capital investment to increase to £150-175 million in 2018. Passengers have benefited from improvements delivered in Terminal 4 including increased space in the immigration hall to ease congestion and the opening of a new Gucci store marking the completion of the luxury retail redevelopment. In Terminal 5, premium passengers are enjoying the new ‘First Wing’ offering a fast track route with dedicated security lanes to British Airways’ lounge. In Terminal 5 as well, the final self-boarding gate of the first tranche of works was completed and won the ‘Best Gate Initiative’ at the 2017 Future Travel Experience Global Conference. The self-boarding gates will help reduce boarding times as we continue extending automation across the passenger journey and further enhance efficiency for airlines. New combined body-scanner/metal detectors were also installed in Terminal 5 to enhance the transfer security experience. Airfield improvements continued to meet increased A380 operations with additional taxiway widening and stand modifications now substantially completed. The upgrade of the hold baggage screening machines, which is our largest single investment of the current regulatory period, continues to be delivered across all terminals with a portion of bags in Terminal 5 already being screened through the new security machines. Lastly, in relation to expansion, our key investment was into finalising a review of all the components and options that will underpin the expanded infrastructure. This work informed the preparation of our first planning consultation launched in January 2018.
2.4 Sustainable growth
2.4.1 Heathrow 2.0
In 2017, we launched our sustainability leadership plan ‘Heathrow 2.0’ which aspires to make the airport a centre of excellence in sustainable aviation. Our strategy sets out ambitious goals to reduce the airport’s and the industry’s environmental impacts while maximising economic opportunities across the UK. We want Heathrow to be a great place to work and to create careers, not just jobs, so that the people who work here can fulfil their potential. One of our flagship goals is to facilitate 10,000 apprenticeships by 2030 to help people develop skilled and sustainable careers. Since 2004, the Heathrow Academy has helped over 3,600 local residents find work, 5,800 advance into further training and over 1,500 into apprenticeships. We want Heathrow to be a great place to live and to work better with our neighbours to improve their quality of life, particularly relating to noise and air quality. One of our key goals is to encourage the use of the quietest aircraft available, operated with the least noise impact practicable within an agreed noise envelope. Over the past 30 years, Heathrow’s passenger numbers have more than doubled, while its noise footprint has decreased to its smallest levels yet. Independent analysis showed that in 2017, 15% fewer households were impacted by noise than in 2006. From 1 January 2018, Heathrow increased environmental charges by 7%, incentivising airlines to deploy their cleaner and quieter aircraft at Heathrow. In 2017, we also made progress in reducing the number of late runners with a decrease of 29% to 235 flights operating after 11:30pm (2016: 330 flights). We want Heathrow to be part of a thriving, sustainable economy and to create opportunities for sustainable businesses to deliver a stronger future for the UK. In November 2017, Heathrow became a fully accredited Living Wage Employer, recognised by the Living Wage Foundation. This will see 3,200 airport workers receive the living wage by the end of 2020. Heathrow is also committed to exceed the criteria for accreditation by encouraging other businesses based at the airport to take a similar stance. Finally, we want Heathrow to play a role in ensuring that we have a world worth travelling and to deliver fair and sustainable air travel for future generations to enjoy. Our aspiration is to make growth from our new runway carbon neutral and we will publish a Carbon Neutral Roadmap in 2018. We also have a goal that no illegal wildlife or animal products should pass through Heathrow. As the only airport signatory to the Buckingham Palace Declaration, we want to encourage others to sign up and raise awareness with passengers, colleagues,
8
the cargo community and the global community about the impact of trade in endangered wildlife. In 2017, we worked with UK Border Force and IAG Cargo to support United for Wildlife’s ‘United for Elephants’ campaign and raise awareness of critically endangered species with passengers.
2.4.2 Expansion
2.4.2.1 Key Heathrow developments
Our expansion plans remain on track to deliver a once-in-a-generation boost for Britain’s economy in a way that is affordable, financeable and sustainable. On 17 January 2018, Heathrow launched a 10-week consultation on options for expansion which will run until 28 March. The consultation is a major milestone in the delivery of an expanded Heathrow and is expected to be one of the largest consultations ever in the UK – including 40 events across areas close to Heathrow. The consultation is composed of two parts – the first relating to the physical options needed to deliver and operate an expanded Heathrow and the second on the design principles for the new airspace required to operate an expanded Heathrow. It is an opportunity for the public to help shape at an early stage how the future expanded airport will look and operate. The feedback from this consultation will help Heathrow determine a preferred masterplan which will be presented to the public for a second, statutory consultation in 2019 after which Heathrow will prepare a final planning application known as a Development Consent Order which is expected to be submitted to the Planning Inspectorate in 2020. Heathrow confirmed in December that it could deliver an expanded airport for £2.5 billion less than the plans submitted to the Airports Commission – bringing the total cost of the project down to £14 billion and contributing to meeting the government’s challenge to expand whilst keeping airport charges close to current levels. The physical options related to this emerging scheme are among those included in the consultation referenced above. Work continues to develop an efficient, affordable and sustainable expansion supply chain. In 2017, Heathrow kicked off its search for four logistics hubs which will ultimately help manufacture and assemble components of an expanded Heathrow. Over 120 sites applied and after an initial review, Heathrow long-listed 65 sites for further consideration in 2018. The final locations will pioneer offsite manufacturing, helping to reduce local disruption and environmental impacts whilst spreading jobs created from expanding Heathrow across the UK. Heathrow’s successful Business Summits programme continued to grow in 2017 with seven events taking place across the UK offering small and medium businesses the chance to meet face-to-face with Heathrow’s top suppliers and become part of the airport’s multi-billion-pound supply chain. The Business Summits programme is set to grow even further in 2018, with 10 events scheduled across the UK.
2.4.2.2 Governmental developments
In 2017, the government confirmed expanding Heathrow as strategically important for the UK. The Department for Transport launched two public consultations on a draft Airports National Policy Statement (‘NPS’) which will set the policy framework for expansion. The first consultation ran from February to May with the second following between October and December after updated evidence on aviation demand forecasts and the government’s final air quality plan became available. The government is currently reviewing this feedback and has committed to submitting the final NPS to a vote in Parliament in the first half of 2018. In parallel, the Transport Select Committee launched its own inquiry into the revised NPS in October. It is expected to provide its final recommendation on the revised draft NPS to the Department for Transport this spring following input from a series of public evidence sessions. Expanding Heathrow remains widely supported, particularly in Parliament, with the latest polling showing that over 70% of MPs back the project. In addition, both the Scottish and Welsh Governments, the DUP, major business groups including the CBI, BCC and FSB, union bodies including Unite, GMB and the TUC and airlines like easyJet and Flybe continue to support expanding Heathrow.
9
2.4.2.3 CAA consultation
During 2017, the CAA has further developed its thinking regarding the next regulatory period (H7) which would comprise a significant proportion of the expansion investment phase. The CAA launched two consultations, one in June 2017 ‘Consultation on the core elements of the regulatory framework to support capacity expansion at Heathrow’ and the other in December 2017 ‘Economic regulation of capacity expansion at Heathrow – policy update and consultation’. Responses to the second consultation are due by 2 March 2018. The CAA’s fundamental objective in developing the H7 regulatory framework is to ensure that it appropr iately balances affordability and financeability considerations. In both consultations, the CAA is clear that the regulatory framework for expansion should build on the strengths which have evolved through thirty years of regulation, including continued use of the regulatory asset base (‘RAB’) as the cornerstone of the regulatory framework and a single till approach to determine tariffs. The consultation states that a further extension of Q6 to at least the end of 2020 is expected to be needed, with the CAA emphasising the need for flexibility, in particular the potential need to further extend Q6 to better align the start of H7 with commencement of the expansion construction programme. In terms of economics beyond 2019, in its latest consultation the CAA expresses a preference for a headline price of RPI-0% while various options are being considered to reflect performance on building blocks such as passenger volumes, operating costs, commercial revenues and potentially the cost of debt component of the weighted average cost of capital (‘WACC’). Heathrow is considering its response to this area. The consultations have addressed many aspects of Heathrow’s regulation through expansion including various issues related to financeability and financial resilience such as preliminary views on cost of capital, inflation and debt indexation, minimum creditworthiness, gearing caps and strengthened liquidity requirements. The current consultation includes preliminary work by PwC on defining Heathrow’s allowed WACC in H7 although the CAA specified this analysis does not represent its own views. PwC suggests a real ‘vanilla’ (pre-tax debt and post-tax equity) WACC range of 2.8-4.6% in a 3-runway scenario, estimated to be equivalent to 3.3-5.3% on a consistent basis with the 5.35% applicable in Q6. The preliminary cost of capital for H7 versus Q6 largely reflects two opposing factors, lower cost of debt and equity (driven by market parameters) offset by a risk premium related to expansion. The CAA acknowledges that given expansion’s incremental risks the scale of the premium in Heathrow’s allowed cost of capital will be subject to significant further work over the coming years. As it stands, PwC’s preliminary analysis presents various methodological flaws and erroneous assumptions which Heathrow will address in its response. In terms of defining the cost of debt allowance included in the WACC, the CAA’s initial view is to introduce indexation to a relevant benchmark for just new debt while the cost of embedded debt would continue to be determined as a fixed allowance. With regards to inflation indexation, the CAA has confirmed a gradual transition to consumer price index (‘CPI’) rather than retail price index (‘RPI’) based regulation. Its initial policy for H7 is to continue to use RPI to calculate both the WACC and RAB but it leaves open whether RPI or CPI is used to calibrate the H7 price control, for example, the tariff formula. Away from financeability matters, the CAA provides further details on the definition and information requirements applying for early category C costs (costs related to land acquisition, detailed surveying or design or very early construction) that may be incurred before planning consent is granted. Heathrow expects these costs to amount to several hundred million pounds between 2018 and 2020. The CAA plans to provide additional clarity on the regulatory framework in April 2018 and September 2018 when it publishes its next consultation papers.
2.4.3 Brexit
We are encouraged by the progress made by the government in its Brexit negotiations toward agreeing a transitional period with its European counterparts. As the UK charts its new path outside the European Union
10
as an outward looking nation, it remains particularly important that the country secures continued access to the single European aviation market with around 35% of Heathrow’s traffic to and from European Union member countries. In addition, Heathrow will continue to advocate a deal that maintains efficient flows of both people and goods that will ensure continued access to skills and efficient immigration and cargo processing.
2.5 Key management changes
On 22 January 2018, Heathrow announced that Chris Garton will be joining the company as Chief Operating Officer (‘COO’) in the spring. He held a similar position for nine years at Dubai Airport until late 2016. He was most recently Director of Asset Management at Associated British Ports. During his career, Chris has also held a number of roles in engineering and change management at Gatwick Airport, Ineos and ICI. Chris's imminent arrival at Heathrow follows the appointment of Derek Provan, who has been interim COO since October 2017, as Chief Executive Officer of AGS Airports.
3 Financial review
3.1 Basis of presentation of financial results
Heathrow (SP) Limited (‘Heathrow (SP)’) is the holding company of a group of companies that owns Heathrow airport and operates the Heathrow Express rail service (the ‘Group’). Heathrow (SP) consolidated accounts are prepared under International Financial Reporting Standards (‘IFRS’). The presentation of retail revenue has been changed to more closely reflect the way in which the retail activities are managed. Retail revenues are now presented under five categories: retail concessions, catering, other retail, car parking and other services. Airside specialist shops and duty and tax-free activities drive most of retail concessions revenues. Other retail revenues include advertising and bureau de change while other services income comes primarily from VIP and fast track services and car rental. Recategorised historical values for the new categories are outlined in Appendix 2 and are also available in excel format on the Heathrow investor centre website.
3.2 Income statement
3.2.1 Overview
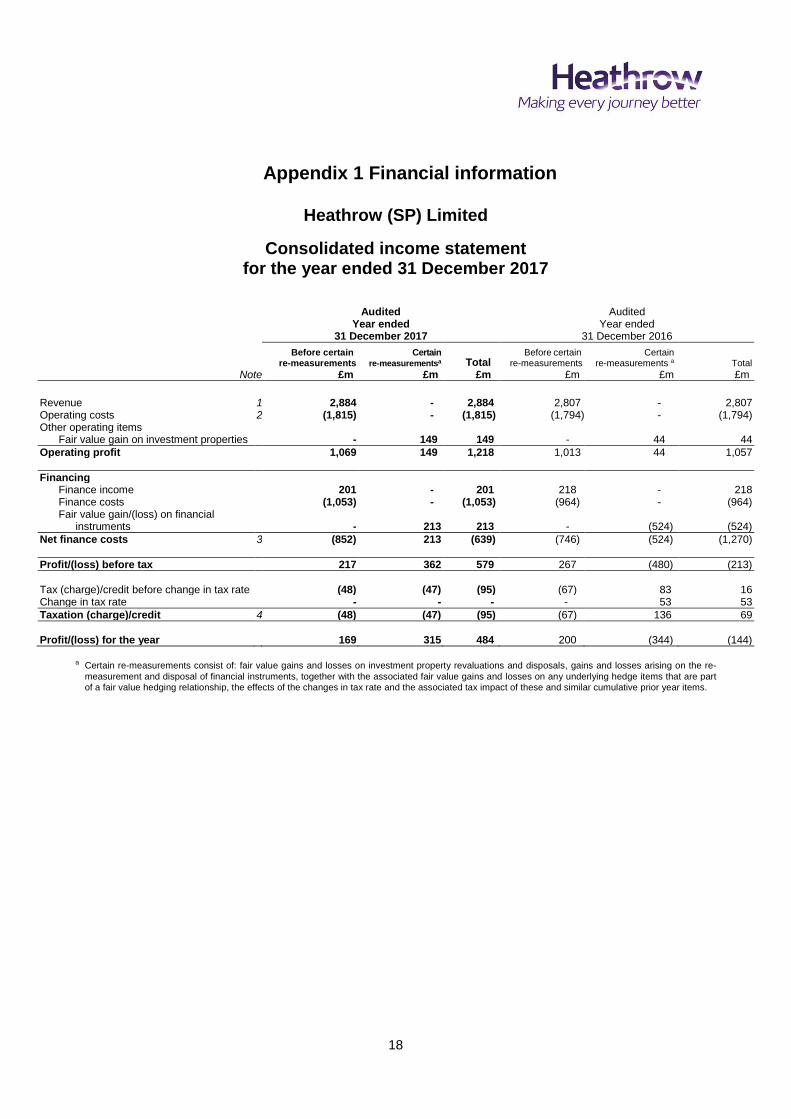
In the year ended 31 December 2017, the Group’s adjusted operating profit was £1,069 million (2016: £1,013 million) and its profit after tax was £484 million (2016: £144 million loss). 2017 2016 Year ended 31 December £m £m
Excluding certain re-measurements Revenue 2,884 2,807 Operating costs before depreciation and amortisation (1,124) (1,125)
Adjusted EBITDA(1) 1,760 1,682 Depreciation and amortisation (691) (669)
Operating profit before certain re-measurements 1,069 1,013
Net finance costs (852) (746)
Adjusted profit before tax 217 267 Including certain re-measurements Fair value gain on investment properties 149 44 Fair value gain/(loss) on financial instruments 213 (524)
Statutory profit/(loss) before tax 579 (213) Tax charge on profit before certain re-measurements (48) (67)
11
Tax (charge)/credit on certain re-measurements (47) 83 Tax credit relating to change in tax rate - 53
Tax (charge)/credit (95) 69
Profit/(loss) after tax 484 (144) (1) Adjusted EBITDA is earnings before interest, tax, depreciation and amortisation, certain re-measurements and exceptional items.
Management uses Adjusted EBITDA to monitor the performance of the segments as it believes it more accurately reflects the underlying financial performance of the Group’s operations. For the year ended 31 December 2017, Adjusted EBITDA was £1,760 million (2016: £1,682 million) and EBITDA was £1,909 million (2016: £1,726 million) after adjusting for fair value gain/loss on investment properties.
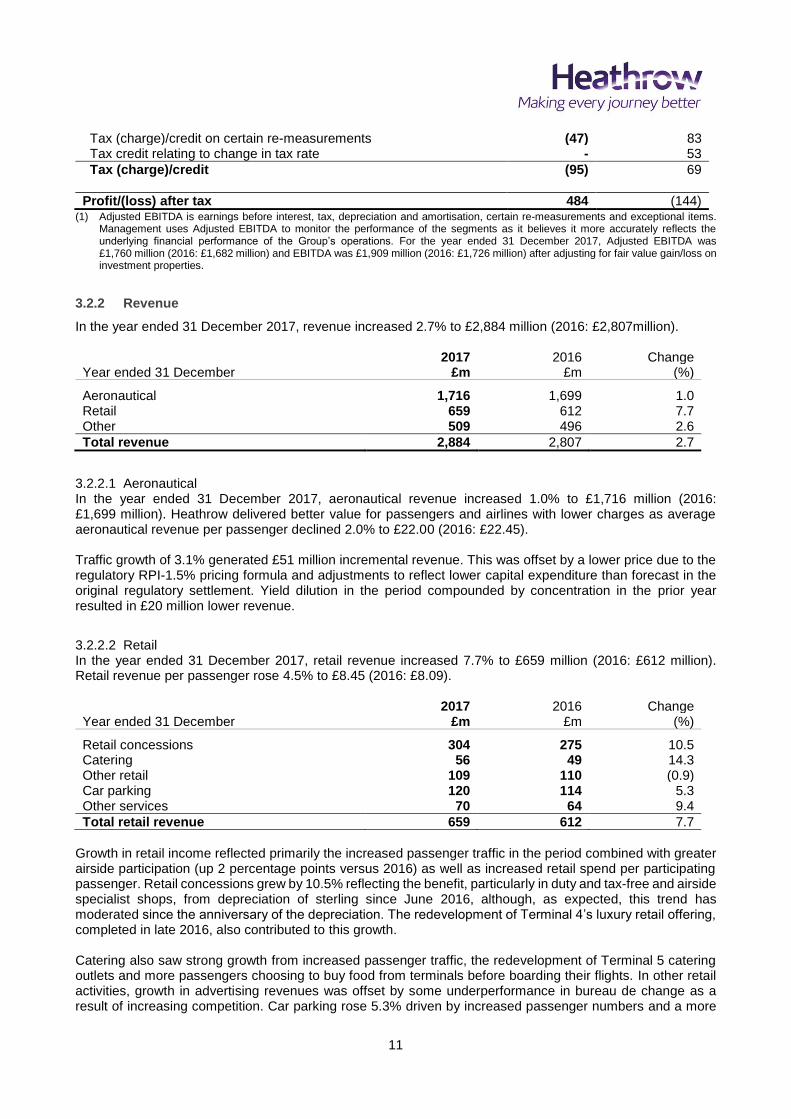
3.2.2 Revenue
In the year ended 31 December 2017, revenue increased 2.7% to £2,884 million (2016: £2,807million). 2017 2016 Change Year ended 31 December £m £m (%)
Aeronautical 1,716 1,699 1.0 Retail 659 612 7.7 Other 509 496 2.6
Total revenue 2,884 2,807 2.7
3.2.2.1 Aeronautical In the year ended 31 December 2017, aeronautical revenue increased 1.0% to £1,716 million (2016: £1,699 million). Heathrow delivered better value for passengers and airlines with lower charges as average aeronautical revenue per passenger declined 2.0% to £22.00 (2016: £22.45). Traffic growth of 3.1% generated £51 million incremental revenue. This was offset by a lower price due to the regulatory RPI-1.5% pricing formula and adjustments to reflect lower capital expenditure than forecast in the original regulatory settlement. Yield dilution in the period compounded by concentration in the prior year resulted in £20 million lower revenue.
3.2.2.2 Retail In the year ended 31 December 2017, retail revenue increased 7.7% to £659 million (2016: £612 million). Retail revenue per passenger rose 4.5% to £8.45 (2016: £8.09). 2017 2016 Change Year ended 31 December £m £m (%)
Retail concessions 304 275 10.5 Catering 56 49 14.3 Other retail 109 110 (0.9) Car parking 120 114 5.3 Other services 70 64 9.4
Total retail revenue 659 612 7.7
Growth in retail income reflected primarily the increased passenger traffic in the period combined with greater airside participation (up 2 percentage points versus 2016) as well as increased retail spend per participating passenger. Retail concessions grew by 10.5% reflecting the benefit, particularly in duty and tax-free and airside specialist shops, from depreciation of sterling since June 2016, although, as expected, this trend has moderated since the anniversary of the depreciation. The redevelopment of Terminal 4’s luxury retail offering, completed in late 2016, also contributed to this growth. Catering also saw strong growth from increased passenger traffic, the redevelopment of Terminal 5 catering outlets and more passengers choosing to buy food from terminals before boarding their flights. In other retail activities, growth in advertising revenues was offset by some underperformance in bureau de change as a result of increasing competition. Car parking rose 5.3% driven by increased passenger numbers and a more
12
dynamic pricing strategy. Higher car rental revenue from a change in arriving passenger mix and increased volumes in VIP services drove other services income up 9.4%.
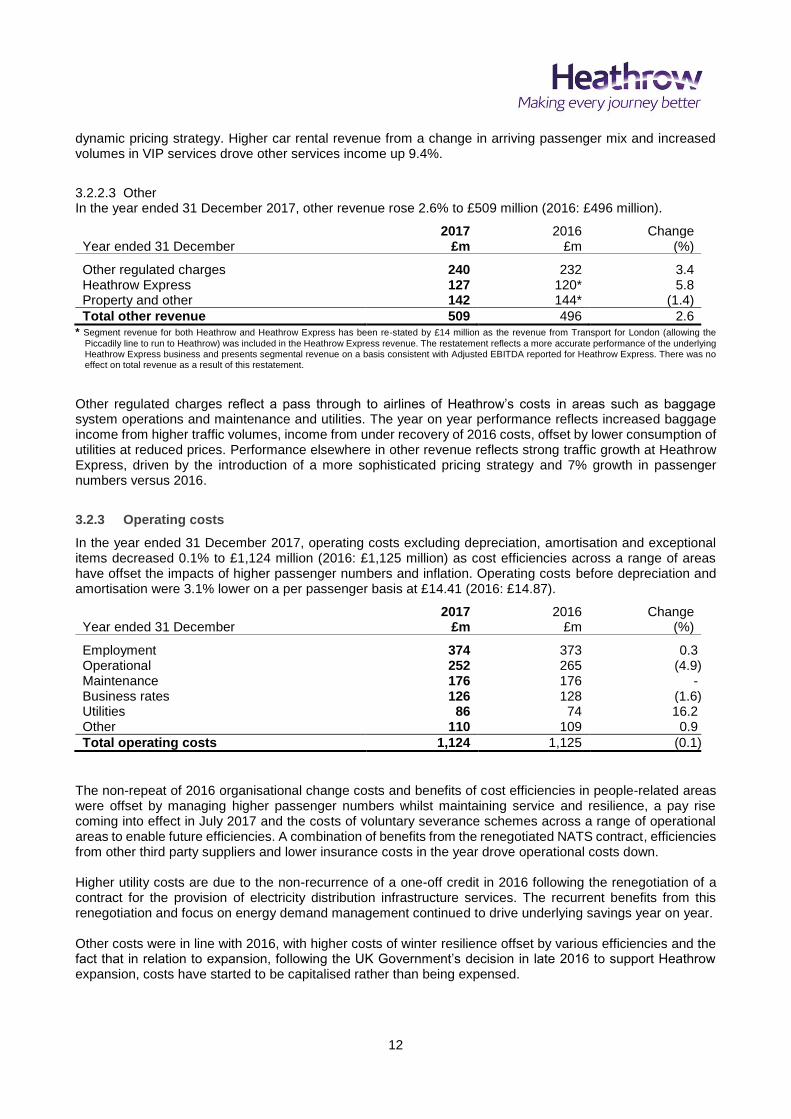
3.2.2.3 Other In the year ended 31 December 2017, other revenue rose 2.6% to £509 million (2016: £496 million).
2017 2016 Change Year ended 31 December £m £m (%)
Other regulated charges 240 232 3.4 Heathrow Express 127 120* 5.8 Property and other 142 144* (1.4)
Total other revenue 509 496 2.6 * Segment revenue for both Heathrow and Heathrow Express has been re-stated by £14 million as the revenue from Transport for London (allowing the
Piccadily line to run to Heathrow) was included in the Heathrow Express revenue. The restatement reflects a more accurate performance of the underlying Heathrow Express business and presents segmental revenue on a basis consistent with Adjusted EBITDA reported for Heathrow Express. There was no effect on total revenue as a result of this restatement.
Other regulated charges reflect a pass through to airlines of Heathrow’s costs in areas such as baggage system operations and maintenance and utilities. The year on year performance reflects increased baggage income from higher traffic volumes, income from under recovery of 2016 costs, offset by lower consumption of utilities at reduced prices. Performance elsewhere in other revenue reflects strong traffic growth at Heathrow Express, driven by the introduction of a more sophisticated pricing strategy and 7% growth in passenger numbers versus 2016.
3.2.3 Operating costs
In the year ended 31 December 2017, operating costs excluding depreciation, amortisation and exceptional items decreased 0.1% to £1,124 million (2016: £1,125 million) as cost efficiencies across a range of areas have offset the impacts of higher passenger numbers and inflation. Operating costs before depreciation and amortisation were 3.1% lower on a per passenger basis at £14.41 (2016: £14.87).
2017 2016 Change Year ended 31 December £m £m (%)
Employment 374 373 0.3 Operational 252 265 (4.9) Maintenance 176 176 - Business rates 126 128 (1.6) Utilities 86 74 16.2 Other 110 109 0.9
Total operating costs 1,124 1,125 (0.1)
The non-repeat of 2016 organisational change costs and benefits of cost efficiencies in people-related areas were offset by managing higher passenger numbers whilst maintaining service and resilience, a pay rise coming into effect in July 2017 and the costs of voluntary severance schemes across a range of operational areas to enable future efficiencies. A combination of benefits from the renegotiated NATS contract, efficiencies from other third party suppliers and lower insurance costs in the year drove operational costs down. Higher utility costs are due to the non-recurrence of a one-off credit in 2016 following the renegotiation of a contract for the provision of electricity distribution infrastructure services. The recurrent benefits from this renegotiation and focus on energy demand management continued to drive underlying savings year on year. Other costs were in line with 2016, with higher costs of winter resilience offset by various efficiencies and the fact that in relation to expansion, following the UK Government’s decision in late 2016 to support Heathrow expansion, costs have started to be capitalised rather than being expensed.
13
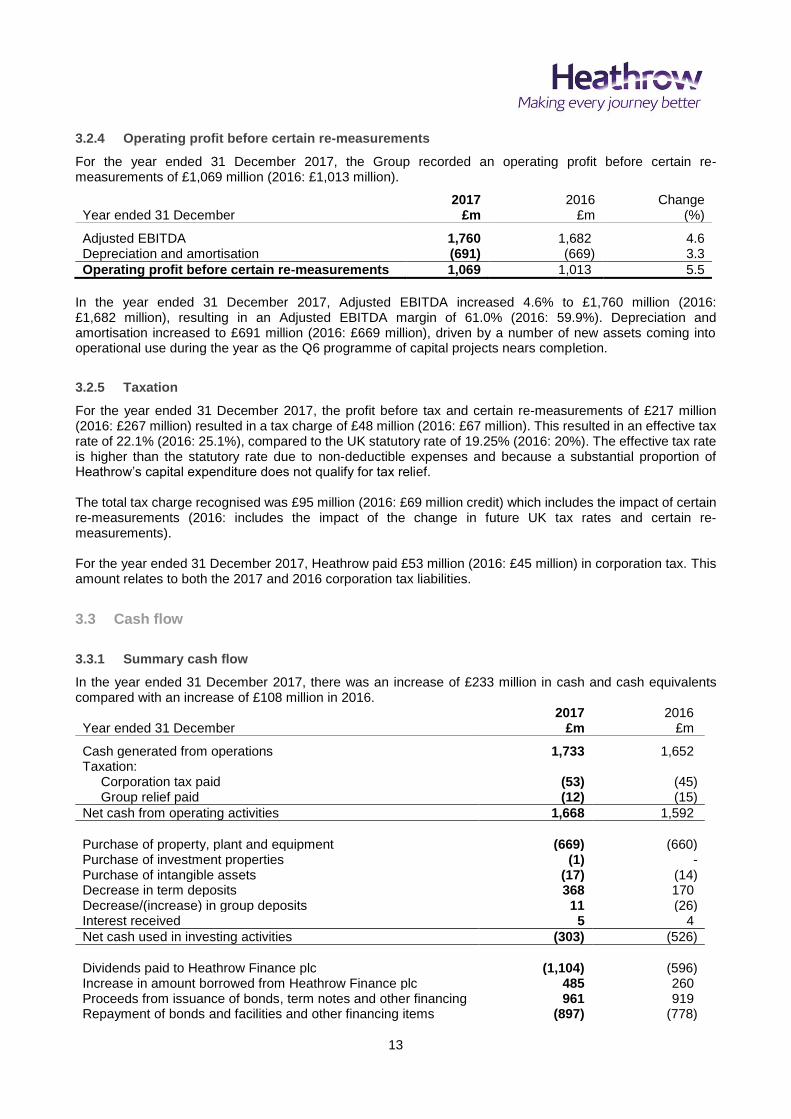
3.2.4 Operating profit before certain re-measurements
For the year ended 31 December 2017, the Group recorded an operating profit before certain re-measurements of £1,069 million (2016: £1,013 million).
2017 2016 Change Year ended 31 December £m £m (%)
Adjusted EBITDA 1,760 1,682 4.6 Depreciation and amortisation (691) (669) 3.3
Operating profit before certain re-measurements 1,069 1,013 5.5
In the year ended 31 December 2017, Adjusted EBITDA increased 4.6% to £1,760 million (2016: £1,682 million), resulting in an Adjusted EBITDA margin of 61.0% (2016: 59.9%). Depreciation and amortisation increased to £691 million (2016: £669 million), driven by a number of new assets coming into operational use during the year as the Q6 programme of capital projects nears completion.
3.2.5 Taxation
For the year ended 31 December 2017, the profit before tax and certain re-measurements of £217 million (2016: £267 million) resulted in a tax charge of £48 million (2016: £67 million). This resulted in an effective tax rate of 22.1% (2016: 25.1%), compared to the UK statutory rate of 19.25% (2016: 20%). The effective tax rate is higher than the statutory rate due to non-deductible expenses and because a substantial proportion of Heathrow’s capital expenditure does not qualify for tax relief. The total tax charge recognised was £95 million (2016: £69 million credit) which includes the impact of certain re-measurements (2016: includes the impact of the change in future UK tax rates and certain re-measurements). For the year ended 31 December 2017, Heathrow paid £53 million (2016: £45 million) in corporation tax. This amount relates to both the 2017 and 2016 corporation tax liabilities.
3.3 Cash flow
3.3.1 Summary cash flow
In the year ended 31 December 2017, there was an increase of £233 million in cash and cash equivalents compared with an increase of £108 million in 2016. 2017 2016 Year ended 31 December £m £m
Cash generated from operations 1,733 1,652 Taxation: Corporation tax paid (53) (45) Group relief paid (12) (15)
Net cash from operating activities 1,668 1,592
Purchase of property, plant and equipment (669) (660) Purchase of investment properties (1) - Purchase of intangible assets (17) (14) Decrease in term deposits 368 170 Decrease/(increase) in group deposits 11 (26) Interest received 5 4
Net cash used in investing activities (303) (526)
Dividends paid to Heathrow Finance plc (1,104) (596) Increase in amount borrowed from Heathrow Finance plc 485 260 Proceeds from issuance of bonds, term notes and other financing 961 919 Repayment of bonds and facilities and other financing items (897) (778)

14
Swap restructuring - 20 Settlement of accretion on index-linked swaps (10) (188) Interest paid (567) (595)
Net cash used in financing activities (1,132) (958)
Net increase in cash and cash equivalents 233 108
Cash generated from operations after capital expenditure and net interest paid 484 387
At 31 December 2017, the Group had £525 million (2016: £660 million) of cash, cash equivalents and term deposits, of which cash and cash equivalents comprised £513 million (2016: £280 million).
3.3.2 Cash generated from operations
In the year ended 31 December 2017, cash generated from operations increased 4.9% to £1,733 million (2016: £1,652 million). The following table reconciles Adjusted EBITDA to cash generated from operations. 2017 2016 Year ended 31 December £m £m
Adjusted EBITDA 1,760 1,682 Increase in receivables and inventories (6) (19) Increase in payables 8 13 (Decrease)/increase in provisions (7) 7 Difference between pension charge and cash contributions (22) (31)
Cash generated from operations 1,733 1,652
3.3.3 Dividends
In the year ended 31 December 2017, Heathrow (SP) paid £1,104 million in dividends to its parent company, Heathrow Finance plc. Of the total amount paid, £598 million was utilised primarily to repay principal and interest on external debt at Heathrow Finance and ADI Finance 2 Limited and the remaining £506 million was used to fund the majority of the £525 million dividends (2016: £325 million) to ultimate shareholders. Dividends to ultimate shareholders reflect the continued strong performance achieved by the business including delivering better value for airlines and passengers and significantly improving service. The dividend payments should be looked at together with the inflows into the Group of £485 million arising from drawing on the inter-company loan with Heathrow Finance plc.
3.3.4 Restricted payments
The financing arrangements of the Group and Heathrow Finance plc (‘Heathrow Finance’) restrict certain payments unless specified conditions are satisfied. These restricted payments include, among other things, payments of dividends, distributions and other returns on share capital, any redemptions or repurchases of share capital, and payments of fees, interest or principal on any intercompany loans. In the year ended 31 December 2017, total restricted payments paid by Heathrow (SP) Limited amounted to £686 million (net) or £1.4 billion (gross). Other than the £506 million payments made by Heathrow (SP) to fund dividends to ultimate shareholders, net restricted payments related to meeting £67 million (2016: £70 million) of interest on the debenture between Heathrow (SP) and Heathrow Finance, £11 million (2016: £29 million) of interest payments at ADI Finance 2 Limited (‘ADIF2’) and an overall further net £102 million which is largely accounted for by the fact that a £75 million loan facility implemented at ADIF2 will only be drawn during 2018.
3.4 Recent financing activity
Heathrow continues to focus on maintaining a strong liquidity position and optimising its long-term cost of debt whilst ensuring duration, diversification and resilience in its debt financing. Heathrow’s debt financing strategy
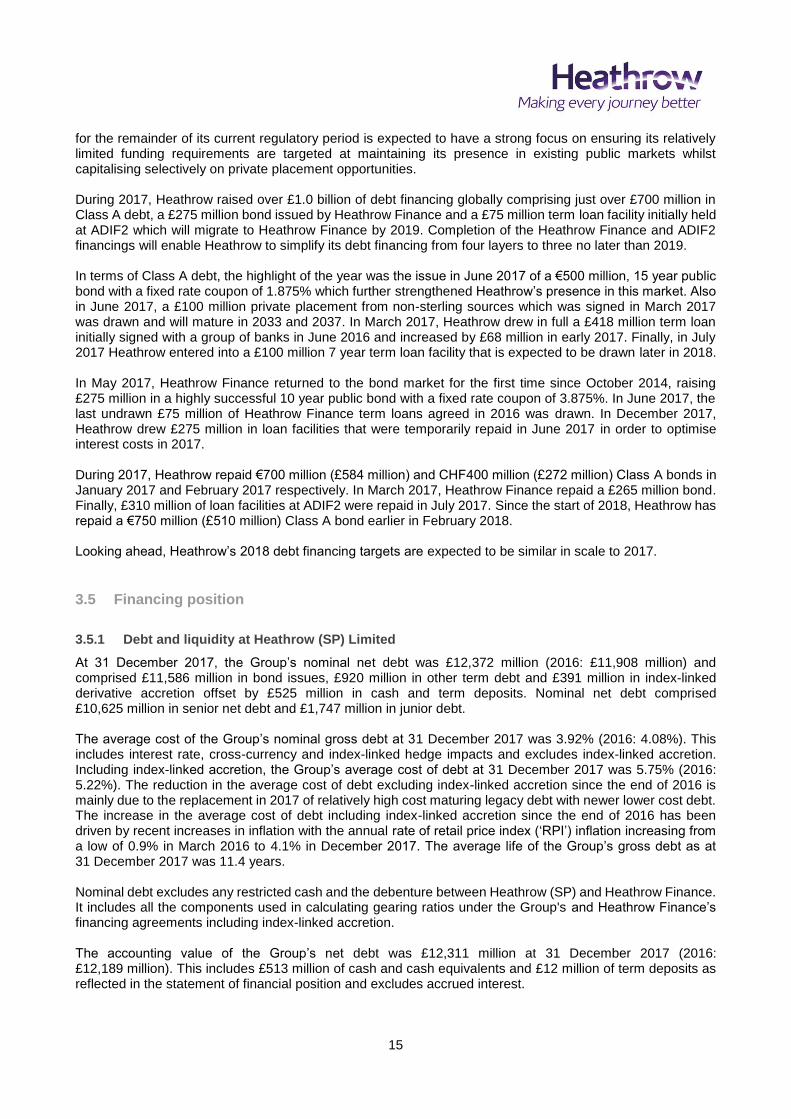
15
for the remainder of its current regulatory period is expected to have a strong focus on ensuring its relatively limited funding requirements are targeted at maintaining its presence in existing public markets whilst capitalising selectively on private placement opportunities. During 2017, Heathrow raised over £1.0 billion of debt financing globally comprising just over £700 million in Class A debt, a £275 million bond issued by Heathrow Finance and a £75 million term loan facility initially held at ADIF2 which will migrate to Heathrow Finance by 2019. Completion of the Heathrow Finance and ADIF2 financings will enable Heathrow to simplify its debt financing from four layers to three no later than 2019. In terms of Class A debt, the highlight of the year was the issue in June 2017 of a €500 million, 15 year public bond with a fixed rate coupon of 1.875% which further strengthened Heathrow’s presence in this market. Also in June 2017, a £100 million private placement from non-sterling sources which was signed in March 2017 was drawn and will mature in 2033 and 2037. In March 2017, Heathrow drew in full a £418 million term loan initially signed with a group of banks in June 2016 and increased by £68 million in early 2017. Finally, in July 2017 Heathrow entered into a £100 million 7 year term loan facility that is expected to be drawn later in 2018. In May 2017, Heathrow Finance returned to the bond market for the first time since October 2014, raising £275 million in a highly successful 10 year public bond with a fixed rate coupon of 3.875%. In June 2017, the last undrawn £75 million of Heathrow Finance term loans agreed in 2016 was drawn. In December 2017, Heathrow drew £275 million in loan facilities that were temporarily repaid in June 2017 in order to optimise interest costs in 2017. During 2017, Heathrow repaid €700 million (£584 million) and CHF400 million (£272 million) Class A bonds in January 2017 and February 2017 respectively. In March 2017, Heathrow Finance repaid a £265 million bond. Finally, £310 million of loan facilities at ADIF2 were repaid in July 2017. Since the start of 2018, Heathrow has repaid a €750 million (£510 million) Class A bond earlier in February 2018. Looking ahead, Heathrow’s 2018 debt financing targets are expected to be similar in scale to 2017.
3.5 Financing position
3.5.1 Debt and liquidity at Heathrow (SP) Limited
At 31 December 2017, the Group’s nominal net debt was £12,372 million (2016: £11,908 million) and comprised £11,586 million in bond issues, £920 million in other term debt and £391 million in index-linked derivative accretion offset by £525 million in cash and term deposits. Nominal net debt comprised £10,625 million in senior net debt and £1,747 million in junior debt. The average cost of the Group’s nominal gross debt at 31 December 2017 was 3.92% (2016: 4.08%). This includes interest rate, cross-currency and index-linked hedge impacts and excludes index-linked accretion. Including index-linked accretion, the Group’s average cost of debt at 31 December 2017 was 5.75% (2016: 5.22%). The reduction in the average cost of debt excluding index-linked accretion since the end of 2016 is mainly due to the replacement in 2017 of relatively high cost maturing legacy debt with newer lower cost debt. The increase in the average cost of debt including index-linked accretion since the end of 2016 has been driven by recent increases in inflation with the annual rate of retail price index (‘RPI’) inflation increasing from a low of 0.9% in March 2016 to 4.1% in December 2017. The average life of the Group’s gross debt as at 31 December 2017 was 11.4 years. Nominal debt excludes any restricted cash and the debenture between Heathrow (SP) and Heathrow Finance. It includes all the components used in calculating gearing ratios under the Group's and Heathrow Finance’s financing agreements including index-linked accretion. The accounting value of the Group’s net debt was £12,311 million at 31 December 2017 (2016: £12,189 million). This includes £513 million of cash and cash equivalents and £12 million of term deposits as reflected in the statement of financial position and excludes accrued interest.
16
Heathrow expects to have sufficient liquidity to meet all its obligations in full until September 2019. The obligations include forecast capital investment (including expected investment over the period related to potential expansion), debt service costs, debt maturities and distributions. This liquidity position takes into account £1.9 billion in undrawn loan facilities and term debt as well as cash resources at 31 December 2017 together with expected operating cash flow over the period.
3.5.2 Debt at Heathrow Finance plc
The consolidated nominal net debt of Heathrow Finance increased 5.1% to £13,674 million (2016: £13,005 million). This comprises the Group’s £12,372 million nominal net debt, Heathrow Finance’s gross debt of £1,312 million and cash held at Heathrow Finance of £10 million.
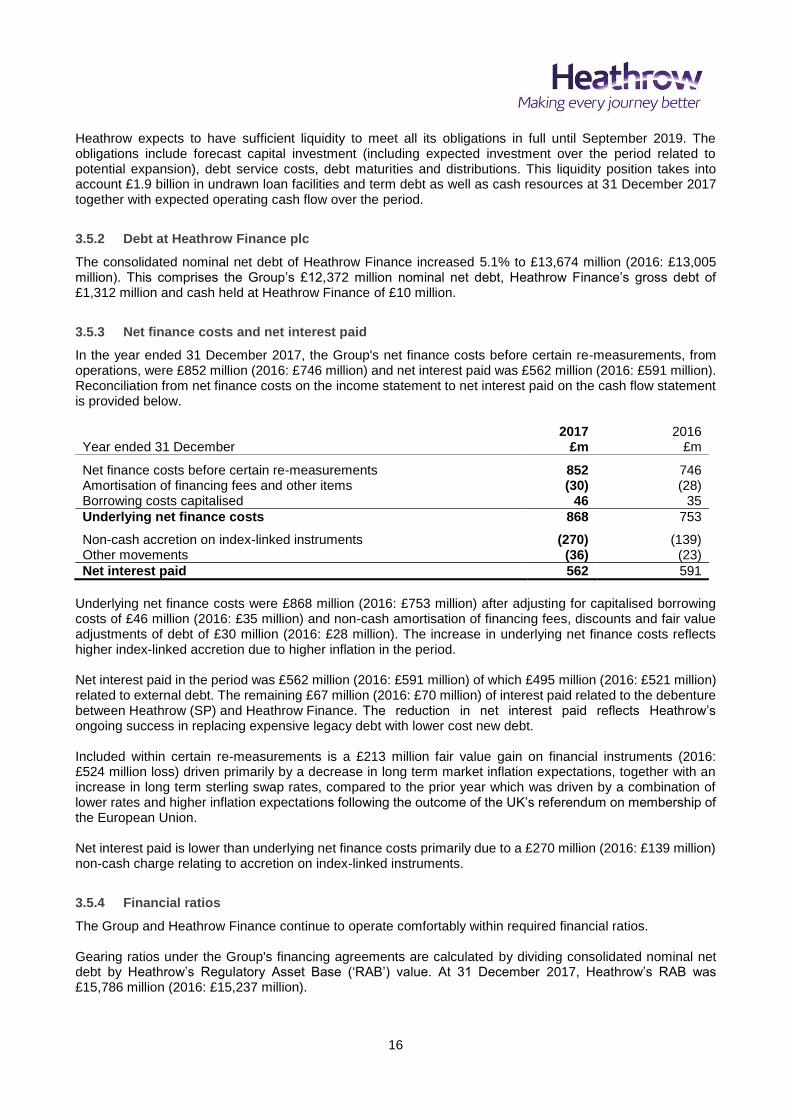
3.5.3 Net finance costs and net interest paid
In the year ended 31 December 2017, the Group's net finance costs before certain re-measurements, from operations, were £852 million (2016: £746 million) and net interest paid was £562 million (2016: £591 million). Reconciliation from net finance costs on the income statement to net interest paid on the cash flow statement is provided below. 2017 2016 Year ended 31 December £m £m
Net finance costs before certain re-measurements 852 746 Amortisation of financing fees and other items (30) (28) Borrowing costs capitalised 46 35
Underlying net finance costs 868 753
Non-cash accretion on index-linked instruments (270) (139) Other movements (36) (23)
Net interest paid 562 591
Underlying net finance costs were £868 million (2016: £753 million) after adjusting for capitalised borrowing costs of £46 million (2016: £35 million) and non-cash amortisation of financing fees, discounts and fair value adjustments of debt of £30 million (2016: £28 million). The increase in underlying net finance costs reflects higher index-linked accretion due to higher inflation in the period. Net interest paid in the period was £562 million (2016: £591 million) of which £495 million (2016: £521 million) related to external debt. The remaining £67 million (2016: £70 million) of interest paid related to the debenture between Heathrow (SP) and Heathrow Finance. The reduction in net interest paid reflects Heathrow’s ongoing success in replacing expensive legacy debt with lower cost new debt. Included within certain re-measurements is a £213 million fair value gain on financial instruments (2016: £524 million loss) driven primarily by a decrease in long term market inflation expectations, together with an increase in long term sterling swap rates, compared to the prior year which was driven by a combination of lower rates and higher inflation expectations following the outcome of the UK’s referendum on membership of the European Union. Net interest paid is lower than underlying net finance costs primarily due to a £270 million (2016: £139 million) non-cash charge relating to accretion on index-linked instruments.
3.5.4 Financial ratios
The Group and Heathrow Finance continue to operate comfortably within required financial ratios. Gearing ratios under the Group's financing agreements are calculated by dividing consolidated nominal net debt by Heathrow’s Regulatory Asset Base (‘RAB’) value. At 31 December 2017, Heathrow’s RAB was £15,786 million (2016: £15,237 million).
17
At 31 December 2017, the Group’s senior (Class A) and junior (Class B) gearing ratios were 67.3% and 78.4% respectively (2016: 66.7% and 78.2% respectively) compared with trigger levels of 70.0% and 85.0% under its financing agreements. Note that the Group’s senior gearing trigger level increases from 70.0% to 72.5% with effect from 1 April 2018. Heathrow Finance’s gearing ratio was 86.6% (2016: 85.4%) compared to a covenant level of 90.0% under its financing agreements. The increase in Heathrow Finance’s gearing reflects the process of simplifying Heathrow’s debt capital structure from four layers to three layers referred to above which involved new debt being raised at Heathrow Finance and repayment of debt at ADIF2. Heathrow Finance’s gearing covenant will increase to 92.5% from 1 September 2019, providing additional gearing headroom. In the year ended 31 December 2017, the Group’s senior and junior interest cover ratios (the ratio of cash flow from operations (excluding cash exceptional items) less tax paid less 2% of RAB to interest paid) were 3.55x and 2.81x respectively (2016: 3.12x and 2.50x respectively) compared to trigger levels of 1.40x and 1.20x under its financing agreements. Heathrow Finance’s interest cover ratio was 2.52x (2016: 2.25x) compared to a covenant level of 1.00x under its financing agreements.
3.6 Pension scheme
Heathrow operates a defined benefit pension scheme, the BAA Pension Scheme, which closed to new members in June 2008. At 31 December 2017, the defined benefit pension scheme, as measured under IAS 19, was funded at 97.1% (2016:98.1%). This translated into a deficit of £124 million (2016: £79 million deficit). The £45 million increase in deficit in the year is primarily due to net actuarial losses of £65 million. In 2017, Heathrow contributed £49 million (2016: £59 million) into the defined benefit pension scheme including £23 million (2016: £25 million) in deficit repair contributions. The deterioration in the scheme actuarial position was driven by a fall in the net discount rate, derived from corporate bond yields, of 0.15% and returns on scheme assets being lower than forecast in the income statement.
3.7 Outlook
Traffic trends in the early weeks of 2018 have been consistent with expectations and forecast Adjusted EBITDA for 2018 remains consistent with the guidance set out in the investor report published in December 2017 of £1,830 million. 2018 should also see a number of developments in relation to Heathrow’s expansion including the conclusion of Heathrow’s first planning consultation in March, further regulatory updates starting in April and a Parliamentary vote on the National Policy Statement by the end of June.
18
Appendix 1 Financial information
Heathrow (SP) Limited
Consolidated income statement for the year ended 31 December 2017
Audited Audited Year ended Year ended 31 December 2017 31 December 2016
Before certain re-measurements
Certain re-measurementsa Total
Before certain re-measurements
Certain re-measurements a Total
Note £m £m £m £m £m £m
Revenue 1 2,884 - 2,884 2,807 - 2,807 Operating costs 2 (1,815) - (1,815) (1,794) - (1,794) Other operating items
Fair value gain on investment properties - 149 149 - 44 44
Operating profit 1,069 149 1,218 1,013 44 1,057
Financing Finance income 201 - 201 218 - 218 Finance costs (1,053) - (1,053) (964) - (964) Fair value gain/(loss) on financial
instruments
- 213 213 - (524) (524)
Net finance costs 3 (852) 213 (639) (746) (524) (1,270)
Profit/(loss) before tax 217 362 579 267 (480) (213)
Tax (charge)/credit before change in tax rate (48) (47) (95) (67) 83 16 Change in tax rate - - - - 53 53
Taxation (charge)/credit 4 (48) (47) (95) (67) 136 69
Profit/(loss) for the year 169 315 484 200 (344) (144)
a Certain re-measurements consist of: fair value gains and losses on investment property revaluations and disposals, gains and losses arising on the re-
measurement and disposal of financial instruments, together with the associated fair value gains and losses on any underlying hedge items that are part of a fair value hedging relationship, the effects of the changes in tax rate and the associated tax impact of these and similar cumulative prior year items.
19
Heathrow (SP) Limited
Consolidated statement of comprehensive income for the year ended 31 December 2017
Audited Audited
Year ended 31 December 2017
Year ended 31 December 2016
£m £m
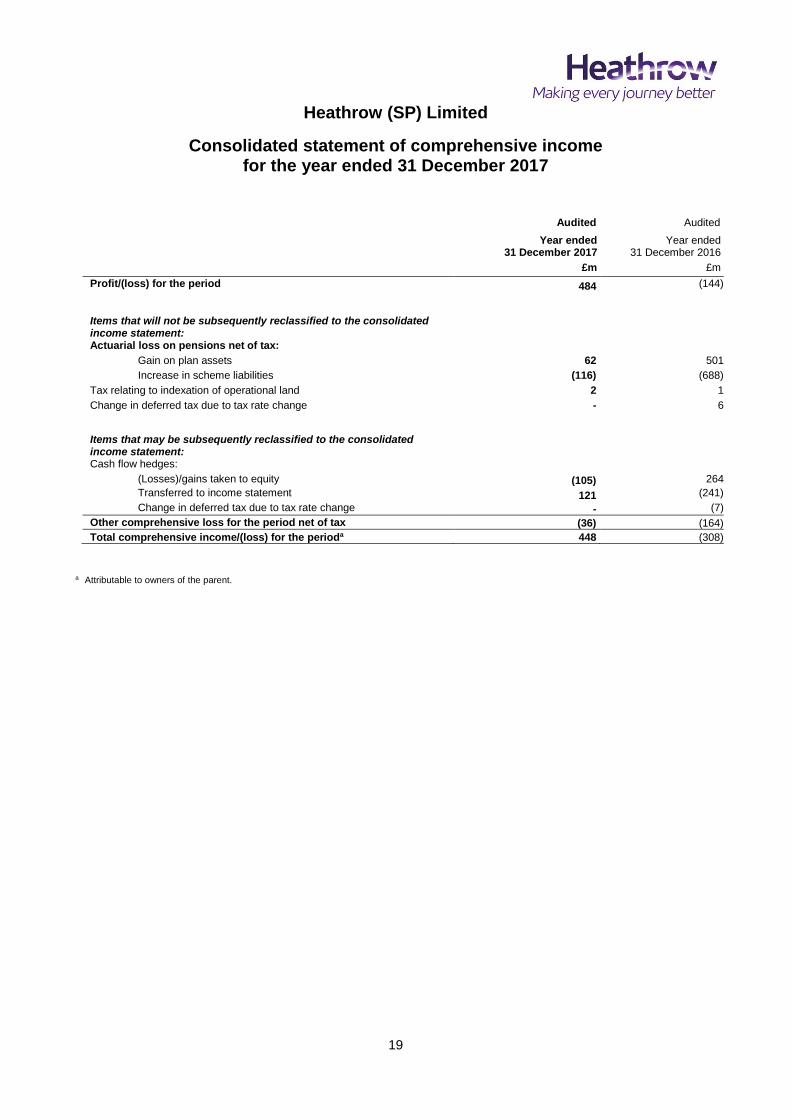
Profit/(loss) for the period 484 (144)
Items that will not be subsequently reclassified to the consolidated income statement:
Actuarial loss on pensions net of tax:
Gain on plan assets 62 501
Increase in scheme liabilities (116) (688)
Tax relating to indexation of operational land 2 1
Change in deferred tax due to tax rate change - 6
Items that may be subsequently reclassified to the consolidated income statement:
Cash flow hedges:
(Losses)/gains taken to equity (105) 264
Transferred to income statement 121 (241)
Change in deferred tax due to tax rate change - (7)
Other comprehensive loss for the period net of tax (36) (164)
Total comprehensive income/(loss) for the perioda 448 (308)
a Attributable to owners of the parent.
20
Heathrow (SP) Limited
Consolidated statement of financial position as at 31 December 2017
Audited
31 December 2017 Audited
31 December 2016
Note £m £m
Assets Non-current assets Property, plant and equipment 11,307 11,306 Investment properties 2,350 2,200 Intangible assets 175 122 Derivative financial instruments 444 676 Trade and other receivables 18 27
14,294 14,331
Current assets Inventories 11 11 Trade and other receivables 258 271 Derivative financial instruments 170 78 Term deposits 12 380 Cash and cash equivalents 513 280
964 1,020
Total assets 15,258 15,351
Liabilities Non-current liabilities Borrowings 5 (13,567) (13,240) Derivative financial instruments (1,459) (1,419) Deferred income tax liabilities (870) (849) Retirement benefit obligation (158) (114) Provisions (8) (9) Trade and other payables (7) (8)
(16,069) (15,639)
Current liabilities Borrowings 5 (1,363) (1,241) Derivative financial instruments (7) - Provisions (6) (12) Current income tax liabilities (30) (30) Trade and other payables (418) (408)
(1,824) (1,691)
Total liabilities (17,893) (17,330)
Net liabilities (2,635) (1,979)
Equity Capital and reserves Share capital 11 11 Share premium 499 499 Merger reserve (3,758) (3,758) Cash flow hedge reserve (252) (268) Retained earnings 865 1,537
Total shareholder’s equity (2,635) (1,979)
21
Heathrow (SP) Limited
Consolidated statement of changes in equity for the year ended 31 December 2017
Attributable to owners of the Company (Audited)
Share capital Share
premium Merger reserve
Cash flow hedge reserve
Retained earnings Total equity
£m £m £m £m £m £m
1 January 2016 11 499 (3,758) (284) 2,457 (1,075)
Comprehensive income:
Loss for the year (144) (144)
Other comprehensive income: Fair value gains on cash flow
hedges net of tax 23 - 23
Actuarial loss on pension net of tax:
Gain on plan assets 501 501
Increase in scheme liabilities (688) (688)
Tax relating to indexation of operational land 1 1
Change in tax rate (7) 6 (1)
Total comprehensive income 16 (324) (308)
Transaction with owners:
Dividends paid to Heathrow Finance plc (596) (596)
Total transaction with owners (596) (596)
31 December 2016 11 499 (3,758) (268) 1,537 (1,979)
Comprehensive income:
Profit for the year
484 484
Other comprehensive income: Fair value gains on cash flow
hedges net of tax 16 16
Actuarial loss on pension net of tax:
Gain on plan assets 62 62
Increase in scheme liabilities (116) (116)
Tax relating to indexation of operational land 2 2
Total comprehensive income 16 432 448
Transaction with owners:
Dividends paid to Heathrow Finance plc (1,104) (1,104)
Total transaction with owners (1,104) (1,104)
31 December 2017 11 499 (3,758) (252) 865 (2,635)

22
Heathrow (SP) Limited
Consolidated statement of cash flows for the year ended 31 December 2017
Audited Audited Year ended Year ended 31 December 2017 31 December 2016 Note £m £m Cash flows from operating activities Cash generated from operations 6 1,733 1,652 Taxation: Corporation tax paid (53) (45) Group relief paid (12) (15)
Net cash from operating activities 1,668 1,592
Cash flows from investing activities Purchase of: Property, plant and equipment (669) (660) Investment properties (1) - Intangible assets (17) (14) Decrease in term deposits1 368 170
Decrease/(increase) in group deposits2 11 (26)
Interest received 5 4
Net cash used in investing activities (303) (526)
Cash flows from financing activities Dividends paid to Heathrow Finance plc (1,104) (596) Increase in amount borrowed from Heathrow Finance plc
485 260 Proceeds from issuance of bonds 443 829 Repayment of bonds (856) (734) Proceeds from issuance of other term debt 518 90 Repayment of facilities and other financing items (41) (44) Swap restructuring - 20 Settlement of accretion on index-linked swaps (10) (188) Interest paid (567) (595)
Net cash used in financing activities (1,132) (958) Net increase in cash and cash equivalents 233 108 Cash and cash equivalents at beginning of year 280 172 Cash and cash equivalents at end of year 513 280
1 Term deposits with an original maturity of over three months are invested at Heathrow Airport Limited and Heathrow (AH) Limited. 2 Group deposits are amounts settled with LHR Airports Limited during the year under the terms of the Shared Service Agreement (SSA).
23
Heathrow (SP) Limited
General information and accounting policies for the year ended 31 December 2017
General information The financial information set out herein does not constitute the Group’s statutory financial statements for the year ended 31 December 2017 or 31 December 2016. Statutory financial statements for the year ended 31 December 2016 have been filed with the registrar of Companies on 23 March 2017. The annual financial information presented herein for the year ended 31 December 2017 is based on, and is consistent with, the audited consolidated financial statements of Heathrow (SP) Limited (the ‘Group’) for the year ended 31 December 2017. The auditors’ report on the 2017 financial statements was unqualified, did not contain an emphasis of matter paragraph and did not contain any statements under section 498(2) or (3) of the Companies Act 2006.
Accounting policies Basis of preparation The consolidated financial statements of Heathrow (SP) Limited have been prepared in accordance with IFRS as issued by the International Accounting Standards Board (‘IASB’) and as adopted by the European Union (‘EU’) and prepared under the historical cost convention, except for investment properties, derivative financial instruments and financial liabilities that qualify as hedged items under a fair value hedge accounting system. These exceptions to the historical cost convention have been measured at fair value in accordance with IFRS and as permitted by the Fair Value Directive as implemented in the Companies Act 2006. The accounting policies adopted in the preparation of this consolidated financial information are consistent with those applied by the Group in its audited consolidated financial statements for the year ended 31 December 2017.
24
Heathrow (SP) Limited
Notes to the consolidated financial information for the year ended 31 December 2017
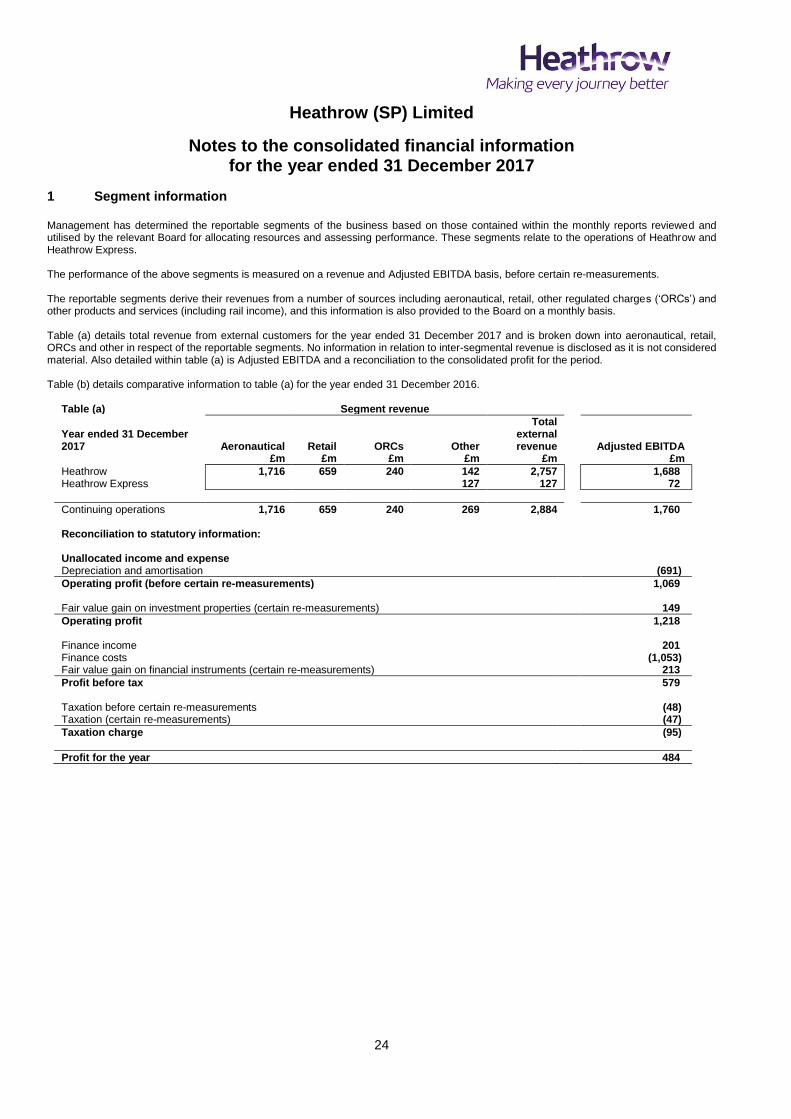
1 Segment information Management has determined the reportable segments of the business based on those contained within the monthly reports reviewed and utilised by the relevant Board for allocating resources and assessing performance. These segments relate to the operations of Heathrow and Heathrow Express. The performance of the above segments is measured on a revenue and Adjusted EBITDA basis, before certain re-measurements. The reportable segments derive their revenues from a number of sources including aeronautical, retail, other regulated charges (‘ORCs’) and other products and services (including rail income), and this information is also provided to the Board on a monthly basis. Table (a) details total revenue from external customers for the year ended 31 December 2017 and is broken down into aeronautical, retail, ORCs and other in respect of the reportable segments. No information in relation to inter-segmental revenue is disclosed as it is not considered material. Also detailed within table (a) is Adjusted EBITDA and a reconciliation to the consolidated profit for the period. Table (b) details comparative information to table (a) for the year ended 31 December 2016.
Table (a) Segment revenue
Year ended 31 December 2017 Aeronautical Retail ORCs Other
Total external revenue Adjusted EBITDA
£m £m £m £m £m £m
Heathrow 1,716 659 240 142 2,757 1,688 Heathrow Express 127 127 72
Continuing operations 1,716 659 240 269 2,884 1,760 Reconciliation to statutory information: Unallocated income and expense Depreciation and amortisation (691)
Operating profit (before certain re-measurements) 1,069 Fair value gain on investment properties (certain re-measurements) 149
Operating profit 1,218 Finance income 201 Finance costs (1,053) Fair value gain on financial instruments (certain re-measurements) 213
Profit before tax 579 Taxation before certain re-measurements (48) Taxation (certain re-measurements) (47)
Taxation charge (95)
Profit for the year 484
25
Heathrow (SP) Limited
Notes to the consolidated financial information
for the year ended 31 December 2017
1 Segment information continued
Table (b) Segment revenue
Year ended 31 December 2016 Aeronautical Retail ORCs Other
Total external revenue Adjusted EBITDA
£m £m £m £m £m £m
Heathrow 1,699 612 232 144* 2,687 1,616 Heathrow Express 120* 120 66
Continuing operations 1,699 612 232 264 2,807 1,682 Reconciliation to statutory information: Unallocated income and expense Depreciation and amortisation (669)
Operating profit (before certain re-measurements) 1,013 Fair value gain on investment properties (certain re-measurements) 44
Operating profit 1,057 Finance income 218 Finance costs (964) Fair value loss on financial instruments (certain re-measurements) (524)
Loss before tax (213) Taxation before certain re-measurements (67) Taxation (certain re-measurements) 136
Taxation credit 69
Loss for the year (144)
* Segment revenue for both Heathrow and Heathrow Express has been re-stated by £14 million as the revenue from Transport for London (allowing the Piccadily line to run to Heathrow) was included in the Heathrow Express revenue. The restatement reflects a more accurate performance of the underlying Heathrow Express business and presents segmental revenue on a basis consistent with Adjusted EBITDA reported for Heathrow Express. There was no effect on total revenue as a result of this restatement.
26
Heathrow (SP) Limited
Notes to the consolidated financial information
for the year ended 31 December 2017
2 Operating costs – ordinary Audited
Year ended 31 December 2017
Audited Year ended
31 December 2016
£m £m
Employment 374 373 Operational 252 265 Maintenance 176 176 Rates 126 128 Utilities 86 74 Other 110 109
Total adjusted operating costs 1,124 1,125 Depreciation and amortisation 691 669
Total operating costs 1,815 1,794
3 Financing
Audited Year ended
31 December 2017
Audited Year ended
31 December 2016 £m £m
Finance income Interest receivable on derivatives not in hedge relationship 198 209 Interest on deposits 3 5 Net pension finance income - 4
201 218
Finance costs Interest on borrowings:
Bonds and related hedging instruments1 (574) (591) Bank loans and overdrafts and related hedging instruments (61) (56)
Interest payable on derivatives not in hedge relationship2 (382) (275) Facility fees and other charges (7) (9) Net pension finance costs (3) - Interest on debenture payable to Heathrow Finance plc (71) (67) Unwinding of discount on provisions (1) (1)
(1,099) (999) Less: capitalised borrowing costs3 46 35
(1,053) (964)
Net finance costs before certain re-measurements (852) (746)
Fair value gain/(loss) on financial instruments Interest rate swaps: not in hedge relationship 61 (122) Index-linked swaps: not in hedge relationship 134 (436) Cross-currency swaps: ineffective portion of cash flow hedges 4 10 Cross-currency swaps: ineffective portion of fair value hedges 14 24
213 (524)
Net finance costs (639) (1,270)
1 Includes accretion of £48 million (2016: £26 million) on index-linked bonds. 2 Includes accretion of £222 million (2016: £113 million) on index-linked swaps. 3 Capitalised interest included in the cost of qualifying assets arose on the general borrowing pool and is calculated by applying an average capitalisation rate of
5.37% (2016: 4.89%) to expenditure incurred on such assets.
27
Heathrow (SP) Limited
Notes to the consolidated financial information
for the year ended 31 December 2017
4 Taxation Audited Audited Year ended 31 December 2017 Year ended 31 December 2016
Before certain re-
measurements Certain re-
measurements Total Before certain re-
measurements Certain re-
measurements Total
£m £m £m £m £m £m
UK corporation tax
Current tax charge at 19.25% (2016: 20%) (63) (2) (65) (56) (2) (58) Under provision in respect of prior years - - - (1) - (1)
Deferred tax Current year (charge)/credit 3 (54) (51) (8) 89 81 Prior year credit/(charge) 12 9 211 (2) (4) (6)
Change in UK corporation tax rate - impact on deferred tax assets and liabilities - - - - 53 53
Taxation (charge)/credit for the year (48) (47) (95) (67) 136 69 1 Prior year credit for 2017 includes a £9 million adjustment in relation to investment properties and a £12 million adjustment for accelerated capital allowances.
The tax (charge)/credit on the Group’s profit/(loss) before tax differs from the theoretical amount that would arise by applying the UK statutory tax rate to the accounting profits of the Group for the reasons set out in the following reconciliation:
Audited Year ended
31 December 2017 £m
Audited Year ended
31 December 2016 £m
Profit before tax (before certain re-measurements) 217 267
Reconciliation of the tax charge Tax calculated at the UK statutory rate of 19.25% (2016: 20%) (42) (53) Adjustments in respect of current income tax of previous years - (1) Net non-deductible expenses (18) (11) Adjustments in respect of deferred income tax of previous years 121 (2)
Total tax charge before certain re-measurements and exceptional items excluding change in UK corporation tax rate (48) (67) Change in UK corporation tax rate - impact on deferred tax assets and liabilities - 53 Tax (charge)/credit on certain re-measurements and exceptional items2 (47) 83
Taxation (charge)/credit for the year (95) 69 1 Prior year adjustment relates to accelerated capital losses. 2 This consists of the tax impact arising from fair value gains on investment property revaluations and fair value gains/(losses) on financial instruments, along with prior year adjustments for investment properties.
28
Heathrow (SP) Limited
Notes to the consolidated financial information
for the year ended 31 December 2017
4 Taxation continued The total tax charge recognised for the year ended 31 December 2017 was £95 million (2016: £69 million credit). Based on a profit before tax for the year of £579 million (2016: £213 million loss), this results in an effective tax rate of 16.4% (2016: 32.4%). Excluding certain re-measurements, the tax charge for the year ended 31 December 2017 was £48 million (2016: £67 million). Based on a profit before tax, excluding certain re-measurements, of £217 million (2016: £267 million), this results in an effective tax rate of 22.1% (2016: 25.1%). The tax charge is more (2016: more) than implied by the statutory rate of 19.25% (2016: 20%) primarily due to non-deductible expenses and because a substantial proportion of Heathrow’s capital expenditure does not qualify for tax relief. The Finance (No. 2) Act 2015 enacted reductions in the main rate of UK corporation tax from 20% to 19% from 1 April 2017 and from 19% to 18% from 1 April 2020. The Finance Act 2016 enacted a further reduction in the main rate of corporation tax to 17% from 1 April 2020. The effects of these rate reductions were reflected in the deferred tax balances in the 2016 financial statements. In November 2017 the Finance (No. 2) Act 2017 received Royal Assent, giving effect to a new interest deductibility regime. This regime is in response to the Organisation for Economic Co-operation and Development (OECD) reports on base erosion and profit shifting (BEPS). As a result of the new legislation, from 1 April 2017, interest deductions are limited to 30% of tax based EBITDA, with the ability to apply a group ratio rule (GRR) and a public infrastructure exemption (PIE). Heathrow will be protected from the 30% of tax based EBITDA cap as a result of applying either the PIE or GRR and therefore no interest disallowance has been reflected in the 2017 tax charge (2016: nil). Other than these changes, there are no items which would materially affect the future tax charge.
29
Heathrow (SP) Limited
Notes to the consolidated financial information
for the year ended 31 December 2017
5 Borrowings
Audited
31 December 2017 Audited
31 December 2016 £m £m
Current borrowings
Secured
Heathrow Airport Limited debt:
Loans 33 36
Heathrow Funding Limited bonds:
4.375% €700 million due 2017 - 598 2.500% CHF400 million due 2017 - 318 4.600% €750 million due 2018 665 - 6.250% £400 million due 2018 399 -
Total current (excluding interest payable) 1,097 952
Interest payable – external 239 266
Interest payable – owed to group undertakings 27 23
Total current 1,363 1,241
Non-current borrowings
Secured
Heathrow Funding Limited bonds:
4.600% €750 million due 2018 - 627
6.250% £400 million due 2018 - 399
4.000% C$400 million due 2019 235 240
6.000% £400 million due 2020 398 398
9.200% £250 million due 2021 266 272
3.000% C$450 million due 2021 260 274
4.875% US$1,000 million due 2021 748 833
1.650%+RPI £180 million due 2022 206 199
1.875% €600 million due 2022 545 534
5.225% £750 million due 2023 683 669
7.125% £600 million due 2024 592 591
0.500% CHF400 million due 2024 293 314
3.250% C$500 million due 2025 286 303
4.221% £155 million due 2026 155 155
6.750% £700 million due 2026 693 692
2.650% NOK1,000 million due 2027 90 93
7.075% £200 million due 2028 198 198
2.500% NOK1,000 million due 2029 81 85
1.500% €750 million due 2030 624 614
6.450% £900 million due 2031 851 850
Zero-coupon €50 million due January 2032 57 52
1.366%+RPI £75 million due 2032 82 79
Zero-coupon €50 million due April 2032 56 52
1.875% €500 million due 2032 442 -
4.171% £50 million due 2034 50 50
Zero-coupon €50 million due 2034 49 46
1.061%+RPI £180 million due 2036 191 183
1.382%+RPI £50 million due 2039 55 53
3.334%+RPI £460 million due 2039 608 587
1.238%+RPI £100 million due 2040 107 103
5.875% £750 million due 2041 738 738
4.625% £750 million due 2046 742 742
1.372%+RPI £75 million due 2049 82 79
2.750% £400 million due 2049 392 392
10,855 11,496
30
Heathrow (SP) Limited
Notes to the consolidated financial information
for the year ended 31 December 2017
5 Borrowings continued
Audited
31 December 2017 Audited
31 December 2016 £m £m
Secured continued
Heathrow Airport Limited debt:
Term notes due 2026-2037 439 339
Loans 445 62
Unsecured
Debenture payable to Heathrow Finance plc 1,828 1,343
Total non-current 13,567 13,240
Total borrowings (excluding interest payable) 14,664 14,192
6 Cash generated from operations
Audited Audited
Year ended Year ended
31 December 2017 31 December 2016
£m £m
Operating activities Profit/(loss) before tax 579 (213) Adjustments for: Fair value (gain)/loss on financial instruments (213) 524 Finance costs 1,053 964
Finance income (201) (218) Depreciation and amortisation 691 669 Fair value gain on investment properties (149) (44)
Working capital changes: (Increase) in inventories and trade and other receivables (6) (19) Increase in trade and other payables 8 13 (Decrease)/increase in provisions (7) 7 Difference between pension charge and cash contributions (22) (31)
Cash generated from operations 1,733 1,652
31
Appendix 2 Presentation of retail revenue
New presentation format
(Recategorised historical data)
Q1 2014
H1 2014
9M 2014
FY 2014
Q1 2015
H1 2015
9M 2015
FY 2015
Q1 2016
H1 2016
9M 2016
FY 2016
Q1 2017
H1 2017
9M 2017
FY 2017
Retail income (£m)
Retail concessions 52 112 176 240 54 116 183 247 59 123 198 275 67 142 223 304
Catering 9 19 29 40 10 21 34 45 11 23 37 49 12 26 42 56
Other retail 18 42 66 91 22 45 74 108 25 51 80 110 26 54 85 109
Car parking 23 48 73 99 25 52 80 107 28 55 86 114 28 58 89 120
Other services 10 25 41 54 12 26 43 61 13 28 48 64 15 33 53 70
Total 112 246 385 524 123 260 414 568 136 280 449 612 148 313 492 659
The presentation of retail revenue has been changed to more closely reflect the way in which the retail activities are managed. Retail revenues are now presented under five categories: retail concessions, catering, other retail, car parking and other services. Airside specialist shops and duty and tax-free activities drive most of retail concessions revenues. Other retail revenues include advertising and bureau de change while other services income comes primarily from VIP and fast track services and car rental.