heating, cooling and ventilating equipment - consumer product
TRANSCRIPT
1
Hazard Screening Report
Heating, Cooling and Ventilating Systems
(Product codes 0304-0312, 0316, 0318, 0322, 0334, 0336, 0340, 0342, 0346, 0348, 0365-0374, 0378-0381, 0384,
0386, 0388-0393, 0399)
This report and all others in this series are general overviews, which use data taken directly from the CPSC data files for the purpose of comparison among the products.
No recoding or adjusting of the data is performed. For this reason, estimates for injuries provided in this report will differ from estimates presented in other documents
produced by Epidemiology staff working in specific program areas. The figures presented here are not intended to compare to other reports outside this series of
hazard screening reports.
The views expressed in this report are those of CPSC staff, have not been reviewed or approved by, and may not reflect the views of, the Commissioners.
August 2005
Alberta Mills, B.S. George Rutherford, M.S. Natalie Marcy, B.S.

2
The Hazard Screening Project As an aid in setting priorities, CPSC staff is preparing a series of Hazard Screening Reports. Each report covers a group of related products, such as nursery equipment, housewares, etc. These reports follow a common format that allows readers to compare the risk for different types of products within a given category. Significantly, CPSC staff has also developed a measurement tool that allows comparisons of risks from products in different categories. This feature, called “Maximum Addressable Cost Estimates,” is explained more fully below. CPSC managers plan to use this information to set priorities for efficient use of resources. Each Hazard Screening Report contains information on the estimated number of injuries and deaths associated with the type of products covered in that report. A graph shows the frequency of emergency room-treated injuries over time. This is followed by a pie chart showing the distribution of injuries by the source of the hazard, such as mechanical, fire, electrical, chemical and other. CPSC staff also estimates the total cost to society of each type of product. This includes but is not confined to the cost of injuries and deaths associated with the products. To facilitate comparisons of risk between different types of products, CPSC staff has developed maximum addressable cost estimates. These build on the concept of “addressable” cost. Simply put, the “addressable” cost is the portion of the total cost that could possibly be reduced by some action that CPSC could take. Many consumer injuries are not addressable. For example, if a boy trips over a rake in the driveway, any injury he suffers could be associated with the category of yard and garden equipment. But it is very unlikely that such injuries could be prevented by changing the design of rakes. By eliminating these unaddressable costs from consideration, we are able to focus on what’s left -- the costs that we might be able to do something about. The term “maximum addressable cost estimates” is intended to emphasize that these estimates are upper limits of the cost that might be successfully addressed. It should also be stressed that the term does not necessarily mean that there is any existing method or technology for reducing the costs. For a more detailed explanation of this subject, please refer to the individual Hazard Screening Reports. CPSC staff plans to complete 19 reports by the end of 2005. As each report is completed there will be an active link to it on the CPSC website. The 19 reports that will comprise the complete set are: Home Workshop Apparatus, Tools and Attachments Yard and Garden Equipment Toys Nursery Products Children’s Outdoor Activities and Equipment Major Team Sports Injuries to Persons 65 and Older

3
Housewares and Kitchen Appliances Recreational Cooking and Camping Products Home Communication, Entertainment and Hobby Products General Household Appliances Home Furnishings and Fixtures and Home Alarm, Escape and Protection Devices Sports (minus major team sports) Personal Use Items Heating, Cooling and Ventilating Equipment Packaging and Containers for Household Products Miscellaneous Products Home Structures and Construction Materials Home and Family Maintenance Products – Household Chemicals These reports will be useful to individuals and organizations who are seeking reliable information about estimated deaths, injuries, and costs associated with consumer products and to CPSC’s staff and Commissioners who need objective data to identify candidates for future activities to reduce deaths and injuries.

4
CAVEAT! This report addresses the question of addressability of injuries by attempting to identify those injuries that are incidental and not addressable by mandatory or voluntary standards or by other action which the CPSC could take. Those injuries that remain are referred to as “maximum addressable.” To know the actual addressability of the hazards associated with a product usually requires a detailed study of the problem, and the product. This level of study is not feasible for this type of overview report. What we do instead is try to eliminate those injuries and deaths that involve the product only marginally or incidentally. Maximum addressable costs are then generated by the Injury Cost Model1 using the remaining injuries. The maximum addressable cost estimate does not necessarily represent the injury and death costs that the CPSC actually might be able to prevent each year through some type of action. It represents only a target population from which any successful prevention will have to come. Therefore, while the report states that the maximum addressable percentage of the costs is about 26%, it would be incorrect to say that 26% of the injuries or 26% of the costs are addressable. For example: If a consumer sustained a laceration injury on a fan blade, but we have no information about the type of contact that resulted in the laceration, we would count that incident in the maximum addressable category. It may not be addressable but we just don’t have enough information to rule it out. Maximum addressable injury estimates include every case that we could not clearly rule out as incidental. They do not represent the number or percent of injuries that could actually be prevented. In addition, addressability definitions are based on review by Epidemiology staff using information available at the time each report is prepared. These determinations should be considered general estimates for agency planning purposes, not definitive staff evaluations of whether a specific type of hazard might be prevented. The fact that a given hazard associated with a product was not considered addressable in one of these reports should not be construed as indicating that that hazard should never be reconsidered or addressed. See the methodology section for the data sources used to write this report.
1 The Injury Cost Model is described on page 19.

5
Introduction
The group of product codes included in this report consists of heating, cooling and ventilating systems. The report provides several pieces of information that will allow the reader to compare the products within this report as well as to compare with products and activities in other categories in other reports in this series. This report shows an index of the number of overall injur ies and deaths associated with heating, cooling and ventilating systems. The first information presented is a summary of the injury, death and cost data for the entire class of products. A trend graphic is presented which shows the frequency of emergency room-treated injuries since 1997. This is followed by a pie chart showing the distribution of the injuries by energy source of the hazard, i.e., mechanical, fire, electrical, chemical, other. There is also a summary table, which shows the injuries, deaths and costs associated with each product group. The report also addresses the question of addressability of the injuries, by attempting to identify those injuries which are incidental and not addressable by mandatory or voluntary standards or by other action which the CPSC could take.
6
Heating, Cooling and Ventilating Systems Product Categories Humidifiers, Vaporizers, Purifiers
Coal or Wood Heating
Gas Heating
Oil Furnaces
Electric Heating
Fireplaces Miscellaneous Heating or Components Fans Air Conditioners Kerosene or Oil Heaters
. 7
Heating, Cooling and Ventilating Systems (Product codes 0304-0312, 0316, 0318, 0322, 0334, 0336, 0340, 0342, 0346, 0348, 0365-0374,
0378-0381, 0384, 0386, 0388-0393, 0399)
Humidifiers, Vaporizers, Purifiers; Coal or Wood Heating; Gas Heating; Oil Furnaces; Electric Heating; Fireplaces; Miscellaneous Heating or Components; Fans, Air
Conditioners; and Kerosene or Oil Heaters
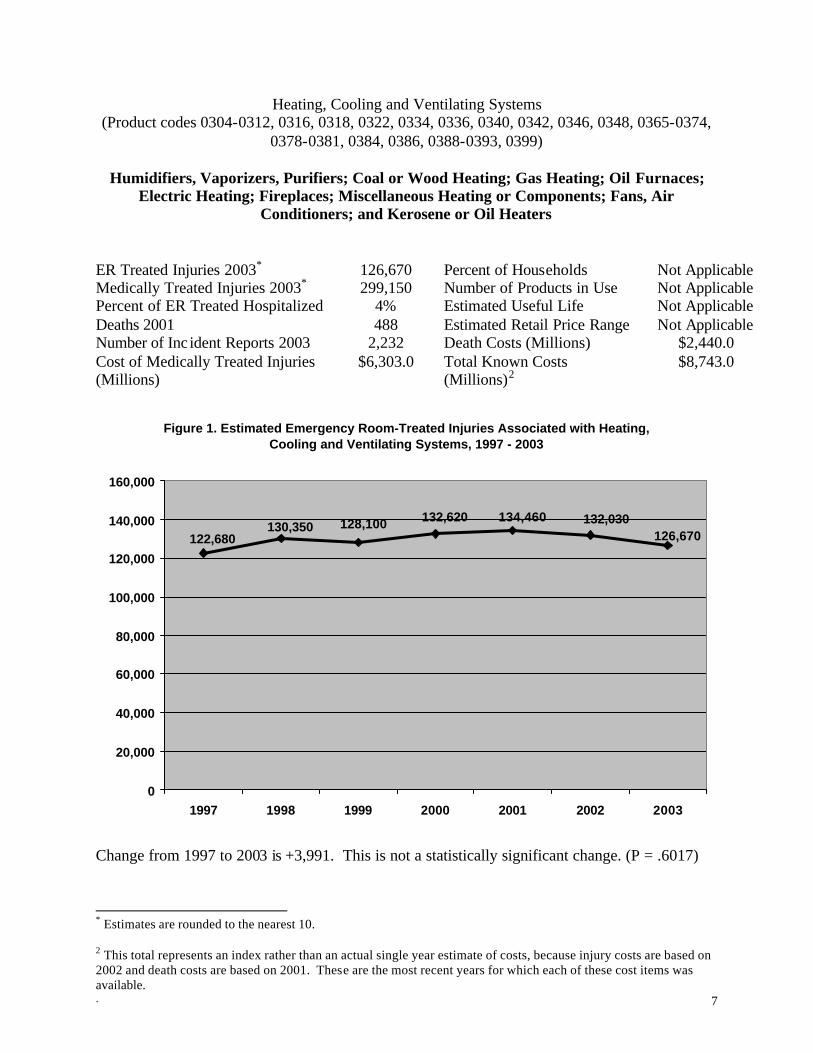
ER Treated Injuries 2003* 126,670 Percent of Households Not Applicable Medically Treated Injuries 2003* 299,150 Number of Products in Use Not Applicable Percent of ER Treated Hospitalized 4% Estimated Useful Life Not Applicable Deaths 2001 488 Estimated Retail Price Range Not Applicable Number of Inc ident Reports 2003 2,232 Death Costs (Millions) $2,440.0 Cost of Medically Treated Injuries (Millions)
$6,303.0 Total Known Costs (Millions)2
$8,743.0
Figure 1. Estimated Emergency Room-Treated Injuries Associated with Heating, Cooling and Ventilating Systems, 1997 - 2003
126,670132,030134,460132,620128,100130,350
122,680
0
20,000
40,000
60,000
80,000
100,000
120,000
140,000
160,000
1997 1998 1999 2000 2001 2002 2003
Change from 1997 to 2003 is +3,991. This is not a statistically significant change. (P = .6017)
* Estimates are rounded to the nearest 10. 2 This total represents an index rather than an actual single year estimate of costs, because injury costs are based on 2002 and death costs are based on 2001. These are the most recent years for which each of these cost items was available.

. 8
Figure 2. Distribution of Emergency Room-Treated Injuries by Energy Source of the Hazard for Heating, Cooling and Ventilating Systems
Estimated Percent of Emergency Room-Treated Injuries Associated with Heating, Cooling and Ventilating Systems, by Hazard Categories, 2003
Fire11.61%
Electrical0.33%
Chemical2.65%
Other or Not Specified4.15%
Mechanical81.27%
Chemical
Electrical
Fire
Mechanical
Other or Not Specified
Deaths
In 2001, CPSC received 488 reports of deaths that were associated with heating, cooling and ventilating systems. Most of these deaths resulted from fires attributed to unspecified/unknown product defects and carbon monoxide exposure due to faulty furnaces/improper ventilation. There were 196 deaths associated with miscellaneous heating or components; 95 deaths associated with gas heating; 51 deaths associated with coal or wood heating; 47 deaths associated with kerosene or oil heaters; 42 deaths associated with electric heating; 29 deaths associated with air conditioners; 15 deaths associated with fireplaces; 8 deaths associated with fans; 4 deaths associated with oil furnaces and 1 death involved an air purifier. A total of 321 deaths out of the 488 were determined to fit into the category of maximum addressable; these included deaths associated with carbon monoxide poisonings, clothing ignition burns sustained from contact with hot surfaces of heaters and burns sustained in fires attributed to product failures.
. 9
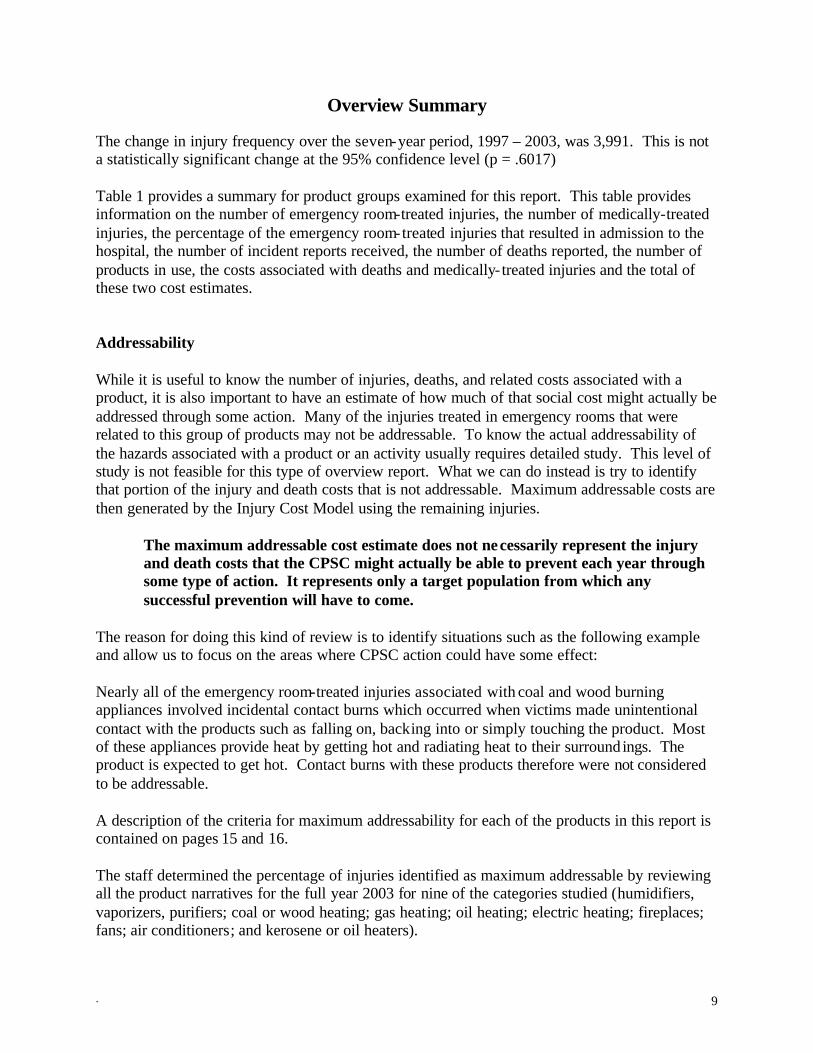
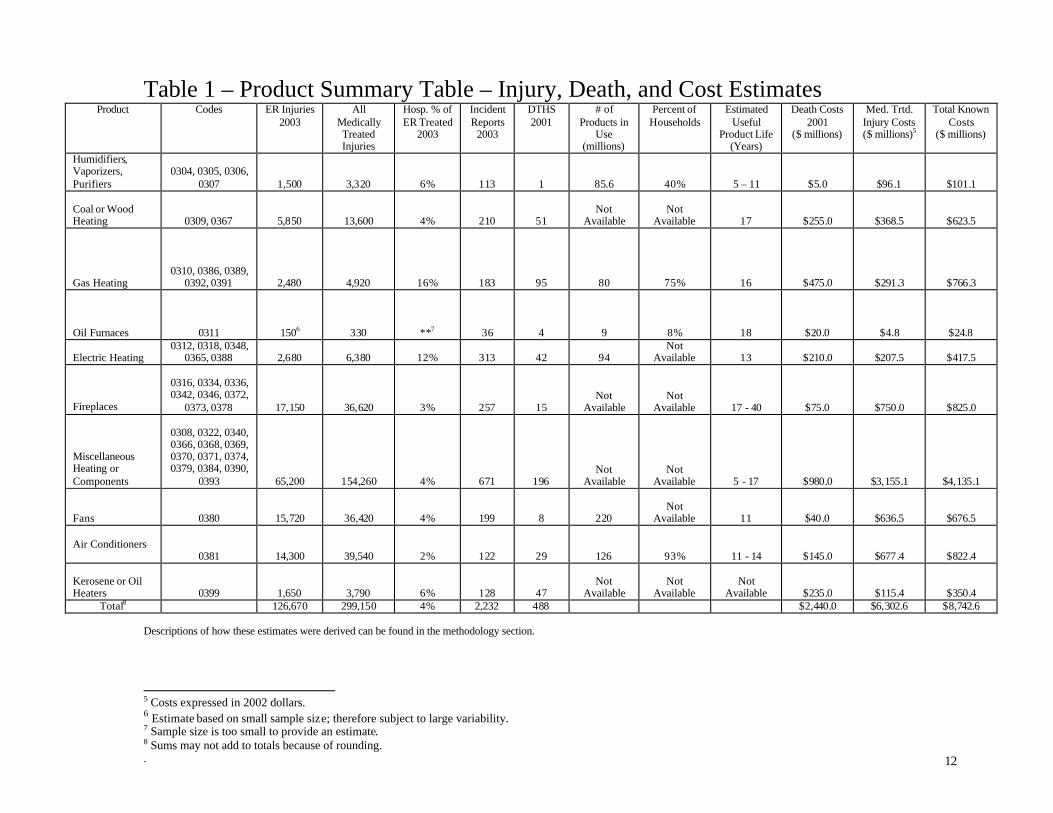
Overview Summary The change in injury frequency over the seven-year period, 1997 – 2003, was 3,991. This is not a statistically significant change at the 95% confidence level (p = .6017) Table 1 provides a summary for product groups examined for this report. This table provides information on the number of emergency room-treated injuries, the number of medically-treated injuries, the percentage of the emergency room-treated injuries that resulted in admission to the hospital, the number of incident reports received, the number of deaths reported, the number of products in use, the costs associated with deaths and medically- treated injuries and the total of these two cost estimates. Addressability While it is useful to know the number of injuries, deaths, and related costs associated with a product, it is also important to have an estimate of how much of that social cost might actually be addressed through some action. Many of the injuries treated in emergency rooms that were related to this group of products may not be addressable. To know the actual addressability of the hazards associated with a product or an activity usually requires detailed study. This level of study is not feasible for this type of overview report. What we can do instead is try to identify that portion of the injury and death costs that is not addressable. Maximum addressable costs are then generated by the Injury Cost Model using the remaining injuries.
The maximum addressable cost estimate does not necessarily represent the injury and death costs that the CPSC might actually be able to prevent each year through some type of action. It represents only a target population from which any successful prevention will have to come.
The reason for doing this kind of review is to identify situations such as the following example and allow us to focus on the areas where CPSC action could have some effect: Nearly all of the emergency room-treated injuries associated with coal and wood burning appliances involved incidental contact burns which occurred when victims made unintentional contact with the products such as falling on, backing into or simply touching the product. Most of these appliances provide heat by getting hot and radiating heat to their surround ings. The product is expected to get hot. Contact burns with these products therefore were not considered to be addressable. A description of the criteria for maximum addressability for each of the products in this report is contained on pages 15 and 16. The staff determined the percentage of injuries identified as maximum addressable by reviewing all the product narratives for the full year 2003 for nine of the categories studied (humidifiers, vaporizers, purifiers; coal or wood heating; gas heating; oil heating; electric heating; fireplaces; fans; air conditioners; and kerosene or oil heaters).

. 10
For the remaining category, miscellaneous heating or components, a random sample was selected of 300 of these cases for the year, and the narratives were reviewed to determine percentages of addressability. The cases identified as potentially addressable and those identified as not addressable were then input to the Injury Cost Model, to determine the proportion of the costs which may be addressable. The percentages were then applied to the overall cost totals for the entire estimate for the product group to produce overall costs of injuries identified as maximum addressable. Addressability for deaths was determined by reading the narrative of the death certificate or fatal incident report. Because the death reports often have more information than the NEISS reports, addressability was easier to determine. The cost of deaths was determined by applying the value of $5 million for each death. The value of a statistical life of $5 million is consistent with current economic literature. This cost is frequently expressed in the literature using a range of $3 million to $7 million. For the purpose of consistency and ease of comparison, we have used the midpoint of this range in this report. The maximum addressable cost estimate for medically attended injuries is added to the maximum addressable cost estimate for the deaths to obtain the total maximum addressable cost estimate. Table 2 shows the percentage of injuries included in the maximum addressable category for each product group. It also shows how many of the deaths reported were included in the maximum addressable category. Overall, after applying this process of review of the data to the entire category of heating, cooling and ventilating systems, we find that the total maximum addressable injury and death cost is $2.3 billion, out of a total cost associated with these products of $8.7 billion, about 26% maximum addressable. The miscellaneous heating or components group contained nearly half of the total costs and over a third of addressable costs for the products studied in this report (more than half of the maximum addressable costs for miscellaneous heating or components come from the deaths reported for this group). This is to be expected due to the number of products contained in the group (as well as the unspecified nature of the products). One of the products classified in the miscellaneous category is pipes. However, not all of the emergency room-treated injuries for pipes involved heating pipes, because the code for pipes (0374) encompasses nonheating pipes, bars, rods and all products of that nature so the injury estimates above also reflect nonheating pipe injuries. Some of the nonheating pipe-related injuries described in the narratives were: “passenger in a bus when bus hit pipes”; “playing at grandma’s house walked into a steel bar”; “cut face on metal bar”; “…hit tooth on an iron bar”. Incidents in the pipes category that could not be determined to apply to heating, cooling or ventilating equipment were not considered as potentially addressable. The emergency room-treated injuries reviewed for this report exclude carbon monoxide-related injuries because CPSC staff has not produced estimates for CO poisoning for years after 1999 due to concerns about the potential inaccuracy of such estimates3.
3 Vagts, S. (February, 2003). Emergency Room Visits Associated with a Potential Carbon Monoxide Exposure and a Consumer Product. U.S. Consumer Product Safety Commission. Washington D.C.
. 11
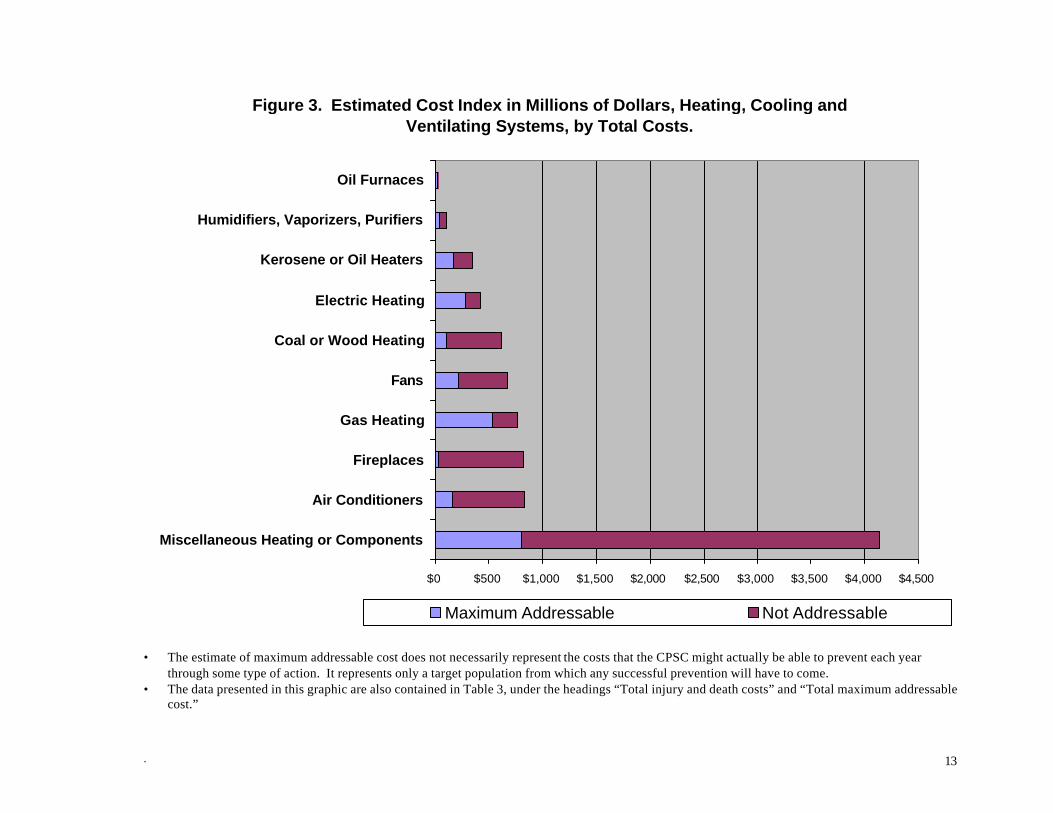
Figure 3 shows the index4 of estimated injury and death costs for each of the product categories and the estimated maximum addressability of those costs.
4 This total represents an index rather than an actual single year estimate of costs, because injury costs are based on 2002 and the death costs are based on 2001. These are the most recent years for which each of these cost items was available.
. 12
Table 1 – Product Summary Table – Injury, Death, and Cost Estimates Product Codes ER Injuries
2003 All
Medically Treated Injuries
Hosp. % of ER Treated
2003
Incident Reports
2003
DTHS 2001
# of Products in
Use (millions)
Percent of Households
Estimated Useful
Product Life (Years)
Death Costs 2001
($ millions)
Med. Trtd. Injury Costs ($ millions)5
Total Known Costs
($ millions)
Humidifiers, Vaporizers, Purifiers
0304, 0305, 0306,
0307
1,500
3,320
6%
113
1
85.6
40%
5 – 11
$5.0
$96.1
$101.1 Coal or Wood Heating
0309, 0367
5,850
13,600
4%
210
51
Not
Available
Not
Available
17
$255.0
$368.5
$623.5 Gas Heating
0310, 0386, 0389, 0392, 0391
2,480
4,920
16%
183
95
80
75%
16
$475.0
$291.3
$766.3 Oil Furnaces
0311
1506
330
**7
36
4
9
8%
18
$20.0
$4.8
$24.8 Electric Heating
0312, 0318, 0348, 0365, 0388
2,680
6,380
12%
313
42
94
Not Available
13
$210.0
$207.5
$417.5
Fireplaces
0316, 0334, 0336, 0342, 0346, 0372,
0373, 0378
17,150
36,620
3%
257
15
Not Available
Not Available
17 - 40
$75.0
$750.0
$825.0
Miscellaneous Heating or Components
0308, 0322, 0340, 0366, 0368, 0369, 0370, 0371, 0374, 0379, 0384, 0390,
0393
65,200
154,260
4%
671
196
Not Available
Not Available
5 - 17
$980.0
$3,155.1
$4,135.1 Fans
0380
15,720
36,420
4%
199
8
220
Not
Available
11
$40.0
$636.5
$676.5 Air Conditioners
0381
14,300
39,540
2%
122
29
126
93%
11 - 14
$145.0
$677.4
$822.4 Kerosene or Oil Heaters
0399
1,650
3,790
6%
128
47
Not
Available
Not
Available
Not
Available
$235.0
$115.4
$350.4 Total8 126,670 299,150 4% 2,232 488 $2,440.0 $6,302.6 $8,742.6
Descriptions of how these estimates were derived can be found in the methodology section.
5 Costs expressed in 2002 dollars. 6 Estimate based on small sample size; therefore subject to large variability. 7 Sample size is too small to provide an estimate. 8 Sums may not add to totals because of rounding.
. 13
Figure 3. Estimated Cost Index in Millions of Dollars, Heating, Cooling and Ventilating Systems, by Total Costs.
$0 $500 $1,000 $1,500 $2,000 $2,500 $3,000 $3,500 $4,000 $4,500
Miscellaneous Heating or Components
Air Conditioners
Fireplaces
Gas Heating
Fans
Coal or Wood Heating
Electric Heating
Kerosene or Oil Heaters
Humidifiers, Vaporizers, Purifiers
Oil Furnaces
Maximum Addressable Not Addressable
• The estimate of maximum addressable cost does not necessarily represent the costs that the CPSC might actually be able to prevent each year
through some type of action. It represents only a target population from which any successful prevention will have to come. • The data presented in this graphic are also contained in Table 3, under the headings “Total injury and death costs” and “Total maximum addressable
cost.”
. 14
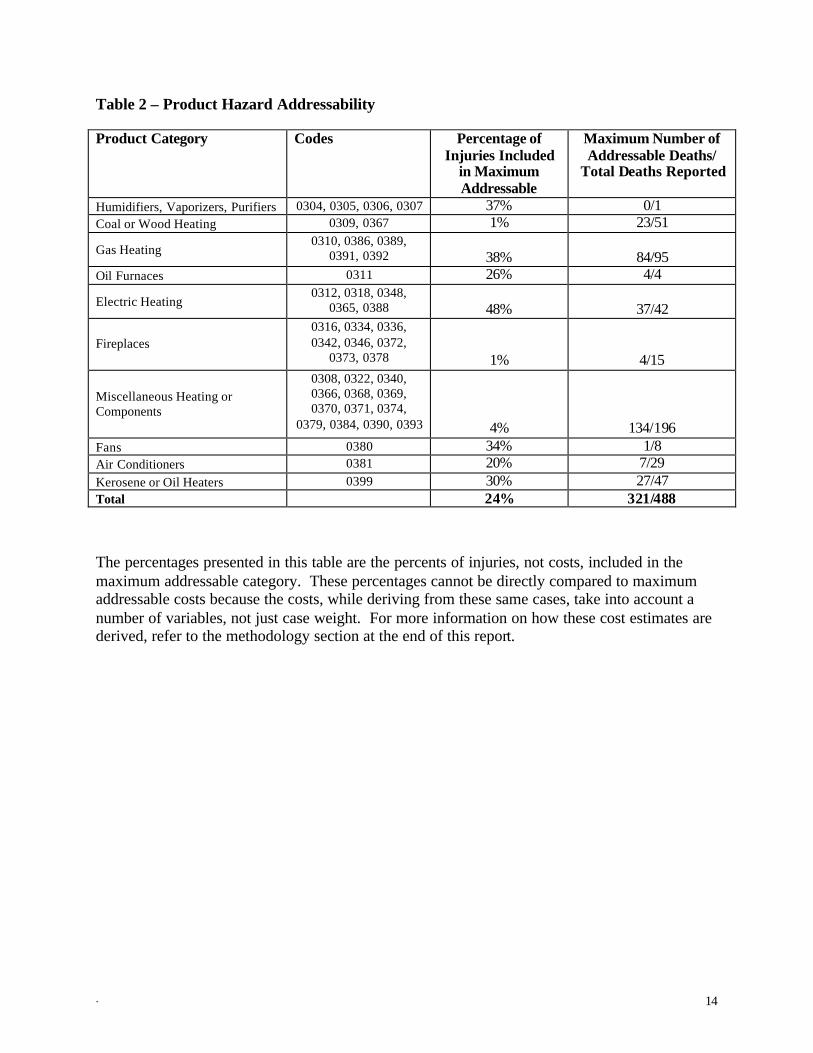
Table 2 – Product Hazard Addressability Product Category Codes Percentage of
Injuries Included in Maximum Addressable
Maximum Number of Addressable Deaths/
Total Deaths Reported
Humidifiers, Vaporizers, Purifiers 0304, 0305, 0306, 0307 37% 0/1 Coal or Wood Heating 0309, 0367 1% 23/51
Gas Heating 0310, 0386, 0389,
0391, 0392
38%
84/95 Oil Furnaces 0311 26% 4/4
Electric Heating 0312, 0318, 0348,
0365, 0388
48%
37/42
Fireplaces 0316, 0334, 0336, 0342, 0346, 0372,
0373, 0378
1%
4/15
Miscellaneous Heating or Components
0308, 0322, 0340, 0366, 0368, 0369, 0370, 0371, 0374,
0379, 0384, 0390, 0393
4%
134/196 Fans 0380 34% 1/8 Air Conditioners 0381 20% 7/29 Kerosene or Oil Heaters 0399 30% 27/47 Total 24% 321/488 The percentages presented in this table are the percents of injuries, not costs, included in the maximum addressable category. These percentages cannot be directly compared to maximum addressable costs because the costs, while deriving from these same cases, take into account a number of variables, not just case weight. For more information on how these cost estimates are derived, refer to the methodology section at the end of this report.
. 15
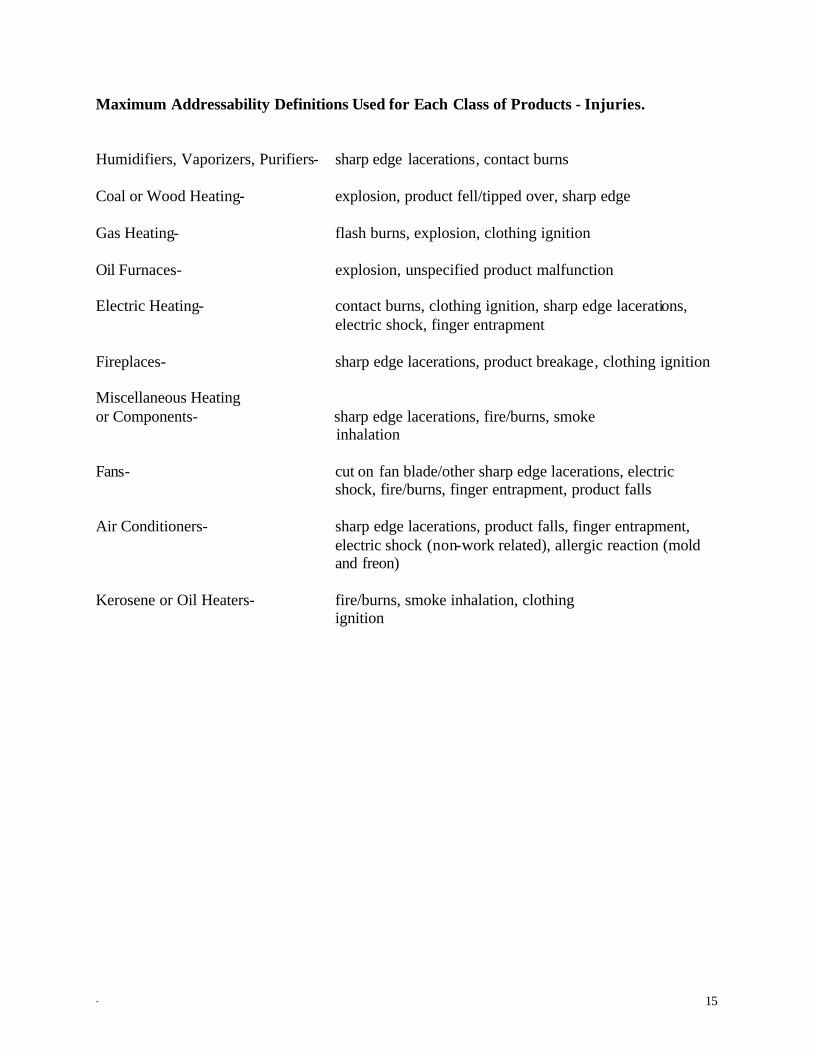
Maximum Addressability Definitions Used for Each Class of Products - Injuries. Humidifiers, Vaporizers, Purifiers- sharp edge lacerations, contact burns Coal or Wood Heating- explosion, product fell/tipped over, sharp edge Gas Heating- flash burns, explosion, clothing ignition Oil Furnaces- explosion, unspecified product malfunction Electric Heating- contact burns, clothing ignition, sharp edge lacerations, electric shock, finger entrapment Fireplaces- sharp edge lacerations, product breakage, clothing ignition Miscellaneous Heating or Components- sharp edge lacerations, fire/burns, smoke inhalation Fans- cut on fan blade/other sharp edge lacerations, electric shock, fire/burns, finger entrapment, product falls Air Conditioners- sharp edge lacerations, product falls, finger entrapment, electric shock (non-work related), allergic reaction (mold and freon) Kerosene or Oil Heaters- fire/burns, smoke inhalation, clothing ignition

. 16
Maximum Addressability Definitions Used for Each Class of Products - Deaths. Humidifiers, Vaporizers, Purifiers- none determined to be addressable Coal or Wood Heating- explosion, overheating, fire due to product
malfunction Gas Heating- CO exposure, explosion, fire/burns due to product malfunction, clothing ignition Oil Furnaces- CO exposure, fire (product malfunction) Electric Heating- fire (unknown/electrical malfunctions), overheating, electrocution Fireplaces- CO exposure, faulty flue fire, clothing ignition Miscellaneous Heating or Components- CO exposure (faulty furnaces/improper ventilation), explosion/fire,
burns Fans- fire (unspecified product failure) Air Conditioners- fire (unspecified product failure) Kerosene or Oil Heaters- CO exposure, fire (product failure)

. 17
Table 3 - Calculation of Indices9 Using Cost Estimates From Injury Cost Model, Death Certificates File, and Estimates of Number of Products in Use.
*Costs expressed in 2002 dollars. ** Sums may not add to totals because of rounding.
9 These “total injury and death costs” estimates and “total maximum addressable cost” estimates are indices, not actual estimates of cost and expected injury cost reduction. This is because injury cost estimates and addressability estimates are based on 2003 emergency room-treated injury reports, and death cost estimates are based on deaths reported which occurred in 2001. Estimates of number of products in use are also imprecise estimates. These cost figures were developed, using the data available, to provide indices for the purpose of comparison. They do not represent an actual estimate of the costs associated with any of the product groups for a specific year.
Title Medically Attended Injury
Costs (millions) * Death Costs (millions)
Total Injury and Death Costs
(millions)
Total Maximum Addressable Costs
(millions)
Rank on Total Costs
Rank on Maximum Addressable Costs
Products in Use (millions)
Maximum Addressable
Costs Per Unit
Rank on Maximum Addressable Costs
per unit
Humidifiers, Vaporizers, Purifiers
$96.1 $5.0 $101.1 $35.5 9 8
85.6
$.42 6
Coal or Wood Heating $368.5 $255.0 $623.5 $118.6 6 7 Not Available Not Available Not Applicable Gas Heating $291.3 $475.0 $766.3 $530.6 4 2 80 $6.63 1 Oil Furnaces $4.8 $20.0 $24.8 $21.2 10 10 9 $2.36 3
Electric Heating $207.5 $210.0 $417.5 $284.6 7 3 94 $3.03 2 Fireplaces $750.0 $75.0 $825.0 $30.5 2 9 Not Available Not Available Not Applicable
Miscellaneous Heating or Components $3,155.1 $980.0 $4,135.1 $802.2 1 1
Not Available
Not Available Not Applicable
Fans $636.5 $40.0 $676.5 $221.4 5 4 220 $1.01 5 Air Conditioners $677.4 $145.0 $822.4 $170.4 3 5 126 $1.35 4 Kerosene or Oil Heaters $115.4 $235.0 $350.4 $169.6 8 6 Not Available Not Available Not Applicable Total $6,302.6** $2,440.0 $8742.6** $2,384.6**
18
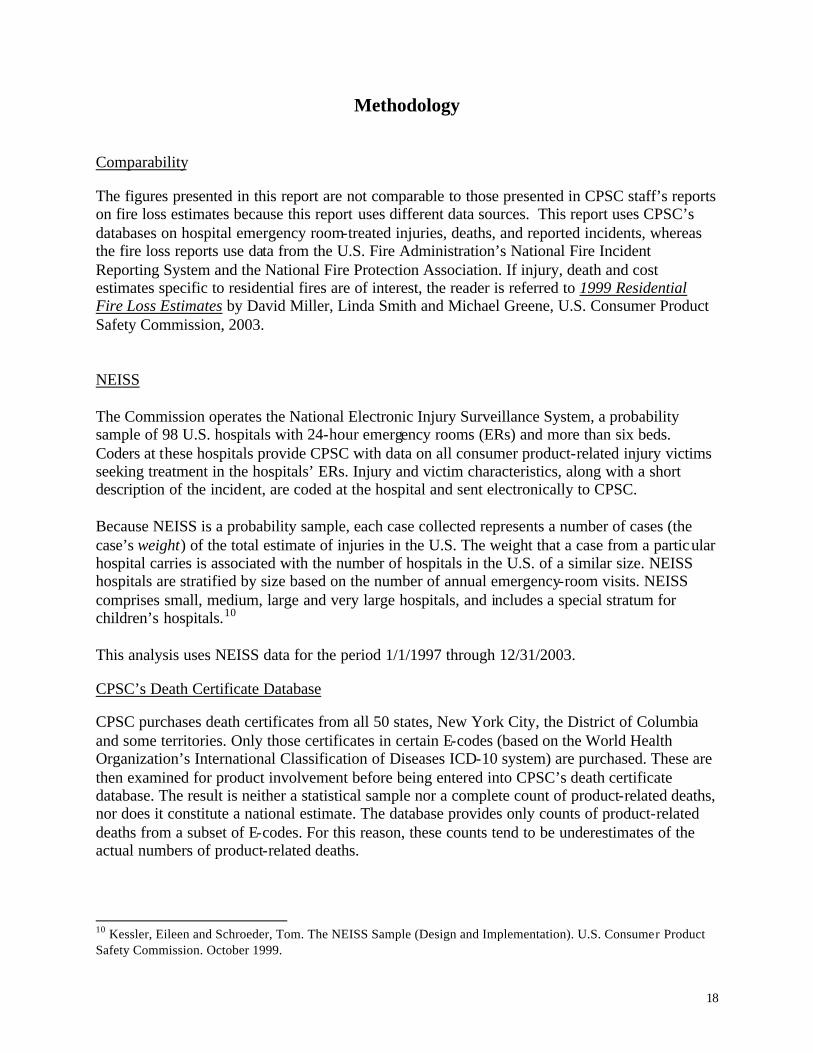
Methodology Comparability The figures presented in this report are not comparable to those presented in CPSC staff’s reports on fire loss estimates because this report uses different data sources. This report uses CPSC’s databases on hospital emergency room-treated injuries, deaths, and reported incidents, whereas the fire loss reports use data from the U.S. Fire Administration’s National Fire Incident Reporting System and the National Fire Protection Association. If injury, death and cost estimates specific to residential fires are of interest, the reader is referred to 1999 Residential Fire Loss Estimates by David Miller, Linda Smith and Michael Greene, U.S. Consumer Product Safety Commission, 2003. NEISS The Commission operates the National Electronic Injury Surveillance System, a probability sample of 98 U.S. hospitals with 24-hour emergency rooms (ERs) and more than six beds. Coders at these hospitals provide CPSC with data on all consumer product-related injury victims seeking treatment in the hospitals’ ERs. Injury and victim characteristics, along with a short description of the incident, are coded at the hospital and sent electronically to CPSC. Because NEISS is a probability sample, each case collected represents a number of cases (the case’s weight) of the total estimate of injuries in the U.S. The weight that a case from a particular hospital carries is associated with the number of hospitals in the U.S. of a similar size. NEISS hospitals are stratified by size based on the number of annual emergency-room visits. NEISS comprises small, medium, large and very large hospitals, and includes a special stratum for children’s hospitals.10 This analysis uses NEISS data for the period 1/1/1997 through 12/31/2003. CPSC’s Death Certificate Database CPSC purchases death certificates from all 50 states, New York City, the District of Columbia and some territories. Only those certificates in certain E-codes (based on the World Health Organization’s International Classification of Diseases ICD-10 system) are purchased. These are then examined for product involvement before being entered into CPSC’s death certificate database. The result is neither a statistical sample nor a complete count of product-related deaths, nor does it constitute a national estimate. The database provides only counts of product-related deaths from a subset of E-codes. For this reason, these counts tend to be underestimates of the actual numbers of product-related deaths.
10 Kessler, Eileen and Schroeder, Tom. The NEISS Sample (Design and Implementation). U.S. Consumer Product Safety Commission. October 1999.
. 19
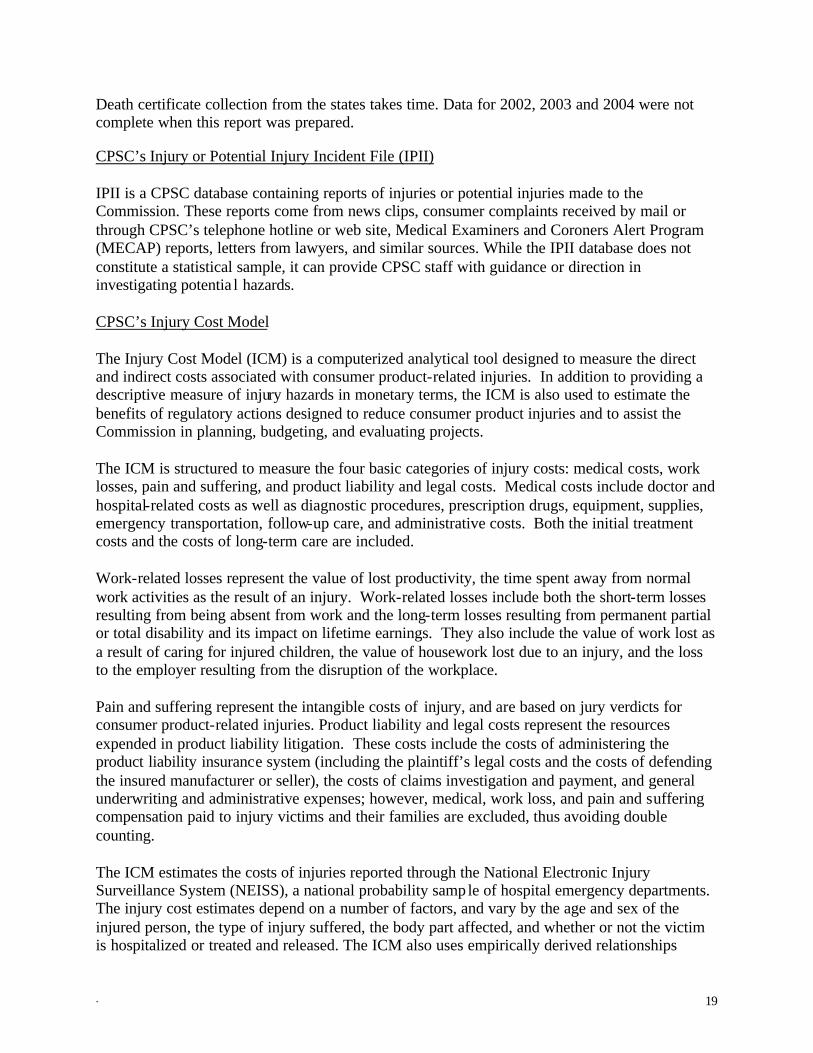
Death certificate collection from the states takes time. Data for 2002, 2003 and 2004 were not complete when this report was prepared. CPSC’s Injury or Potential Injury Incident File (IPII) IPII is a CPSC database containing reports of injuries or potential injuries made to the Commission. These reports come from news clips, consumer complaints received by mail or through CPSC’s telephone hotline or web site, Medical Examiners and Coroners Alert Program (MECAP) reports, letters from lawyers, and similar sources. While the IPII database does not constitute a statistical sample, it can provide CPSC staff with guidance or direction in investigating potentia l hazards. CPSC’s Injury Cost Model The Injury Cost Model (ICM) is a computerized analytical tool designed to measure the direct and indirect costs associated with consumer product-related injuries. In addition to providing a descriptive measure of injury hazards in monetary terms, the ICM is also used to estimate the benefits of regulatory actions designed to reduce consumer product injuries and to assist the Commission in planning, budgeting, and evaluating projects. The ICM is structured to measure the four basic categories of injury costs: medical costs, work losses, pain and suffering, and product liability and legal costs. Medical costs include doctor and hospital-related costs as well as diagnostic procedures, prescription drugs, equipment, supplies, emergency transportation, follow-up care, and administrative costs. Both the initial treatment costs and the costs of long-term care are included. Work-related losses represent the value of lost productivity, the time spent away from normal work activities as the result of an injury. Work-related losses include both the short-term losses resulting from being absent from work and the long-term losses resulting from permanent partial or total disability and its impact on lifetime earnings. They also include the value of work lost as a result of caring for injured children, the value of housework lost due to an injury, and the loss to the employer resulting from the disruption of the workplace.
Pain and suffering represent the intangible costs of injury, and are based on jury verdicts for consumer product-related injuries. Product liability and legal costs represent the resources expended in product liability litigation. These costs include the costs of administering the product liability insurance system (including the plaintiff’s legal costs and the costs of defending the insured manufacturer or seller), the costs of claims investigation and payment, and general underwriting and administrative expenses; however, medical, work loss, and pain and suffering compensation paid to injury victims and their families are excluded, thus avoiding double counting.
The ICM estimates the costs of injuries reported through the National Electronic Injury Surveillance System (NEISS), a national probability sample of hospital emergency departments. The injury cost estimates depend on a number of factors, and vary by the age and sex of the injured person, the type of injury suffered, the body part affected, and whether or not the victim is hospitalized or treated and released. The ICM also uses empirically derived relationships

. 20
between emergency department injuries and those treated in other settings (e.g. doctor’s offices, clinics) to estimate the number of injuries treated outside hospital emergency departments and the costs of those injuries. A number of databases are used to calculate the four cost categories. National discharge data and discharge data from six states are used to estimate the costs of hospitalized injuries. Data from Department of Defense medical records from almost two million retirees and civilian dependents of military personnel and several National Center for Health Statistics surveys dealing with costs of treatment in different medical settings are used to calculate medical costs. These consist of injuries where the victim is treated and released from the emergency department or treated in a clinic or doctor’s office. Other major data sources include the Annual Survey of Occupational Illnesses and Injuries and the Detailed Claims Info rmation (DCI) database for work loss estimates; and the Jury Verdicts Research data for pain and suffering estimates. Product liability and legal costs are derived analytically from insurance industry information and several studies of product liability. To determine the maximum addressable cost estimate, the injury narratives were read to determine which would not be addressable. Maximum addressable costs were then generated by the Injury Cost Model using the remaining injuries. It should be noted that actual costs to society are likely to involve more factors than are accounted for in this analysis. For example, this analysis does not account for costs associated with property damage. Variables Associated with Products in Use Estimates
Inputs used for the estimates of the numbers of products in use included: annual sales, retail price range, expected useful life, and expected number in use.
Annual sales: The annual sales data are from trade sources, from published information and association estimates. Economic Analysis staff used the average of unit sales as reported by appropriate industry sources.
Retail price range: The retail price range was reported by industry trade groups for some categories. For others Economic Analysis staff used information from retail stores and information developed from Internet searches.
Expected useful life: The useful life was reported by industry sources for some products. Available studies are also used, if no industry sources are found. In some cases, Human Factors staff was consulted to determine appropriate age groups, and thus, the length of time a product may remain in use. Expected number in use: There is often not sufficient data available to conduct a product population estimate for a class of products. As a surrogate in these cases, Economic Analysis staff used average sales multiplied by the useful life estimate. This will understate the number of products in use for products that have seen substantial growth in sales, and overstate the number in use for products that have seen substantial decreases in sales in recent years.
. 21
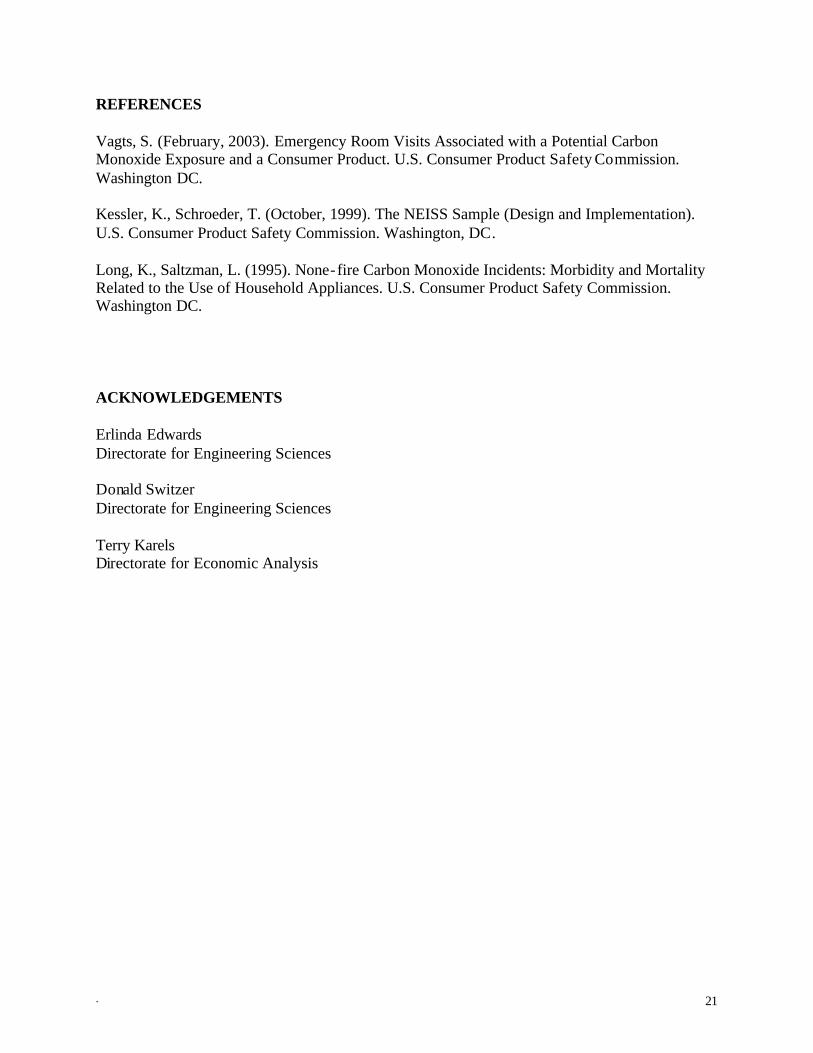
REFERENCES Vagts, S. (February, 2003). Emergency Room Visits Associated with a Potential Carbon Monoxide Exposure and a Consumer Product. U.S. Consumer Product Safety Commission. Washington DC. Kessler, K., Schroeder, T. (October, 1999). The NEISS Sample (Design and Implementation). U.S. Consumer Product Safety Commission. Washington, DC. Long, K., Saltzman, L. (1995). None-fire Carbon Monoxide Incidents: Morbidity and Mortality Related to the Use of Household Appliances. U.S. Consumer Product Safety Commission. Washington DC.
ACKNOWLEDGEMENTS Erlinda Edwards Directorate for Engineering Sciences Donald Switzer Directorate for Engineering Sciences Terry Karels Directorate for Economic Analysis