help or hindrance? environmental regulations and
TRANSCRIPT
ALDERSGATE GROUP
H E L P O R H I N D R A N C E ?E N V I R O N M E N T A L R E G U L A T I O N S A N D
C O M P E T I T I V E N E S S
D E C E M B E R 2 0 1 7

2
P R O J E C T T I T L E

3
B U R O H A P P O L D E N G I N E E R I N G
Copyright © 1976-2017 BuroHappold Engineering. All Rights Reserved
CONTENTS
Acknowledgements 4
Research Team 4
Acronyms 5
Foreword from the Aldersgate Group 6
Executive summary 7
Why This Study? 7
Conclusions 7
Introduction 9
Background 9
Study Approach 10
Sector Findings 12
Construction 12
Waste 19
Automotive 25
Cross Sector Findings 33
Jobs, Skills and Innovation 33
Characteristics of Good Regulation 34

4
A L D E R S G AT E G R O U P : E N V I R O N M E N TA L R E G U L AT I O N S A N D C O M P E T I T I V E N E S S
BuroHappold are grateful to all those who participated in the study, giving their time for interviews and providing information, in particular:
Adam Mactavish, Currie & Brown Jane Wakiwaka, The Crown Estate
Adrian Bond, Zero Waste Scotland Jonathan Murray, LowCVP
Brian Rutter, Ford Louise Clarke, Berkeley Group
Craig Robertson, AHMM Ólöf Jónsdóttir, ROCKWOOL Ltd
Dan Cooke, Viridor Richard Twinn, UKGBC
Döerte Schramm, Bosch Rowland Hill, Marks & Spencer
Ellen Bulander, Bosch Sarah Cary, British Land
Dr Gev Eduljee, SUEZ Toby Heysham, Pinnacle Power
Isabel McAllister, Mace
ACKNOWLEDGEMENTS
RESEARCH TEAM
Adarsh Varma
Duncan Price
Helen Hoang-Nguyen
Henrietta Cooke
James Hobson
Lukas Schaefer
Oscar Thurley
Trevor Keeling
5
B U R O H A P P O L D E N G I N E E R I N G
Copyright © 1976-2017 BuroHappold Engineering. All Rights Reserved
Acronym Meaning
AFV Alternative Fuel Vehicle
CCL Climate Change Levy
CHP Combined Heat and Power
CIL Community Infrastructure Levy
Defra Department for Environment, Food & Rural Affairs
ESCo Energy Services Company
ESOS Energy Savings Opportunity Scheme
EV Electric Vehicle
FDI Foreign Direct Investment
FiT Feed in Tariff
FTE Full Time Equivalent
GDP Gross Domestic Product
GLA Greater London Authority
ICCT International Council of Clean Transportation
ICE Internal Combustion Engine
LCV Light Commercial Vehicle
LFT Landfill Tax
MRF Materials Recovery Facility
OEM Original Equipment Manufacturer
R&D Research & Development
RHI Renewable Heat Incentive
SME Small and Medium Enterprises
SMMT The Society of Motor Manufacturers and Traders
SPG Special Planning Guidance
TEEP Technically, Environmentally and Economically Practicable
WGBC World Green Building Council
ACRONYMS
6
A L D E R S G AT E G R O U P : E N V I R O N M E N TA L R E G U L AT I O N S A N D C O M P E T I T I V E N E S S
FOREWORD FROM THE ALDERSGATE GROUP
With the publication of the Clean Growth Strategy and the Industrial Strategy White Paper in 2017, the UK government has shown a growing cross-departmental focus on supporting the development of a more resource efficient and low carbon economy. The government’s vision behind the Industrial Strategy is one where the UK economy becomes more productive and where UK businesses develop leadership positions in new markets and increase investment in skills and innovation.
The transition to a low carbon economy is central to delivering this vision. However, the role of environmental regulations and standards in delivering positive environmental and economic outcomes is rarely considered, being instead generally discussed in the context of “cutting red tape”.
As an organisation that focuses on addressing environmental challenges in a way that is environmentally and economically effective, the Aldersgate Group felt it was important to take a broader perspective on environmental regulations. At a time when the government is seeking to deliver major environmental goals under the Clean Growth Strategy and 25 Year Environment Plan and put together a new industrial strategy for the UK economy, we wanted to better understand how environmental regulations could best deliver the government’s environmental and industrial policy objectives.
We therefore asked BuroHappold to look into the impact that environmental regulations have had on business competitiveness, innovation and investment in skills and consider what lessons could be learnt to support the UK’s new Industrial Strategy. This report, which is based on business interviews on policies in the construction, waste and car industries, shows that well designed environmental regulations can have positive knock-on impacts on the economy in the form of job creation, increased investment in research, development and skills. Good regulations can reveal the value in social and environmental factors that the existing market had overlooked, allowing economic players to identify opportunities for investment and innovation. Good regulation creates valuable economic opportunity.
Unsurprisingly, there is such a thing as good and bad regulation. To be environmentally and economically effective, regulations must be pitched at the right geographic scale, be coherent with other existing policies, set a clear direction that increases in stringency over time and be implemented in such a way that works with business timescales. Critically, environmental regulations cannot be effective in a vacuum. They need to be accompanied by other policies such as measures on skills and innovation to deliver broader industrial benefits.
This report considers the experience of businesses involved with the implementation of specific policies in three sectors of the economy and as such cannot capture the experience of all economic sectors. However, it does provide some valuable lessons for the economy as a whole and shows that well-designed environmental regulations and standards have a role in delivering the government’s industrial and environmental policy objectives.
Nick Molho, Executive Director, Aldersgate Group
LEADERS FOR A SUSTAINABLE ECONOMY
7
B U R O H A P P O L D E N G I N E E R I N G
Copyright © 1976-2017 BuroHappold Engineering. All Rights Reserved
1.2 CONCLUSIONSAll those interviewed for this research stated that the impact of environmental regulation on the competitiveness of their business was positive overall. Although not a quantitative survey, this response from senior executives of key industry players is significant and is supported by a growing amount of academic and market research. The costs of compliance – be they taxes or increased design fees – are more than offset by gains in improved quality, performance and competitiveness or are absorbed in some other way within their business models.
However this work suggests that other support mechanisms are required to deliver wider benefits such as skills enhancement and innovation. Put another way, environmental legislation is necessary but not sufficient to capture the full potential economic benefits.
• Jobs: There is evidence from all three sectors that environmental regulation has led to the creation of new jobs. This can be attributed in part to additional expenditure on production and R&D and in part to the diversification of the supply chain. In the waste sector, environmental regulation has led to job creation through the development of entire new business models and markets related to material recovery and recycling.
• Skills: The links between environmental regulation and investment in skills are harder to quantify and the picture differs for the different sectors. Emissions standards have been a strong driver for innovation in the automotive sector, which has led to a highly skilled and transferable workforce for OEMs and suppliers. However, the picture for the construction and waste sectors is less clear; it is recognised that there is a skills gap in relation to meeting the needs of environmental regulation, but the extent to which this gap is being filled is patchy.
1 EXECUTIVE SUMMARY
1.1 WHY THIS STUDY?This study was commissioned by the Aldersgate Group to explore the connection between ambitious environmental standards on the one hand, and business competitiveness, skills, and innovation on the other. The research was initiated in response to the Government’s consultation on its Green Paper on Industrial Strategy.
The Group noted that, although the Strategy acknowledges the need for increased institutional support for certain sectors in pursuing growth, it does not infer any particular role for regulations and standards. Indeed, the main reference to regulation is in the context of the ‘Red Tape Challenge’, and the need to ‘further reduce bureaucratic and regulatory barriers to growth, innovation and productivity’.
Our questions in undertaking this research were: can environmental regulations be good for business and for the UK economy as a whole? And, what makes good regulation?
Most detailed studies into the economic impact of environmental regulation are undertaken for a particular sector. To get a flavour of the impacts of environmental regulation across the economy, this study looks at three different sectors, to see whether there are any general conclusions that can be reached (Table 1.1). In order to capture as wide a view as possible, the policies selected were of different types, including both market and non-market instruments, and at different scales, regional, national and international (EU). The study is based on desk research and interviews with key industry players.
Table 1.1 Sectors and regulations selected as the focus of this study
Sector Regulation type Specific regulation Features
Construction (Buildings)
Planning London Plan • Regional
• Non-market instrument; broad ranging with some voluntary aspects
Automotive Emission performance standards
EU Regulation on passenger cars & light vehicles
• EU regulation
• Non-market instrument; command & control; ‘end of pipe’
Waste Tax Landfill Tax • National
• Market based instrument, directly applied to the pollution source

8
A L D E R S G AT E G R O U P : E N V I R O N M E N TA L R E G U L AT I O N S A N D C O M P E T I T I V E N E S S
Thirdly in the automotive sector, the most global of the three sectors selected, a huge amount of research has been undertaken to show that innovation, jobs and higher skills have developed on the back of the environmental regulation. The environmental regulation has benefited UK plc but this has been to a lesser extent than in Germany and Eastern Europe due in part to the consolidation of the largest Tier 1 suppliers in those countries over recent decades. The move to electric vehicles is likely to reduce automotive engineering jobs globally due to less complex production processes. Maintaining the UK’s competitiveness will require a further wave of regulatory incentives and public-private partnerships to go beyond existing business models.
Where there have been limitations in the methodologies used for delivering compliance, environmental regulation has fallen down and received bad press in the sectors studied. In the building sector, CO2 reductions rely on normalised Part L compliance (design stage) calculations and in the automotive sector, there have been well publicised issues around whether the tests used to demonstrate compliance adequately reflect the ‘real world’. These are reflective of the need to draw upon the learnings shown by this research, when designing new regulation.
• Innovation: Again, there are clear examples of environmental regulation having had a positive impact. Interestingly, the literature suggests – and it makes sense to assume – that impacts occur over the long term. Where regulation is consistent and increases in stringency over time it becomes worthwhile for firms to invest in new processes, products and skills that will increase their productivity and reduce compliance costs. Although costs may be higher in the short term, in the long term these are offset by gains elsewhere. In addition, for those sectors operating in a global market such as the automotive sector, being ahead of the game – where the game is changing globally in the same direction – is a clear advantage.
A common message from all three sectors was that regulatory effectiveness increases when it is:
• pitched at the right scale (e.g. automotive at EU level)
• provides a clear direction, and a transparent and consistent framework (e.g. progressive increase in Landfill Tax rate)
• coherent (e.g. alignment of policy with assessment methodologies)
• implemented within adequate timescales to allow business to develop and implement appropriate strategies (e.g. providing broader options and longer time frames to comply cost effectively)
The regulations chosen for this study have differing characteristics and can be seen to be ‘successful’ in different respects. Firstly, the London Plan is ambitious and sets out a reasonably consistent pathway to greater sustainability. However, it is complex, local and puts requirements on the supply chain that are sometimes not fulfilled because of the fragmented nature of the industry.
Secondly, the Landfill Tax is the longest running of the regulations; it is simple and has been increasing steadily over time, showing a clear direction of travel. It has spawned whole new industries, extensive innovation and a wealth of new skills. However, in some ways it is the victim of its own success with unintended consequences around tax avoidance reducing its impact and causing problems elsewhere.

9
B U R O H A P P O L D E N G I N E E R I N G
Copyright © 1976-2017 BuroHappold Engineering. All Rights Reserved
2.1 BACKGROUND This study was commissioned by the Aldersgate Groupi to explore the connection between ambitious environmental standards on the one hand, and business competitiveness, skills and innovation on the other. This investigation was initiated in response to the Government’s consultation regarding the Green Paper on Industrial Strategy1.
The Group noted that, although the Strategy acknowledges the need for increased institutional support for certain sectors in pursuing growth, it does not infer any particular role for regulations and standards. Indeed, the main reference to regulation is in the context of the ‘Red Tape Challenge’, and the need to ‘further reduce bureaucratic and regulatory barriers to growth, innovation and productivity’.
Yet there is a growing body of evidence demonstrating that at the very least, environmental regulations do not hinder productivity, and at best they increase it (see Box 1). A policy briefing published by the OECD in 2014 states that the message is clear: more stringent environmental policies, when properly designed, can be introduced to benefit the environment without any loss in productivity2. This conclusion is based on extensive international research into the relationship between environmental policy and growth3.
The same can be said of innovation, with recent studies by Nesta4 suggesting that environmental regulations generally have a positive impact. Regulation can result in the development of entirely new markets as well as stimulate innovation in existing markets. The stronger the regulation, the more radical the innovation that is encouraged – with positive impacts particularly witnessed over the longer term.
Our questions in undertaking this research were: can environmental regulations be good for business and for the UK economy as a whole? And, what makes good regulation?
2 INTRODUC TION
BOX 1: THE THEORY
Conventional economic theory suggests that environmental regulation is bad for business. It is seen as adding cost without adding value and thereby reducing competitiveness. This view was challenged in the early 1990s by Harvard Business School professor Michael Porter, who declared that well-designed regulation could actually enhance competitiveness5. According to Porter, “Strict environmental regulations do not inevitably hinder competitive advantage against rivals; indeed, they often enhance it.”
The ‘weak’ view of the Porter Hypothesis is that stricter environmental regulation stimulates innovation, while the ‘strong’ view is that stricter regulation actually enhances competitiveness and performance. A number of studies have sought to find empirical evidence to support the hypothesis6. It appears that evidence in support of the ‘weak’ version is fairly well established while that in support of the ‘strong’ version is mixed, however more recent studies over longer periods provide more supportive results.
i http://www.aldersgategroup.org.uk/
1 HM Government (2017). ‘Building Our Industrial Strategy Green Paper’
2 OECD (2014). ‘Green growth: Environmental Policies And Productivity Can Work Together’ OECD Policy Brief
3 Albrizio, S., Botta, E., Koźluk, T., & Zipperer, V. (2014). ‘Do environmental policies matter for productivity growth? Insights from new cross-country measures of environmental policies' (Report No. 1176). Paris, France: OECD Publishing.
4 Knut Blind (2012). The Impact of Regulation on Innovation. Nesta Working Paper No. 12/02
5 Porter, M. (1991). America’s Green Strategy, Scientific American 264(4), 168.
6 See for example: Stefan Ambec, Mark A. Cohen, Stewart Elgie, and Paul Lanoie, (2011). The Porter Hypothesis at 20: Can Environmental Regulation Enhance Innovation and Competitiveness? Resources for the Future.

10
A L D E R S G AT E G R O U P : E N V I R O N M E N TA L R E G U L AT I O N S A N D C O M P E T I T I V E N E S S
Most detailed studies into the economic impact of environmental regulation are undertaken for a particular sector. To get a flavour of the impacts of environmental regulation across the economy, this study looks at three different sectors to see whether there are any general conclusions that can be reached.
We took a bottom-up approach, examining the question in relation to three specific regulations as listed in Table 2.1. In order to capture as wide a view as possible, the policies selected were of different types, including both market and non-market instruments, and at different scales, regional, national and international (EU). Although it is difficult to establish direct cause and effect of single regulations within complex markets, starting with one provides a framework for describing the way organisations, markets, regulations and other related entities interact and influence each other. This in turn allows us to describe the detail and complexity that is necessary to understand how regulation works in real world settings.
2.2 STUDY APPROACHUndertaking economic activity is likely to have impacts on the environment, both positive and negative. The objective of environmental regulation is to reduce the negative and enhance the positive to the overall benefit of society. It does this by incentivising a change in business behaviour. This change will have other direct and indirect impacts. The nature and scale of these impacts will depend to a large degree on the design and scope of the regulation itself, the structure of the sector within which it operates, and the type and attitude of the firm. For example, at one end of the scale, a business might simply adapt a product to achieve compliance at minimum cost, while at the other end, a business might make major investments in R&D, training and skills to take a lead position within the market. The attitude of the public is also an important factor influencing a firm’s response to regulation. Ultimately, the perception of end consumers of the products or processes being regulated are increasingly influenced by awareness of environmental issues and what the regulation is seeking to achieve.
Figure 2.1 provides an overview of how the positive impacts of regulation – innovation, introduction of new products and processes, new jobs, increased productivity – could outweigh the costs of compliance. Note that whilst this image portrays a static configuration, in reality these effects will emerge over time in line with the context of the specific regulation in question, its evolution, and other external factors impacting the sector from the wider economy.
Figure 2.1: Overview of potential impact of environmental regulation

11
B U R O H A P P O L D E N G I N E E R I N G
Copyright © 1976-2017 BuroHappold Engineering. All Rights Reserved
Sector Regulation type Specific regulation Features
Construction (Buildings)
Planning London Plan • Regional
• Non-market instrument; broad ranging with some voluntary aspects
Automotive Emission performance standards
EU Regulation on passenger cars & light vehicles
• EU regulation
• Non-market instrument; command & control; ‘end of pipe’
Waste Tax Landfill Tax • National
• Market based instrument, directly applied to the pollution source
Table 2.1 Sectors and regulations selected as the focus of this study
The following sections summarise the findings for each sector pulling out key messages and exploring strengths and weaknesses. The final section seeks to draw those findings together to understand where benefits might lie, how they could be built upon and what implications this might have for a UK wide industrial strategy.
The analysis is high level and is based on desk research and interviews with a selection of industry personnel. Reference is made both to entities that are the direct target of the regulation and to the wider supply chain.

12
A L D E R S G AT E G R O U P : E N V I R O N M E N TA L R E G U L AT I O N S A N D C O M P E T I T I V E N E S S
The current London Plan has a number of requirements for improving the sustainability of developments referred to the Greater London Authority (GLA) for planning permission. It is supported by a number of Supplementary Planning Guidance (SPG) notes (e.g. the Sustainable Design and Construction SPG) which provide detailed guidance on specific areas of London Plan policy. In relation to carbon dioxide emissions, the four main policies of the London Plan are:
• Headline target to achieve at least 35% carbon reductions on site, with an offset charge being payable for the remainder to achieve a 100% carbon reduction. This is calculated using the Building Regulations Part L 2013 methodology.
3.1 CONSTRUC TION The Regulation – The London Plan
The construction sector is a major part of the UK economy, contributing 6.5% to 7.0% to annual GDP in the 10 years to 20147 and providing a similar share of UK jobs. It is a complex sector, with many different inputs, activities and outputs. Buildings and their supporting infrastructure are a major contributor to greenhouse gas emissions and as such have been a focus of government climate change policy for a number of years.
We focused on climate change policies within the London Plan and their impact upon residential and commercial property developers and their supply chains. An overview of how these policies fit within the regulatory ecosystem for the sector is shown in Figure 3.1.
3 SEC TOR FINDINGS
Figure 3.1: The regulatory ecosystem that shapes the application of the London Plan Climate Change Policies
7 House of Commons (2015). ‘Construction industry: statistics and policy’. BRIEFING PAPER Number 01432, House of Commons Library
13
B U R O H A P P O L D E N G I N E E R I N G
Copyright © 1976-2017 BuroHappold Engineering. All Rights Reserved
• Application of the energy hierarchy so that passive energy savings are prioritised before system efficiencies, which are in turn prioritised before the production of renewable energy (lean, clean, green approach).
• Connection to district heating systems.
• Elimination or otherwise reduction of comfort cooling through application of the cooling hierarchy.
London Plan version
Overall carbon reduction traget
Energy hierarchy District heating Overheating and cooling
2004 Not included Demonstrate application
Assess as one possible low carbon technology
Not included
2008 20% reduction from renewable sources
2011 25% reduction over Part L 2010 rising to 40% (2013) and finally zero carbon. Offset fund included
Prioritise connection to district heating
Demonstrate resilience to overheating
2016 SPG recommends that 40% over Part L 2010 is equivalent to 35% over Part L 2013
Minimise cooling through the application of cooling hierarchy
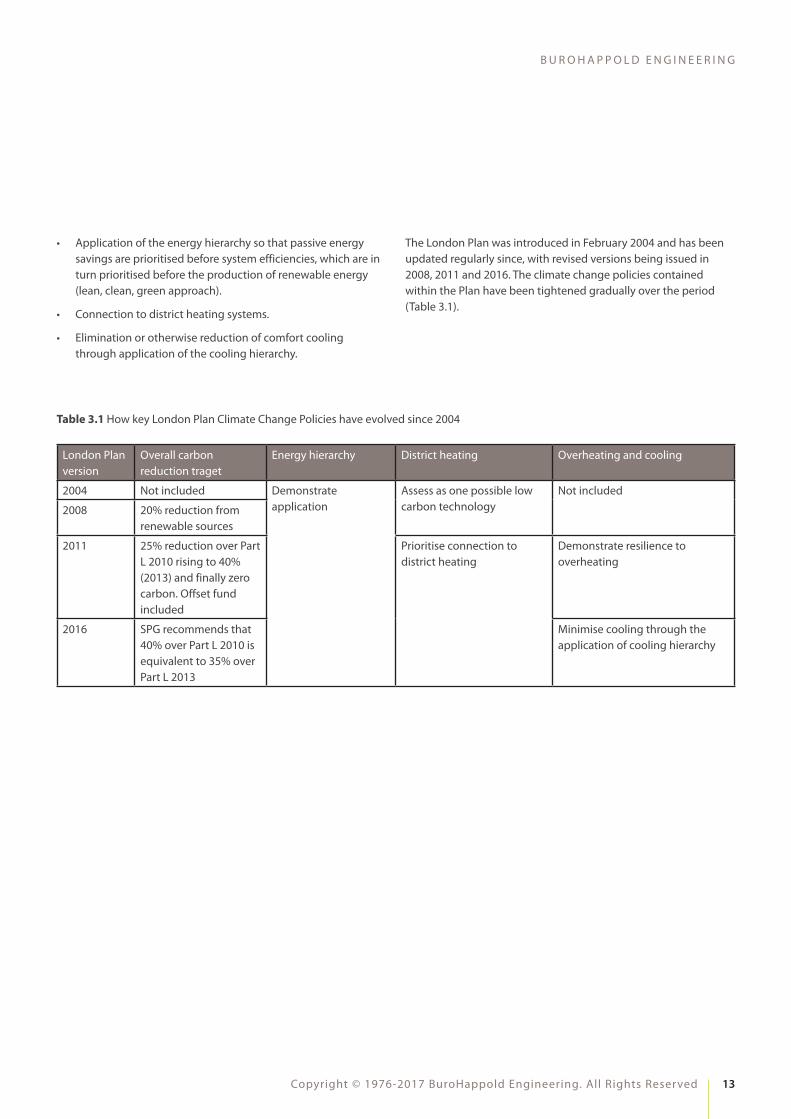
Table 3.1 How key London Plan Climate Change Policies have evolved since 2004
The London Plan was introduced in February 2004 and has been updated regularly since, with revised versions being issued in 2008, 2011 and 2016. The climate change policies contained within the Plan have been tightened gradually over the period (Table 3.1).
14
A L D E R S G AT E G R O U P : E N V I R O N M E N TA L R E G U L AT I O N S A N D C O M P E T I T I V E N E S S
THE FINDINGS
Direct costs: There are direct costs associated with improvements in design necessary to meet regulation. For green buildings in general the World Green Building Council (WGBC) reports these to be between 0% and 12.5% of construction costs and that they are being reduced as R&D progresses8. Costs include additional professional fees and capital expenditure. Individuals interviewed for this study reported that these can be minimised through good design and planning. It was also noted that such costs are absorbed by developers and/or passed on by adjusting land value, reducing S106 obligations, reducing affordable housing proportion, reducing facilities, or building higher (i.e. increasing square footage and/or number of units).
Direct benefits: Interviewees reported that regulation drives R&D in product development and design consultancy. It also sets the tone and culture within the industry, with many companies keen to outperform regulation.
However, there is a performance gap between what the design world is proposing, what some contractors have the skills to deliver, and how buildings perform in practice. The Government recognises the need for new skills to meet the demands of ‘green’ construction9, and a 2014 study for the Green Construction Board acknowledges the skills gap, implicitly recognising the link between environmental regulation and skills10. Interviews held for this study suggest that the gap is being closed in only some parts of the supply chain. Consultants are up-skilling to meet the needs of developers, but there remains a skills gap amongst contractors, likely to be linked to the relatively transient nature of the workforce which makes long-term skill development more difficult.
Lack of innovation in one part of the supply chain can hold up innovation in another part. For example, low temperature heat networks have the potential to deliver greater carbon savings, from a diverse range of heat sources, at lower costs than more traditional higher temperature networks. However, they require that house builders install heating systems differently to accommodate the low temperatures. Until houses are designed and constructed effectively, companies that build and manage heat networks are unable to effectively deliver and operate low temperature networks. Thus the regulation is raising the bar in relation to skills, however it is not in itself sufficient to deliver the desired result.
PRIMARY RESEARCH SOURCES
Interviewees:
• Developers: Berkeley Group, The Crown Estate, British Land
• Contractor: Mace
• Supply chain: Currie & Brown, AHMM, ROCKWOOL Ltd, Pinnacle Power
• Industry overview: UKGBC
Key references:
• The Green Construction Board (2014): Project GCB620 - Evaluating the Effectiveness of Energy Efficiency Policies in the Domestic Real Estate Sector
• World Green Building Council (2013): The Business Case for Green Buildings: A Review of the Costs and Benefits for Developers, Investors and Occupants
• GLA (2015): Energy Planning Monitoring the implementation of the London Plan Energy Policies in 2015
• Cambridge Econometrics (2012): Jobs, Growth and Warmer Homes
8 WGBC (2013). 'The Business case for Green Buildings: A Review of the Costs and Benefits for Developer, Investors and Occupants'
9 UKCES (2012). ‘Sector Skills Insights: Construction’. Evidence Report
10 GCB (2014). ‘Green Construction Board Establishing the knowledge and skills challenge for UK green construction’. GCB410 Summary report, Sweett Group
INDUSTRY INSIGHT #1
“Approaching building design with energy efficiency in mind is the most cost-efficient way to reduce carbon emissions from buildings (e.g. appropriate south facing glazing). Getting to full zero carbon will take radical change in how buildings are expected to function (e.g. acceptance of reduced or zero cooling in offices). “
Sarah Cary, Head of Sustainable Places, British Land

15
B U R O H A P P O L D E N G I N E E R I N G
Copyright © 1976-2017 BuroHappold Engineering. All Rights Reserved
Previous studies have estimated the Full Time Equivalent Jobs (FTE) per £ turnover for housing energy efficiency projects11. Whilst these studies relate more to retrofit than new build they provide an indication of the potential orders of magnitude, suggesting around 4,000 jobs associated with the investment to deliver the low carbon infrastructure for 2015 planning applications. Furthermore, the GLA estimates approximately 60 permanent jobs in energy services companies (ESCOs) due to 2015 planning applications13.
In terms of job creation, there is some evidence that the increased capital expenditure on energy efficiency, heat networks and renewable energy will lead to ‘green collar’ jobs. These are in design and consultancy, manufacturing and construction associated with the delivery of works as well as long-term jobs related to the operation of infrastructure and provision of energy services.
Impact Direct target entity (property developer) Supply chain entity
Direct costs £2-10k per unit increase of capex12
£20-80/m2 uplift for non-residential12
Offset payments
£1,500 per week to employ a Sustainability Manager (reported at interview)
Cost of jobs and equipment required to track and demonstrate compliance; i.e. a public affairs team to manage compliance
Indirect costs Specialist design and consultancy fees (e.g. engineering design, planning statements, etc.)
Direct benefits Increased marketability
Reduced voids
Lower energy bills
New jobs monitoring & responding to the development of legislation
£139 million investment in heat network infrastructure due to 2015 planning applications13
£15 million investment in Solar PV and other renewables due to 2015 planning applications13
Approximately 60 permanent jobs in ESCOs due to 2015 planning applications13
Estimated 4,000 FTE jobs overall, mainly for manufacturing and construction11
New technical disciplines, new expertise, additional scope / revenue for designers and consultants
Increased management & oversight jobs and new technical expertise for contractors
Product development roles and environmental management roles for product suppliers
Increased R&D investment in product supply chain
Increased demand for products
Indirect benefits Developed environmental sign off procedure
Preference for investment in UK property because of the robust legislation
Supply chain is more innovative in building design and provides a better quality of product
Knowledge and reputational enhancement that provides a differentiation for international consultancy
11 Cambridge Econometrics (2012). ‘Jobs, Growth and Warmer Homes’.
12 BuroHappold (2017). 'Driving energy efficiency through the London Plan'.
13 GLA (2016). 'Energy planning: monitoring the implementation of London Plan Policies in 2015'.
Table 3.2 Economic impacts of the London Plan climate change policies

16
A L D E R S G AT E G R O U P : E N V I R O N M E N TA L R E G U L AT I O N S A N D C O M P E T I T I V E N E S S
Interviewees reported that there are cases where CHP is installed and never turned on because it was specified inappropriately. However, without this policy developers are often minded to act independently and to maximise their own gains. District heating only works by having a critical mass of players that interact collectively, which the policy encourages. It was reported that the policy has made London a leader in the UK for district heating.
London is also seen as a leader in energy efficiency design. The architect we spoke to reported that London standards are applied elsewhere in the UK, even when regulation does not require it. Developers reported that the environmental performance requirements of the London Plan increase investor confidence. It is normal for investors in global real estate to issue questions about environmental performance, these questions will be in a standard form used throughout the world; UK and London buildings out-perform on these measures. The WGBC reports that investors see green buildings as more resilient to fuel price changes, global warming shocks, and legislation changes, this was also reflected in the interviews conducted for this study.
Policy design: The processes that support the delivery of regulation could be improved, possibly through better target setting and compliance monitoring. This situation is exacerbated because the tools (i.e. the energy modelling software) use metrics that poorly predict operational performance, so are difficult for occupiers to use. Together these factors mean there is a danger of designing for regulation rather than actual performance.
Because compliance with the London Plan is primarily assessed at design stage there is a reduced incentive for ensuring actual performance is improved in terms of outcomes that matter to end users.
Furthermore, because the GLA has few powers in later stages of planning & construction it can be challenging to monitor the progression of buildings effectively.
However, the Better Buildings Partnership has identified potential solutions to this through setting performance-based outcomes targets which would be enforced through Commitment Agreement Protocols. These would commit a developer and their main contractor to achieving a specific base building energy performance rating verified by measurement. Approaches such as these should be considered in future.
Another current challenge is that the Part L methodology does not account for future changes to carbon factors; this is something that will have a major implication for design strategies when the methodology is updated and will result in the 35% carbon reduction target conflicting in some cases with the preference for district heating, unless lower carbon fuel sources are introduced. Interviewees reported that if unresolved, this inconsistency in policy recommendation between carbon savings and district heating, could result in stranded assets because consented and constructed heat networks were built in anticipation of policy driving future housing to connect to (and purchase heat from) those heat networks. When coupled with changing national carbon targets and the changing ecosystem of regulation, this has undermined organisations’ ability to plan for and invest in the future. This divergence between national and local regulations reflects a desire by GLA to strive to act in areas where they have powers and raises an interesting discussion about the effectiveness of regional power and the shape of regulation as global cities start to take more initiative.
INDUSTRY INSIGHT #2
“The regulatory framework sets the general direction of travel, the culture and the tone of the industry. Companies should see this regulation as a baseline that they endeavour to out-perform to reduce their environmental impacts, drive the market and enhance their reputation.”
Craig Robertson, Head of Sustainability, AHMM
17
B U R O H A P P O L D E N G I N E E R I N G
Copyright © 1976-2017 BuroHappold Engineering. All Rights Reserved
Our interviews revealed a tension between making regulation simple and easy to understand and coping with the complexity necessary to deal with real world problems. For example, they need to support a range of delivery scenarios (i.e. traditional, design & build, partnering). One suggestion to reduce complexity is to ensure regulation aligns with other reporting/regulating structures. Company-level regulation should align with other company reporting requirements such as tax or annual reports. Building-specific regulation should align with building-specific processes i.e. leasing or planning. Planning targets were reported to do this well; in contrast, deciding the scope of an Energy Savings Opportunity Scheme (ESOS)14 assessment for a given company was reported to be confusing because it was both building and organisation based.
A Green Construction Board report15 into energy efficiency makes seven recommendations for effective policy:
• Consistency and longevity should be assured through a realistic timetable
• Objectives should be coherent and clearly communicated
• Market needs should be assessed and guide scheme design
• Performance gaps should be recognised and real savings ensured
• Awareness-raising and consumer engagement should be built in
• Simple policy designs are most effective
• Scrutinise, monitor and evaluate progress, with reference to baseline data
Overall view of the impact of regulation from interviews
• How has regulation impacted your business operations over time? The appetite for driving down carbon emissions seems to have waned. This has provided a chance to consolidate but also has meant a loss of impetus. Amongst the supply chain, it has driven strong demand for energy efficient products and processes. The demand has enabled innovation in the form of cost reductions of products, number of alternative products on the market and improved performance of product.
• What has been the role of environmental regulation as part of overall regulatory compliance? Financial regulation is the dominant form of regulation. Health and safety is also important. Environmental and climate change regulation sit alongside these two.
• How has that changed over time? There is a lack of consistency between regulations. Both in terms of the targets (i.e. zero carbon definition changed) and coverage (i.e. many different pieces of environmental regulation cover the construction sector including EPCs, MEES, Part L, planning, ESOS).
• On a scale of 1-5 what is your perception of the impact of environmental regulation on competitiveness of your business? (1 negative, 5 positive) Generally 3 (neutral) or 4 (slightly positive). Product manufacturer rated it 5.
• What can be done to improve the impact of environmental regulation in future? Clarity on future regulation. Consistency across geographical regions. Make them more ambitious. Consult industry.
• What are the characteristics of good legislation? Responds to the time scales of the industry (i.e. mid-term perspective rather than short term). Aligns with existing processes and reporting structures, e.g. companywide financial reporting or building processes such as planning and leasing.
14 The ESOS regulations are the UK's response to Article 8 of the European Commission's Energy Efficiency Directive. The aim is to cut carbon emissions by requiring large businesses to identify energy reduction measures and make energy savings.
15 GCB (2014). ‘Evaluating the Effectiveness of Energy Efficiency Policies in the Domestic Real Estate Sector’. GCB620 Summary report, Sweett Group and ACE Research

18
A L D E R S G AT E G R O U P : E N V I R O N M E N TA L R E G U L AT I O N S A N D C O M P E T I T I V E N E S S
• The London Plan has raised the standard of building design alongside a suite of other incentives, drivers and support mechanisms. These lessons have been taken and applied to UK-wide and international projects. London has geographic consistency in that all major developments are referred to the Mayor for planning approval, and furthermore these major developments bring economies of scale for resolving complexity and driving investment in innovation. However, there remain challenges around aligning
• However, future policy development should support the accurate prediction of building performance, align stakeholders around performance outcomes, and provide greater transparency concerning actual performance in use.
• The supply chain for buildings is highly fragmented. Designers and consultants have embraced the drive to upskill but this has not been wholly matched by contractors. This is partly because legislation is predominately based on design targets and partly because of the transient nature of the workforce, and their tendency to be organised as SMEs.
The Key Messages
Key messages from the economic impact of the London Plan Climate Change regulation:
• A range of new jobs have been created across the supply chain, ranging from design and consultancy through to product manufacture, construction and operation.
• Additional capital expenditure on low carbon infrastructure has been absorbed within the overall business model for developers such that the policy is deemed commercially viable.
• Predictability and consistency is important. Future changes should be clearly signposted and there should be consistency across geographical locations. This enables forward planning and reduces the bureaucratic burden.
Figure 3.2: SWOT of the London Plan
19
B U R O H A P P O L D E N G I N E E R I N G
Copyright © 1976-2017 BuroHappold Engineering. All Rights Reserved
3.2 WASTEThe Regulation – Landfill Tax
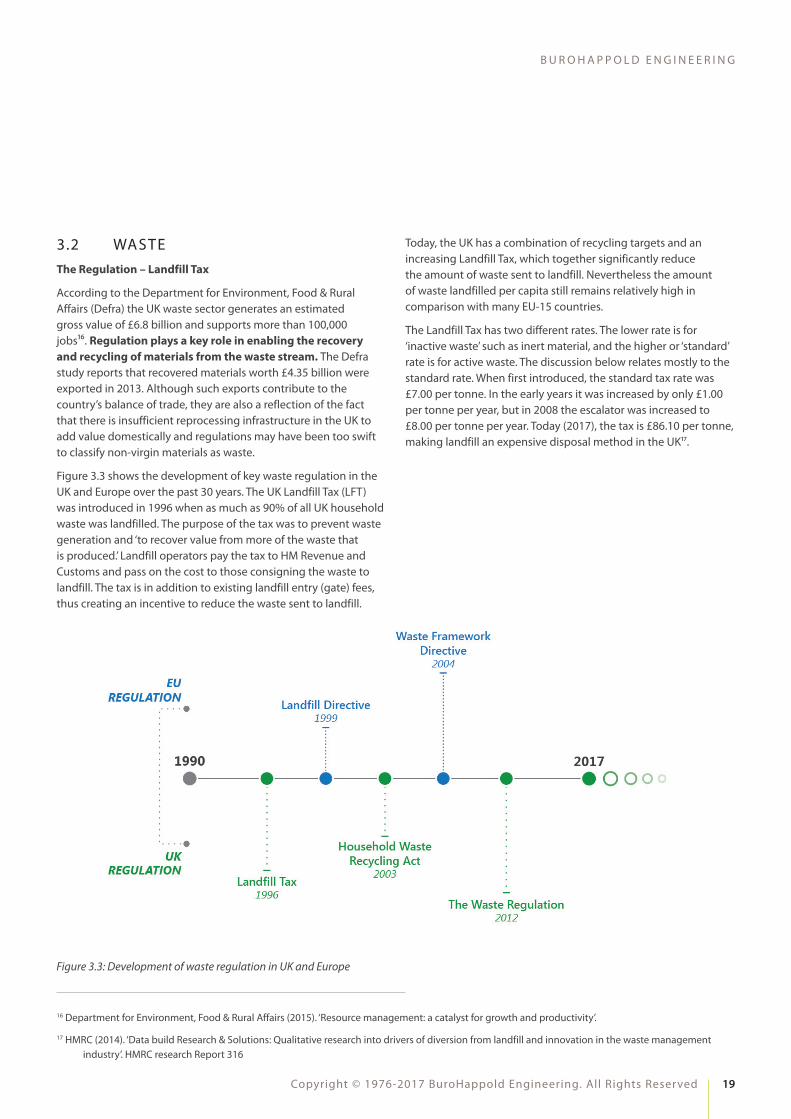
According to the Department for Environment, Food & Rural Affairs (Defra) the UK waste sector generates an estimated gross value of £6.8 billion and supports more than 100,000 jobs16. Regulation plays a key role in enabling the recovery and recycling of materials from the waste stream. The Defra study reports that recovered materials worth £4.35 billion were exported in 2013. Although such exports contribute to the country’s balance of trade, they are also a reflection of the fact that there is insufficient reprocessing infrastructure in the UK to add value domestically and regulations may have been too swift to classify non-virgin materials as waste.
Figure 3.3 shows the development of key waste regulation in the UK and Europe over the past 30 years. The UK Landfill Tax (LFT) was introduced in 1996 when as much as 90% of all UK household waste was landfilled. The purpose of the tax was to prevent waste generation and ‘to recover value from more of the waste that is produced.’ Landfill operators pay the tax to HM Revenue and Customs and pass on the cost to those consigning the waste to landfill. The tax is in addition to existing landfill entry (gate) fees, thus creating an incentive to reduce the waste sent to landfill.
Figure 3.3: Development of waste regulation in UK and Europe
16 Department for Environment, Food & Rural Affairs (2015). ‘Resource management: a catalyst for growth and productivity’.
17 HMRC (2014). ‘Data build Research & Solutions: Qualitative research into drivers of diversion from landfill and innovation in the waste management industry’. HMRC research Report 316
Today, the UK has a combination of recycling targets and an increasing Landfill Tax, which together significantly reduce the amount of waste sent to landfill. Nevertheless the amount of waste landfilled per capita still remains relatively high in comparison with many EU-15 countries.
The Landfill Tax has two different rates. The lower rate is for ‘inactive waste’ such as inert material, and the higher or ‘standard’ rate is for active waste. The discussion below relates mostly to the standard rate. When first introduced, the standard tax rate was £7.00 per tonne. In the early years it was increased by only £1.00 per tonne per year, but in 2008 the escalator was increased to £8.00 per tonne per year. Today (2017), the tax is £86.10 per tonne, making landfill an expensive disposal method in the UK17.

20
A L D E R S G AT E G R O U P : E N V I R O N M E N TA L R E G U L AT I O N S A N D C O M P E T I T I V E N E S S
The Landfill Tax was selected for this study as it has a direct economic impact on waste generators and the waste industry. Further, it was assumed that the waste sector is strongly influenced by environmental regulation as a key driver for new products and services.
With legislation in place for more than 20 years, there is a wide variety of qualitative and quantitative data available to assess the regulation’s economic impact.
In the financial year 1997/98, £352 million of tax was collected for the disposal of 96 million tonnes of waste. The peak of landfill tax declared was in the financial year 2013/14 with £1,180 million collected for the disposal of 36 million tonnes. In the financial year 2016/17 the volume of tax collected dropped to £784 million as only 27 million tonnes of waste were sent for disposal to landfills. This was only 28% of the baseline tonnage disposed of at the introduction of the landfill tax in 1996. Figure 3.4 shows the landfill tax collected and waste tonnage disposed of over time.
Figure 3.4: Landfill tax collected and waste tonnage disposed over time18
18 HMRC (2017). ‘Landfill Tax (LFT)’. Bulletin April 2017
0
200
400
600
800
1,000
1,200
1,400
20
40
60
80
100
120
£ m
illio
n
mill
ion
tonn
es
Waste Tonnage Net Tax Declared

21
B U R O H A P P O L D E N G I N E E R I N G
Copyright © 1976-2017 BuroHappold Engineering. All Rights Reserved
Senior executives shared their rich experience of changes over time. They noted that in the past their business models were linear, with materials being collected, transported and dumped in landfills sites. Today the sector is more dynamic such that new services have to be developed and business models are challenged constantly. Interviewees felt that the regulatory framework for waste gave them and investors a clear framework to move forward to design and build new infrastructure and to enhance their service offerings for commercial and public waste generators. The risks for the sector after the implementation of the Landfill Tax were relatively low, as direct and indirect costs of the tax were passed to waste generators.
INDUSTRY INSIGHT #1
“The waste sector is almost entirely dependent on regulation. Otherwise our business simply would not exist.”
Dr. Gev Eduljee, Director of External Affairs, SUEZ
Benefits of the regulation only appeared in the long-term, when the disposal of waste to landfill became more expensive than alternative treatment methods, which would require large upfront investment. The implementation of further regulations, such as specific recycling targets and landfill diversion rates has helped to increase the activities and offerings of the sector in recycling and advanced treatment. The findings from Table 3.3 were identified from both interviews and desk research.
As indicated in Industry Insight #2, the sector saw a growth in the number and kind of jobs created with the implementation of new infrastructure. While landfills require few highly skilled staff, new facilities such as recycling facilities require a higher and better educated workforce. This is also applicable in the overall value chain of material recycling (see Figure 3.5).
The general perception of the waste sector stakeholders interviewed was that the economic impact of the Landfill Tax was positive. However, they were unanimously of the opinion that the Landfill Tax does not act alone and highlighted that it was the overall environmental and waste regulatory framework that has led to growth in jobs and other business activities. This wider framework has prompted industry and customers to reduce waste for disposal and focus on recycling and energy generation.
The Findings
Findings from the research and interviews conducted confirmed that the waste sector has a strong dependency and reliance on environmental regulation.
Indicators Waste and recycling industry
Direct costs Landfill tax is passed directly on to generators (interviews).
More than £15 billion of tax collected.
Indirect costs More administrative costs, which could also be passed on to waste generators (interviews).
Costs due to increase in illegal waste disposal activities, leading to the need to police the system (HMRC, Environment Agencies, Police) (interviews).
Direct benefits
Has created demand to offer clients alternative services for collection and treatment, thus reducing landfill tax bill (interviews).
Job generation in alternative waste treatment19.
Indirect benefits
Become a supplier of secondary raw materials recovered from waste (interviews).
Increased positive climate and environmental impact due to enhanced treatment of waste16.
Table 3.3 Economic impact of the Landfill Tax
19 Associate Parliamentary Sustainable Resource Group (2012). ‘Sustainable Skills – The future of the waste management industry’.
PRIMARY RESEARCH SOURCES
Interviewees:
• Waste industry: SUEZ, Viridor
• Waste generator: Marks & Spencer
• Public sector: Zero Waste Scotland
Key references:
• Databuild Research & Solutions (2014): Qualitative research into drivers of diversion from landfill and innovation in the waste management industry. HMRC Research Report
• Green Alliance (2014): More jobs, less carbon: why we need landfill bans
• Associate Parliamentary Sustainable Resource Group (2012): Sustainable Skills – The future of the waste management sector
22
A L D E R S G AT E G R O U P : E N V I R O N M E N TA L R E G U L AT I O N S A N D C O M P E T I T I V E N E S S
The separation of the Landfill Tax into the two rates for active and inert waste material still allows large volumes of construction and demolition waste to go to landfill. In the future, the construction industry needs to design out waste from the beginning either by reuse, recycling or reutilising building materials on-site, or by implementing off site construction processes, which require no processing of materials on-site. A similar approach can be applied for the automotive sector so that they can be completely reutilised and reused after their end of life21.
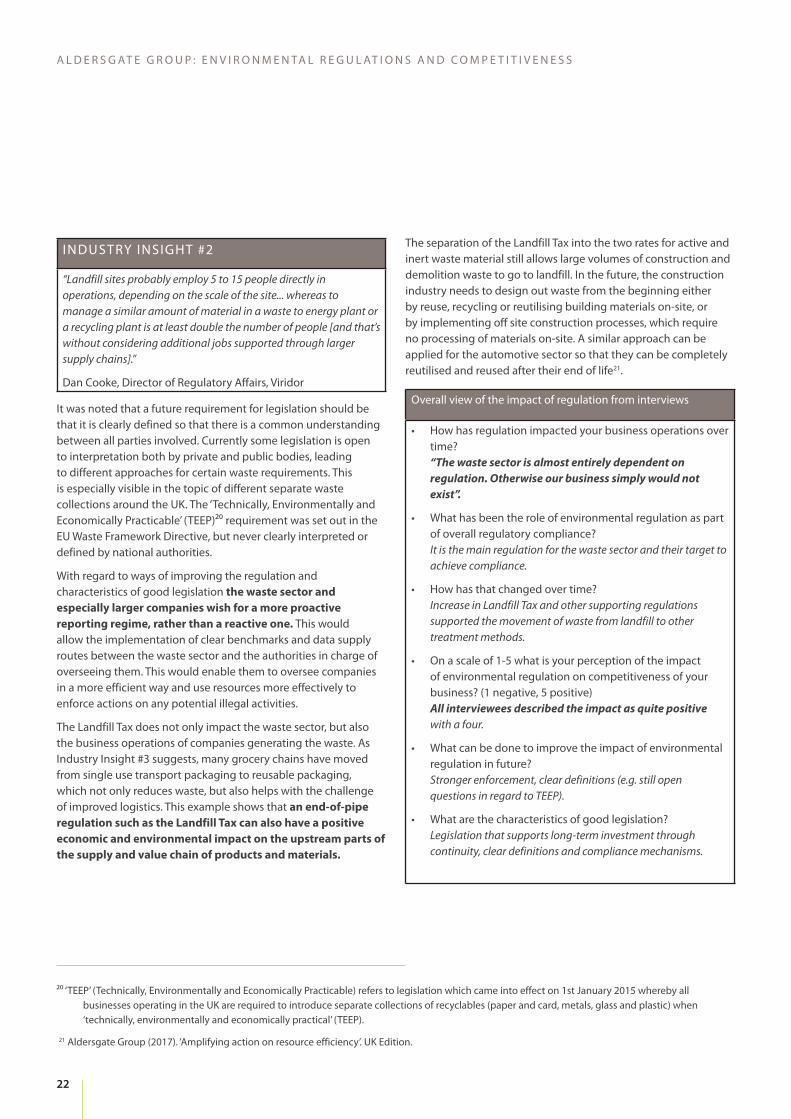
It was noted that a future requirement for legislation should be that it is clearly defined so that there is a common understanding between all parties involved. Currently some legislation is open to interpretation both by private and public bodies, leading to different approaches for certain waste requirements. This is especially visible in the topic of different separate waste collections around the UK. The ‘Technically, Environmentally and Economically Practicable’ (TEEP)20 requirement was set out in the EU Waste Framework Directive, but never clearly interpreted or defined by national authorities.
With regard to ways of improving the regulation and characteristics of good legislation the waste sector and especially larger companies wish for a more proactive reporting regime, rather than a reactive one. This would allow the implementation of clear benchmarks and data supply routes between the waste sector and the authorities in charge of overseeing them. This would enable them to oversee companies in a more efficient way and use resources more effectively to enforce actions on any potential illegal activities.
The Landfill Tax does not only impact the waste sector, but also the business operations of companies generating the waste. As Industry Insight #3 suggests, many grocery chains have moved from single use transport packaging to reusable packaging, which not only reduces waste, but also helps with the challenge of improved logistics. This example shows that an end-of-pipe regulation such as the Landfill Tax can also have a positive economic and environmental impact on the upstream parts of the supply and value chain of products and materials.
20 ‘TEEP’ (Technically, Environmentally and Economically Practicable) refers to legislation which came into effect on 1st January 2015 whereby all businesses operating in the UK are required to introduce separate collections of recyclables (paper and card, metals, glass and plastic) when ‘technically, environmentally and economically practical’ (TEEP).
21 Aldersgate Group (2017). ‘Amplifying action on resource efficiency’. UK Edition.
Overall view of the impact of regulation from interviews
• How has regulation impacted your business operations over time? “The waste sector is almost entirely dependent on regulation. Otherwise our business simply would not exist”.
• What has been the role of environmental regulation as part of overall regulatory compliance? It is the main regulation for the waste sector and their target to achieve compliance.
• How has that changed over time? Increase in Landfill Tax and other supporting regulations supported the movement of waste from landfill to other treatment methods.
• On a scale of 1-5 what is your perception of the impact of environmental regulation on competitiveness of your business? (1 negative, 5 positive) All interviewees described the impact as quite positive with a four.
• What can be done to improve the impact of environmental regulation in future? Stronger enforcement, clear definitions (e.g. still open questions in regard to TEEP).
• What are the characteristics of good legislation? Legislation that supports long-term investment through continuity, clear definitions and compliance mechanisms.
INDUSTRY INSIGHT #2
“Landfill sites probably employ 5 to 15 people directly in operations, depending on the scale of the site... whereas to manage a similar amount of material in a waste to energy plant or a recycling plant is at least double the number of people [and that’s without considering additional jobs supported through larger supply chains].”
Dan Cooke, Director of Regulatory Affairs, Viridor
23
B U R O H A P P O L D E N G I N E E R I N G
Copyright © 1976-2017 BuroHappold Engineering. All Rights Reserved
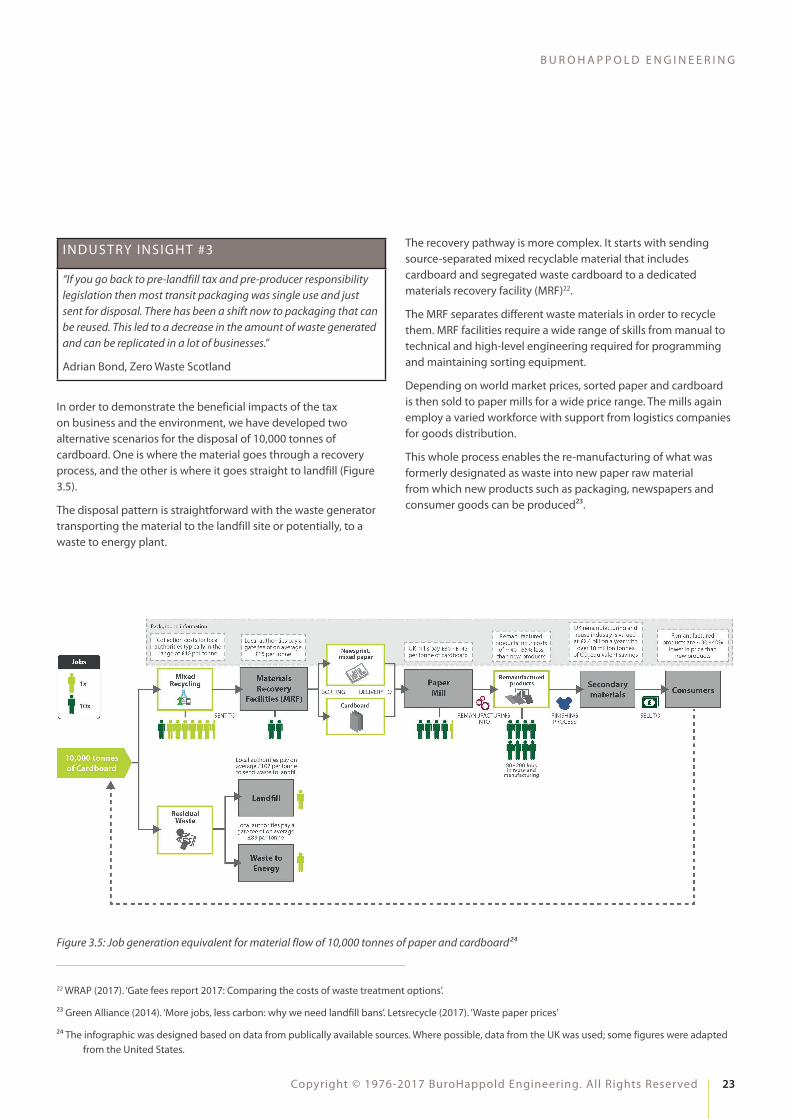
The recovery pathway is more complex. It starts with sending source-separated mixed recyclable material that includes cardboard and segregated waste cardboard to a dedicated materials recovery facility (MRF)22.
The MRF separates different waste materials in order to recycle them. MRF facilities require a wide range of skills from manual to technical and high-level engineering required for programming and maintaining sorting equipment.
Depending on world market prices, sorted paper and cardboard is then sold to paper mills for a wide price range. The mills again employ a varied workforce with support from logistics companies for goods distribution.
This whole process enables the re-manufacturing of what was formerly designated as waste into new paper raw material from which new products such as packaging, newspapers and consumer goods can be produced23.
In order to demonstrate the beneficial impacts of the tax on business and the environment, we have developed two alternative scenarios for the disposal of 10,000 tonnes of cardboard. One is where the material goes through a recovery process, and the other is where it goes straight to landfill (Figure 3.5).
The disposal pattern is straightforward with the waste generator transporting the material to the landfill site or potentially, to a waste to energy plant.
22 WRAP (2017). ‘Gate fees report 2017: Comparing the costs of waste treatment options’.
23 Green Alliance (2014). ‘More jobs, less carbon: why we need landfill bans’. Letsrecycle (2017). ‘Waste paper prices’
24 The infographic was designed based on data from publically available sources. Where possible, data from the UK was used; some figures were adapted from the United States.
Figure 3.5: Job generation equivalent for material flow of 10,000 tonnes of paper and cardboard24
INDUSTRY INSIGHT #3
“If you go back to pre-landfill tax and pre-producer responsibility legislation then most transit packaging was single use and just sent for disposal. There has been a shift now to packaging that can be reused. This led to a decrease in the amount of waste generated and can be replicated in a lot of businesses.”
Adrian Bond, Zero Waste Scotland

24
A L D E R S G AT E G R O U P : E N V I R O N M E N TA L R E G U L AT I O N S A N D C O M P E T I T I V E N E S S
The Key Messages
Key messages from the economic impact of the Landfill Tax:
• The tax started at a low rate, which had a low impact on waste generators but did prompt the sector to introduce new services and infrastructure.
• Alternative treatment methods led to job generation for a higher skilled workforce, while at the same time landfills closed down. Overall, net positive job generation can be seen in the waste sector due to increased environmental regulation.
• The Landfill Tax and other regulations have created many opportunities for the waste sector for new business models and increased activities up and down the value chain of materials and products.
Although it is not possible to compare the exact number of jobs involved in the recycling and disposal pathways, the long value chain of the recycling pathway suggests that many more jobs are created and maintained when waste is recycled rather than when it is consigned to landfill. The Landfill Tax and related environmental regulations have been an essential factor in establishing these new sectors, as well as ensuring valuable materials are recovered for use in a whole new life cycle.
Figure 3.6: SWOT of Landfill Tax regulation
25
B U R O H A P P O L D E N G I N E E R I N G
Copyright © 1976-2017 BuroHappold Engineering. All Rights Reserved
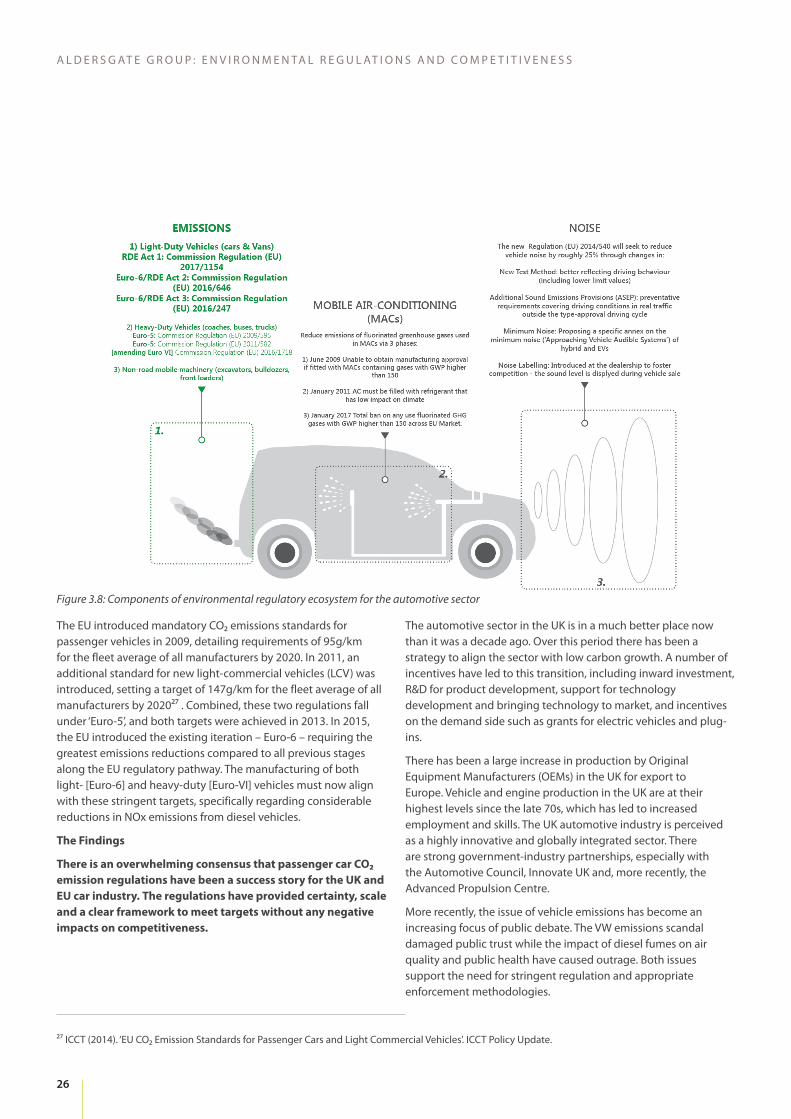
As with buildings, vehicles are major contributors to greenhouse gas emissions, and improving their efficiency has become a fundamental component of global environmental regulation. This has been largely led by the EU, with various renditions of EU regulation having been adopted by the US, Russia, Canada, and Australia26. Emissions standards are at the heart of a complex and interrelated ‘regulatory ecosystem’ for ‘light’- and ‘heavy-duty’ vehicles. Regulations are focused on two major pollutants, carbon dioxide (CO₂) and nitrogen oxides (NOx), the former in the context of global greenhouse gas emissions, the latter in the context of local air quality and health. This has resulted in a gradual and sustained tightening of carbon targets and diesel allowances.
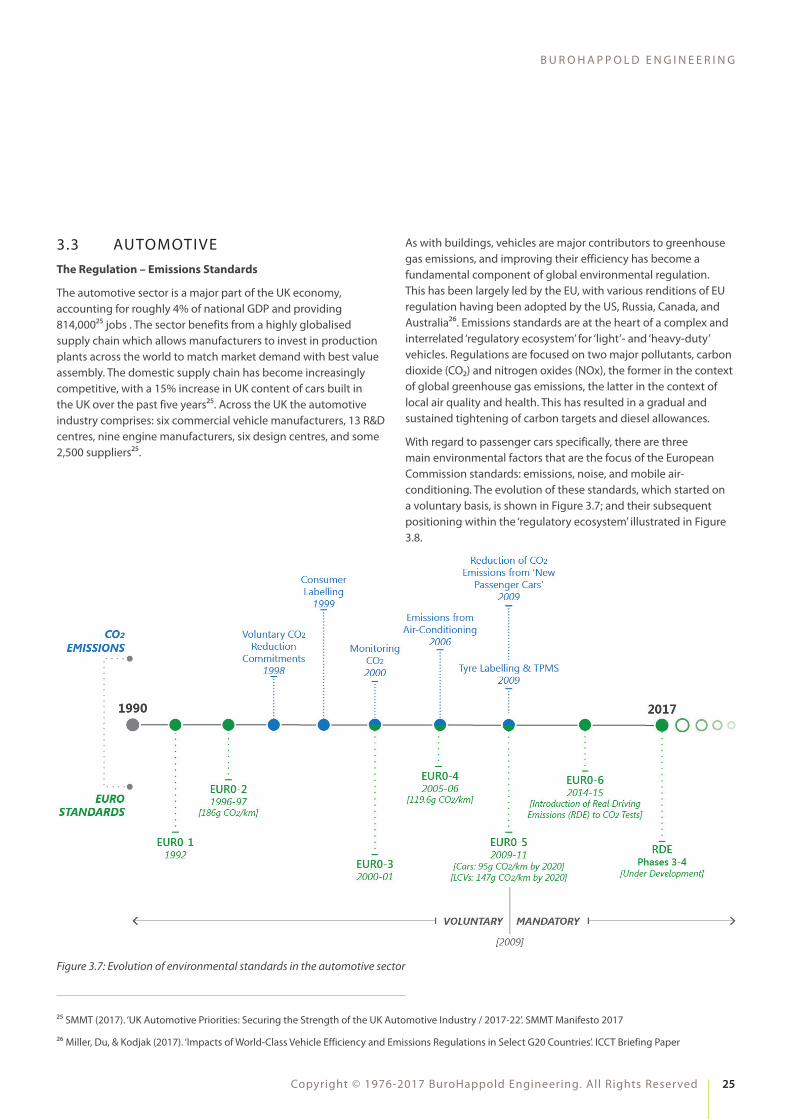
With regard to passenger cars specifically, there are three main environmental factors that are the focus of the European Commission standards: emissions, noise, and mobile air-conditioning. The evolution of these standards, which started on a voluntary basis, is shown in Figure 3.7; and their subsequent positioning within the ‘regulatory ecosystem’ illustrated in Figure 3.8.
3.3 AUTOMOTIVEThe Regulation – Emissions Standards
The automotive sector is a major part of the UK economy, accounting for roughly 4% of national GDP and providing 814,00025 jobs . The sector benefits from a highly globalised supply chain which allows manufacturers to invest in production plants across the world to match market demand with best value assembly. The domestic supply chain has become increasingly competitive, with a 15% increase in UK content of cars built in the UK over the past five years25. Across the UK the automotive industry comprises: six commercial vehicle manufacturers, 13 R&D centres, nine engine manufacturers, six design centres, and some 2,500 suppliers25.
25 SMMT (2017). ‘UK Automotive Priorities: Securing the Strength of the UK Automotive Industry / 2017-22’. SMMT Manifesto 2017
26 Miller, Du, & Kodjak (2017). ‘Impacts of World-Class Vehicle Efficiency and Emissions Regulations in Select G20 Countries’. ICCT Briefing Paper
Figure 3.7: Evolution of environmental standards in the automotive sector
26
A L D E R S G AT E G R O U P : E N V I R O N M E N TA L R E G U L AT I O N S A N D C O M P E T I T I V E N E S S
The EU introduced mandatory CO₂ emissions standards for passenger vehicles in 2009, detailing requirements of 95g/km for the fleet average of all manufacturers by 2020. In 2011, an additional standard for new light-commercial vehicles (LCV) was introduced, setting a target of 147g/km for the fleet average of all manufacturers by 202027 . Combined, these two regulations fall under ‘Euro-5’, and both targets were achieved in 2013. In 2015, the EU introduced the existing iteration – Euro-6 – requiring the greatest emissions reductions compared to all previous stages along the EU regulatory pathway. The manufacturing of both light- [Euro-6] and heavy-duty [Euro-VI] vehicles must now align with these stringent targets, specifically regarding considerable reductions in NOx emissions from diesel vehicles.
The Findings
There is an overwhelming consensus that passenger car CO₂ emission regulations have been a success story for the UK and EU car industry. The regulations have provided certainty, scale and a clear framework to meet targets without any negative impacts on competitiveness.
Figure 3.8: Components of environmental regulatory ecosystem for the automotive sector
The automotive sector in the UK is in a much better place now than it was a decade ago. Over this period there has been a strategy to align the sector with low carbon growth. A number of incentives have led to this transition, including inward investment, R&D for product development, support for technology development and bringing technology to market, and incentives on the demand side such as grants for electric vehicles and plug-ins.
There has been a large increase in production by Original Equipment Manufacturers (OEMs) in the UK for export to Europe. Vehicle and engine production in the UK are at their highest levels since the late 70s, which has led to increased employment and skills. The UK automotive industry is perceived as a highly innovative and globally integrated sector. There are strong government-industry partnerships, especially with the Automotive Council, Innovate UK and, more recently, the Advanced Propulsion Centre.
More recently, the issue of vehicle emissions has become an increasing focus of public debate. The VW emissions scandal damaged public trust while the impact of diesel fumes on air quality and public health have caused outrage. Both issues support the need for stringent regulation and appropriate enforcement methodologies.
27 ICCT (2014). ‘EU CO₂ Emission Standards for Passenger Cars and Light Commercial Vehicles’. ICCT Policy Update.

27
B U R O H A P P O L D E N G I N E E R I N G
Copyright © 1976-2017 BuroHappold Engineering. All Rights Reserved
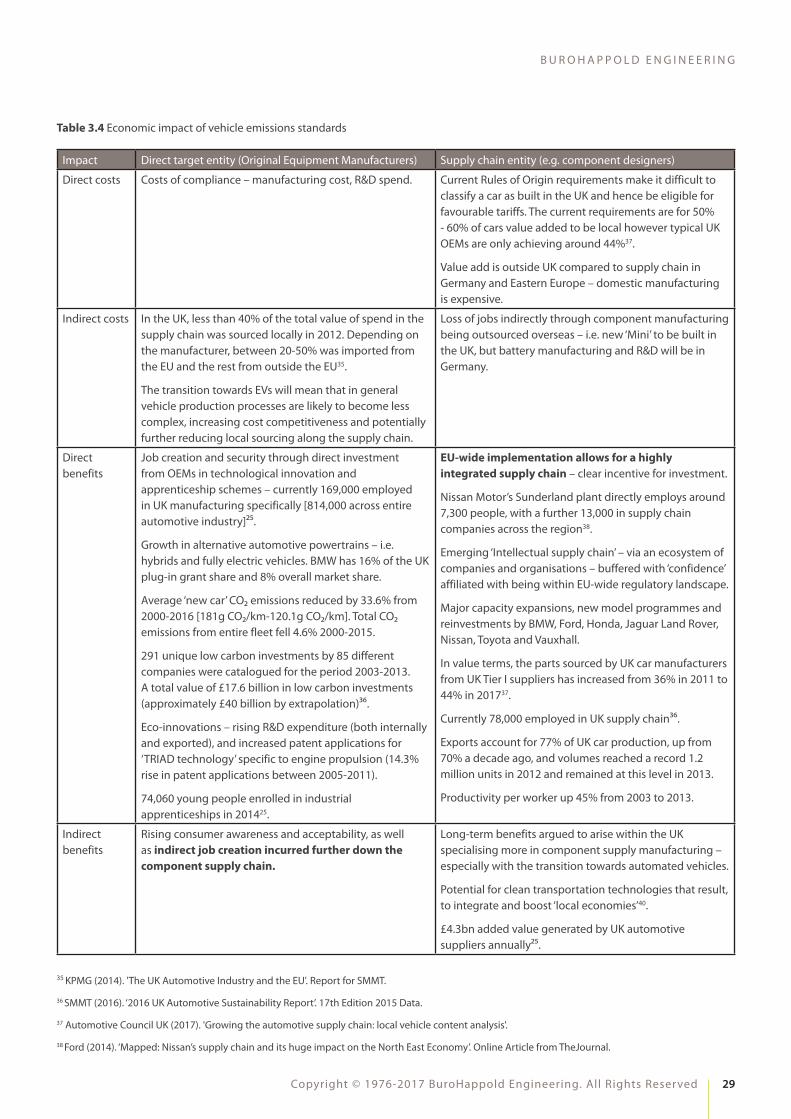
Direct benefits: Industry experts generally have a positive view of the regulation on the economy and environment. Cumulative improvements to the combustion engine, hybridisation, lightweighting, tyre compounds, aerodynamics and transmission have greatly diversified the value chain leading to an increase in direct and indirect jobs. Globally, across all sectors, automotive companies rank third in cash outlays, and fifth in R&D intensity (R&D spend as a % of revenue)28. The innovative nature of the industry has generated a highly skilled and transferrable workforce. The industry, academia and government have invested in a number of apprenticeship and skills development programmes. A number of studies show a postive impact on GDP attributed to fuel cost savings associated with more efficient vehicles, spending on employment and value added (see Table 3.4). The CO₂ emissions, noise and air quality benefits have also been substantial although their economic value is difficult to quantify.
In the UK, Alternatively Fuelled Vehicle (AFV) registrations rose by 22.2% in 2016 to 88,919 units. AFVs typically emit 40% lower CO₂ than the market average. The UK had the largest market in Europe of zero-emission capable cars (pure EV and plug-in hybrid) and also hybrids (SMMT)25.
Direct costs: The last 15 to 20 years has seen a significant increase in regulation to reduce the environmental and health impacts of car emissions. Manufacturers have had to manage production costs, ensuring that they comply with environmental regulation at the same time as meeting the high standards of quality and performance that the market demands.
Massive fragmentation on choice of models and variants makes it difficult to link costs with profit margins. The difficulty in isolating the impact of regulation on costs stems from the complexity of vehicle production technology and pricing/marketing strategies. The introduction of complex engine, vehicle and exhaust after-treatment technologies in the last two decades (partly driven by legislation) that improve environmental performance as well as the introduction of new comfort and safety features and improvements in vehicle performance/engine power output have helped manufacturers absorb any additional costs. In addition, a highly complex and varied pricing strategy across brands and models has changed the time profile of when manufacturers make investments in new technologies and when they recoup the costs of those investments.
Industry and government are pushing the boundaries of CO₂ regulation
• PSA and Toyota are significantly over-complying with their 2015 targets, and are already on their way to meeting their 2020 targets27.
• All new cars launched by Volvo from 2019 onwards will be partially or completely battery-powered.
• Jaguar Land Rover will make only electric or hybrid cars from 2020, despite not making any electric vehicles at present.
• The Scottish government said it would phase out the need for petrol and diesel cars by 2032, eight years earlier than the UK and French targets banning sales of new cars with internal combustion engines (ICEs).
PRIMARY RESEARCH SOURCES
Interviewees:
• OEMs: Ford
• Supply chain: Bosch
• Industry overview: LowCVP
Key references:
• EC Impact Assessment accompanying the New Car CO₂ Regulation (EC 443/2009)
• ICCT, EU CO₂ Emission Standards for Passenger Cars and Light-commercial vehicles, policy update
• SMMT, New Car CO₂ Report, 2017
• LowCVP (2014) Investing in the low carbon journey, Lessons from the first decade of UK policy on the road to 2050
28 PwC (2015). ‘The 2015 Global Innovation 1000: Automotive Industry Findings’. Strategy& Paper.
28
A L D E R S G AT E G R O U P : E N V I R O N M E N TA L R E G U L AT I O N S A N D C O M P E T I T I V E N E S S
Looking forward, as targets become ever more stringent32, car manufacturers acknowledge that although electrification of the powertrain is currently a high cost strategy for compliance, it could become the only viable approach in the long run. Indeed, several manufacturers have already indicated that they will stop producing ICE engines and go ‘all electric’ (for example Volvo33, Jaguar Land Rover, Ford) and the industry is clearly investing in alternatively fuelled vehicles, with more than 60 different models available on the market34. The significant investment required to move towards electrification – both for OEMs and the supply chain – does have the potential for reduced costs in the long term. Exactly how this evolves is yet to be seen.
In summary, OEMs have taken a sophisticated approach to interpreting and internalising environmental regulatory costs as part of their business strategies. The relatively stable and consistent regulatory framework has allowed for a long term and broader view of managing the costs of compliance, with numerous technology and business approaches being adopted. Along with the spillover benefits of innovation, the automotive industry is taking a flexible and positive view of regulation.
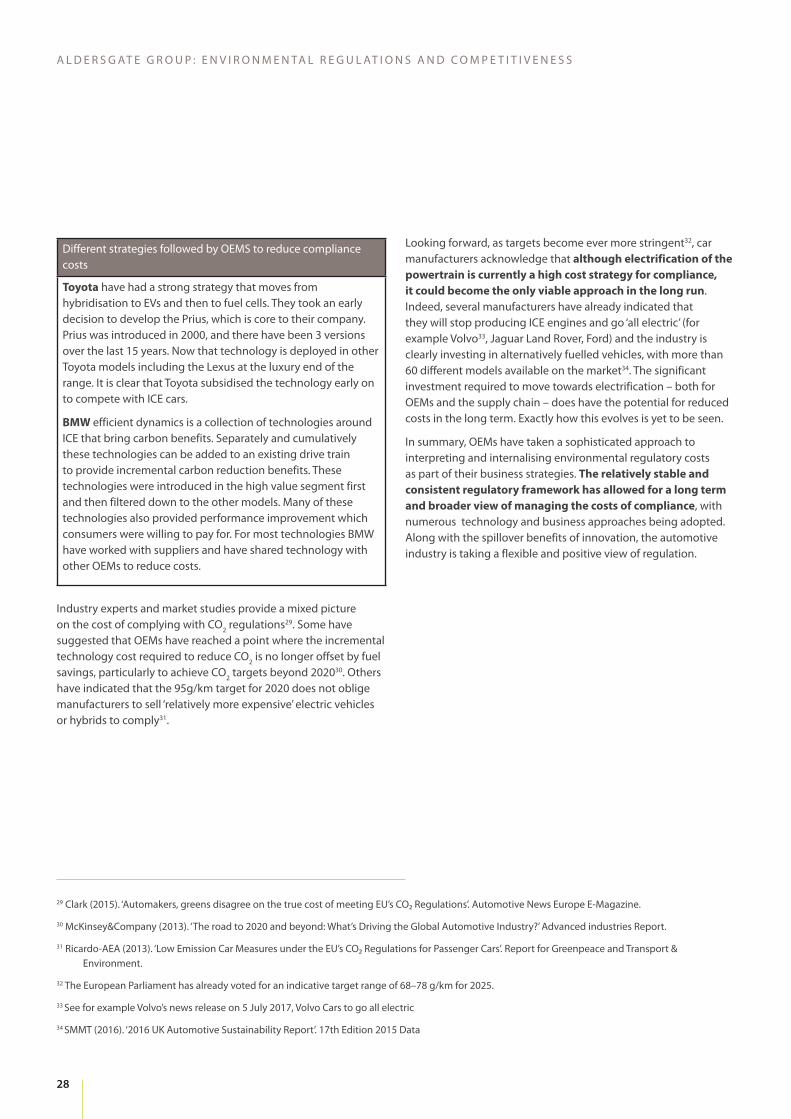
Different strategies followed by OEMS to reduce compliance costs
Toyota have had a strong strategy that moves from hybridisation to EVs and then to fuel cells. They took an early decision to develop the Prius, which is core to their company. Prius was introduced in 2000, and there have been 3 versions over the last 15 years. Now that technology is deployed in other Toyota models including the Lexus at the luxury end of the range. It is clear that Toyota subsidised the technology early on to compete with ICE cars.
BMW efficient dynamics is a collection of technologies around ICE that bring carbon benefits. Separately and cumulatively these technologies can be added to an existing drive train to provide incremental carbon reduction benefits. These technologies were introduced in the high value segment first and then filtered down to the other models. Many of these technologies also provided performance improvement which consumers were willing to pay for. For most technologies BMW have worked with suppliers and have shared technology with other OEMs to reduce costs.
Industry experts and market studies provide a mixed picture on the cost of complying with CO2 regulations29. Some have suggested that OEMs have reached a point where the incremental technology cost required to reduce CO2 is no longer offset by fuel savings, particularly to achieve CO2 targets beyond 202030. Others have indicated that the 95g/km target for 2020 does not oblige manufacturers to sell ‘relatively more expensive’ electric vehicles or hybrids to comply31.
29 Clark (2015). ‘Automakers, greens disagree on the true cost of meeting EU’s CO₂ Regulations’. Automotive News Europe E-Magazine.
30 McKinsey&Company (2013). ‘The road to 2020 and beyond: What’s Driving the Global Automotive Industry?’ Advanced industries Report.
31 Ricardo-AEA (2013). ‘Low Emission Car Measures under the EU’s CO₂ Regulations for Passenger Cars’. Report for Greenpeace and Transport & Environment.
32 The European Parliament has already voted for an indicative target range of 68–78 g/km for 2025.
33 See for example Volvo’s news release on 5 July 2017, Volvo Cars to go all electric
34 SMMT (2016). ‘2016 UK Automotive Sustainability Report’. 17th Edition 2015 Data
29
B U R O H A P P O L D E N G I N E E R I N G
Copyright © 1976-2017 BuroHappold Engineering. All Rights Reserved
Impact Direct target entity (Original Equipment Manufacturers) Supply chain entity (e.g. component designers)
Direct costs Costs of compliance – manufacturing cost, R&D spend. Current Rules of Origin requirements make it difficult to classify a car as built in the UK and hence be eligible for favourable tariffs. The current requirements are for 50% - 60% of cars value added to be local however typical UK OEMs are only achieving around 44%37.
Value add is outside UK compared to supply chain in Germany and Eastern Europe – domestic manufacturing is expensive.
Indirect costs In the UK, less than 40% of the total value of spend in the supply chain was sourced locally in 2012. Depending on the manufacturer, between 20-50% was imported from the EU and the rest from outside the EU35.
The transition towards EVs will mean that in general vehicle production processes are likely to become less complex, increasing cost competitiveness and potentially further reducing local sourcing along the supply chain.
Loss of jobs indirectly through component manufacturing being outsourced overseas – i.e. new ‘Mini’ to be built in the UK, but battery manufacturing and R&D will be in Germany.
Direct benefits
Job creation and security through direct investment from OEMs in technological innovation and apprenticeship schemes – currently 169,000 employed in UK manufacturing specifically [814,000 across entire automotive industry]25.
Growth in alternative automotive powertrains – i.e. hybrids and fully electric vehicles. BMW has 16% of the UK plug-in grant share and 8% overall market share.
Average ‘new car’ CO₂ emissions reduced by 33.6% from 2000-2016 [181g CO₂/km-120.1g CO₂/km]. Total CO₂ emissions from entire fleet fell 4.6% 2000-2015.
291 unique low carbon investments by 85 different companies were catalogued for the period 2003-2013. A total value of £17.6 billion in low carbon investments (approximately £40 billion by extrapolation)36.
Eco-innovations – rising R&D expenditure (both internally and exported), and increased patent applications for ‘TRIAD technology’ specific to engine propulsion (14.3% rise in patent applications between 2005-2011).
74,060 young people enrolled in industrial apprenticeships in 201425.
EU-wide implementation allows for a highly integrated supply chain – clear incentive for investment.
Nissan Motor’s Sunderland plant directly employs around 7,300 people, with a further 13,000 in supply chain companies across the region38.
Emerging ‘Intellectual supply chain’ – via an ecosystem of companies and organisations – buffered with ‘confidence’ affiliated with being within EU-wide regulatory landscape.
Major capacity expansions, new model programmes and reinvestments by BMW, Ford, Honda, Jaguar Land Rover, Nissan, Toyota and Vauxhall.
In value terms, the parts sourced by UK car manufacturers from UK Tier I suppliers has increased from 36% in 2011 to 44% in 201737.
Currently 78,000 employed in UK supply chain36.
Exports account for 77% of UK car production, up from 70% a decade ago, and volumes reached a record 1.2 million units in 2012 and remained at this level in 2013.
Productivity per worker up 45% from 2003 to 2013.
Indirect benefits
Rising consumer awareness and acceptability, as well as indirect job creation incurred further down the component supply chain.
Long-term benefits argued to arise within the UK specialising more in component supply manufacturing – especially with the transition towards automated vehicles.
Potential for clean transportation technologies that result, to integrate and boost ‘local economies’40.
£4.3bn added value generated by UK automotive suppliers annually25.
35 KPMG (2014). 'The UK Automotive Industry and the EU'. Report for SMMT.
36 SMMT (2016). ‘2016 UK Automotive Sustainability Report’. 17th Edition 2015 Data.
37 Automotive Council UK (2017). 'Growing the automotive supply chain: local vehicle content analysis'.
38 Ford (2014). ‘Mapped: Nissan’s supply chain and its huge impact on the North East Economy’. Online Article from TheJournal.
Table 3.4 Economic impact of vehicle emissions standards
30
A L D E R S G AT E G R O U P : E N V I R O N M E N TA L R E G U L AT I O N S A N D C O M P E T I T I V E N E S S
Even though there have been substantial benefits to the UK automotive sector from passenger car CO₂ regulation, there are some challenges going forward. Trade barriers will be painful. For example, engine components from Ford UK go out to Ford’s plants elsewhere in the EU and back several times. Current Rules of Origin requirements make it difficult to classify a car as built in the UK and hence be eligible for favourable tariffs. The current requirements are for 50% - 60% of cars value added to be local however typical UK OEMs are only achieving around 44%37. This is a notable increase since the hollowing out of the UK supply base in the 1990s and early 2000s, but is still low. The UK supply chain remains relatively weak with none of the top Tier 1 suppliers based here39. In part this is because the UK is still not widely regarded as a cost-competitive manufacturing location and in part because of the consolidation of the largest Tier 1 suppliers elsewhere in Europe over recent decades. Value add is less in Britain compared with the supply chain in Germany and Eastern Europe. For example, the new Mini is being built in the UK but battery manufacturing and R&D will be undertaken in Germany.
One interviewee noted that although there is significant funding available, it is not being fully utilised. The Advanced Propulsion Centre with £1 billion of funding over 10 years is aiming to place the UK at the global forefront of low-carbon vehicle development but lacks projects for funding as it requires more supply chain and OEMs to actively participate.
In summary, ICE improvements have created direct and indirect jobs. However, further CO₂ reductions would require a step change in production and consumer behaviour towards EVs. It is likely that the transition to full EVs will lead to a global reduction in direct and indirect automotive engineering jobs due to the considerable reduction in vehicle complexity and greater automation. Maintaining the UK’s competitiveness is likely to require a further wave of regulatory incentives and public-private partnerships to go beyond existing business models.
In addition to cumulative policy effects, respondents referred to the confidence derived from having a clear channel for dialogue with the government (via the Automotive Council and others). Importance is attached to the ‘intellectual supply chain’ that has developed in the UK and partners elsewhere in the EU, ensuring that ideas can be turned into products through a well-functioning ecosystem of companies and organisations.
39 Automotive News (2016). Top Suppliers. Tier 1 or ‘first tier’ suppliers are suppliers that directly deliver parts, components or materials to OEMs. Tier 2 suppliers are delivering predominantly into Tier 1 suppliers, while Tier 3 suppliers deliver into Tier 2 suppliers, and so on.
40ICCT (2017). ‘International Competitiveness and Auto Industry: What’s the Role of Motor Vehicle Emission Standards’? Briefing

31
B U R O H A P P O L D E N G I N E E R I N G
Copyright © 1976-2017 BuroHappold Engineering. All Rights Reserved
The Key Messages
• The emissions reduction regulations have greatly complemented the innovative nature of the industry and generated positive impacts on jobs, skills and growth through new partnerships and business models.
• There is a sense that the industry works in a very collaborative manner to comply with regulation. Future changes to the regulation should maintain this business environment for developing new emission saving packages.
• The UK has some of the most challenging economy-wide CO2 reduction targets in the world, including plans to decarbonise the vehicle fleet by 2050. The rate of improvement is likely to be difficult to maintain and will require a balanced transition to full EVs, given that cost-effective measures of ICEs have already been progressively undertaken. It is likely to require a step-change in production, government incentives and consumer acceptance of alternatively-fuelled vehicles.
Overall view of the impact of regulation from interviews
• How has regulation impacted your business operations over time? Generally, very positive as the regulation is technology neutral, transparent, with a clear framework and provides sufficient compliance timescales.
• What has been the role of environmental regulation as part of overall regulatory compliance? The automotive sector is also one of the most heavily regulated industries in the EU, and indeed elsewhere. EU regulations relating to safety, the environment, the type approval of vehicles and national taxation schemes have added to manufacturing costs. However, it is not clear how these costs have been shared between manufacturers and consumers due to extremely complex business models.
• How has that changed over time? EU passenger car CO₂ regulation has incentivised companies to integrate environmental performance in each part of the value chain and by forging cross sector and cross industry partnerships.
• On a scale of 1-5 what is your perception of the impact of environmental regulation on competitiveness of your business? (1 negative, 5 positive) Is viewed very positively. Definitely a success story for the UK automotive industry.
• What can be done to improve the impact of environmental regulation in future? Stick to EU regulation, bigger ambitious of regulation and bigger economies of scale. Scale and regulatory certainty are important to reduce compliance costs. No OEMs or suppliers will produce vehicles and technology just for the UK, and only target markets where there is scale and growth.

32
A L D E R S G AT E G R O U P : E N V I R O N M E N TA L R E G U L AT I O N S A N D C O M P E T I T I V E N E S S
Figure 3.9: SWOT of EU vehicle emissions regulation
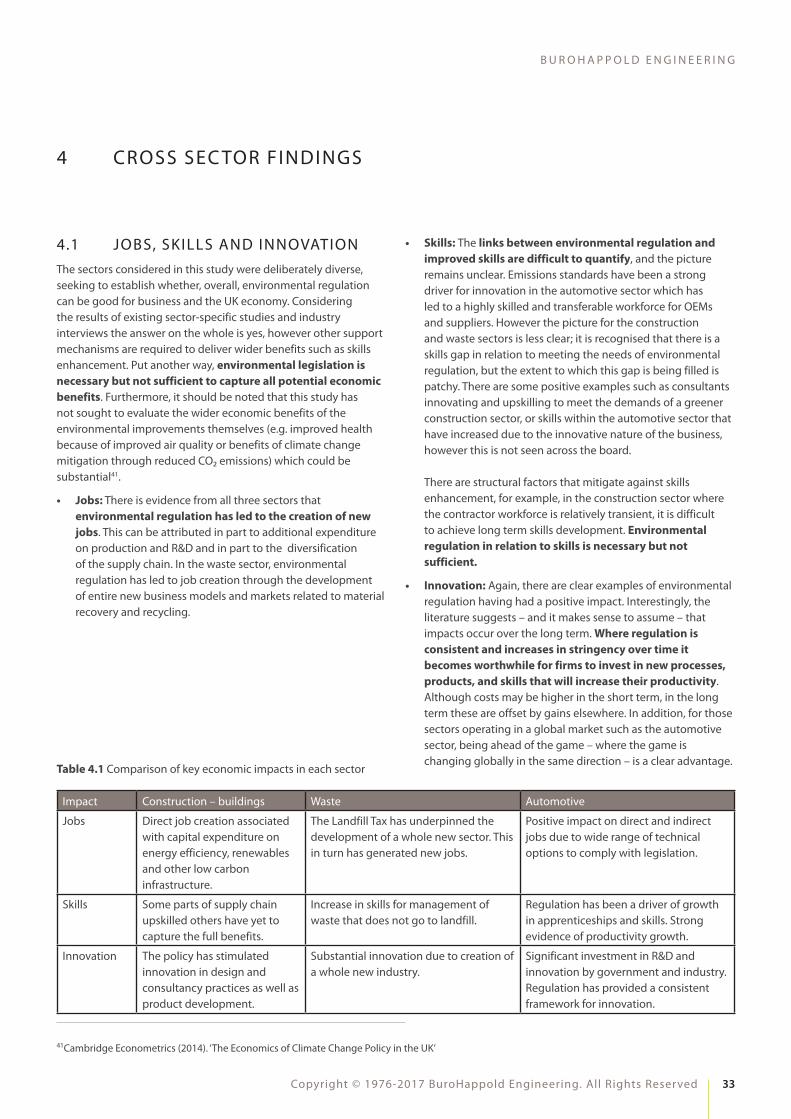
33
B U R O H A P P O L D E N G I N E E R I N G
Copyright © 1976-2017 BuroHappold Engineering. All Rights Reserved
• Skills: The links between environmental regulation and improved skills are difficult to quantify, and the picture remains unclear. Emissions standards have been a strong driver for innovation in the automotive sector which has led to a highly skilled and transferable workforce for OEMs and suppliers. However the picture for the construction and waste sectors is less clear; it is recognised that there is a skills gap in relation to meeting the needs of environmental regulation, but the extent to which this gap is being filled is patchy. There are some positive examples such as consultants innovating and upskilling to meet the demands of a greener construction sector, or skills within the automotive sector that have increased due to the innovative nature of the business, however this is not seen across the board. There are structural factors that mitigate against skills enhancement, for example, in the construction sector where the contractor workforce is relatively transient, it is difficult to achieve long term skills development. Environmental regulation in relation to skills is necessary but not sufficient.
• Innovation: Again, there are clear examples of environmental regulation having had a positive impact. Interestingly, the literature suggests – and it makes sense to assume – that impacts occur over the long term. Where regulation is consistent and increases in stringency over time it becomes worthwhile for firms to invest in new processes, products, and skills that will increase their productivity. Although costs may be higher in the short term, in the long term these are offset by gains elsewhere. In addition, for those sectors operating in a global market such as the automotive sector, being ahead of the game – where the game is changing globally in the same direction – is a clear advantage.
4.1 JOBS, SKILLS AND INNOVATIONThe sectors considered in this study were deliberately diverse, seeking to establish whether, overall, environmental regulation can be good for business and the UK economy. Considering the results of existing sector-specific studies and industry interviews the answer on the whole is yes, however other support mechanisms are required to deliver wider benefits such as skills enhancement. Put another way, environmental legislation is necessary but not sufficient to capture all potential economic benefits. Furthermore, it should be noted that this study has not sought to evaluate the wider economic benefits of the environmental improvements themselves (e.g. improved health because of improved air quality or benefits of climate change mitigation through reduced CO₂ emissions) which could be substantial41.
• Jobs: There is evidence from all three sectors that environmental regulation has led to the creation of new jobs. This can be attributed in part to additional expenditure on production and R&D and in part to the diversification of the supply chain. In the waste sector, environmental regulation has led to job creation through the development of entire new business models and markets related to material recovery and recycling.
4 CROSS SEC TOR FINDINGS
Impact Construction – buildings Waste Automotive
Jobs Direct job creation associated with capital expenditure on energy efficiency, renewables and other low carbon infrastructure.
The Landfill Tax has underpinned the development of a whole new sector. This in turn has generated new jobs.
Positive impact on direct and indirect jobs due to wide range of technical options to comply with legislation.
Skills Some parts of supply chain upskilled others have yet to capture the full benefits.
Increase in skills for management of waste that does not go to landfill.
Regulation has been a driver of growth in apprenticeships and skills. Strong evidence of productivity growth.
Innovation The policy has stimulated innovation in design and consultancy practices as well as product development.
Substantial innovation due to creation of a whole new industry.
Significant investment in R&D and innovation by government and industry. Regulation has provided a consistent framework for innovation.
Table 4.1 Comparison of key economic impacts in each sector
41Cambridge Econometrics (2014). ‘The Economics of Climate Change Policy in the UK’

34
A L D E R S G AT E G R O U P : E N V I R O N M E N TA L R E G U L AT I O N S A N D C O M P E T I T I V E N E S S
In the automotive sector, the most global of the three sectors selected, a huge amount of research has been undertaken to show that innovation, jobs and higher skills have developed on the back of the regulation. The extent to which this has benefited UK plc varies, with supply chain benefits mostly flowing overseas. The move to electric vehicles is likely to reduce automotive engineering jobs globally due to less complex production processes. The impact this will have on the UK's existing automotive industry is uncertain.
In terms of where environmental regulation has fallen down and received bad press, a significant area in the sectors studied are the limitations inherent in the methodologies used for delivering compliance. In the building sector, CO₂ reductions rely on normalised Part L compliance (design stage) calculations and in the automotive sector, there have been well publicised issues around whether the tests used to demonstrate compliance adequately reflect the ‘real world’. Although these factors in themselves are not linked to jobs, they do undermine the credibility of what otherwise is considered to be good regulation.
4.2 CHARAC TERISTICS OF GOOD REGULATION
The characteristics of good environmental regulation identified in this study support existing narratives – it must be ambitious, clear and consistent, giving players certainty and a clear direction of travel. It must not hold back innovation from delivering desired outcomes, and must be compatible with other related policies. Only then will environmental regulation unlock investment into new jobs and training. Where regulation has been in place for some time and where stringency has gradually increased as with the Landfill Tax, there is increasing evidence that this does have a positive impact.
This study has considered three sectors in detail, and we have sought to highlight where there are lessons that can be shared with the rest of the economy. As shown in Table 4.2, each regulation chosen has differing characteristics and can be seen to be ‘successful’ in different respects. The London Plan is ambitious and sets out a reasonably consistent pathway to greater sustainability, however it is complex, local and puts requirements on the supply chain which are sometimes not fulfilled because of the fragmented nature of the industry.
The Landfill Tax, is the longest running of the regulations; it is simple and has been increasing steadily over time, showing a clear direction of travel. It has spawned whole new industries, extensive innovation and a wealth of new skills, however in some ways it is the victim of its own success with unintended consequences around tax avoidance reducing its impact and causing problems elsewhere.

35
B U R O H A P P O L D E N G I N E E R I N G
Copyright © 1976-2017 BuroHappold Engineering. All Rights Reserved
Characteristic of good regulation
Construction Waste Automotive
Ambitious London Plan is ambitious As the Landfill Tax has become more stringent, positive impacts have increased
As regulation has become more stringent, positive impacts have increased
Clear London Plan is complex Very straight forward Straight forward in summary but ‘the devil is in the detail’
Consistent / long term Reasonably Strong Strong
Well implemented and supported by compliance requirements
Performance gap – tools used to deliver compliance are based on design performance
n/a Performance gap – tools used to deliver compliance are out of date
At scale – EU / national rather than local
Local thus benefits not necessarily captured nationally
National EU – currently at risk; good globally
Supply chain supported so as to capture benefits
Complex supply chain, complex picture – winners and losers
Has created whole new industry – recycling
Significant impact on supply chain but much of it overseas
SMEs supported to as to capture benefits
SMEs struggle to meet requirements
SMEs good at innovating Supported through the supply chain and the need to constantly innovate
Table 4.2 Extent to which the regulations selected have the characteristics of good regulation

36
A L D E R S G AT E G R O U P : E N V I R O N M E N TA L R E G U L AT I O N S A N D C O M P E T I T I V E N E S S
NOTES

37
B U R O H A P P O L D E N G I N E E R I N G
Copyright © 1976-2017 BuroHappold Engineering. All Rights Reserved

38
A L D E R S G AT E G R O U P : E N V I R O N M E N TA L R E G U L AT I O N S A N D C O M P E T I T I V E N E S S

39
B U R O H A P P O L D E N G I N E E R I N G
Copyright © 1976-2017 BuroHappold Engineering. All Rights Reserved

Copy
right
© 1
976-
2017
Bur
oHap
pold
Eng
inee
ring.
All
Righ
ts R
eser
ved
w w w.burohappold.com
ALDERSGATE GROUP
H E L P O R H I N D R A N C E ?E N V I R O N M E N T A L R E G U L A T I O N S A N D
C O M P E T I T I V E N E S S
Front cover images
Wembley Park © Jason Hawkes
Recycling © James Hobson
Electric Car © Mike at www.pexels.com
C O N TA C TDuncan Price
T: +44 (0)20 7927 9700M: +44 (0)7702 762 076
Email: [email protected]