helping without trusting: disentangling prosocial behaviours
TRANSCRIPT

gareth.jones Section name
© Department of Economics, University of Reading 2016
Helping without Trusting: Disentangling Prosocial Behaviours
by Lorna Zischka and Marina Della Giusta
Department of Economics Centre for Institutions and Economic History (CIEH)
Discussion Paper No. 2016-128 Department of Economics University of Reading Whiteknights Reading RG6 6AA United Kingdom www.reading.ac.uk


1
June 2016
Department of Economics, University of Reading
Helping without trusting: disentangling
prosocial behaviours
Lorna Zischka and Marina Della Giusta1
1Department of Economics, University of Reading, Whiteknights,
PO Box 217, Reading, RG6 6AH, UK. [email protected]

2
Abstract
Giving (in this case volunteering, helping others informally, participating in civic action and giving
money to charity) is defined in the literature as a prosocial behaviour form in which an individual is
motivated to allocate their time and money to others. This paper examines the motivations for giving,
and how these relate to social cohesion (proxied by trust in neighbours). We show, using the
Citizenship Survey of England and Wales (2008-11) that these motivations to give depend depends
partly on the conditions of the wider social environment, including the position of the individual
within it. We also identify, via principal component analysis of our regression residuals, the existence
of an unobserved propensity to give. This is compatible with the existence of prosocial attitudes,
which significantly influence all forms of giving. Our main contribution is to show that this attitudinal
component is able to stimulate giving even when the wider social environment is unfavourable (and
the giver’s trust consequently low). Thus although a favourable wider social environment (proxied in
trust) and individual prosocial inclinations are usually expected to sustain one another, the finding that
they can also occur independently of each other could help explain both how individuals contribute to
(or detract from) communal trust levels (social cohesion), and how individuals' (limited but
significant) capacity for pro or antisocial action independent of the cues coming from the wider social
environment can make them agents of change.
Keywords: giving; prosocial attitudes; social cohesion; trust.

3
1. Introduction
Giving (in this case volunteering, helping others informally, participating in civic action and giving
money to charity) is defined in the literature as a prosocial behaviour form in which an individual is
motivated to allocate their time and money to others. Using the Citizenship Survey of England and
Wales (2008-2011), this paper examines these motivations for giving, distinguishing between drivers
that depend on the socio-economic environment of the donor and drivers that can be attributed to an
unobserved individual propensity to give. We then go on to describe how each of these drivers is
associated with social cohesion, proxied by trust in neighbours. Although social characteristics
associated with trust are expected to be associated with giving also (since people who trust others to
use the gift appropriately are more inclined to give (Kolm and Ythier 2006)), a finding that some
prosocial inclinations occur independently of trust could help to explain how the trust-giving
relationship might actually constitute a two-way process. Giving people are displaying trustworthy
behaviours that potentially stimulate a more cooperative response from others (Kolm and Ythier 2006;
Kosse et al. 2016). If then, we find that individuals possess a capacity to carry out pro or antisocial
actions independently of the cues coming from the wider social environment, this could explain how
individuals are able to be agents of change within that environment. The existence of some small
degree of pro or antisocial behavioural choice would mean that those individuals are not only being
driven by their personal social environment, they are also influencing its nature by the choices of
action that they take towards the people that they come into contact with.
Giving is not carried out for a specific, contractable return, but instead depends on social ties, social
pressures and incentives and individual prosocial attitudes (Kolm and Ythier 2006; Bekkers and
Wiepking 2007). This mix of social drivers that make up the quality of relationships between people is
hard to analyse in itself (Bebbington et al. 2004; Portes and Landolt 2000; Quibria 2003; Du Toit
2004; Woolcock and Narayan 2000). However in monitoring the existence or non-existence of giving
behaviours, we may gain insight into the prosocial qualities of a person’s interactions. Authors such as
CAF (2012); Bekkers and Wiepking (2007); Andreoni et al. (1996) suggest that various forms of
giving tend to move together. This may infer that by monitoring a limited array of prosocial
behaviours like giving, we might gain information about a much more generalised array of prosocial
behaviours. We seek confirmation of this in the Citizenship Survey (which was conducted in England
and Wales from 2001 to 2010-2011 with the purpose of providing an evidence base for the work of the
UK Department for Communities and Local Government (DCLG)). We investigate four forms of
giving separately, and use the same drivers (independent variables) for each model. Should we find
that multiple forms of giving all have the same drivers, we gain support for the idea that giving
patterns are a useful indicator of prosocial/ pro-cohesive behaviours within the civic sector more
generally.

4
For the purposes of this paper then, we define an individual prosocial attitude as a willingness to take
other people into consideration in one’s resource allocation decisions. Gui and Sugden (2010) as well
as Kolm and Ythier (2006) and Konow (2010) are at pains to point out that this ‘consideration for
others’ has a wide range of drivers. Intrinsic motivations (valuing the other person or the relationship
in its own right) may certainly have a part. But there are also instrumental reasons for giving: positive
relationships yield benefits also to the giver. Social ties, pressures, norms and expectations likewise
shape our decisions; people are more likely to give to those they identify with, and they also need to
be assured that others are ‘doing their bit’ before they do theirs. Thus giving depends on (1) personal
inclination and (2) the conditions of the wider social environment (including connections with other
people, the norms governing those connections, and socio-economic positioning). Manipulation of the
social environment may be one way to increase giving and other prosocial behaviours (Holloway et
al. 1977; DeScioli and Krishna 2013; Zischka 2016a; Hoffman et al. 1996; Wilkinson and Pickett
2009), but this will not explain all the variations in giving patterns.
We therefore turn next to the cognitive or attitudinal component of prosocial behaviours. Because this
is not so tangible and is less easily identified in direct survey questions, we hypothesise that its impact
will fall into the residuals of our model, which capture all unobserved individual variation. We test if
there is any systematic unobserved propensity to give in the regression residuals by means of principal
component analysis, to capture co-variations between the residuals of the regressions. We take a
statistically significant co-variation in the residuals to represent an unobserved ‘propensity to give’; a
finding which is consistent with the existence of attitudinal drivers to giving.
The paper then describes how observable (structural) and unobservable (cognitive) factors identified
in our regressors are associated with giving and trust in parallel. ‘Trust’ refers to a respondent’s
subjective assessment of the proportion of her neighbours who are trustworthy. Because of its
dependence on inter-personal relationships, trust is often used as an indicator of the state of the social
environment and a simplified proxy of how cohesive relationships between people are (e.g. Knack
and Keefer 1997). Trust in neighbours is the confidence that neighbours will not exploit an
opportunity to take advantage of you (Cox et al. 2014). Literature has shown that without this
confidence in the behaviour of others, collaboration is compromised, together with its associated
benefits in terms of peace, productivity and resilience to shocks (Halpern 2005; Putnam et al. 1993;
Krishna 2002). Wellbeing also suffers in a low trust relational environment (Bartolini and Sarracino
2014). Trust is based partly on confidence in the institutions that constrain a person’s behaviour
(Dasgupta 2009) but will also depend on how people choose to act outside of enforceable contracts
(Svendsen 2014; Bowles 2008; and Frey and OberholzerGee 1997).
It is expected that giving and trust will usually react to the same drivers (the nature of the social
environment, proxied in trust, drives giving also). However, trust may not be a necessary condition

5
for giving. The parallel examination of data allows us to observe if it is possible for people to be
inspired to give independently of a cohesive (trusting) social environment. The case that people may
sometimes give in spite of not trusting is to say that prosocial behaviours like giving do not depend
exclusively on generalised trust and cooperation. This would imply that prosocial behaviours are not
only driven by the circumstances of the wider social environment, but instead, that social environment
may be improved by the presence of givers who may not necessarily trust others but give nonetheless.
Their trustworthy, prosocial behaviour, tangibly expressed in the way they allocate their resources,
may play a part in expanding trust and a more collaborative response from others over time. Such a
finding would help to explain the role of the civic sector in changing the balance of social cohesion.
2. Analysis and results
2.1. Method
The Citizenship Survey data ran from 2001 to 2010-2011 and covers the issues of community
cohesion, civic engagement, volunteering, race and faith. It is a nationally representative (two-stage
stratified) survey of England and Wales, whose outputs have been certified by the UK Statistics
Authority as compliant with the Code of Practice for Official Statistics. This paper uses the data
collected over four consecutive years from 2008 to 2011, which comprises over 38,000 separate face-
to-face interviews. Respondents were aged 16 years and over and lived in private households.
Descriptions of all individual and community demographics that were used from the survey are
available in the appendix. The data was treated as a cross-sectional survey, pooling across the years
and inserting year dummies to account for general economic effects, and regressions were run to
determine which variables were associated with trust and with different forms of giving behaviour.
It is generally accepted that certain groups of people are pre-disposed to certain behaviour forms,
which is why regression analysis usually controls for age, race, gender and so on. Here therefore we
control for every available demographic revealed in the survey that might predispose people to giving
and to trust. Giving and trust are treated as endogenous variables; they are factors responsive to
circumstances which are exogenous at least in the short term. Variables like gender, race and age are
strictly exogenous; the status influences the giving and trusting, giving and trusting cannot change the
status. Thus causality is clear. Variables like location, marital status, income, and house tenure are
slightly more ambiguous. In the long term and in aggregate, being in giving and trusting networks
might make someone more likely to marry, or it might influence where they end up living, or it might
enlarge the scope for collaborative activity and increased incomes. However, in the short term, people
will base their decisions on what they give or how much they trust on their present circumstances.
Fluctuations in giving or trusting do not cause these circumstances to fluctuate from day to day. Thus

6
we have an indication of how certain observed circumstances or pre-dispositions influence short term
behaviour patterns in terms of giving and trust.
In this analysis, we set up five regressions using the same independent variables but having four
different types of giving and fifthly trust as the respective dependent variables. We examined how
every available structural exogenous variable included in the survey impacted giving and trust. There
were 45 of these variables, excluding value judgements and opinions (which are not structural drivers)
and excluding variables related to questions that were only asked to a proportion of the survey
population (which would have drastically reduced the number of observations).
Having stripped out all possible structural variables of influence on our five dependent variables, we
then examined the five sets of residuals arising from these equations. Residuals show how much more
or less giving or trust per individual actually takes place than would be predicted by the observed
independent variables that are controlled for in the regression itself. An unobserved driver of giving
will unify the pattern of these residuals, whereas if no such unifying factor exists, they will fall
randomly around the predicted values. The residuals could be examined for any further factor of
significance using principal component analysis. Principal component analysis converts the
potentially correlated residuals into a set of values of linearly uncorrelated variables called principal-
component factors. An unobserved propensity to give will be revealed as one statistically significant
factor which interacts positively with all forms of giving.
The methodology may be modelled as follows:
(1) 𝑦𝑖𝑗 = 𝑏𝑖0 + ∑ 𝑏𝑖𝑘𝑥𝑘𝑗 + 45
𝑘=1∑ 𝑐𝑖𝑙𝑧𝑙𝑗
5
𝑙=1
Where
i = 5 endogenous variables (volunteering, informal help, civic participation, giving to charity and
trust)
j = household representative/interviewee
k = 45 observed exogenous variables
l = 5 unobserved factors
Thus 𝑦𝑖𝑗 represents the dependent variable given the five models (four modelling different forms of
giving and one modelling trust) and given the household representatives interviewed; 𝑥𝑘𝑗 represents
the value of the kth
observable characteristic relating to the jth
household; and zlj represents the lth
unobservable characteristic relating to the jth
household. The coefficients b, c are fixed parameters
which represent the giving and trust impact of the individual characteristics, both observed and
unobserved.
𝑏𝑖0 represents the constant;

7
∑ 𝑏𝑖𝑘𝑥𝑘𝑗 45
𝑘=1represents the influence of the observed independent variables, given the model and the
interviewee, the same interviewee demographics being used in each model; and
∑ 𝑐𝑖𝑙𝑧𝑙𝑗
5
𝑙=1 represents the influence of unobserved independent variables. There are five sets of
residuals from the five regression models, and for this reason principal component analysis computes
five factors representing unobserved influences on various forms of giving and on trust. Under
principal component analysis, the five unobserved factors influencing the fall of these residuals are
linearly uncorrelated (see 4b); they vary independently of one another. The implication then is that
they are different from one another; they are differing unobserved variables with differing impacts on
giving and trust behaviour.
Now let these residuals be notated as:
(2) 𝑢𝑖𝑗 = ∑ 𝑐𝑖𝑙𝑧𝑙𝑗
5
𝑙=1
The model is now be expressed as:
(3) 𝑦𝑖𝑗 = 𝑏𝑖0 + ∑ 𝑏𝑖𝑘𝑥𝑘𝑗 + 𝑢𝑖𝑗
45
𝑘=1
The following two assumptions apply:
(4a) 𝐸(𝑧𝑙𝑗) = 0
(4b) 𝐸(𝑧𝑙𝑗𝑧𝑚𝑗) = 0 𝑖𝑓 𝑙 ≠ 𝑚
= 𝜎𝑙2 𝑖𝑓 𝑙 = 𝑚
(If l represents one of five factors, then m refers to any of those five factors that l is not currently
representing)
Given equations (1) to (4), (5) is a measure of co-variation between the residuals of the five models
(that is, the expected eigenvalues):
(5) 𝐸(𝑢𝑙𝑗𝑢𝑚𝑗) = ∑ 𝑐𝑙𝑖𝑐𝑘𝑖𝑗𝜎𝑖
5
𝑖=1
2
(𝑐𝑙𝑖𝑐𝑘𝑖) represents the five weights attached to the five factors that make up the unobserved variance
in giving and trust (𝜎𝑖2)
A factor that is statistically significant and that affects every type of giving represents an unobserved
‘propensity to give.’ The results of the analysis are to follow, starting with the influences that are
observable.

8
2.2. Analysis of observed exogenous variables
Table 1 shows that there are positive correlations between different forms of giving and between
giving and trust in neighbours. Each of these correlations is statistically significant. Trusting people
give more, and to an even greater extent, ‘giving people’ tend to give in multiple ways.
TABLE 1: Correlation between different forms of giving and between giving and trust
volunteer informal help
civic
participation
donations to
charity
neighbourhood
trust
volunteer 1
informal help 0.3028*** 1
civic participation 0.2478*** 0.1814*** 1
donations to charity 0.3001*** 0.2349*** 0.1934*** 1
neighbourhood trust 0.1399*** 0.0617*** 0.0887*** 0.1634*** 1 .
*** p<0.01, ** p<0.05, * p<0.1
The Citizenship Survey questionnaire defines formal volunteering as helping to run a group. 40% of
respondents had volunteered in the last 12 months. Informal help is unpaid help offered by an
individual, not through a group, to someone who is not a relative. 58.5% had offered informal help in
the last 12 months. Civic participation is engagement in activism and consultation, or else in
participation in governmental structures as a volunteer (e.g. local councillor, school governor, special
constable or magistrate). 37% affirmed civic participation in the last 12 months. Yearly time-frames
were chosen over monthly time-frames due to the more even distribution of responses between those
giving time and those not. Donations to charity comprised the total sum of money given to charity in
the last 4 weeks. 26% of respondents did not give to charity; 20% gave less than £5; 15% gave from
£5-£9; 17% gave from £10-£19; 15% gave from £20-£49; and 7% gave £50 or more. Note that most
of these giving indicators are not resource intensive, so wealth is not a limiting factor. Even with
respect to monetary giving, if the categories are changed such that any donation at all is compared to
no donation, the findings of this paper are not substantially altered. The trust question posed and the
responses were: ‘Would you say that many of the people in your neighbourhood can be trusted (51%);
some can be trusted (33%); a few can be trusted (14%); or none of the people in your neighbourhood
can be trusted? (2%).
Table 2 shows the results of five regressions, four of which have the different forms of giving as the
dependent variable, and the fifth with trust as the dependent variable. These reveal to what extent the
observable circumstances pre-dispose people to giving and trust. Put alongside each other, they also
reveal to what extent the different forms of giving are driven in unison, and to what extent giving and
the givers’ trust levels work in unison.

9
TABLE 2: Regressions showing the interactions between circumstantial variables and giving/trust
4 giving variables
volunteered in
last 12 months
(0,1) logit
y1
informal help
given, last 12
months
(0,1) logit
y2
civic
participation,
last 12
months
(0,1) logit
y3
total given to
charity, last 4
weeks (6
categories)
OLS
y4
trust in
neighbours (4
categories of
increasing
trust) OLS
y5
x1 House owned outright 0.1077* 0.0184 0.1401*** 0.1733*** 0.1580***
(0:no; 1:yes) [0.059] [0.044] [0.044] [0.029] [0.014]
x2 House owned with mortgage 0.0641 -0.0165 0.0455 0.0381 0.1613*** (0:no; 1:yes) [0.049] [0.038] [0.038] [0.025] [0.012]
x3 Time lived in community 0.0909*** 0.0820*** 0.0902*** 0.0210* 0.0136**
(1: <1 year to 4: >6 years) [0.021] [0.016] [0.017] [0.011] [0.006]
x4 Household size (shop/cook share) 0.1608*** 0.0435*** 0.0004 0.0107 0.0065
(1:live alone to 5:5+ sharing) [0.019] [0.014] [0.014] [0.010] [0.005]
x5 Cohabiting -0.4346*** -0.1261** 0.1163** -0.0870** -0.0453**
(0:no; 1:yes) [0.077] [0.059] [0.059] [0.040] [0.020]
x6 Married -0.1578** -0.1378*** 0.1206*** 0.0135 -0.009
(0:no; 1:yes) [0.062] [0.047] [0.046] [0.031] [0.015]
x7 Family care outside household 0.1877*** 0.2661*** 0.1499*** 0.1678*** -0.0552***
(0:no; 1:yes) [0.052] [0.041] [0.039] [0.026] [0.013] x8 Takes part in a formal group 8.2573*** 0.8365*** 0.6883*** 0.5005*** 0.1000***
(0: no group; 1:in a group) [0.448] [0.029] [0.030] [0.020] [0.010]
x9 Mix ethnic and religious circles 0.4099*** 0.3931*** 0.2511*** 0.2807*** 0.0089
(0:no; 1:yes) [0.040] [0.030] [0.030] [0.020] [0.010]
x10 Age 25-34 -0.0626 0.0412 0.2974*** 0.0860** 0.0805***
(0:no; 1:yes) [0.073] [0.056] [0.060] [0.037] [0.019]
x11 Age 35-44 0.2453*** 0.1446*** 0.5785*** 0.2084*** 0.1402***
(0:no; 1:yes) [0.074] [0.056] [0.059] [0.037] [0.019]
x12 Age 45-54 0.2036*** -0.0452 0.6193*** 0.2182*** 0.2070***
(0:no; 1:yes) [0.079] [0.059] [0.062] [0.040] [0.020]
x13 Age 55-64 0.2517*** -0.0261 0.6421*** 0.3230*** 0.3351***
(0:no; 1:yes) [0.086] [0.065] [0.068] [0.043] [0.021] x14 Age 65-70 0.3723*** 0.1148 0.7538*** 0.4699*** 0.4094***
(0:no; 1:yes) [0.106] [0.079] [0.081] [0.053] [0.026]
x15 Gender 0.1517*** 0.1982*** 0.0865*** 0.2719*** -0.0559***
(1:male; 2:female) [0.039] [0.030] [0.030] [0.020] [0.010]
x16 White 0.2481*** 0.2806*** 0.5397*** 0.1523*** 0.1245***
(0:no; 1:yes) [0.073] [0.056] [0.058] [0.037] [0.019]
x17 Personal income (0:no income) -0.0024 -0.0007 0.0206*** 0.0846*** 0.0053***
(categories, 1:low to 14: high) [0.007] [0.006] [0.005] [0.004] [0.002]
x18 Partners income (0:no partner) 0.0268*** 0.0056 0.0045 0.0347*** 0.0092***
(0:no income; 1:low to 14: high) [0.007] [0.006] [0.005] [0.004] [0.002]
x19 Qualifications 0.4436*** 0.3102*** 0.4011*** 0.2936*** 0.0988*** 1 (no formal qual.) to 3 (degree+) [0.032] [0.024] [0.024] [0.016] [0.008]
x20 Unemployed 0.2560** 0.1965** -0.0343 -0.2256*** -0.0635**
(0:no; 1:yes) [0.110] [0.078] [0.081] [0.052] [0.026]
x21 Employed -0.0604 0.1117*** -0.1115*** 0.0582** 0.0131
(0:no; 1:yes) [0.050] [0.037] [0.038] [0.025] [0.012]
x22 Health limits activity -0.0086 0.0690* 0.2736*** 0.0065 -0.0566***
(0:no; 1:yes) [0.051] [0.039] [0.038] [0.026] [0.013]
x23 Income deprivation in ward 0.0167 0.0159 0.0088 0.0134 -0.0422***
1:least deprived; 10:most deprived [0.019] [0.015] [0.014] [0.010] [0.005]
x24 Employment deprivation in ward 0.0289 0.0067 0.0017 -0.0141 0.0195***
1:least deprived; 10:most deprived [0.022] [0.017] [0.017] [0.011] [0.006]
x25 Health deprivation in ward -0.0437** -0.019 0.0017 -0.0005 -0.0090* 1:least deprived; 10:most deprived [0.020] [0.015] [0.015] [0.010] [0.005]
x26 Education and skills in ward -0.0275** -0.0258*** -0.0249*** -0.0296*** -0.0315***
1:least deprived; 10:most deprived [0.013] [0.010] [0.010] [0.007] [0.003]

10
x27 Barriers to housing and services 0.0158** 0.0133** 0.0102* -0.0043 0.0044**
1:least deprived; 10:most deprived [0.008] [0.006] [0.006] [0.004] [0.002]
x28 Crime in ward -0.0314*** -0.0051 -0.0128* -0.0061 -0.0287***
1:least deprived; 10:most deprived [0.010] [0.008] [0.008] [0.005] [0.003]
x29 Living environment of ward 0.0227** 0.0066 0.0258*** 0.0139*** 0.003
1:least deprived; 10:most deprived [0.009] [0.007] [0.007] [0.005] [0.002] x30 Practicing Christian 0.4541*** 0.2437*** 0.0367 0.5873*** 0.0189
(0:no; 1:yes) [0.057] [0.044] [0.043] [0.029] [0.014]
x31 Non-practicing Christian -0.0467 -0.0446 -0.1556*** -0.006 0.0014
(0:no; 1:yes) [0.047] [0.036] [0.036] [0.024] [0.012]
x32 Practicing other religion 0.2402** 0.0305 0.1565** 0.4300*** -0.0141
(0:no; 1:yes) [0.099] [0.075] [0.076] [0.050] [0.025]
x33 Non-practicing other religion -0.1388 0.1989** 0.1015 0.1361** -0.0542*
(0:no; 1:yes) [0.119] [0.090] [0.090] [0.060] [0.029]
x34 Region of England: North East 0.0352 0.1287* -0.2029*** 0.0756 0.0567**
(0:no; 1:yes) [0.098] [0.075] [0.077] [0.050] [0.025]
x35 North West -0.0296 -0.0915 -0.1542*** -0.0094 0.0736***
(0:no; 1:yes) [0.076] [0.058] [0.058] [0.039] [0.019] x36 Yorkshire and the Humber 0.2410*** -0.011 -0.0643 0.0434 0.0800***
(0:no; 1:yes) [0.082] [0.061] [0.061] [0.041] [0.020]
x37 East Midlands 0.2687*** 0.0391 -0.0226 -0.1106*** 0.0474**
(0:no; 1:yes) [0.085] [0.064] [0.063] [0.043] [0.021]
x38 East 0.1072 0.1428** -0.0154 -0.0113 0.0593***
(0:no; 1:yes) [0.080] [0.063] [0.061] [0.042] [0.020]
x39 London -0.2151** -0.2490*** -0.1457** -0.1343*** -0.1132***
(0:no; 1:yes) [0.084] [0.064] [0.064] [0.043] [0.021]
x40 South East 0.1560** 0.2239*** 0.0953* 0.002 0.0195
(0:no; 1:yes) [0.074] [0.059] [0.057] [0.039] [0.019]
x41 South West 0.2603*** 0.2028*** 0.0455 -0.012 0.1152*** (0:no; 1:yes) [0.081] [0.063] [0.062] [0.042] [0.021]
x42 Wales 0.2894*** 0.0978 0.1291* 0.0649 0.0667***
(0:no; 1:yes) [0.104] [0.076] [0.075] [0.051] [0.025]
x43 Year 2009 0.0171 -0.0751* 0.0003 -0.0143 0.0592***
(0:no; 1:yes) [0.050] [0.040] [0.038] [0.026] [0.013]
x44 Year 2010 0.0425 -0.3942*** -0.1710*** -0.0612** 0.0512***
(0:no; 1:yes) [0.051] [0.040] [0.039] [0.026] [0.013]
x45 Year 2011 -0.0019 -0.3479*** -0.1485*** -0.1094*** -0.1590***
(0:no; 1:yes) [0.059] [0.046] [0.045] [0.030] [0.015]
Observations (n) 25,890 25,890 25,890 25,485 25,073
R-squared
0.207 0.215
F (45, n-46)
147.38 151.98 Prob>F
0.000 0.000
LR chi2(40) 16621.36 2679.06 2511.22
Prob>chi2 0.000 0.000 0.000
Pseudo R-squared 0.4683 0.0782 0.0726
Log likelihood -9436.8834 -15797.638 -16032.013
Table notes:
Standard errors in brackets *** p<0.01, ** p<0.05, * p<0.1
The total data pool comprised 38,283 observations, but data was lost due to the inclusion of so many
independent variables with odd missing responses. The single largest loss of data was incurred by including
the ‘qualifications’ variable, which cut out all respondents over the age of 70 (17% of the sample). Education
has such an important interaction with giving that the variable was included anyway.
Volunteering, informal help and civic participation were yes/no responses so were analysed using a logit
regression model that constrained the outcomes between 0 and 1. Giving to charity had six categories of
response, which lends itself to an ordinary least squares regression. Trust had four categories of response and
was also analysed using ordinary least squares – not the ideal statistical model for only four outcomes, but still
the most informative indicator of relative statistical and economic significance.
House tenure dummies compare to renting or other forms of tenure;

11
In keeping with the correlations of Table 1, we may observe that independent variables relating to
various forms of giving are much more closely associated with each other than with trust. However,
the majority of variables influenced giving and trust in the same direction.
Most of the coefficients of the independent variables have the same sign for all forms of giving (they
influence giving in the same way), but a few of them suggest a substitution between time and money
giving. For example, people in larger households seem to be particularly strong on volunteering but
not on money giving. Spending time with children may be restrictive in terms of formal employment
(and therefore income) but it offers time and opportunity for group engagement. Likewise, people
with high personal incomes tend to give significantly more money than those with low incomes, yet
their volunteering is not affected. Those whose partners have high incomes on the other hand both
give more money and volunteer significantly more; if they do not have to work there are few
restrictions in either direction. Unemployed people were likely to volunteer more time than the
employed, but gave significantly less money that those whose financial pressures were not so intense.
Despite this evidence of a time-money trade-off, Table 1 revealed that time and money giving are
closely and positively correlated overall. It would appear that the ‘giving person’ effect is of greatest
importance, although ‘resource substitution’ may take place at the margin. This link between time and
money giving, even though substitution may take place at the margin concurs with data by Andreoni
et al. (1996) and Bauer et al. (2012).
Variables that had the strongest positive influence on most forms of giving were (1) increasing age;
(2) increasing qualifications; (3) group participation; (4) practicing a religion (particularly
Christianity); (5) mixing across ethnic and religious circles and, to a slightly lesser extent, (6) being
white. ‘Age’ and, ‘being white’ influenced trust positively as well, as did, to a lesser extent, ‘group
participation’ and ‘qualifications’. Trust also responded strongly to location and to house ownership,
reflective of the trustworthiness of the community one is part of.
Religion dummies compare to no religion;
Employment status dummies compare to those outside of the job market;
Married or cohabiting dummies compare to no partner;
Age dummies compare to age 16-24 (the youngest age);
Regional dummies compare to the West Midlands (the most central point of England and Wales);
Year dummies compare to 2008, the year the survey started.
No personality variables are available in this survey.
Ward deprivation data for each respondent had been taken from government records and imputed to each
individual’s dataset. Average ward size was 6,600 persons (Office of National Statistics 2013)
Note that ‘takes part in a formal group’ has a disproportionately large effect on volunteering compared to its
impact on other forms of giving. This is because volunteering is defined in this survey as helping out in the
running of a formal group one takes part in. Thus those who do not taking part in a formal group are
automatically excluded from volunteering, and the interaction between these two variables is extreme. This
factor could also be responsible for the unusually large value of the Pseudo R2 in the volunteering regression.

12
Age, race and gender are important factors that are not self-determined. However, their association
with giving and trust is not derived from an inherent ability to give more or to trust more. The giving
and trusting are rather to do with the way the demographic status interacts with resources and inter-
personal connections. For example, older people do not give more just because they have passed their
next birthday. Rather their age represents their progression through life; their resource and social
network accumulation and the shedding of the constraints and expenditures of young family life (see
also Bauer et al. 2012; Mayo and Tinsley 2009). Likewise ethnic minorities give less in every way
and also trust less, but not because of their colour. Rather, being ‘different’ sets social boundaries, and
here there is evidence of poor integration in giving and trusting networks. In terms of gender, women
are more giving and less trusting than men. Here it can be seen that the giving is not driven by the
woman’s trust in other people who make up her relational environment; there are other interpersonal
drivers at work. We do not here attempt to determine whether women are inherently more prosocial
than men (see for example Madson 1997) or whether it is the caring roles they often assume that
influences them, but what we can clearly see is that prosocial drivers characteristic to women are
reflected in giving behaviours. The survey year is also out of individual control. We see that
volunteering has held up over the years, whilst informal volunteering, civic participation and
donations to charity have reduced over time. Trust rose from 2008 (the year of the financial crash)
then began to fall again. Again, the changing dates are not what causes these differences; the giving
and trust are rather responding to changes in the way people are interacting with one another over
time.
Compatible with the understanding that giving (and trust) reflects the quality of interaction within the
civic sector, we find that its adjustable drivers are (1) connections between people; (2) resource
availability and distribution; and (3) prosocial attitudes. Table 3 describes each of the adjustable
variables in terms of their influence on giving and on trust, and also in terms of how these variables
may be linked to the socio-economic environment and to prosocial motivations.

13
TABLE 3: Description of variables
Variable and the significance of its
interaction with giving and trust
Link to the socio-economic environment and to prosocial
motivations
Education: Closely associated with trust
and with all forms of giving.
Education is a form of giving in itself. It is a transfer of
information from those who have more knowledge to those who
have less, and is often provided at less than full cost to the
beneficiary. The prosocial stimuli this affords to the beneficiary
can be further enhanced by the networking opportunities it
provides and by the way education is carried out. Algan et al.
(2013) find that stimulating cooperation in the classroom (e.g.
through group work) is found to enhance prosocial attitudes.
(1) Take part in a formal group: Closely
associated with all forms of giving and
with trust.
Both these variables represent a giving of time into an inter-
personal activity. This in itself may be considered a form of
giving, so it is not surprising that people who do these things also
score significantly higher in the other forms of giving. (2) Family care outside of the household:
Closely associated with all forms of giving
but not with trust - it does not appear to be
trust that drives this form of giving.
Religious and ethnic mixing (informal
conversations with people of different
social backgrounds in homes, clubs and
eating places; all places where choice over
who one converses with may be
exercised). Strongly associated with all
forms of giving, but not with trust. Being
different is a social barrier, and it is not
trust that motivates interaction across
these boundaries; there appear to be more
intrinsic motivations involved.
Resources running through connections across social boundaries
counteract the exclusion of vulnerable and less powerful groups,
reducing the polarization of communities. Majority status
individuals who cross religious and ethnic boundaries do not
necessarily have any advantage, whilst minority social groups do
have an advantage (see Zischka 2014, looking at the correlation
between mixing and crime, deprivation and trust). Mixing is not
simply a strategic way of obtaining some self-centred objective
then. This and the link with giving (mixers are givers) suggests
that there are prosocial attitudes and values involved.
Home owners tend to be more trusting
than tenants, but not necessarily more
giving – only those who own their house
outright tend to give more (particularly
money).
Home owners choose the community they invest a lot of money
into with care for its trustworthy status. By implication of their
ownership status, they had the means to buy themselves into this
preferred social environment, irrespective of their personal social
inputs into it. Higher levels of giving amongst those without a
mortgage may reflect their lighter financial obligations, releasing
them to engage in charitable pursuits (The Center on Philanthropy
at Indiana University in the USA 2007; Bauer et al. 2012 and
Mayo and Tinsley 2009).
Length of stay in a community:
Associated with giving, and also with trust
but only at a 90% confidence interval.
Staying a long time in a community gives relationships chance to
mature; social cohesion is built with implications for reciprocal
giving and for trust.
Partner: Associated with increased levels
of civic participation, and reduced levels
volunteering and informal help.
Cohabiting partners were less likely to
‘give’ than married couples, also in terms
of charitable donations. Their trust is also
less.
Involvement with a partner in itself implies an investment of time
and money into another person, and there appears to be an
element of trade-off between involvement with a partner and
involvement with people outside of that partnership. These effects
are offset however by increased levels of civic participation. Also
increased levels of giving connected with the ‘partners’ income’
variable and with the bigger household variables.

14
Area deprivation levels are taken from
the components of the multiple
deprivation indices corresponding to the
ward of the respondent. If the regression is
rerun with the separate components of the
multiple deprivation index put together
into the single, weighted deprivation
index, we find that deprivation has a
significant negative association with trust
and giving (volunteering and informal
help with a 95% confidence interval;
charitable donations and trust with a 99%
confidence interval).
The local socio-economic environment clearly influences the trust
its inhabitants feel towards others, and also their inclination to
give. Of all the individual areas of deprivation, education and
skills deprivation had most significant negative impact on giving
and trust, and crime came second. Barriers to housing and services
actually have a small positive influence – perhaps reflective of
rich (expensive) areas or rural (isolated) areas; wealth and less
urbanization both being associated with more community
building activities (see for example how London, the most highly
urbanized region, is found to have less givers (and less trust) than
other regions, even though urbanization has advantages associated
with job availability. In contrast, the rich South East and the rural
South West of England tend to have more givers).
Religion: People who practice a religion
give significantly more than those who do
not practice a religion or who have no
religion. Practicing Christians are
particularly large givers, except in the area
of civic participation. The giving
behaviour associated with religion is not
driven by trust – trust and religion have no
significant correlation.
English and Ray 2011; Paik 2011; Smith 1994 all report how
religion is connected to giving. Giving is clearly not being driven
by trust; religious people give in spite of their perception of
others, not because of it. More likely the moral values of their
group are of influence (one of the bible’s key themes is love for
one’s neighbour, and most other religions have pro-giving values
too). The fact that non-practicing ‘other religions’ help each other
out so much may be reflective of their minority status and, for
survival, their need to support one another.
We find then that giving behaviours and trust levels are reflective of the wider socio-economic
environment. In terms of resource availability and distribution we see that people give more of what
they have (the substitution between time and money). Moreover, those who have received or
accumulated more are in a position to give more back (seen in ‘education,’ ‘age’ (stage of life),
‘income,’ ‘house ownership,’ and ‘location’). So resource availability matters, although resources by
themselves cannot stimulate giving in the absence of an appropriate inter-personal environment that
induces people to part with them: Zischka (2016a), Hoffman et al. (1996), Kosse et al. (2016)
Holloway et al. (1977) Aguiar et al. (2008) and Fershtman et al. (2009) all demonstrate in lab-
experiments the critical importance of the social environment in determining the way people allocate
their resources. Mayo and Tinsley (2009) and Breeze (2006) go far as to suggest that in the UK and
the US, the propensity to give reduces as incomes rise: civic participation is not an automatic response
to greater wealth. Social pressures and incentives do exist however, and we see their cohesive
influence reflected in higher giving levels amongst networked people (the variables ‘group
participation,’ ‘employment,’ ‘education’ and ‘mixing’). We also see how giving is related to
behaviour cues (cultural status, religion and community deprivation). People who engage in relational
activities with others tend to be the biggest givers (mixing across ethnic and religious lines, attending
groups and meetings, living/sharing with others, helping family outside the home, getting established
long term in a community, employment, even education).
In terms of the way in which giving and trust move together however, it is of note that a motivator to
give may sometimes be effective without that motivator inspiring the giver to trust people around

15
them; it is not always necessary to trust in order to give. This is a point to which we return in Section
3. First we look at the unobservable data that is found in the residuals of these regressions.
2.3. Analysis of residuals for unobserved influences on giving behaviour
The residuals of the five preceding regressions comprise all the influences on giving and trust that
cause the outcome to vary in ways not explained by the observable data. Thus any unobserved
motivation falls into the residuals. Table 4 shows the degree to which there is correlation between the
residuals of the various regressions, defined by their dependent variable.
TABLE 4: Correlation between the residuals of the various regressions
residuals of
volunteering
residuals of
informal
help
residuals of
civic
participation
residuals of
donations to
charity
residuals of
trust
residuals of volunteering 1
residuals of informal help 0.1216*** 1
residuals of civic participation 0.0871*** 0.1049*** 1
residuals of donations to charity 0.0905*** 0.1333*** 0.0901*** 1
residuals of trust 0.0230*** 0.0091 0.0137*** 0.0417** 1
*** p<0.01, ** p<0.05, * p<0.1
Just as with the correlations between the dependent variables themselves, it can be seen that there is
some common relationship between the unobserved drivers of giving; something is uniting the fall of
the residuals in a common direction. All of the correlations between the giving residuals are
statistically significant. The variations in giving also interact positively with variations in the giver ’s
trust, but with less of a close correlation, and without consistent statistical significance.
Table 5 shows the results of running STATA’s principal-component factor analysis on these residuals.
Since there are five sets of residuals, there are five principal factors. Only one of these is of statistical
significance, having an eigenvalue of 1.32. This suggests that there is one statistically significant
unobserved ‘propensity to give.’ All other kinds of correlation between the residuals are just noise.

16
TABLE 5: Principal component analysis on the giving residuals (with trust) Factor analysis/correlation Number of obs = 24685 Method: principal-component factors Retained factors = 1 Rotation: (unrotated) Number of params = 5
Factor Eigenvalue Difference Proportion Cumulative Factor1 1.3215 0.3220 0.2643 0.2643 Factor2 0.9995 0.0843 0.1999 0.4642 Factor3 0.9152 0.0062 0.1830 0.6472 Factor4 0.9091 0.0544 0.1818 0.8291 Factor5 0.8547 . 0.1719 1 LR test: independent vs. saturated: chi2(10) = 1546.48 Prob>chi2 = 0.0000
Notes on method: The principal component analysis was carried out using STATA, whose help manual
provides justification for the way in which it computes these results. The ‘principal-component factor’
method was used to analyse the correlation matrix. Under this method, the factor loadings are computed using estimates of communality which are assumed to be 1. The results are very similar however if the
principal-factor method is used (STATA’s default) in which factor loadings are computed using the
squared multiple correlations as estimates of communality. The principal factors are calculated from the
correlation matrix (scaled 0-1) rather than the covariance matrix (absolute values), since the covariance
matrix is meaningful only if the variables are expressed in the same units. Here we are comparing
residuals of logit models to residuals of OLS models, and our interest is in the relative position of these
residuals, not their actual values.
Table 6 shows that this factor applies positively to the residuals of all forms of giving, and to each to
roughly the same degree. It also interacts positively with the residuals of trust, although to a much
smaller degree. These findings suggest that there is indeed an unobserved ‘propensity to give’ of
general importance to giving behaviours, and that this propensity to give does not have a lot to do
with the giver’s trust levels. As a robustness check we even added ‘trust’ into the giving regressions as
an explanatory factor. Although trust matters as one part of the wider social environment, this
manipulation had a negligible impact on our analysis of residuals. Again, this implies that the
unobserved propensity to give was not related to trust; to the giver’s view of external systems and
behaviours.
TABLE 6: Factor loadings (pattern matrix) and unique variances
Variable Factor1 Uniqueness residuals formal volunteering 0.5506 0.6969 residuals informal volunteering 0.6226 0.6123 residuals civic participation 0.5212 0.7284 residuals give money 0.5790 0.6647 residuals trust neighbours 0.1542 0.9762
Although we do not know the nature of the unobserved variable (or correlated set of variables), we do
know that prosocial attitudes are not observed in this regression except through their expression in
prosocial behaviours like giving, and furthermore that attitudes can be expected to have a significant
impact on giving (Kolm and Ythier 2006; Bekkers and Wiepking 2007; Dessi and Monin 2012). It is

17
reasonable then to assume that the unobserved motivator of giving identified in the residuals is going
to have an attitudinal component.
As with all omitted variables, not only the sizes of the residuals are affected, but also the coefficients
of the regression itself would be altered if it were possible to include a variable for unobservable
prosocial attitudes. To some extent there is an unobserved component even to the observable
variables; prosocial attitudes were already manifest in observed behaviours such as mixing with other
ethnic groups or helping out family members. Some of the influence of prosocial attitudes on giving
was already accounted for then via these and other such variables, but clearly not all; a significant
unobserved individual propensity to give remained in the residuals. If it was any other missing
variable, we could simply add it into a new, enriched regression model and test for it, but prosocial
attitudes are unobservable except in prosocial behaviour forms like giving, or else in subjective self-
assessments which compromise the objectivity of our research. What the presence of this factor does
tell us though is that the unobserved ‘propensity to give’ of the individual comprises a distinct social
factor of importance, having its own significant influence on giving behaviours.
We also consider how ‘trust’ and ‘giving’ respond to various social influences in tandem. Although
both are affected by the social environment, ‘trust’ reflects an individual’s perception of the social
environment as produced by others whilst ‘giving’ is that individual’s own personal contribution into
the lives of others. The response is likely to be influenced by trust in recipients to make good use of
the gift. Indeed, conditional cooperation has often been observed in lab-experiments: Positive
experiences of interaction with others keeps people contributing to a public good, whilst negative
experiences damage trust and constrain the respondent’s subsequent contributions to public benefit
(Kolm and Ythier, 2006). However, individuals also retain a capacity to pursue an agenda different
from the status quo. Dessi and Monin (2012) study this phenomenon specifically in lab experiments,
and here we have identified evidence for it in survey data. The conditions under which trust in others
and giving to others are not mutually reinforcing one another potentially represent points at which the
balance of interpersonal cohesion in the civic sector may change, as will be discussed in the next
section.
3. Discussion
We know that the way individuals interact is highly complex and context specific, and this makes it
difficult to analyse whether those interactions are adding to or detracting from social cohesion. Here
we suggest that the resources that flow from these interactions may be easier to monitor. ‘Giving’ is
one such flow which is specific to the civic sector. It is a ‘prosocial’ behaviour form in that it has
involved consideration for others in one’s resource allocation decisions. Social pressures and

18
incentives have brought this behaviour about. Thus in monitoring giving behaviours, we may gain
insight into the prosocial quality of civic sector interactions. We find that multiple forms of giving,
both more and less formal, are all influenced by the same drivers in tandem, and this suggests that
easy-to-measure time and money transfers may also be representative of less tangible forms of
prosocial activity. Thus in studying the impact that various socio-economic drivers have on whether or
not individuals in a region are inclined to give, we can gain information about how these drivers are
impacting the prosocial qualities of the civic sector. Likewise in monitoring ‘who people give to,’ we
may gain information about the generalisation or exclusivity of prosocial networks.
‘Giving’ networks are of interest because of their association with trust. ‘Giving’ people are
expressing prosocial inclinations that, at least within those specific networks, could also make them
less likely to exploit or take advantage of others, and this means that those networks are more likely to
be characterized by trust (see introduction). The close association found in this data between giving
and trust is illustrated in Figs.1 and 2.
Fig.2: Group involvement and trust
Fig.3: Increasing levels of charitable giving and trust
0
0.2
0.4
0.6
0.8
1
Do not attend groups Attend groups, but do nothelp run them
Attend and help run agroup
Tru
st, m
inim
um
to
max
imu
m
0
0.2
0.4
0.6
0.8
1
No charitablegiving
gave 0-£4 inlast 4 weeks
gave £5-£9 inlast 4 weeks
gave £10-£19in last 4weeks
gave £20-£49in last 4weeks
gave over £50in last 4weeks
Tru
st, m
inim
um
to
max
imu
m

19
Regressions show that the illustrated associations between giving and the givers trust levels retain
their statistical significance even when every available demographic shown in Table 2 is controlled
for. Moreover it is of interest to consider how the proportion of people volunteering or giving to
charity in a region correlates to average trust levels within that region. This provides some insight into
how giving correlates to the trust of others, rather than just the correlation between giving and the
giver’s own trust levels. Table 7 shows that the average participation in giving behaviours specific to
the 10 government office regions of England and Wales was highly correlated to the average trust
levels of those regions (correlations of up to 0.88); giving predicted trust in each region more
accurately than almost any other indicator, including average incomes.
TABLE 7: Correlation between regional giving and regional trust
probability of volunteering by
government office region
probability of donating to charity
by government office region average trust levels by
government office region 0.73 0.88
This data is correlational however, not causal, so it does not tell us whether people give only when
they trust others to use the gift wisely (meaning that giving is a product of trust), or whether giving
actually helps to produce a more trusting social environment over time.
In the literature it is widely accepted that the social environment affects prosocial behaviours
(DeScioli and Krishna 2013; Aguiar et al. 2008; Hoffman et al. 1996; Kolm and Ythier 2006). Cross
country analysis would suggest that institutions which limit antisocial behaviours and corruption,
which facilitate wealth creation and which promote an equitable distribution of that wealth tend to be
the key driving forces behind trust (Sivesind et al 2013; Uslaner 2000) and it could be that giving is
side product of this trust without being a driving force in itself. Uslander (2000), whose work focusses
on state-sector action, is therefore sceptical as to the extent to which the civic sector helps to shape the
wider social environment rather than simply responding to it. However he does argue that expanding
trust (social cohesion) involves extending cooperative behaviours to people outside of one’s usual
trusted networks, and even he concedes that out-group giving behaviours could positively impact trust
by fulfilling these requirements.
Prosocial (giving) behaviours cue further giving responses from others (Kosse et al. 2016; Zischka
2016a), and so it could even be argued that prosocial (giving) behaviours are a prerequisite to trusting
relationships in which more giving can be fostered. Even within well-established state and market
sectors, trust and trust-based cooperation is still essential to their efficient functioning (Svendsen
2014; Kolm and Ythier 2006), and since rules cannot efficiently cover every eventuality, civic sector
behaviours and inclinations are going have some influence on the outcome. Moreover although the
existence of reliable and equitable institutions are certainly essential to trust and the maintenance of

20
prosocial behaviours, these institutional structures are themselves difficult to establish without the
cooperation of a prosocial civic sector as a precondition. Adhikari and Goldey (2010), Vajja and
White (2008), Krishna (2002) Grant (2001) and the World Bank (2000) suggest that opportunistic,
antisocial actions will destroy trust and break collaboration up before it has the chance to become
established. This again suggests that prosocial inclination is a prerequisite to effective collaboration,
not just a side-effect.
However, there are conceptual problems with claiming that trust can be altered by investment
variables (giving networks) which actually depend on trust. It is a similar dilemma to that expressed
over investments into social capital: social capital outcomes can hardly be altered by investment
variables that appear to consist of the same thing (Ostrom 1997; Quibria 2003). The insights offered
within this paper as to the drivers of giving may shed some light on this dilemma.
In keeping with the literature, we expected giving behaviours to flow from both observable structural
and unobservable cognitive social drivers. Our regressions revealed that structural factors such as
social ties and comparative socio-economic circumstances were indeed closely reflected in multiple
giving behaviours. The cognitive, attitudinal component cannot be directly observed and added to a
regression, important though it may be for determining whether relational ties tend towards being
mutually beneficial and supportive or else restrictive and extractive. In order to see if there was any
unobservable factor driving giving that would be compatible with the existence of an attitudinal
component, it was therefore necessary to examine our regression residuals. Observable influences on
multiple forms of giving were identified in regression analysis, the residuals were extracted, and then
any further (unobservable) factor of influence could be identified through principal component
analysis of the set of residuals. In applying this method, we indeed found evidence of an unobserved
factor of importance acting on giving, compatible with the existence of attitudinal drivers.
In terms of the way in which the drivers of giving also acted as drivers of trust, our data revealed that
in most cases the two ran together; factors that made people more trusting also made them more
giving. One example from our data was group attendance: when people came together in ways that
were mutually beneficial and supportive they became more trusting, whilst being connected and
involved also stimulated their giving. Another two examples were age and length of time lived in a
neighbourhood. Over time a person is able to forge relationships that they both count on (they trust)
and which are well maintained (they give). And for another example, having preferable personal
circumstances in terms of money, no mortgage or good education is evidence that these are people
experiencing a system that works for them. Not surprisingly then, those with such a rich set of assets
were found to express more trust than those without, especially as their assets empower them to be
more selective about their social circle. Their higher than average giving behaviours indicated that
they were also motivated to give something back into their favoured social environment.

21
In all these examples trust (based on the prosocial actions of others) and trustworthy behaviour
(reflected in the respondent’s own prosocial (giving) contribution) were both in evidence. This is not
incompatible with the literature suggesting that the social environment influences an individual’s
decision to give. However we also identified a factor of significance that was distinct from the social
environment, a factor that is consistent with the concept of prosocial attitudes. Whilst a person’s
attitudes and values are certainly influenced by her social environment (reflected in the giver’s trust),
those values may also rise above (or sink below) the stimuli coming from her social environment. We
saw this when we noted that a personal propensity to give, identified in the residuals, may be effective
even when the giver did not trust.
The possibility of disparity between the social environment and giving behaviours is also apparent in
the wider literature. As already mentioned, Dessi and Monin (2012) observe the capacity of
individuals to override external stimuli in a lab experiment, whilst in wider survey data it may be seen
that a privileged social environment does not automatically stimulate giving. For example Mayo and
Tinsley (2009) showed that 80% of contributions by the mega rich in the US came from 5% of the
households, and that the remaining 95% of those households gave proportionally less of their income
to charity than their lower income counterparts. Auten and Rudney (1990) and also Breeze (2006)
using UK data showed that the median propensity to give decreases as income rises. So then, a
favourable social environment, whilst retaining an important influence on giving, is not the only
determinant of such behaviours.
A willingness to give in spite of the social environment and not because of it is potentially a game-
changer, since it does not depend on pre-existent social conditions and yet it affects the social
environment experienced by others, contributing to a change in the status quo. Within our own
analysis, besides the propensity to give identified in the residuals, the influence of attitude could also
be perceived in variables such as religious practice; making friends across religious and ethnic
boundaries; or caring for family members. Women also gave more than men. None of the people to
whom these variables applied trusted others more than everyone else did, and yet they all gave more
than those to whom the variable did not apply, thereby expressing trustworthy behaviour patterns that
bode well for the social environment in general.
In showing that individuals are able to act independently of their environmental cues, this paper might
help to explain how it is possible for causality to run both ways between giving and trust; the social
environment impacts the individual’s decision to give, but that individual can also act for the good or
bad of others independently of that social environment. This personal choice alters the wider social
environment in some small way, and influences the choices that other people make too (Kosse et al.
2016; Kolm and Ythier 2006). Thus through a process of response and counter-response, the welfare
of the whole community may eventually change. Thus the civic sector not only responds to the wider

22
social environment, it also shapes it. We put forward an illustration of this hypothesis for further
consideration in Fig.3.
Fig.3 The interaction between giving and trust
Prosocial motivations could therefore be pivotal to how relationships develop over time. A complex
range of factors affect these motivations which make them hard to pin down. However the giving
which takes place because of these motivations is easier to measure. The measure uniquely reveals
how the civic sector (as opposed to the state or market sector) is contributing to community cohesion.
It is beyond the scope of this data to prove the dynamics of this interaction. Demonstrating how
giving impacts trust over time, just as trust impacts giving, is challenge is taken up in Zischka et al.
2016b, using longitudinal data. The contribution of this paper is rather the finding that significant
motivations exist which bring people to give even in the absence of trust, a finding which could help
to explain how it is possible for giving and trust to interact with one another. Even within this dataset
however, a statistically significant correlation could be observed within England between giving by
region and how the trust in each region developed over the four years of the survey (2008-11
inclusive) (Fig.4). High giving regions saw increases in trust over the period, whereas low giving
regions did not.
Social cohesion within the wider social
environment (reflected in trust)
The social environment is a highly complex and uneven
social network. Prosocial (trustworthy) institutions, actions and resource usage contribute to trust and bring people
together for mutual advantage. Antisocial systems and
actions detract from social cohesion.
Person ‘A’’s prosocial motivation
Influenced by the wider social
environment, but ‘A’ can also choose
to act for the good or bad of others
independently of that environment
Flow of prosocial actions from ‘A’
reflected in actual resource usage.
Giving is one measurable proxy for a wider range of trustworthy behaviours
which influence the trust and eventual
prosocial responses of others.
Person ‘A’’s trust: subset of wider trust,
and dependent on the
treatment experienced
from others

23
Fig.4: The correlation between giving behaviours and changing trust levels
Key: NE: North East; NW: North West; YH: Yorkshire and the Humber; EM: East Midlands; WM:
West Midlands; E: East of England; London; SE: South East; SW: South West; Wales
(Wales is an outlier in this data. Wales is under a different administrative regime, and something other
than civic sector giving clearly caused a fall in trust over the period that hit Wales more than it did the
various regions of England.)
So then, although trust based on social context will certainly impact one’s motivations to give,
individuals also retain some choice over their giving which may impact the social environment. The
role of civic sector prosociality, reflected in giving behaviours, should not be prematurely dismissed.
4. Conclusion
In examining the drivers of giving, we find that unobservable prosocial motivators and also some of
the observable factors (particularly those with a strong value-based motivational component) override
the trust condition, driving giving even where the trust of the giver is low. In this we see the power of
the individual to act independently of her social environment. We suggest that this capacity enables
individuals to be agents of change in terms of the levels of trust and cooperation, since their prosocial
or antisocial decisions and their support (or not) for institutions of public interest impact their social
environment in some small way, whether positively or negatively.
If prosocial behaviours are not simply a product of the social environment, but also have some
influence on the ongoing quality of that environment, then pro-sociality within the civic sector is a
variable worthy of further consideration. We know that because of the complexity surrounding human
interaction, the quality of specific aspects of that interaction is hard to evaluate. However giving
NE
NW
YH
EM
WM
East
London
SE
SW
Wales
-0.1
-0.05
0
0.05
0.1
0.15
0.5 0.52 0.54 0.56 0.58 0.6 0.62 0.64
Ch
ange
in t
rust
(20
07/8
to
201
0/11
)
Giving behaviours (average for region of % giving to charity and % volunteering)

24
behaviours, a flow to and from that relational stock, may provide us with a way of quantifying the
prosocial nature of civic sector interactions. In monitoring giving levels (the proportion of persons
making voluntary time and money transfers) decision makers will have a basis on which to determine
which interventions help and which hinder civic sector contributions to trust (social cohesion) and its
associated quality of life. Moreover focussing attention on giving and affirming its value may in itself
put people in mind of what they could do for others and for the benefit of their community as a whole
(nudge theory: Thaler and Sunstein 2008). In this sense, relating giving behaviours to the prosocial
qualities of civic sector relationships is both informative and prescriptive.
Acknowledgements: This paper would not have been written without the suggestion of Mark Casson regarding
the analysis of residuals through principal component analysis. The algebraic model is also his. Thanks are also
extended to Steve Musson, Uma Kambhampati, Nick Bardsley, Sarah Jewell, various conference delegates and
anonymous reviewers for their comments on how giving flows reveal information about civic sector
relationships. For the Citizenship Survey (2008-2011), thanks are due to Ipsos MORI in partnership with TNS-
BMRB, commissioned by the Department for Communities and Local Government (DCLG) and supplied by the
UK Data Archive.

25
Appendix: Description of variables
Note that many of the variables had to be recoded so as to accommodate slight differences between
the years, or else re-constructed for ease of interpretation.
APPENDIX TABLE i: Dependent variables Variable survey
code
Values (original or derived from
the code(s) shown)
Response
distribution
(%)
Notes
Trust people in
neighbourhood
strust 1= none of the people in your
neighbourhood can be trusted
2= a few can be trusted
3= some can be trusted
4= many of the people in your
neighbourhood can be trusted
1.99
13.54
33.10
51.37
37,083 obs.
Original variable
inversely coded
Formal volunteering in
the last 12 months
(unpaid help towards the
functioning of a group)
zforvol 0=no
1=yes
60.01
39.99
38,283 obs.
Informal help in the last
12 months (help offered
individual to individual
outside of family)
zinfvol 0=no
1=yes
41.53
58.47
38,283 obs.
Civic participation in the
last 12 months
zcivpar 0=no
1=yes
63.18
36.82
38,283 obs.
Total amount of money
given to charity in the
last 4 weeks
givamt
givamtgp
0=do not give
1=<£5
2=£5-£9.99
3=£10-£19.99
4=£20-£49.99
5=£50+
26.29
20.28
14.84
16.63
15.05
6.90
37,313 obs.
Gave to charity in the last
4 weeks
ggroup1 to
ggroup12
givech
0=did not give to charity
1=gave to charity
25.58
74.42
38,254 obs.
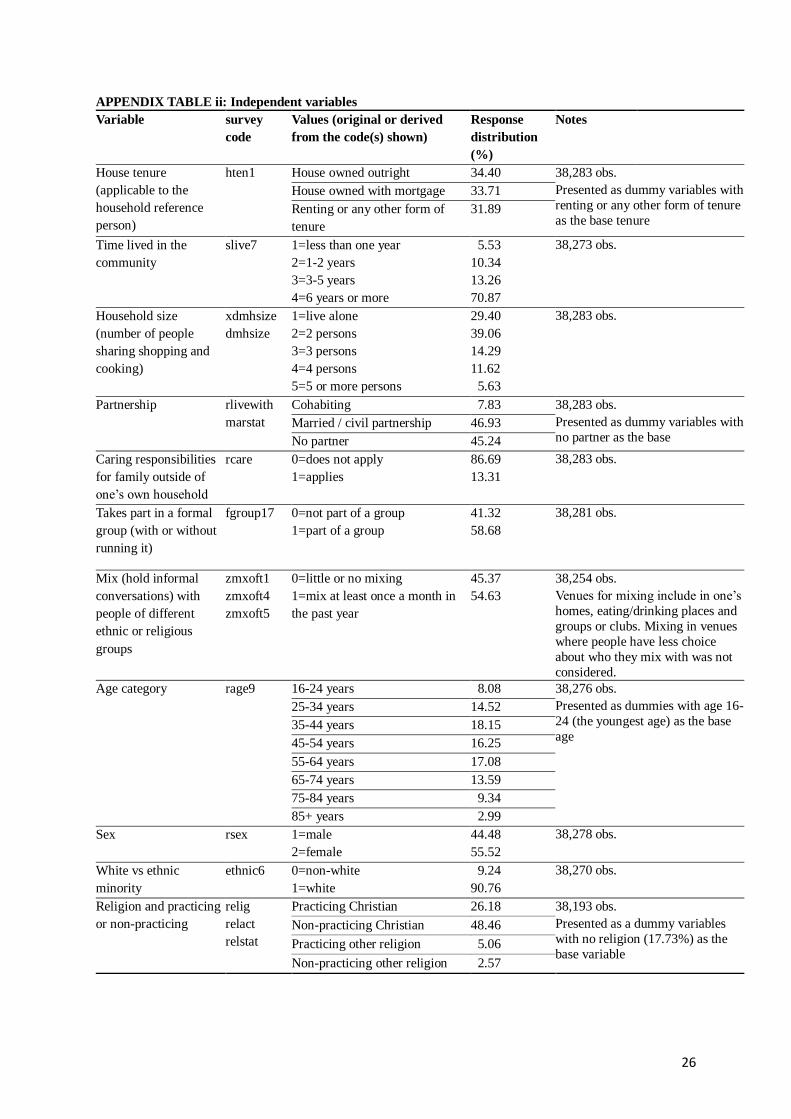
26
APPENDIX TABLE ii: Independent variables Variable survey
code
Values (original or derived
from the code(s) shown)
Response
distribution
(%)
Notes
House tenure
(applicable to the
household reference
person)
hten1 House owned outright 34.40 38,283 obs.
Presented as dummy variables with
renting or any other form of tenure
as the base tenure
House owned with mortgage 33.71 Renting or any other form of
tenure
31.89
Time lived in the
community
slive7 1=less than one year
2=1-2 years
3=3-5 years
4=6 years or more
5.53
10.34
13.26
70.87
38,273 obs.
Household size
(number of people
sharing shopping and
cooking)
xdmhsize
dmhsize
1=live alone
2=2 persons
3=3 persons
4=4 persons
5=5 or more persons
29.40
39.06
14.29
11.62
5.63
38,283 obs.
Partnership rlivewith
marstat
Cohabiting 7.83 38,283 obs.
Presented as dummy variables with
no partner as the base Married / civil partnership 46.93 No partner 45.24
Caring responsibilities
for family outside of
one’s own household
rcare 0=does not apply
1=applies
86.69
13.31
38,283 obs.
Takes part in a formal
group (with or without
running it)
fgroup17 0=not part of a group
1=part of a group
41.32
58.68
38,281 obs.
Mix (hold informal
conversations) with
people of different
ethnic or religious
groups
zmxoft1
zmxoft4
zmxoft5
0=little or no mixing
1=mix at least once a month in
the past year
45.37
54.63
38,254 obs.
Venues for mixing include in one’s
homes, eating/drinking places and
groups or clubs. Mixing in venues
where people have less choice
about who they mix with was not
considered. Age category rage9 16-24 years 8.08 38,276 obs.
Presented as dummies with age 16-
24 (the youngest age) as the base
age
25-34 years 14.52 35-44 years 18.15 45-54 years 16.25
55-64 years 17.08 65-74 years 13.59 75-84 years 9.34 85+ years 2.99
Sex rsex 1=male
2=female
44.48
55.52
38,278 obs.
White vs ethnic
minority
ethnic6 0=non-white
1=white
9.24
90.76
38,270 obs.
Religion and practicing
or non-practicing
relig
relact
relstat
Practicing Christian 26.18 38,193 obs.
Presented as a dummy variables
with no religion (17.73%) as the
base variable
Non-practicing Christian 48.46
Practicing other religion 5.06
Non-practicing other religion 2.57
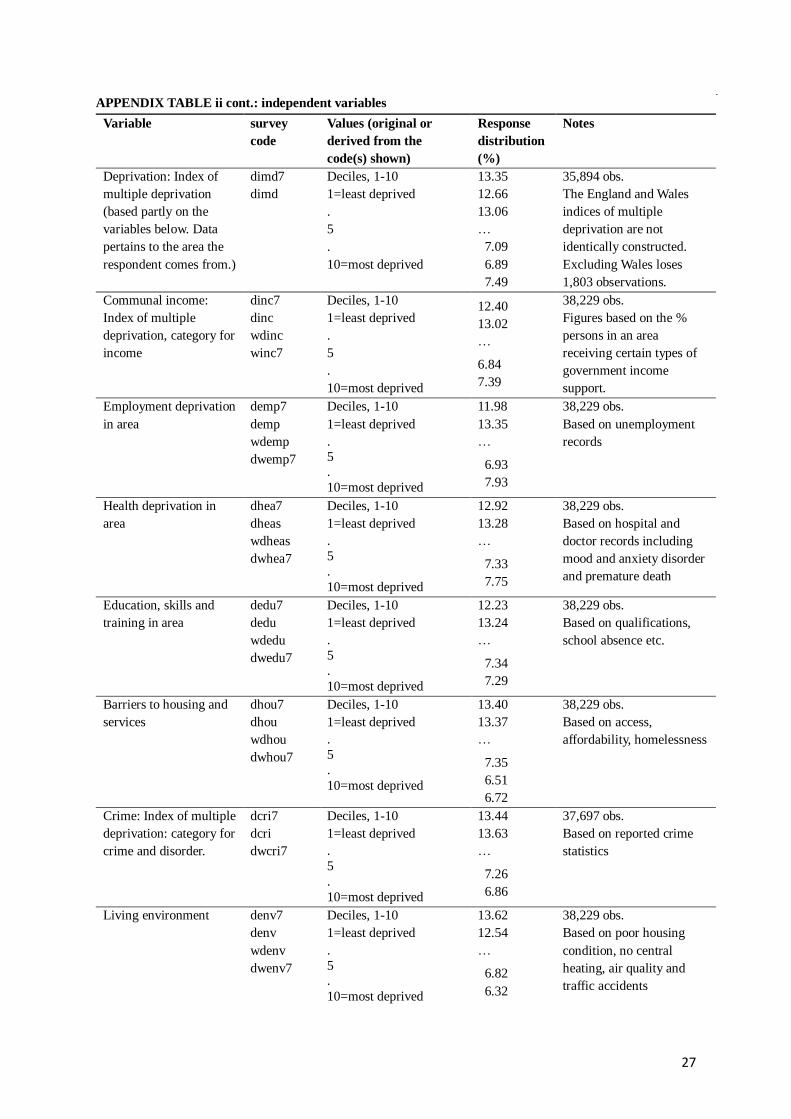
27
APPENDIX TABLE ii cont.: independent variables
Variable survey
code
Values (original or
derived from the
code(s) shown)
Response
distribution
(%)
Notes
Deprivation: Index of
multiple deprivation
(based partly on the
variables below. Data
pertains to the area the
respondent comes from.)
dimd7
dimd
Deciles, 1-10
1=least deprived
.
5
.
10=most deprived
13.35
12.66
13.06
…
7.09
6.89
7.49
35,894 obs.
The England and Wales
indices of multiple
deprivation are not
identically constructed.
Excluding Wales loses
1,803 observations.
Communal income:
Index of multiple
deprivation, category for
income
dinc7
dinc
wdinc
winc7
Deciles, 1-10
1=least deprived
.
5
.
10=most deprived
12.40
13.02
…
6.84
7.39
38,229 obs.
Figures based on the %
persons in an area
receiving certain types of
government income
support.
Employment deprivation
in area
demp7
demp
wdemp
dwemp7
Deciles, 1-10
1=least deprived
.
5 .
10=most deprived
11.98
13.35
…
6.93
7.93
38,229 obs.
Based on unemployment
records
Health deprivation in
area
dhea7
dheas
wdheas
dwhea7
Deciles, 1-10
1=least deprived
.
5
.
10=most deprived
12.92
13.28
…
7.33
7.75
38,229 obs.
Based on hospital and
doctor records including
mood and anxiety disorder
and premature death
Education, skills and
training in area
dedu7
dedu
wdedu
dwedu7
Deciles, 1-10
1=least deprived
.
5
.
10=most deprived
12.23
13.24
…
7.34
7.29
38,229 obs.
Based on qualifications,
school absence etc.
Barriers to housing and
services
dhou7
dhou
wdhou
dwhou7
Deciles, 1-10
1=least deprived
.
5
.
10=most deprived
13.40
13.37
…
7.35
6.51
6.72
38,229 obs.
Based on access,
affordability, homelessness
Crime: Index of multiple
deprivation: category for
crime and disorder.
dcri7
dcri
dwcri7
Deciles, 1-10
1=least deprived
.
5
.
10=most deprived
13.44
13.63
…
7.26
6.86
37,697 obs.
Based on reported crime
statistics
Living environment denv7
denv
wdenv
dwenv7
Deciles, 1-10
1=least deprived
.
5 .
10=most deprived
13.62
12.54
…
6.82
6.32
38,229 obs.
Based on poor housing
condition, no central
heating, air quality and
traffic accidents

28
APPENDIX TABLE ii cont.: Independent variables
Variable survey
code
Values (original or derived from
the code(s) shown)
Response
distribution
(%)
Notes
Own income rincome 0=no income
1=under £2,500
2=2,500-£4,999
3=£5,000-£9,999
and so on at £5,000 intervals until
11=£45,000-£49,999
Then larger categories
12=£50,000-£74,999
13=£75,000-£99,999
14=£100,000+
2.85
6.33
9.22
20.12
74.36% below
£25,000.
94.77% below
£50,000
33,541 obs.
Partners income pincome 0=no partner or partner with no
income
1=under £2,500
2=2,500-£4,999
2=£5,000-£9,999
and so on at £5,000 intervals until
11=£45,000-£49,999
Then larger categories
12=£50,000-£74,999
13=£75,000-£99,999
14=£100,000+
54.46
3.13
4.25
6.69
85.29% below
£25,000.
96.63% below
£50,000
36,281 obs.
Qualifications zquals 1=no formal qualifications
2=any formal qualification up to
degree level
3=degree or equivalent
20.45
54.35
25.20
29,857 obs., since this
variable excludes all persons aged 70+
Employed (vs every other
occupation or none)
dvilo4a 0=any other occupation or none
1=employed
46.99
53.01
38,274 obs.
Unemployed (vs every other
occupation or none)
dvilo4a 0=any other occupation or none
1=unemployed
97.17
2.83
38,274 obs.
Caution: small number may
compromise results.
Long-term illness or
disability limits activities
zdill 0=no
1=yes, health limiting
77.18
22.82
38,194 obs.
Survey year survyear 1=2007-08
2=2008-09
3=2009-10
4=2010-11
24.39
24.38
24.31
26.92
38,283 obs.
Presented as dummy
variables with the first year
as the base year
Government office region gor North East
North West
Yorkshire and the Humber
East Midlands
West Midlands
East of England
London
South East
South West
Wales
5.81
13.56
9.89
8.69
9.52
10.33
11.09
15.17
9.81
6.10
38,283 obs.
Presented as dummy
variables with the West
Midlands (a central point)
acting as the base variable

29
References
Adhikari, K., Goldey, P. (2010). Social Capital and its "Downside": The Impact on Sustainability of Induced
Community-Based Organizations in Nepal. World Development 38 (2), 184-194.
Algan, Y., Cahuc, P., & Shleifer, A. (2013). Teaching Practices and Social Capital. American Economic Journal:
Applied Economics, 5(3), 189-210.
Andreoni, J., Gale, W., & Scholz, J. K. (1996). Charitable Contributions of Time and Money. Retrieved March
2015, from http://econweb.ucsd.edu/~jandreon/WorkingPapers/ags-v8.pdf
Auten, G. E., & Rudney, G. (1990). The Variability of Individual Charitable Giving in the US. Voluntas, 1(2),
80-97.
Bartolini, S., & Sarracino, F. (2014). Happy for how long? How social capital and economic growth relate to
happiness over time. Ecological Economics, 108, 242-256.
Bauer, T., Bredtmann, J., & Schmidt, C. (2012). Time vs. Money - the supply of voluntary labor and charitable
donations across Europe. RUHR Economic Papers no. 349.
Bebbington, A., Guggenheim, S., Olson, E., & Woolcock, M. (2004). Exploring Social Capital Debates at the
World Bank. Journal of Development Studies, 40(5), 33-64.
Bekkers, R., & Wiepking, P. (2007). Generosity and philanthropy: A literature review Retrieved March 2014,
from http://papers.ssrn.com/sol3/papers.cfm?abstract_id=1015507
Bowles, S. (2008). Policies designed for self-interested citizens may undermine "the moral sentiments":
Evidence from economic experiments. Science, 320(5883), 1605-1609.
CAF. (2012). World giving index 2012. Charities Aid Foundation. Retrieved March 2014, from
https://www.cafonline.org/PDF/WorldGivingIndex2012WEB.pdf
Center on Philanthropy at Indiana University in the USA. (2007). Patterns of household charitable giving by
income group, 2005.
Cox, J., Kerschbamer, R., & Neururer, D. (2014). What is trustworthiness and what drives it? Working Papers in
Economics and Statistics, University of Innsbruck, eeecon, 2014-23.
Dasgupta, P. (2009). A matter of trust: Social capital and economic development. Paper presented at the Annual
Bank Conference on Development Economics (ABCDE), Seoul. http://www.kdi.re.kr/upload/12623/a2-1.pdf
DeScioli, P. & Krishna, S. (2013). Giving to whom? Altruism in different types of relationships. Journal of
Economic Psychology, 34, 218-228. doi: DOI 10.1016/j.joep.2012.10.003
Dessi, R. & Monin, B. 2012. Noblesse Oblige? Moral identity and prosocial behaviour in the face of selfishness TSE WP 12-347
Du Toit, A. (2004). 'Social exclusion' discourse and chronic poverty: A South African case study. Development
and Change, 35(5), 987-1010.
El-Said, H., & Harrigan, J. (2009). "You Reap What You Plant": Social Networks in the Arab World-The
Hashemite Kingdom of Jordan. World Development, 37(7), 1235-1249.
Grant, E. (2001). Social capital and community strategies: Neighbourhood development in Guatemala City.
Development and Change, 32(5), 975-997.
Grugerty, M., & Kremer, M. (2002). The impact of development assistance on social capital: Evidence from
Kenya. . In C. Grootaert & T. Van Bastelaer (Eds.), The role of social capital in development: an empirical
assessment (pp. 213-233). Cambridge: Cambridge University Press.
El-Said, H., & Harrigan, J. (2009). "You Reap What You Plant": Social Networks in the Arab World-The
Hashemite Kingdom of Jordan. World Development, 37(7), 1235-1249.
English, C., & Ray, J. (2011). Worldwide, Personal Wellbeing Related to Civic Engagement: Religious adults
also more likely to be civically engaged Retrieved March 2014, from
http://www.gallup.com/poll/145811/Worldwide-Personal-Wellbeing-Related-Civic-Engagement.aspx
Fershtman, C., Gneezy, U., & List, J. A. (2009). Inequity, Selfishness, and Social Norms. Retrieved March 2014,
from http://www.tau.ac.il/~fersht/Papers/Inequity,%20Selfishness%20and%20Social%20Norms.pdf

30
Frey, B., & OberholzerGee, F. (1997). The cost of price incentives: An empirical analysis of motivation
crowding-out. American Economic Review, 87(4), 746-755.
Grant, E. (2001). Social capital and community strategies: Neighbourhood development in Guatemala City.
Development and Change, 32(5), 975-997.
Grugerty, M., & Kremer, M. (2002). The impact of development assistance on social capital: Evidence from
Kenya. In C. Grootaert & T. Van Bastelaer (Eds.), The role of social capital in development: an empirical
assessment (pp. 213-233). Cambridge: Cambridge University Press.
Gui, B., & Sugden, R.. (2010). Economics and social interaction: accounting for interpersonal relations.
Cambridge: Cambridge University Press.
Halpern, David. (2005). Social capital. Oxford: Polity Press.
Holloway, S., Tucker, L., & Hornstein, H. A. (1977). Effects of Social and Non-Social Information on
Interpersonal-Behavior of Males - News Makes News. Journal of Personality and Social Psychology, 35(7),
514-522.
Knack, S., & Keefer, P. (1997). Does social capital have an economic payoff? A cross-country investigation.
Quarterly Journal of Economics, 112(4), 1251-1288.
Kolm, S-C., & Ythier, J. (2006). Handbook on the economics of giving, reciprocity and altruism. Amsterdam ;
London: Elsevier.
Krishna, A. (2002). Active social capital : tracing the roots of development and democracy. New York, N.Y. ;
Chichester: Columbia University Press.
Madson, L. (1997). Models of the self: self-construals and gender. Psychol Bull, 122(1), 5-37.
Mayo, J., & Tinsley, C. (2009). Warm glow and charitable giving: Why the wealthy do not give more to charity
Journal of Economic Psychology 30, 490-499.
Office for National Statistics. (2013). Ward Level Mid-Year Population Estimates (experimental), Mid-2011
(Census Based) Statistical Bulletin Retrieved October 2015, from
http://www.ons.gov.uk/ons/dcp171778_311891.pdf
Paik, A. (2011). Social networks, recruitment and volunteering: Are social capital effects conditional on
recruitment. Nonprofit and voluntary sector quarterly, 40, 476-496
Portes, A., & Landolt, P. (2000). Social capital: Promise and pitfalls of its role in development. Journal of Latin
American Studies, 32, 529-547.
Putnam, Robert D., Leonardi, Robert, & Nanetti, Raffaella Y. (1993). Making democracy work : civic traditions
in modern Italy. Princeton, N.J. ; Chichester: Princeton University Press.
Quibria, M. G. (2003). The puzzle of social capital: a critical review. Manila: Asian Development Bank,
Economics and Research Department.
Sivesind, K. H., Pospisilova, T., & Fric, P. (2013). Does volunteering cause trust? European Societies, 15(1),
106-130.
Smith, D. (1994). Determinants of Voluntary Association Participation and Volunteering: A Literature Review.
Nonprofit and Voluntary Sector Quarterly, 23(3), 243-263.
Svendsen, G. (2014). Trust. In Aarhus University (Ed.). Gylling, Denmark: Aarhus University Press.
Thaler, R., & Sunstein, C. (2008). Nudge : improving decisions about health, wealth, and happiness. New
Haven, Conn. ; London: Yale University Press.
Uslaner, E. M. (2000). Producing and consuming trust. Political Science Quarterly, 115(4), 569-590.
Vajja, A., & White, H. (2008). Can the World Bank build social capital? The experience of social funds in
Malawi and Zambia. Journal of Development Studies, 44(8), 1145-1168.
Wilkinson, R., & Pickett, K. (2009). The spirit level: why more equal societies almost always do better. London;
New York: Allen Lane.

31
Woolcock, M., & Narayan, D. (2000). Social capital: Implications for development theory, research, and policy.
World Bank Research Observer, 15(2), 225-249.
World Bank. (2000). New paths to social development: community and global networks in action, March 2014,
from
https://siteresources.worldbank.org/INTRANETSOCIALDEVELOPMENT/Resources/NewPathsSocialSummit.
Zischka, L. (2014). Social capital stocks, giving flows and welfare outcomes. University of Reading working
paper Retrieved September 2014, from http://www.reading.ac.uk/economics/research/econ-
discussionpapers.aspx
Zischka, L. (2016a). The interaction between prosocial (giving) behaviours and social cohesion. University of
Reading Discussion Paper No. 2016-124. Retrieved June 2016, from
http://www.reading.ac.uk/web/FILES/economics/emdp2016124.pdf
Zischka, L., Casson, M., & Della Giusta, M. (2016). “Cast your bread upon the waters, for you will find it after
many days.” A BHPS study of the interaction between giving and welfare . University of Reading Discussion
Paper. Retrieved August 2016, from http://www.reading.ac.uk/economics/research/econ-discussionpapers.aspx
Data:
Citizenship Survey, 2008-2011. Department for Communities and Local Government (DCLG). Supplied by the
UK Data Archive.