hera at xxxi ced kay fox human & environmental risk assessment environmental risk assessment...
TRANSCRIPT

HERA at XXXI CED Kay Fox
Human & Environmental Risk Assessment
Environmental Risk Assessment under HERA: Challenges and Solutions
Kay Fox Chair of the HERA Environmental Task Force

HERA at XXXI CED Kay Fox
C. Poelloth, C. Arregui, J. Backmann - AISE
I. Lopez Petresa C. Stevens Dow CorningG. Boeije P&G R. van Egmond UnileverH. Certa SASOL R. van Wijk Akzo NobelR. Elsmore McBride T. Wind HenkelK. Fox Unilever A. Aarts SolutiaP. Masscheleyn P&G A. Berends SolvayP. Richner CIBA D. Calcinai Condea AugustaW. Schul BASF E. Cerbelaud RhodiaJ. Steber Henkel V. Koch Clariant
R. Toy Shell Chemicals
Environment Task Force

HERA at XXXI CED Kay Fox
Intended for applicationin EUROPE
HERA Environmental Risk Assessmentbased on Technical Guidance Document for New and Existing substances EUSES

HERA at XXXI CED Kay Fox
Focus on chemical substances used primarily in Household detergent and cleaning products
Primary Focus on the use and disposalof these substances
Sewer Transport
River
Domestic Emission
On-SiteTreatment
Sewage Treatment

HERA at XXXI CED Kay Fox
Detergent exposure scenario for EUSES
• Begin with EUSES
– Environment• Local• Regional
– Predators exposed via the environment– Man exposed via the environment
TGD
HERA at XXXI CED Kay Fox
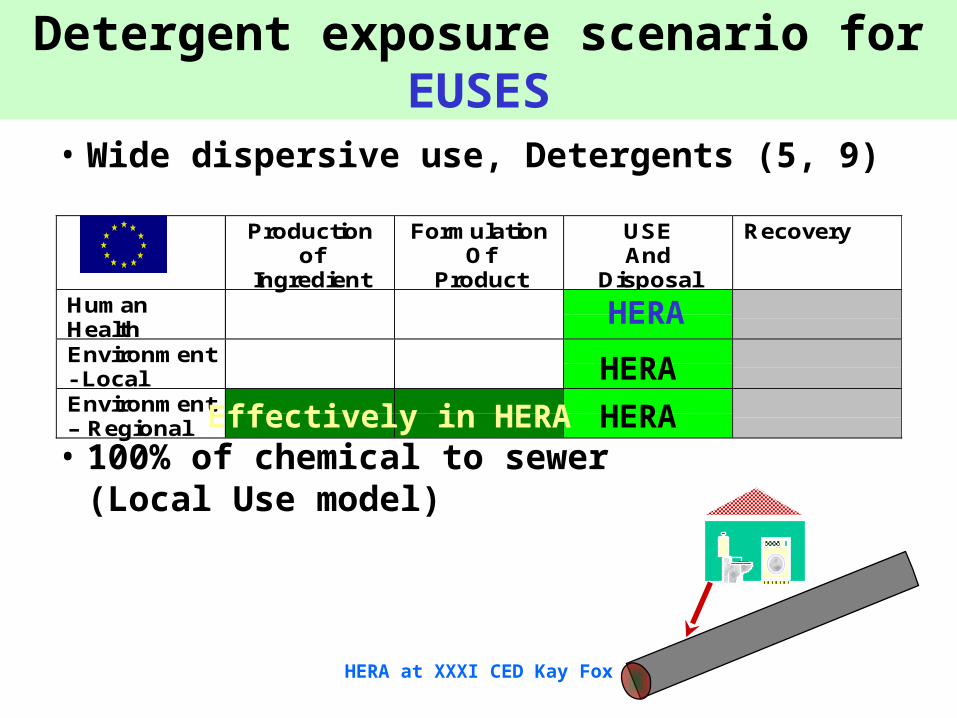
Detergent exposure scenario for EUSES
• Wide dispersive use, Detergents (5, 9)
• 100% of chemical to sewer (Local Use model)
Productionof
Ingredient
FormulationOf
Product
USEAnd
Disposal
Recovery
HumanHealthEnvironment- LocalEnvironment– Regional
HERA
HERA
HERA
Effectively in HERA

HERA at XXXI CED Kay Fox
Detergent exposure scenario for EUSES
Production
Formulation
Use
Contributions to Regional Environment from Local sources
TGD Default HERA
0.3% 0.3%(1.003) 0 0
0.8% 0.8% 0 0 max max
99% 99% 100% 100%
Bottom line - 100%, within volume determination error

HERA at XXXI CED Kay Fox
Detergent exposure scenario for EUSES
• To cover a “reasonable worst case”, TGD and EUSES assume that– the local wastewater treatment plant receives 4
times the average ingredient input– the Standard EU region receives 10% of the total
European product consumption
• HERA replaces these default assumptions with HERA default values based on measured product consumption and environmental monitoring data - the HERA Detergent Scenario.

HERA at XXXI CED Kay Fox
Detergent exposure scenario for EUSES
• Tiered Methodology– Begin with the HERA Detergent scenario– Accept all other EUSES Defaults– Replace selected defaults if necessary
• Removal values in STP• Measured Kd values• Biodegradation rates in rivers, soil, etc.
Often need Chronic ecotoxicity data

HERA at XXXI CED Kay Fox
Production
Formulation
Use
Regional Environmental Concentration
20 million people
10% of EU Production
Standard EU Region
200 km
200 km
Release is based on Production Volume
HERA at XXXI CED Kay Fox
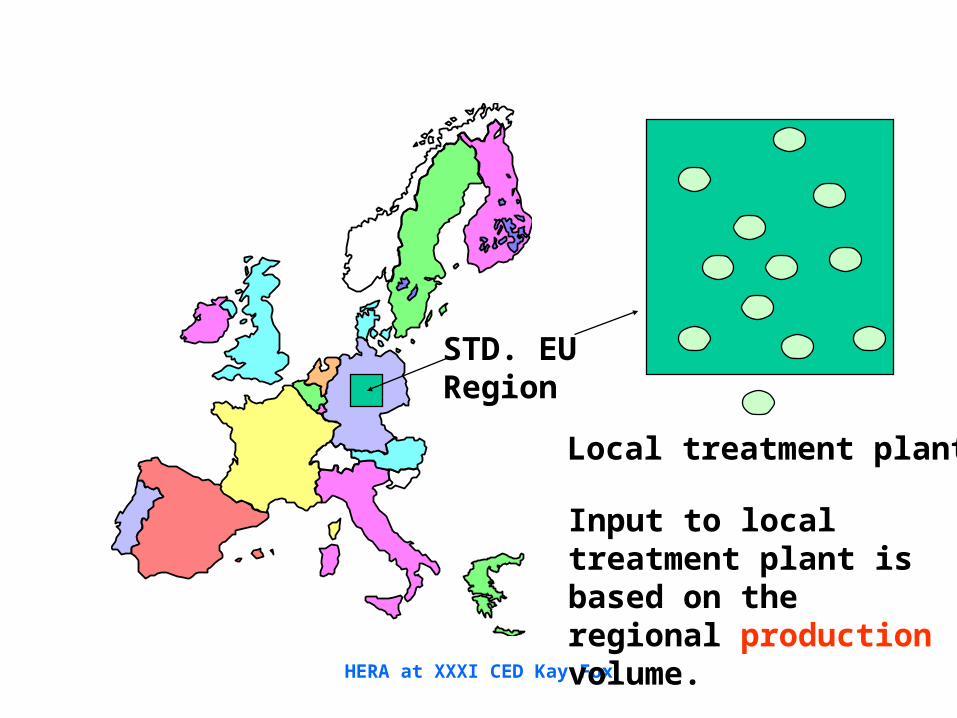
STD. EURegion
Local treatment plants
Input to local treatment plant is based on the regional production volume.

HERA at XXXI CED Kay Fox
Production
Formulation
Use
Detergent Release scenario
Release is based onpopulation density
HERA Region
200 km
200 km
~100% of release Kg/person/year

HERA at XXXI CED Kay Fox
The standard EU region has 10% of the EUdetergent consumption - for 5.4% of the EU population.
Region Population Area, km2 # EU Regions Pop. DensityEntire EU 370000000 3560000 89 104Switzerland 7325000 39550 0.99 185Belgium 10213000 32820 0.82 311Paris, Picardie, U. Normandie 14500000 43000 1.08 337
The Netherlands 15739000 33920 0.85 464
EUSES Standard Region 20000000 40000 1.00 500
London and SE +E 20452000 39794 0.99 514Northrhine-Westphalia 17800000 34071 0.85 522

HERA at XXXI CED Kay Fox
Detergent consumption per person in eighteen European countries
1998 per capita detergent consumption by country
0
2
4
6
8
10
12
14
Finl
and
Sweden
Norway
Icel
and
Denm
ark
The
Nethe
rland
s
Austri
a
Germ
any
Switzer
land
Irela
nd UK
Europ
ean
Avera
ge
Greec
e
Belgi
um
Luxe
mbu
rg
Fran
ce
Portu
gal
Spain
Italy
kg
/pe
rso
n/y
ea
r

HERA at XXXI CED Kay Fox
Country Regional % of EU Detergent release USAGE
# EU Pop. usage, Relative in a regionRegion Regions Density kg/person/y to EU Avg.Entire EU 89 104 10.06 1 0.011Switzerland 0.99 185 8.64 1.53 0.017Madrid + All Castilla Leon population 1.00 188 12.40 2.23 0.025Catelonia (Barcelona) 0.80 190 12.40 2.25 0.025Piedmonte + Liguria 0.77 192 12.61 2.32 0.026Berlin + Brandenburg 0.76 198 8.10 1.53 0.017Bremen+ Hamburg + Niedersachsen 1.22 209 8.10 1.62 0.018Baden Wurtemberg 0.89 290 8.10 2.25 0.025Belgium 0.82 311 10.60 3.15 0.035Lombardy + Veneto 1.06 320 12.61 3.85 0.043Paris, Picardie, U. Normandie 1.08 337 11.67 3.76 0.042Campagnia + Lazio 0.77 358 12.61 4.31 0.048Yorkshire +Humber +NW+W Midlands 1.06 405 10.02 3.88 0.043The Netherlands 0.85 464 7.44 3.30 0.037EUSES Standard Region 1.00 500 0.100London and SE +E 0.99 514 10.02 4.93 0.055Northrhine-Westphalia 0.85 527 8.10 4.08 0.046

HERA at XXXI CED Kay Fox
• The maximum regional release for detergent ingredients is found in the UK region containing London
• This is 5.5% of total usage, rather than 10%, as in the TGD
• Thus the HERA Detergent release scenario should have 5.5% of the total volume released to the region.

HERA at XXXI CED Kay Fox
STD. EURegion
Local treatment plants
Input to local treatment plant is based on the regional use volume.
In EUSES,

HERA at XXXI CED Kay Fox
• HERA must give the correct local loading for sewage treatment plants in countries with highest detergent use.
• Italy and Spain have 1.25 times the average EU detergent consumption, per person.
• HERA ensures correct representation of the LOCAL treatment plant, which EUSES derives from the regional consumption, by raising the overall regional background to .055 X 1.25 = 0.07 times the European use volume
Regional detergent Scenario
1998 per capita detergent consumption by country
0
2
4
6
8
10
12
14
Finl
and
Sweden
Norway
Icel
and
Denm
ark
The
Nethe
rland
s
Austri
a
Germ
any
Switzer
land
Irela
nd UK
Europ
ean
Avera
ge
Greec
e
Belgi
um
Luxe
mbu
rg
Fran
ce
Portu
gal
Spain
Italy
kg
/pe
rso
n/y
ea
r
HERA uses 7%, not 10%, for regional input EUSES

HERA at XXXI CED Kay Fox
• Product use and substance use data are expected to be similar, for most widely used detergent ingredients.
• Each HERA Substance team will consider any areas of high regional usage for their substance, and will modify the HERA regional default if appropriate.
Fragrance F

HERA at XXXI CED Kay Fox
STD. EURegion
Local treatment plants
4TGD - Local plant
Release from LOCAL Sewage Treatment facility
A reasonable worst case treatment plantreceives 4 times the average load

HERA at XXXI CED Kay Fox
GREAT-ER
GIS model which predicts chemical concentrations of household chemicals in rivers.
Boron used as aconservative tracer,to validate the model.
6 STP influents and effluents
Monthly river water and effluent samples
UK data

HERA at XXXI CED Kay Fox
• Measured effluent boron agreed with load calculated from consumer sales volumes (1996, 28 daily composite samples from 6 treatment plants) 0.22 g/person/day
• Boron in effluents: 50 treatment plants– NL 7 – Germany 6 – Italy 3– UK 34 plants
HERA at XXXI CED Kay Fox
012
3456
78
0 0.4 0.8 1.2 1.6 2 2.4
Boron measured / Boron calculated
Fre
qu
ency
0%
20%
40%
60%
80%
100%
120%
Frequency
Cumulative %
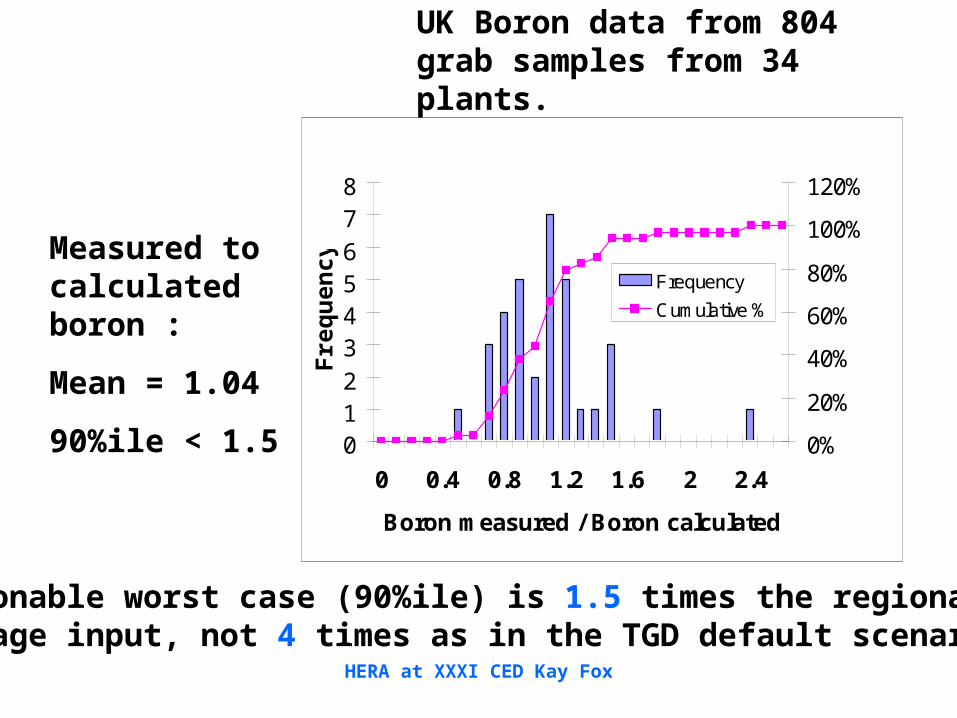
UK Boron data from 804 grab samples from 34 plants.
Measured to calculated boron :
Mean = 1.04
90%ile < 1.5
Reasonable worst case (90%ile) is 1.5 times the regional average input, not 4 times as in the TGD default scenario.

HERA at XXXI CED Kay Fox
• Boron concentrations in Italy, Germany, and the Netherlands also agreed with the concentrations calculated for the country and year of emission, with the 90%ile of the measured to calculated boron distribution being less than 1.5.
• Thus data from 50 sewage plants, in 4 countries, show that for detergent ingredients in wide general use, such as perborate, a reasonable worst case (90%ile) is 1.5 times the regional average input.
• Paper on the 1.5 factor submitted to Chemosphere. ECETOC submission to TGD revision resulted in change to “up to a factor of 4” in the revised TGD.

HERA at XXXI CED Kay Fox
• Each HERA Substance team will consider any areas of high local usage for their substance, and will modify the HERA default for the reasonable worst case sewage treatment plant if appropriate.

HERA at XXXI CED Kay Fox
STD. EURegion
Summary - HERA DefaultsDetergent scenario
Region - 7%, not 10%of ingredient used
1.5
Local sewage treatment - 1.5
is worst case, not 4.
100%, not 99%, of ingredient used goes to the local treatment facility

HERA at XXXI CED Kay Fox
Modified Exposure Scenario - HERA
TGD - Worst case (4) (Local STW) times worst case (~2) (10% production tonnage)gives almost 8 times the average ingredient loading to a local sewage treatment plant.
HERA Detergent Scenario - Data backed “worst case” (1.5) for local STWtimes “worst case” (~1.7) regional release based upon product useshows two times the average ingredient loading to a local sewage treatment plant.
HERA will check that the substance use patterns are suitable before using the HERA defaults.

HERA at XXXI CED Kay Fox
Thanks!
• To HERA for providing the Challenges!
• To the HERA Environment task force for help with the Solutions
• To ERASM and the Environment Agency for England and Wales for funding the boron monitoring work
• To the EA and Yorkshire Water employees who collected the samples in all weathers!
• To you for listening!