hf halfyear report 2019 - hellofreshir.hellofreshgroup.com/download/companies/hellofresh... ·...
TRANSCRIPT

ENDED 30 JUNE 2019
– HelloFresh SE –
HALF-YEAR REPORT

INTERIM REPORT 2019
HelloFresh SE
HELLOFRESH AT A GLANCE
Key Figures
3 months ended
30 June 19
3 months ended
30 June 18 YoY growth
6 months ended
30 June 19
6 months ended
30 June 18 YoY growth
Key Performance Indicators
Group
Active customers (in millions) 2.41 1.84 30.6%
Number of orders (in millions) 8.93 6.70 33.2% 17.81 13.31 33.9%
Orders per customer 3.7 3.6 2.0%
Meals (in millions) 67.0 48.9 37.0% 132.6 97.2 36.4%
Average order value (EUR) * 48.8 47.5 2.6% 48.0 46.2 3.9%
Average order value constant currency (EUR) * 46.3 47.5 (2.6%) 45.6 46.2 (1.3%)
USA
Active customers (in millions) 1.35 1.12 19.9%
Number of orders (in millions) 4.88 3.79 28.8% 9.79 7.69 27.4%
Orders per customer 3.6 3.4 7.4%
Meals (in millions) 32.2 25.0 28.5% 64.4 51.5 24.9%
Average order value (EUR) * 50.1 49.6 1.0% 49.3 47.8 3.2%
Average order value constant currency (EUR) * 47.2 49.6 (4.9%) 46.0 47.8 (3.7%)
International
Active customers (in millions) 1.06 0.72 47.2%
Number of orders (in millions) 4.05 2.91 39.0% 8.02 5.62 42.7%
Orders per customer 3.8 4.0 (5.6%)
Meals (in millions) 34.8 23.8 45.9% 68.2 45.7 49.4%
Average order value (EUR)* 47.2 44.9 5.2% 46.3 43.9 5.3%
Average order value constant currency (EUR)* 45.3 44.9 1.0% 45.0 43.9 2.4%
2

HelloFresh SEINTERIM REPORT 2019
Key Figures
3 months ended
30 June 19
3 months ended
30 June 18 YoY growth
6 months ended
30 June 19
6 months ended
30 June 18 YoY growth
Results of operations
Group
Revenue (in MEUR) 436.7 319.7 36.6% 856.7 615.2 39.3%
Revenue constant currency (in MEUR) 31.5% 33.2%
Contribution Margin (in MEUR)** 127.0 89.2 42.5% 248.7 166.2 49.7%
Contribution Margin (in % of Revenue) 29.1% 27.9% 1.2 pp 29.0% 27.0% 2.0 pp
AEBITDA (in MEUR) 18.3 (3.9) nm (7.8) (25.6) 69.4%
AEBITDA (in % of Revenue) 4.2% (1.2%) 5.4 pp (0.9%) (4.2%) 3.3 pp
USA
Revenue (in MEUR) 245.4 188.9 29.9% 485.0 368.3 31.7%
Revenue constant currency (in MEUR) 22.3% 22.8%
Contribution Margin (in MEUR)** 74.4 54.2 37.2% 149.0 102.3 45.7%
Contribution Margin (in % of Revenue) 30.3% 28.7% 1.6 pp 30.7% 27.8% 3.0 pp
AEBITDA (in MEUR) 7.1 (0.3) nm (15.5) (14.0) (10.8%)
AEBITDA (in % of Revenue) 2.9% (0.2%) 3.1 pp (3.2%) (3.8%) 0.6 pp
International
Revenue (in MEUR) 191.3 130.8 46.3% 371.7 246.9 50.6%
Revenue constant currency (in MEUR) 44.9% 48.8%
Contribution Margin (in MEUR)** 53.3 35.5 49.9% 101.1 65.0 55.8%
Contribution Margin (in % of Revenue) 27.9% 27.1% 0.8 pp 27.2% 26.3% 0.9 pp
AEBITDA (in MEUR) 21.9 5.4 305.6% 30.0 4.3 593.3%
AEBITDA (in % of Revenue) 11.5% 4.1% 7.4 pp 8.1% 1.8% 6.3 pp
Group Financial Position
Net working capital (in MEUR) (93.4) (75.4) (93.4) (75.4)
Cash and Cash equivalents (in MEUR) 164.4 307.6 164.4 307.6
Cash flow used in operating activities (in MEUR) (7.4) (15.7) (3.1) (9.1)
* EXCLUDING RETAIL OPERATION IMPACT** NET OF SHARE-BASED COMPENSATION EXPENSES
3

INTERIM REPORT 2019
HelloFresh SE4

HelloFresh SEINTERIM REPORT 2019
CONTENTSA INTERIM GROUP MANAGEMENT REPORT ..............................................................................6
1 Fundamentals of the Group ............................................................................................................7
2 Economic Position ..........................................................................................................................7
3 Position of the Group ......................................................................................................................7
4 Risk and Opportunity Report ........................................................................................................15
5 Outlook ........................................................................................................................................15
B INTERIM CONDENSED CONSOLIDATED FINANCIAL STATEMENTS .................................16
Interim Condensed Consolidated Statement of Financial Position .......................................................17
Interim condensed consolidated statement of Comprehensive Income ................................................19
Interim Condensed Consolidated Statement of Changes in Equity .......................................................20
Interim Condensed Consolidated Statement of Cash Flows ..................................................................21
Explanatory Notes to the Interim Condensed Consolidated Financial Statement .................................22
C FURTHER INFORMATION .........................................................................................................30
Responsibility Statement by the Management Board ...........................................................................30
Auditor Review Report .........................................................................................................................31
Glossary ..............................................................................................................................................32
Financial Calendar ...............................................................................................................................34
Imprint ................................................................................................................................................35
5

INTERIM REPORT 2019HelloFresh SE
1 FUNDAMENTALS OF THE GROUP ...........................................................................................7
2 ECONOMIC POSITION ................................................................................................................7
2.1 General Economic Conditions ........................................................................................................7
2.2 Course of business ..........................................................................................................................7
2.3 HelloFresh Share and Share Capital Structure ................................................................................7
3 POSITION OF THE GROUP .........................................................................................................7
3.1 Earnings Position of the Group ........................................................................................................8
3.2 Financial Position of the Group .....................................................................................................10
3.3 Asset Position of the Group ...........................................................................................................11
3.4 Financial Performance of the Reportable Segments ......................................................................11
3.4.1 Financial Performance of US Segment ...............................................................................12
3.4.2 Financial Performance of International Segment ...............................................................13
4 RISK AND OPPORTUNITY REPORT ........................................................................................15
5 OUTLOOK ..................................................................................................................................15
5.1 Economic conditions .....................................................................................................................15
5.2 Guidance ......................................................................................................................................15
A INTERIM GROUP MANAGEMENT REPORT of HelloFresh Group as of 30 June 2019
6

HelloFresh SEINTERIM REPORT 2019
Interim Group Management Report
1 FUNDAMENTALS OF THE GROUP
The statements made in the annual report 2018 regarding the business model, the group structure, the perfor-mance measurement system and research and development activities in the HelloFresh Group still substantially apply at the time this interim report was issued for publication.
2 ECONOMIC POSITION
2.1 General Economic Conditions
The global economic growth in the first half of 2019 was slightly weaker than projected in our annual report 2018. As a result, the IMF marginally decreased its growth forecast for 2019 from 3.5% to 3.2%(1). Despite the slowdown, the IMF predicts stronger growth in the second half of 2019 and an improvement to 3.5% in 2020. We refer to the discussion in section 5.1 Outlook: Economic Conditions of this interim group management report.
2.2 Course of business
HelloFresh maintains its robust year-on-year growth trajectory and continues its consistent margin expansion in the first half of 2019. The second quarter 2019 marks a key milestone in the company’s history, as it is the first quarter in which the company has recorded a positive AEBITDA for the Group with a margin of 4.2%; in addition, both operational segments showed an increased AEBITDA margin in the second quarter.
2.3 HelloFresh Share and Share Capital Structure
The HelloFresh share is listed at the Frankfurt Stock Exchange (Prime Standard). In the first half of 2019, the share price of HelloFresh SE increased by 36.99% from EUR 6.11 as of 31 December 2018 to EUR 8.37 as of 30 June 2019. In June 2018 HelloFresh was included in the SDAX index. For further details with respect to share capital structure refer to NOTE 8 to the interim condensed consolidated financial statements
3 POSITION OF THE GROUP
The interim consolidated financial statements of HelloFresh were prepared in accordance with IFRS as adopted by the European Union.
1 International Monetary Fund “World Economic Outlook: Still Sluggish Global Growth” (update July 2019) https://www.imf.org/en/Publications/WEO/Issues/2019/07/18/WEOupdateJuly2019
7

INTERIM REPORT 2019HelloFresh SE
Interim Group Management Report Position Of The Group
3.1 Earnings Position of the Group
In MEUR APR 1 - JUN 30 JAN 1 - JUN 30
2019 2018 YoY 2019 2018 YoY
Revenue 436.7 319.7 36.6% 856.7 615.2 39.3%
Procurement expenses (153.9) (117.9) 30.5% (305.9) (234.0) 30.7%
% of Revenue (35.2%) (36.9%) 1.7 pp (35.7%) (38.0%) 2.3 pp
Fulfillment expenses (156.2) (113.0) 38.3% (303.0) (215.6) 40.5%
% of Revenue (35.8%) (35.3%) (0.5 pp) (35.4%) (35.1%) (0.3 pp)
Contribution margin 126.6 88.8 42.5% 247.8 165.6 49.7%
Contribution margin (excl. SBC*) 127.0 89.2 42.5% 248.7 166.2 49.7%
% of Revenue 29.1% 27.9% 1.2 pp 29.0% 27.0% 2.0 pp
Marketing expenses (92.6) (74.3) 24.5% (224.7) (158.3) 41.9%
% of Revenue (21.2%) 23.3%) 2.1 pp (26.2%) (25.7%) (0.5 pp)
Marketing expenses (excl. SBC*) (92.4) (74.0) 24.9% (224.2) (157.8) 42.1%
% of Revenue (21.1%) (23.1%) 2.0 pp (26.2%) (25.7%) (0.5 pp)
General and administrative expenses, other income and expenses (32.7) (28.1) 16.5% (62.2) (48.7) 27.0%
% of Revenue (7.5%) (8.8%) 1.3 pp (7.3%) (7.9%) 0.6 pp
General and administrative expenses, other income and expenses (excl. SBC*) (28.5) (23.7) 20.7% (54.4) (41.3) 32.2%
% of Revenue (6.5%) (7.4%) 0.9 pp (6.4%) (6.7%) 0.3 pp
Operating income/ (loss) 1.3 (13.6) nm (39.1) (41.5) (5.9%)
% of Revenue 0.3% (4.3%) 4.6 pp (4.6%) (6.7%) 2.1 pp
EBITDA 11.8 (10.0) nm (18.6) (35.4) 47.5%
% of Revenue 2.7% (3.1%) 5.8 pp (2.2%) (5.8%) 3.6 pp
AEBITDA 18.3 (3.9) nm (7.8) (25.6) 69.4%
% of Revenue 4.2% (1.2%) 5.4 pp (0.9%) (4.2%) 3.3 pp
*EXCLUDING SHARE-BASED COMPENSATION EXPENSES
8
HelloFresh SEINTERIM REPORT 2019
Interim Group Management Report Position Of The Group
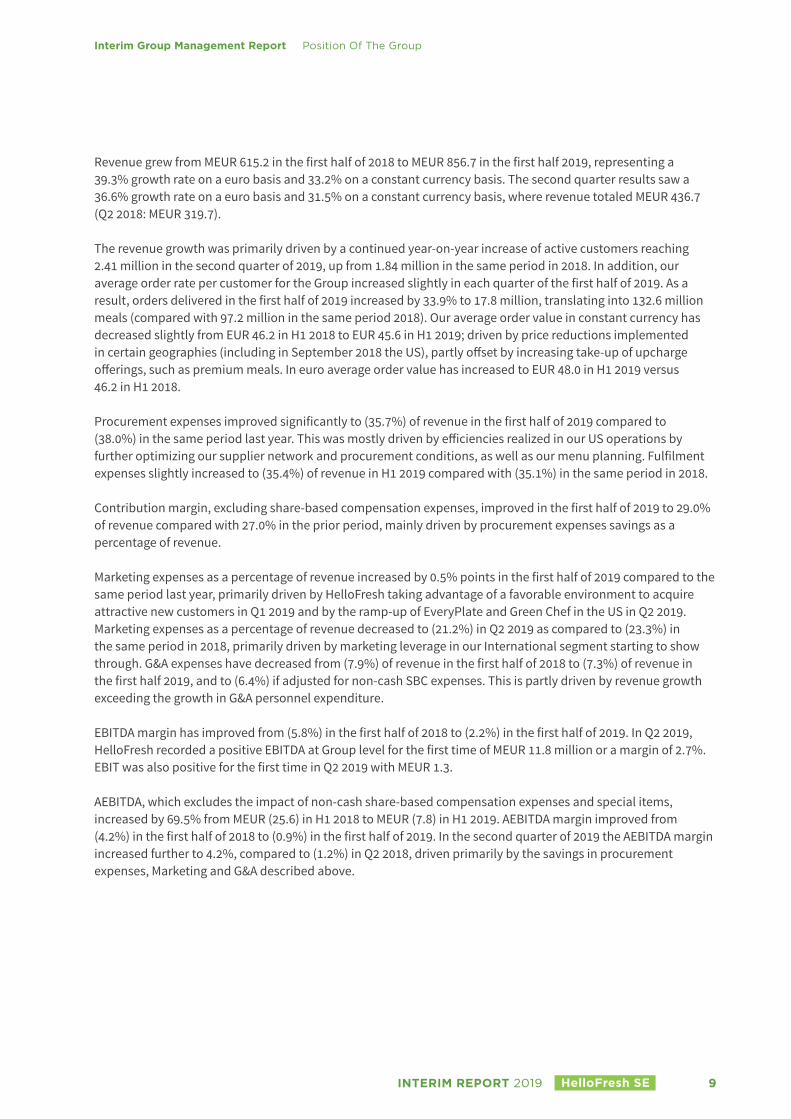
Revenue grew from MEUR 615.2 in the first half of 2018 to MEUR 856.7 in the first half 2019, representing a 39.3% growth rate on a euro basis and 33.2% on a constant currency basis. The second quarter results saw a 36.6% growth rate on a euro basis and 31.5% on a constant currency basis, where revenue totaled MEUR 436.7 (Q2 2018: MEUR 319.7).
The revenue growth was primarily driven by a continued year-on-year increase of active customers reaching 2.41 million in the second quarter of 2019, up from 1.84 million in the same period in 2018. In addition, our average order rate per customer for the Group increased slightly in each quarter of the first half of 2019. As a result, orders delivered in the first half of 2019 increased by 33.9% to 17.8 million, translating into 132.6 million meals (compared with 97.2 million in the same period 2018). Our average order value in constant currency has decreased slightly from EUR 46.2 in H1 2018 to EUR 45.6 in H1 2019; driven by price reductions implemented in certain geographies (including in September 2018 the US), partly offset by increasing take-up of upcharge offerings, such as premium meals. In euro average order value has increased to EUR 48.0 in H1 2019 versus 46.2 in H1 2018.
Procurement expenses improved significantly to (35.7%) of revenue in the first half of 2019 compared to (38.0%) in the same period last year. This was mostly driven by efficiencies realized in our US operations by further optimizing our supplier network and procurement conditions, as well as our menu planning. Fulfilment expenses slightly increased to (35.4%) of revenue in H1 2019 compared with (35.1%) in the same period in 2018.
Contribution margin, excluding share-based compensation expenses, improved in the first half of 2019 to 29.0% of revenue compared with 27.0% in the prior period, mainly driven by procurement expenses savings as a percentage of revenue.
Marketing expenses as a percentage of revenue increased by 0.5% points in the first half of 2019 compared to the same period last year, primarily driven by HelloFresh taking advantage of a favorable environment to acquire attractive new customers in Q1 2019 and by the ramp-up of EveryPlate and Green Chef in the US in Q2 2019. Marketing expenses as a percentage of revenue decreased to (21.2%) in Q2 2019 as compared to (23.3%) in the same period in 2018, primarily driven by marketing leverage in our International segment starting to show through. G&A expenses have decreased from (7.9%) of revenue in the first half of 2018 to (7.3%) of revenue in the first half 2019, and to (6.4%) if adjusted for non-cash SBC expenses. This is partly driven by revenue growth exceeding the growth in G&A personnel expenditure.
EBITDA margin has improved from (5.8%) in the first half of 2018 to (2.2%) in the first half of 2019. In Q2 2019, HelloFresh recorded a positive EBITDA at Group level for the first time of MEUR 11.8 million or a margin of 2.7%. EBIT was also positive for the first time in Q2 2019 with MEUR 1.3.
AEBITDA, which excludes the impact of non-cash share-based compensation expenses and special items, increased by 69.5% from MEUR (25.6) in H1 2018 to MEUR (7.8) in H1 2019. AEBITDA margin improved from (4.2%) in the first half of 2018 to (0.9%) in the first half of 2019. In the second quarter of 2019 the AEBITDA margin increased further to 4.2%, compared to (1.2%) in Q2 2018, driven primarily by the savings in procurement expenses, Marketing and G&A described above.
9

INTERIM REPORT 2019HelloFresh SE
Interim Group Management Report Position Of The Group
EBIT to AEBITDA
In MEUR6 months ended
30-Jun 196 months ended
30-Jun 18YoY growth%
(6 months)
EBIT (39.1) (41.5) 5.9%
Depreciation and amortisation 20.5 6.1
EBITDA (18.6) (35.4) 47.5%
Special items 1.7 1.2
Share based compensation 9.1 8.6
AEBITDA (7.8) (25.6) 69.4%
AEBITDA margin (0.9%) (4.2%)
3.2 Financial Position of the Group
The Group has consumed cash of MEUR (3.1) in its operating activities in the first half of 2019. The improvement compared to the prior-year period MEUR (9.1) was mainly due to an increase in EBITDA, from MEUR (35.4) in 2018 to MEUR (18.6) in 2019. Additionally, due to first time adoption of IFRS 16 comparability with 2018 is limited.
Cash flow from investing activities amounted to MEUR (15.1) (2018 MEUR (24.4)) driven mainly by increased investments in property, plant and equipment (“PPE”) and intangible assets. Key PPE capital expenditure projects comprise certain automation investments in our US segment, build of our combined Canada production infrastructure following the acquisition of ChefsPlate towards the end of 2018 and the commencement of expansion related capital expenditure projects in Australia. The net cash outflow from investing activities of MEUR (15.1) includes a cash inflow of MEUR 2.5 from the sale of equipment relating to trials in the US ready meal market, which were wound down during the first quarter of 2019.
The change in cash flows from financing activities in the first half of 2019 (MEUR 11.6 outflow) compared to the first half of 2018 (MEUR 0.6 inflow) is mainly driven by rental and lease repayments, which were included in the cash flow from operating activities in 2018, but which are shown within financing activities in the current period due to the first time adoption of IFRS 16.
In MEUR For the six months ended 30 June
2019 2018
Cash and cash equivalents at the beginning of the year 193.9 339.9
Cash flows from operating activities (3.1) (9.1)
Cash flows from investing activities (15.1) (24.4)
Cash flows from financing activities (11.6) 0.6
Effects of exchange rate changes and other changes on cash and cash equivalents 0.3 0.6
Cash and cash equivalents at the end of the period 164.4 307.6
10

HelloFresh SEINTERIM REPORT 2019
Interim Group Management Report Position Of The Group
3.3 Asset Position of the Group
The Group continues to operate internationally an asset-light business model through local subsidiaries.
Property, plant and equipment, net of depreciation, amounted to MEUR 149.9 in the first half of 2019 compared to MEUR 62.4 at year end in 2018. The increase has been caused predominantly by to the first time adoption of IFRS 16 and the resulting recognition of Right of Use Assets (MEUR 87.1), primarily comprising leased property and, in certain markets, vans. This also led to the increase of other financial liabilities of MEUR 86.7. For further details refer to NOTE 4 . Other tangible fixed assets primarily represent equipment and machinery used in our fulfilment centers to produce our meal boxes and chill the respective facilities. Intangible assets increased in the first half of 2019 to MEUR 13.5 from MEUR 12.3 at 31 December 2018, mainly driven by internally developed software.
In MEUR 30 June 2019 31 December 2018
Assets
Non-current assets 236.0 143.7
Current assets 234.4 252.4
Total assets 470 .4 396.1
Equity and liabilities
Equity 202.5 236.7
Non-current liabilities 90.1 14.5
Current liabilities 177.8 144.9
Total equity and liabilities 470 .4 396.1
Besides the adjustments made due to IFRS 16 and our robust cash position, the Group’s balance sheet as at 30 June 2019 mainly consists of its working capital, comprised of trade receivables of MEUR 13.3, inventories of packaging material and primarily non-perishable ingredients of MEUR 29.7 and trade payables (MEUR 115.0). We maintain a focus on sustainability through local sourcing and fresh produce. Our weekly business cycle allows us to operate on a just-in-time delivery basis, resulting in very low inventories and very little wastage of ingredients. Most customers pay us on or before the day of receipt of their delivery. We typically pay our suppliers within market standard periods, i.e., generally within 2 to 4 weeks after delivery. As a result of these factors, our business has shown a negative net working capital that beneficially impacts our operating cash flow over a full year period, subject to certain intra-year seasonality.
3.4 Financial Performance of the Reportable Segments
HelloFresh’s business activities are organized into two operating segments: the USA and all markets except the USA (“International” or “Int’l”). The International Segment consists of our operations in Australia, Austria, Belgium, Canada, Germany, Luxembourg, Northern France, the Netherlands, New Zealand, Switzerland and the UK.
11

INTERIM REPORT 2019HelloFresh SE
Interim Group Management Report Position Of The Group
3.4.1 Financial Performance of US Segment
In MEURFor the three months
ended 30 JuneFor the six months
ended 30 June
2019 2018 YoY 2019 2018 YoY
Revenue (external) 245.4 188.9 29.9% 485.0 368.3 31.7%
Procurement expenses (75.2) (63.7) 18.0% (151.6) (129.8) 16.8%
% of Revenue (30.7%) (33.7%) (3.0pp) (31.3%) (35.2%) 3.9pp
Fulfillment expenses (96.1) (71.1) 35.1% (184.8) (136.4) 35.4%
% of Revenue (39.1%) (37.6%) (1.5pp) (38.1%) (37.0%) (1.1pp)
Contribution margin 74.1 54.1 37.1% 148.6 102.1 45.6%
Contribution margin (excl. SBC*) 74.4 54.2 37.2% 149.0 102.3 45.7%
% of Revenue 30.3% 28.7% 1.6pp 30.7% 27.8% 3.1pp
Marketing expenses (62.6) (47.9) 30.9% (157.0) (104.4) 50.3%
% of Revenue (25.5%) (25.3%) (0.2pp) (32.4%) (28.3%) (4.1pp)
Marketing expenses (excl. SBC*) (62.6) (47.7) 31.4% (156.8) (104.1) 50.6%
% of Revenue (25.5%) (25.2%) (0.3pp) (32.3%) (28.3%) (4.0 pp)
General and administrative expenses, other income and expenses (9.2) (9.3) (1.1%) (17.5) (15.8) 10.9%
% of Revenue (3.7%) (4.9%) 1.2pp (3.6%) (4.3%) 0.7 pp
General and administrative expenses, other income and expenses (excl. SBC*) (8.7) (8.9) (2.6%) (16.6) (15.3) 8.9%
% of Revenue (3.5%) (4.7%) 1.2pp (3.4%) (4.1%) 0.7pp
Operating profit/ (loss) 2.3 (3.1) nm (25.9) (18.1) 42.8%
% of Revenue 0.9% (1.6%) 2.5pp (5.3%) (4.9%) (0.4 pp)
EBITDA 5.8 (1.3) nm (17.8) (15.3) (16.3%)
% of Revenue 2.4% (0.7%) 3.1pp (3.7%) (4.2%) 0.5 pp
AEBITDA 7.1 (0.3) nm (15.5) (14.0) (10.7%)
% of Revenue 2.9% (0.2%) 3.1pp (3.2%) (3.8%) 0.6pp
*EXCLUDING SHARE-BASED COMPENSATION EXPENSES
Revenue of our US Segment increased from MEUR 368.3 in H1 of 2018 to MEUR 485.0 in H1 of 2019, representing an annual growth rate of 31.7% (22.8% on a constant currency basis), driven by growth in active customers from 1.12 million in 2018 to 1.35 million in 2019 and a corresponding trend in meals delivered.
Contribution margin of the US Segment, excluding share-based compensation expenses, increased from MEUR 102.3 in H1 2018 to MEUR 149.0 in H1 2019 representing an annual growth of 45.7%. As a percentage of revenue,
12

HelloFresh SEINTERIM REPORT 2019
Interim Group Management Report Position Of The Group
it expanded from 27.8% in H1 2018 to 30.7% in H1 2019. The financial improvements have come on the back of efficiencies in our menu planning and procurement operations, partly offset by a relative increase in fulfilment expenses, due, in part, to the ramp up of our two more recent US businesses EveryPlate and Green Chef.
Marketing expenses (excl. share-based compensation) in absolute terms has increased to MEUR 156.8 in 2019 compared with MEUR 104.1 in 2018; as a percentage of revenue it has increased by 4.0 percentage points from 28.3% in H1 2018 to 32.3% in H1 2019. This is primarily due to our US business capitalizing on the oppor-tunity to acquire many new customers to all three US brands in Q1 2019; in Q2 2019, marketing expenses as a percentage of revenue are substantially stable at 25.5%, compared to the same period last year.
The increase in contribution margin more than offsets the increase in marketing expenses as a percentage of revenue which resulted in an improvement in EBITDA margin from (4.2%) in 2018 to (3.7%) in the first half of 2019, corresponding to an EBITDA of MEUR (17.8). AEBITDA margin improved from (3.8%) in 2018 to (3.2%) this year, corresponding to an AEBITDA of MEUR (15.5).
Q2 2019 marks the first quarter for our US operations, when the whole segment, including the more recent businesses Green Chef and EveryPlate, has been positive on the AEBITDA, EBITDA and EBIT level, with an AEBITDA margin of 2.9%.
3.4.2 Financial Performance of International Segment
In MEURFor the three months
ended 30 JuneFor the six months
ended 30 June
2019 2018 YoY 2019 2018 YoY
Revenue (total) 191.5 130.8 46.3% 372.0 246.9 50.7%
Revenue (external) 191.3 130.8 46.3% 371.7 246.9 50.6%
Procurement expenses (78.5) (53.9) 45.8% (154.0) (103.7) 48.6%
% of Revenue (41.0%) (41.2%) 0.2 pp (41.4%) (42.0%) 0.6 pp
Fulfillment expenses (59.8) (41.7) 43.2% (117.3) (78.8) 48.7%
% of Revenue (31.2%) (31.9%) 0.7 pp (31.5%) (31.9%) 0.4 pp
Contribution margin 53.2 35.2 50.8% 100.7 64.4 56.5%
Contribution margin (excl. SBC*) 53.3 35.5 49.9% 101.1 65.0 55.8%
% of Revenue 27.8% 27.1% 0.7 pp 27.2% 26.3% 0.9 pp
Marketing expenses (28.6) (25.0) 14.5% (65.1) (51.6) 26.2%
% of Revenue (15.0%) (19.1%) 4.1 pp (17.5%) (20.9%) 3.4 pp
Marketing expenses (excl. SBC*) (28.5) (24.9) 14.6% (64.9) (51.5) 26.2%
% of Revenue (14.9%) (19.1%) 4.2 pp (17.5%) (20.9%) 3.4 pp
General and administrative expenses, other income and expenses (20.4) (7.3) 179.7% (35.5) (12.7) 181.5%
% of Revenue (10.6%) (5.6%) (5.0 pp) (9.6%) (5.1%) (4.4 pp)
13

INTERIM REPORT 2019HelloFresh SE
Interim Group Management Report Position Of The Group
Revenue of our International Segment increased from MEUR 246.9 in H1 2018 to MEUR 372.0 in H1 2019, repre-senting an annual growth rate of 50.6% (48.8% on a constant currency basis), in line with our growth in active customers from 0.72 million in 2018 to 1.06 million in 2019 and a corresponding trend in meals delivered.
Contribution margin of our International Segment, excluding share-based compensation, increased in H1 from MEUR 65.0 in 2018 to MEUR 101.1 in 2019. On a relative basis, as a percentage of revenue, contribution margin increased from 26.3% in 2018 to 27.2% in 2019. This is largely driven by efficiencies realized in both, our fulfill-ment processes and our procurement operations.
Marketing spending (excl. share-based compensation) decreased meaningfully as percentage of revenue from 20.9% in H1 2018 to 17.5% in H1 2019, as customer acquisition costs have been attractive in most Intl markets and positive leverage from our growing basis of existing customers is materializing, despite the ramp-up of New Zealand as a new geography.
EBITDA of our International segment increased from MEUR 1.8 in 2018 to MEUR 28.1 in 2019. AEBITDA increased from MEUR 4.3 in 2018 to MEUR 30.0 in 2019. AEBITDA margin improved from 1.8% in H1 2018 to 8.1% in H1 2019 and reached an 11.4% margin in Q2 2019.
Overall Statement Regarding the Earnings, Financial and Asset Position of the Group
The H1 reporting period was characterized by continued robust year-on-year growth, where both segments have shown positive growth dynamics. At the same time, we continuously expand our margin profile; especially the fact that HelloFresh was profitable for the first time on the EBIT, EBITDA and AEBITDA levels for the Group and for each operating segment for the first time in Q2 2019 illustrate the achievements reached so far.
Overall, we are satisfied with the progress made in H1 2019 and we consider ourselves in a good position to further expand the global leadership position in our category by growing year-on-year revenues and margins in the 2nd half of 2019.
In MEURFor the three months
ended 30 JuneFor the six months
ended 30 June
General and administrative expenses, other income and expenses (excl. SBC* and holding fees) (8.9) (6.3) 40.5% (16.5) (11.8) 39.4%
% of Revenue (4.6%) (4.8%) 0.2 pp (4.4%) (4.7%) 0.3 pp
Operating profit/(loss) 4.2 2.9 44.8% 0.1 0.1 (0.0%)
% of Revenue 2.2% 2.2% 0.0 pp 0.0% 0.1% (0.1 pp)
EBITDA** 20.3 4.1 407.3% 28.1 1.8 966.8%
% of Revenue 10.6% 3.1% 7.5 pp 7.6% 0.7% 6.4 pp
AEBITDA 21.9 5.4 305.6% 30.0 4.3 593.3%
% of Revenue 11.4% 4.1% 7.3 pp 8.1% 1.8% 6.3 pp
*EXCLUDING SHARE-BASED COMPENSATION EXPENSES**EXCLUDING HOLDING FEE
14

HelloFresh SEINTERIM REPORT 2019
Interim Group Management Report Risk and Opportunity Report | Outlook
4 RISK AND OPPORTUNITY REPORT
As a globally operating enterprise, the HelloFresh group is exposed to a broad range of risks and opportunities. HelloFresh regularly reviews the exposure of opportunities and risks for the Group, as described in detail in the Annual Report 2018.
Compared with the overall risk situation presented in the Group Management Report 2018, we have identified an additional risk of a potential global recession, which would also highly impact the company’s growth and profitability. Taking all known circumstances into account, we did not identify any risks that could jeopardize the going concern of the HelloFresh Group.
5 OUTLOOK
5.1 Economic conditions
As compared with the economic outlook from January 2019, the IMF slightly eased its forecast of the global economy growth in 2019 from 3.5% to 3.2%. Despite the projected slowdown, the IMF predicts that growth will level up into 2020 as a result of improvements in global financial market sentiment and the waning of temporary drags in euro area growth (1). The OECD similarly predicts a reversal of the temporary slowdown, with projected growth rate improving into 2020 (2).
The US economy experienced strong growth in the first quarter of 2019. The IMF predicts that growth will ease from 2.9% in 2018 to 2.6% in 2019, but still continue to outperform other developed countries. Consumer spending is supported by vigorous job creation and a historically low unemployment rate. Consumer and business confidence remain high and financial conditions are supportive (2).
According to the IMF, Eurozone economic growth in 2019 is expected to be moderate at approximately 1.3%, down from 1.8% in 2018 (2). Domestic demand however remains strong and the main engine of growth, supported by stronger wages across the region and a declining in unemployment rate (1).
Growth of the Australian economy is expected to continue at a steady pace and remain robust at 2.3%. Growth of the Canadian economy is expected to pick up in the second half of 2019, approaching 2.0% by 2020.
5.2 Guidance
Based on the robust business development in the first half of the year, HelloFresh is comfortable to narrow its previously provided 2019 guidance for the Group towards the upper end:
- Previously we provided guidance for constant currency revenue growth on a yearly basis to be within the range of 25 – 30%. We narrow this guidance to 28 – 30%- Previously we provided guidance for 2019 contribution margin to be better than 27%. We narrow this guidance to 28 – 29%- Previously we provided guidance for the Group AEBITDA margin of negative (2) % to positive 1%. We narrow this guidance to negative (1) % to positive 1%.
The outlook presented above is based on a constant currency basis and does not consider the impact of changes in the competitive environment, potential exchange rate fluctuations or any acquisition activity.
1 International Monetary Fund “World Economic Outlook: Still Sluggish Global Growth” (update July 2019) https://www.imf.org/en/Publications/WEO/Issues/2019/07/18/WEOupdateJuly20192 Organization for Economic Co-operation and Development, “OECD Economic Outlook and Interim Economic Outlook” (May 2019),
http://www.oecd.org/eco/outlook/economic-outlook/
15

INTERIM REPORT 2019HelloFresh SE
B INTERIM CONDENSED CONSOLIDATED FINANCIAL STATEMENTS
INTERIM CONDENSED CONSOLIDATED STATEMENT OF FINANCIAL POSITION ..................17
INTERIM CONDENSED CONSOLIDATED STATEMENT OF COMPREHENSIVE INCOME..........19
INTERIM CONDENSED CONSOLIDATED STATEMENT OF CHANGES IN EQUITY ...................20
INTERIM CONDENSED CONSOLIDATED STATEMENT OF CASH FLOWS .................................21
EXPLANATORY NOTES TO THE INTERIM CONDENSED CONSOLIDATED FINANCIAL STATEMENT ..22
1 Corporate Information ..................................................................................................................22
2 Basis of Accounting .......................................................................................................................22
3 Significant Accounting Judgements, Estimates and Assumptions .................................................23
4 Summary of Significant Accounting Policies .................................................................................23
5 Segment Information ....................................................................................................................25
6 Seasonality of the operations .......................................................................................................26
7 Financial Instruments ...................................................................................................................26
8 Share Capital and Capital Reserves ...............................................................................................27
9 Share-Based Compensation ..........................................................................................................28
10 Income Taxes ................................................................................................................................28
11 Loss per Share ..............................................................................................................................28
12 Transactions with Related Parties .................................................................................................29
13 Events after the Reporting Period .................................................................................................29
RESPONSIBILITY STATEMENT BY THE MANAGEMENT BOARD ................................................30
AUDITOR REVIEW REPORT ............................................................................................................31
GLOSSARY ........................................................................................................................................32
FINANCIAL CALENDAR 2019 ..........................................................................................................34
IMPRINT ..............................................................................................................................................35
16

HelloFresh SEINTERIM REPORT 2019
Interim Condensed Consolidated Statement Of Financial Position
INTERIM CONDENSED CONSOLIDATED STATEMENT OF FINANCIAL POSITION
In MEUR Note 30 June 2019 31 December 2018
Assets
Non-current assets
Property, plant and equipment 149.9 62.4
Intangible assets 13.5 12.3
Goodwill 48.4 46.9
Other financial assets 7 21.8 19.5
Other non-financial assets 0.8 0.9
Deferred income tax assets 1.6 1.7
Total non-current assets 236.0 143.7
Current assets
Inventories 29.7 22.5
Trade receivables 7 13.3 8.6
Other financial assets 7 7.0 5.3
Other non-financial assets 20.0 22.1
Cash and cash equivalents 7 164.4 193.9
Total current assets 234.4 252.4
Total assets 470.4 396.1
17
INTERIM REPORT 2019HelloFresh SE
Interim Condensed Consolidated Statement Of Financial Position
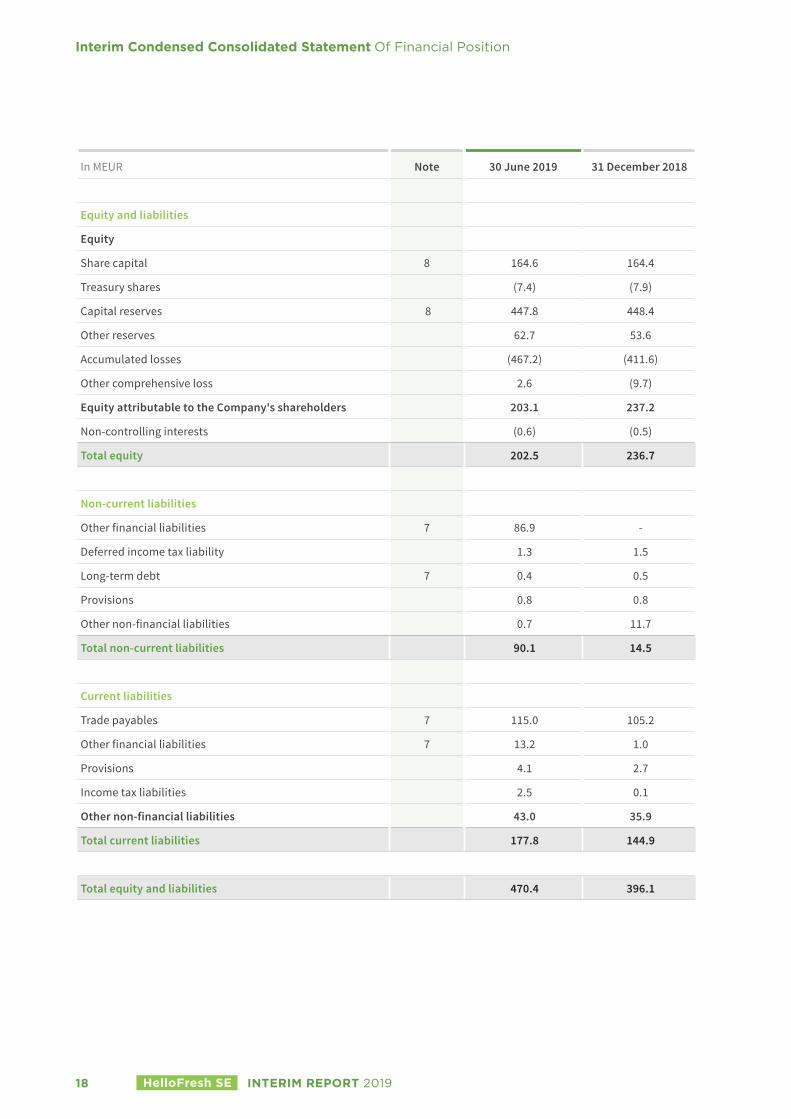
In MEUR Note 30 June 2019 31 December 2018
Equity and liabilities
Equity
Share capital 8 164.6 164.4
Treasury shares (7.4) (7.9)
Capital reserves 8 447.8 448.4
Other reserves 62.7 53.6
Accumulated losses (467.2) (411.6)
Other comprehensive loss 2.6 (9.7)
Equity attributable to the Company's shareholders 203.1 237.2
Non-controlling interests (0.6) (0.5)
Total equity 202.5 236.7
Non-current liabilities
Other financial liabilities 7 86.9 -
Deferred income tax liability 1.3 1.5
Long-term debt 7 0.4 0.5
Provisions 0.8 0.8
Other non-financial liabilities 0.7 11.7
Total non-current liabilities 90.1 14.5
Current liabilities
Trade payables 7 115.0 105.2
Other financial liabilities 7 13.2 1.0
Provisions 4.1 2.7
Income tax liabilities 2.5 0.1
Other non-financial liabilities 43.0 35.9
Total current liabilities 177.8 144.9
Total equity and liabilities 470.4 396.1
18

HelloFresh SEINTERIM REPORT 2019
Interim Condensed Consolidated Statement Of Comprehensive Income
INTERIM CONDENSED CONSOLIDATED STATEMENT OF COMPREHENSIVE INCOME
In MEUR APR 1 - JUN 30 JAN 1 - JUN 30
Note 2019 2018 2019 2018
Revenue 5 436.7 319.7 856.7 615.2
Procurement expenses (153.9) (117.9) (305.9) (234.0)
Fulfilment expenses (156.2) (113.0) (303.0) (215.7)
Marketing expenses (92.6) (74.3) (224.7) (158.3)
General and administrative expenses (31.4) (26.1) (61.0) (44.9)
Other operating income 0.7 0.3 2.5 0.7
Other operating expenses (2.0) (2.30) (3.70) (4.50)
Operating income (loss) 1.3 (13.6) (39.1) (41.5)
Finance income 0.20 0.9 3.4 1.4
Finance expense (4.8) (0.4) (12.4) (2.0)
Loss before income tax benefit (expense) (3.3) (13.1) (48.1) (42.1)
Income tax expense 10 (1.5) (2.1) (2.9) (2.9)
Loss for the period (4.8) (15.2) (51.0) (45.0)
attributable to:
Owners of the Company (4.8) (15.2) (50.9) (44.9)
Non-controlling interests - - (0.1) (0.1)
Other comprehensive income (loss):
Items that may be subsequently reclassified to profit or loss
Exchange differences on translation to presentation currency 4.9 (8.5) 0.2 (4.6)
Exchange differences on net investments in foreign operations (2.7) 8.8 12.0 4.5
Other comprehensive income (loss) for the year 2.2 0.3 12.2 (0.1)
Total comprehensive loss for the year (2.6) (14.9) (38.8) (45.1)
Total comprehensive loss attributable to:
Owners of the Company (2.6) (14.8) (38.7) (45.0)
Non-controlling interests - (0.1) (0.1) (0.1)
Earnings per Share of HelloFresh SE
Basic loss per share (0.03) (0.10) (0.31) (0.28)
19

INTERIM REPORT 2019HelloFresh SE
Interim Condensed Consolidated Statement Of Changes in Equity
INTERIM CONDENSED CONSOLIDATED STATEMENT OFCHANGES IN EQUITY
Attributable to the owners of the Company
In MEUR Not
e
Shar
e ca
pita
l
Trea
sury
shar
es
Capi
tal r
eser
ves
Oth
er re
serv
es
Accu
mul
ated
lo
sses
Oth
er
com
preh
ensi
ve
(loss
) inc
ome
Tota
l
Attr
ibut
able
to
non-
cont
rolli
ng
inte
rest
s
Tota
l
As at 1 January 2018 161.0 (10.0) 442.2 40.2 (329.1) (1.9) 302.4 (0.2) 302.2
Loss for the period (44.9) (44.9) (0.1) (45.0)
Currency translation (0.1) (0.1) (0.1)
Total comprehensive loss (45.0) (0.1) (45.1)
Issue of share capital 0.6 1.0 (0.9) 0.7 0.7
Share-based compensation 8.6 8.6 8.6
Balance as at 30 June 2018 161.6 (9.0) 441.3 48.8 (374.0) (2.0) 266.7 (0.3) 266.4
Balance as at 31 December 2018 as originally presented
164.4 (7.9) 448.4 53.6 (411.6) (9.7) 237.2 (0.5) 236.7
Changes due to adjustments in accordance with IAS 21 related to prior periods
(4.6) (4.6) (4.6)
Restated total equity as at 1 January 2019 164.4 (7.9) 448.4 53.6 (416.2) (9.7) 232.6 (0.5) 232.1
Loss for the period (51.0) (51.0) (0.1) (51.1)
Currency translation 12.3 12.3 12.3
Total comprehensive loss (38.7) (0.1) (38.8)
Issue of share capital 0.2 0.5 (0.6) 0.1 0.1
Share-based compensation 9.1 9.1 9.1
Balance as at 30 June 2019 164.6 (7.4) 447.8 62.7 (467.2) 2.6 203.1 (0.6) 202.5
20
HelloFresh SEINTERIM REPORT 2019
Interim Condensed Consolidated Statement Of Cash Flows
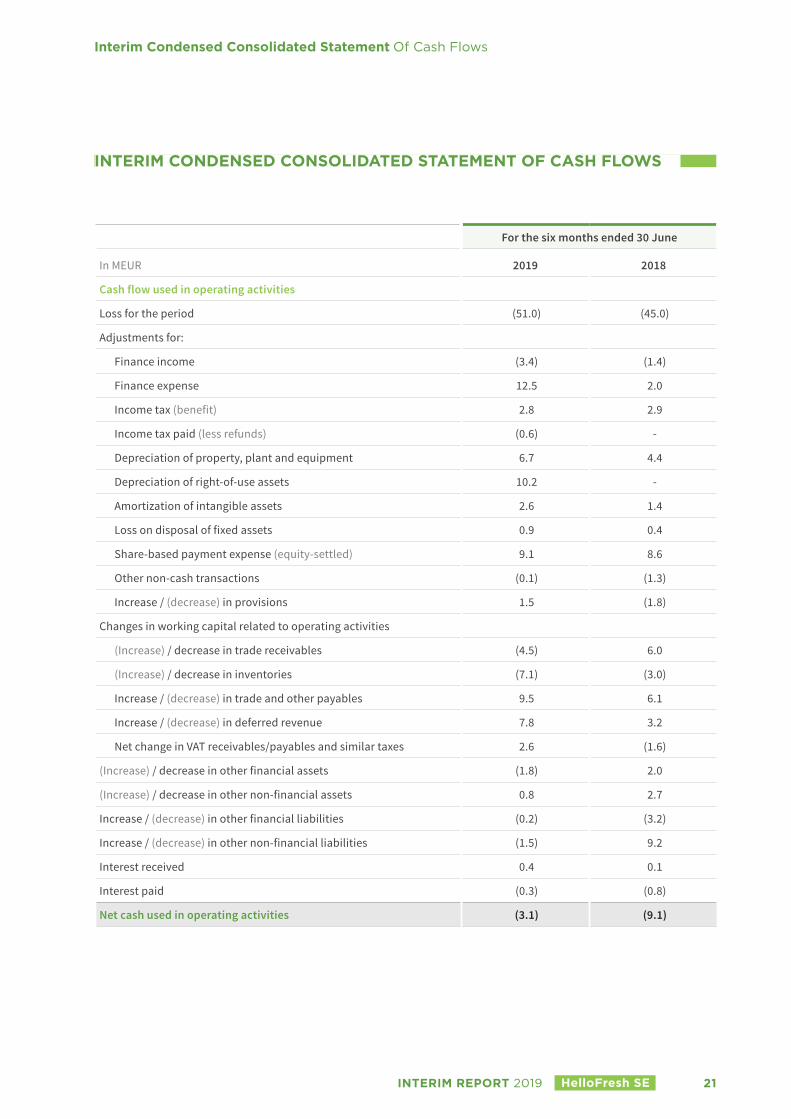
INTERIM CONDENSED CONSOLIDATED STATEMENT OF CASH FLOWS
For the six months ended 30 June
In MEUR 2019 2018
Cash flow used in operating activities
Loss for the period (51.0) (45.0)
Adjustments for:
Finance income (3.4) (1.4)
Finance expense 12.5 2.0
Income tax (benefit) 2.8 2.9
Income tax paid (less refunds) (0.6) -
Depreciation of property, plant and equipment 6.7 4.4
Depreciation of right-of-use assets 10.2 -
Amortization of intangible assets 2.6 1.4
Loss on disposal of fixed assets 0.9 0.4
Share-based payment expense (equity-settled) 9.1 8.6
Other non-cash transactions (0.1) (1.3)
Increase / (decrease) in provisions 1.5 (1.8)
Changes in working capital related to operating activities
(Increase) / decrease in trade receivables (4.5) 6.0
(Increase) / decrease in inventories (7.1) (3.0)
Increase / (decrease) in trade and other payables 9.5 6.1
Increase / (decrease) in deferred revenue 7.8 3.2
Net change in VAT receivables/payables and similar taxes 2.6 (1.6)
(Increase) / decrease in other financial assets (1.8) 2.0
(Increase) / decrease in other non-financial assets 0.8 2.7
Increase / (decrease) in other financial liabilities (0.2) (3.2)
Increase / (decrease) in other non-financial liabilities (1.5) 9.2
Interest received 0.4 0.1
Interest paid (0.3) (0.8)
Net cash used in operating activities (3.1) (9.1)
21

INTERIM REPORT 2019HelloFresh SE
Interim Condensed Consolidated Statement Of Cash Flows
For the six months ended 30 June
In MEUR 2019 2018
Cash flow used in investing activities
Acquisition of subsidiary, net of cash acquired 0.3 (10.9)
Purchase of property, plant and equipment (11.4) (7.2)
Software development expenditure (3.0) (1.5)
Purchase of intangible assets (1.0) (0.1)
Proceeds from disposal of PPE & intangibles 2.5 -
(Transfer) Withdrawal of cash into / from restricted cash accounts and long-term deposits (2.5) (4.7)
Net cash used in investing activities (15.1) (24.4)
Cash flow from financing activities
Proceeds from the issuance of share capital - 0.6
Repayment of Lease Liabilities (IFRS 16) (11.6) -
Net cash from financing activities (11.6) 0.6
Cash and cash equivalents at the beginning of the period 193.9 339.9
Effects of exchange rate changes and other changes on cash and cash equivalents 0.3 0.6
Cash and cash equivalents at the end of the period 164.4 307.6
EXPLANATORY NOTES TO THE INTERIM CONDENSED CONSOLIDATED FINANCIAL STATEMENTS
1 Corporate Information
The accompanying interim consolidated financial statements and notes present the operations of HelloFresh SE (the “Company” or “parent”), and its subsidiaries (combined the “Group” or “HelloFresh”). HelloFresh SE is a European company (Societas Europaea or SE) incorporated in Germany and governed by European and German Law. The company is domiciled in Germany with its registered office at Saarbrücker Strasse 37a, 10405 Berlin and is registered in the commercial register of Charlottenburg (Berlin) under HRB 182382 B.
The Group’s principal business activity is to provide fresh, healthy and personalized meal solutions to enable customers to prepare home-cooked meals each week using HelloFresh’s recipes.
2 Basis of Accounting
The Group’s interim consolidated financial statements are prepared in accordance with International Financial Reporting Standards (IFRS) as issued by the International Accounting Standards Board (IASB) and adopted by the European Union (EU) and the additional requirements of German commercial law pursuant to Sec. 315e (1) HGB.
22

HelloFresh SEINTERIM REPORT 2019
Interim Condensed Consolidated Statements Explanatory Notes
The interim consolidated financial statements are prepared in Euro (EUR), which represents the functional currency of HelloFresh SE. All amounts have been rounded to the nearest million with a fractional digit (MEUR), unless otherwise indicated. Consequently, rounding differences may occur within the tables included in the notes to the consolidated financial statements. The percentages have been calculated on the basis of the non-rounded euro amounts.
These interim financial statements have been prepared in accordance with IAS 34 Interim Financial Reporting as adopted by the EU and should be read in conjunction with the Group’s last annual consolidated financial statements as at and for the year ended 31 December 2018. Selected explanatory notes are included to explain events and transactions that are significant to an understanding of the changes in the Group’s financial position and performance since the last annual financial statements.
This is the first year where IFRS 16 has been applied. The effects are described in NOTE 4 . These interim financial statements were authorized for issue by the Company’s board 9 August 2019.
3 Significant Accounting Judgements, Estimates and Assumptions
In preparing these interim financial statements, management has made judgements and estimates that affect the application of accounting policies and the reported amounts of assets and liabilities, income and expense. Actual results may differ from these estimates. The significant judgements made by management in applying the Group’s accounting policies and the key sources of estimation uncertainty were the same as those described in the last annual financial statements, except for the new significant judgements related to lessee accounting under IFRS 16, which are described in NOTE 4 .
4 Summary of Significant Accounting Policies
Except as described below, the accounting policies applied in these interim financial statements are the same as those applied in the Group’s consolidated financial statements as at and for the year ended 31 December 2018.
The Group has initially adopted IFRS 16 Leases from 1 January 2019. A number of other new standards are effective from 1 January 2019 but they do not have a material effect on the Group’s financial statements.
IFRS 16 introduced a single, on-balance sheet accounting model for lessees. As a result, the Group, as a lessee, has recognized right-of-use assets representing its rights to use the underlying assets and lease liabilities repre-senting its obligation to make lease payments.
The Group has applied IFRS 16 using the modified retrospective approach, under which the cumulative effect of initial application is recognized in retained earnings at 1 January 2019. Accordingly, the comparative information presented for 2018 has not been restated – i.e. it is presented, as previously reported.
The Group structures its Statement of Comprehensive Income on a functional basis. For that purpose it breaks its Cost of Sales down into the line items Procurement Expenses and Fulfilment Expenses.
Implementation, classification and measurement of IFRS 16
IFRS 16 replaced IAS 17 Leases, IFRIC 4, SIC-15 and SIC-27 with effect at 1 January 2019. The new Standard IFRS 16 eliminates the classification of leases as either operating leases or finance leases for a lessee.
Under IFRS 16 leases are capitalized by recognizing the present value of the lease payments and showing them as lease assets (right-of-use assets) and lease liability at the lease commencement date
23

INTERIM REPORT 2019HelloFresh SE
Interim Condensed Consolidated Statements Explanatory Notes
The Group leases many assets, including properties like warehouses and offices, as well as cars and equipment. The right-of-use asset is initially measured at cost, and subsequently at cost less any accumulated depreciation and impairment losses and adjusted for certain remeasurements of the lease.
The lease liability is initially measured at the present value of the lease payments that are not paid at the commencement date, discounted using the interest rate implicit in the lease or, if the rate cannot be readily determined, the Group’s incremental borrowing rate. The lease liability is subsequently increased by the interest on the lease liability and decreased by lease payment made.
The initial implementation of the standard reflects on the increase in lease assets and lease liabilities in balance sheet.
HelloFresh does not apply IFRS 16 to all short-term and low value leases.
Impact on transition to IFRS 16
In MEUR 1 January 2019
Right-of use assets presented in property, plant and equipment 85.8
Deferred tax asset 0.2
Lease liabilities 97.2
Retained earnings (11.2)
Operating lease commitment at 31 December 2018 as disclosed in the Group’s consolidated financial statements 114.9
Effect discounting the total lease liability 1 January 2019 (21.2)
Transition effect 2.1
Lease Liability at 1 January 2019 95.8
The difference between the operating lease commitment as at 31 December 2018 and the lease liability as at 1 January 2019 is mainly due to the discounting of the lease liability under IFRS 16. The transition effect of IFRS 16 derives mainly from extension options that are reasonably certain to be exercised and the used recognition exemptions for leases of low-value assets and leases with less than 12 months duration.
As a result of initially applying IFRS 16, in relation to the leases that were previously classified as operating leases, the Group recognized MEUR 87.1 of right-of-use assets and MEUR 99.2 of lease liabilities as at 30 June 2019.
Also, in relation to those leases under IFRS 16, the Group has recognized depreciation and interest costs, instead of operating lease expense. During the six months ended 30 June 2019, the Group recognized MEUR 10.2 of deprecia-tion charges and MEUR 2.9 of interest costs from these leases.
The Group discounted lease payments using its incremental borrowing rate at 1 January 2019. The weighted average rate applied is 6 %.
24

HelloFresh SEINTERIM REPORT 2019
Interim Condensed Consolidated Statements Explanatory Notes
5 Segment Information
The main activity of the Group is the delivery of meal kits to customers in various geographical regions. The business is managed based on two major geographical regions: The United States of America (“USA”) and Interna-tional (“International” or “Int’l”). International comprises Australia, Austria, Belgium, Canada, France, Germany, Luxembourg, the Netherlands, New Zealand, Switzerland and the United Kingdom (“UK”).
Segment information for the six-month period ended 30 June 2019 is set out below:
6-months ended 30 June 2019
In MEUR USA Intenational Total segments Holding Conso Group
Total revenue 485.0 372.0 857.0 51.5 (51.8) 856.7
Internal revenue - 0.3 0.3 51.5 (51.8) -
External revenue 485.0 371.7 856.7 - - 856.7
Contribution Margin (excl. SBC) 149.0 101.1 250.1 48.8 (50.2) 248.7
Adjusted EBITDA (15.5) 30.0 14.5 (22.3) - (7.8)
Special items (0.8) (0.7) (1.5) (0.1) - (1.6)
Share based payment compensation (1.5) (1.3) (2.8) (6.3) - (9.1)
EBITDA (*) (17.8) 28.0 10.2 (28.8) - (18.6)
EBIT (*) (25.9) 18.8 (7.1) (31.9) - (39.1)
Holding Fees - (18.7) (18.7) 18.7 - -
EBITDA (17.8) 9.3 (8.5) (10.1) - (18.6)
Depreciation and amortization (8.1) (9.2) (17.3) (3.2) - (20.5)
EBIT (25.9) 0.1 (25.8) (13.3) - (39.1)
Finance income 2.1 0.5 2.7 4.3 (3.5) 3.4
Finance expense (11.1) (3.6) (14.7) (1.3) 3.5 (12.5)
Income tax expense - (2.8) (2.8) (0.1) - (2.9)
Loss for the period (34.9) (5.8) (40.8) (10.4) - (51.0)
(*) EXCLUDING HOLDING FEE
JAN 1 - JUN 30, 2018
In MEUR USA Intenational Total segments Holding Conso Group
Total revenue 368.3 247.1 615.4 22.4 (22.6) 615.2
Internal revenue - 0.2 0.2 22.4 (22.6) -
External revenue 368.3 246.9 615.2 - - 615.2
Contribution Margin (excl. SBC) 102.3 65.0 167.3 19.8 (20.9) 166.2
Adjusted EBITDA (14.1) 5.3 (8.8) (16.9) - (25.6)
25
INTERIM REPORT 2019HelloFresh SE
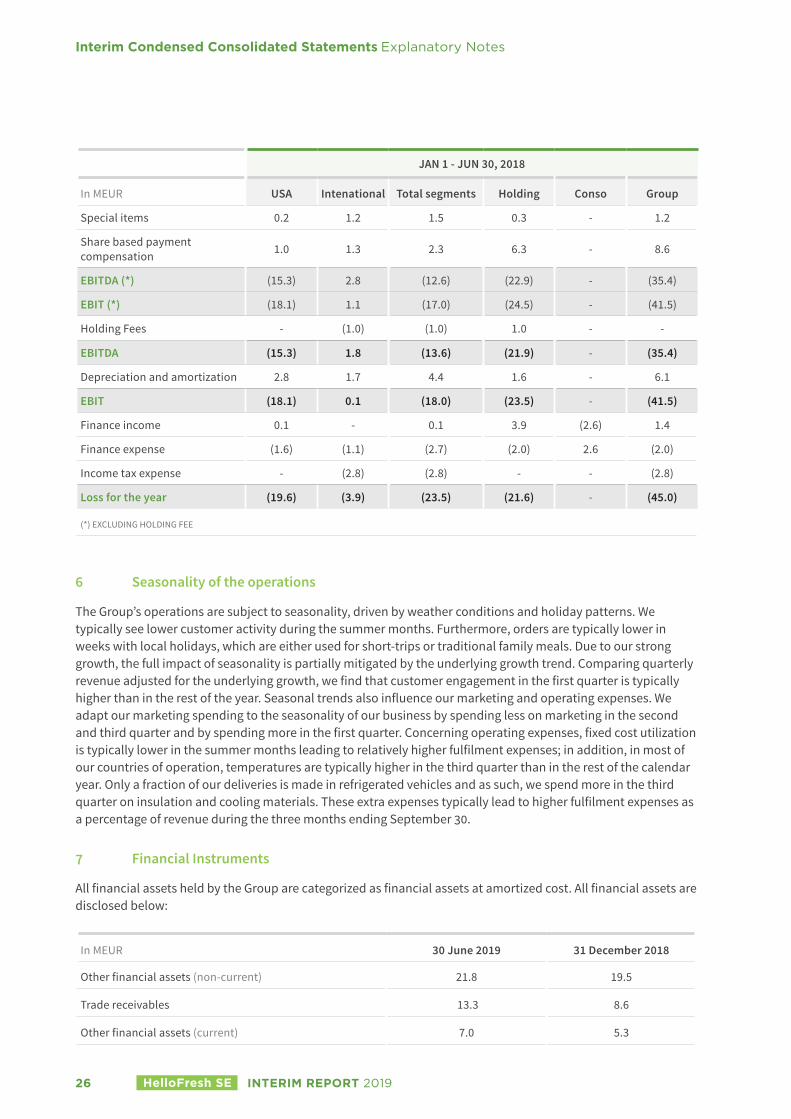
6 Seasonality of the operations
The Group’s operations are subject to seasonality, driven by weather conditions and holiday patterns. We typically see lower customer activity during the summer months. Furthermore, orders are typically lower in weeks with local holidays, which are either used for short-trips or traditional family meals. Due to our strong growth, the full impact of seasonality is partially mitigated by the underlying growth trend. Comparing quarterly revenue adjusted for the underlying growth, we find that customer engagement in the first quarter is typically higher than in the rest of the year. Seasonal trends also influence our marketing and operating expenses. We adapt our marketing spending to the seasonality of our business by spending less on marketing in the second and third quarter and by spending more in the first quarter. Concerning operating expenses, fixed cost utilization is typically lower in the summer months leading to relatively higher fulfilment expenses; in addition, in most of our countries of operation, temperatures are typically higher in the third quarter than in the rest of the calendar year. Only a fraction of our deliveries is made in refrigerated vehicles and as such, we spend more in the third quarter on insulation and cooling materials. These extra expenses typically lead to higher fulfilment expenses as a percentage of revenue during the three months ending September 30.
7 Financial Instruments
All financial assets held by the Group are categorized as financial assets at amortized cost. All financial assets are disclosed below:
In MEUR 30 June 2019 31 December 2018
Other financial assets (non-current) 21.8 19.5
Trade receivables 13.3 8.6
Other financial assets (current) 7.0 5.3
JAN 1 - JUN 30, 2018
In MEUR USA Intenational Total segments Holding Conso Group
Special items 0.2 1.2 1.5 0.3 - 1.2
Share based payment compensation 1.0 1.3 2.3 6.3 - 8.6
EBITDA (*) (15.3) 2.8 (12.6) (22.9) - (35.4)
EBIT (*) (18.1) 1.1 (17.0) (24.5) - (41.5)
Holding Fees - (1.0) (1.0) 1.0 - -
EBITDA (15.3) 1.8 (13.6) (21.9) - (35.4)
Depreciation and amortization 2.8 1.7 4.4 1.6 - 6.1
EBIT (18.1) 0.1 (18.0) (23.5) - (41.5)
Finance income 0.1 - 0.1 3.9 (2.6) 1.4
Finance expense (1.6) (1.1) (2.7) (2.0) 2.6 (2.0)
Income tax expense - (2.8) (2.8) - - (2.8)
Loss for the year (19.6) (3.9) (23.5) (21.6) - (45.0)
(*) EXCLUDING HOLDING FEE
Interim Condensed Consolidated Statements Explanatory Notes
26

HelloFresh SEINTERIM REPORT 2019
In MEUR 30 June 2019 31 December 2018
Cash and cash equivalents 164.4 193.9
Total 206.5 227.3
All financial liabilities are measured at amortized cost and are disclosed below:
In MEUR 30 June 2019 31 December 2018
Other financial liabilities (non-current) 86.9 -
Trade payables 115.0 105.2
Other financial liabilities (current) 13.2 1.0
Long term debt 0.4 0.5
Total 215.5 106.7
The fair values of all financial instruments approximate their carrying amount as most of the financial instru-ments are current. The non-current financial liabilities are almost exclusively the leasing liabilities according to IFRS 16 (MEUR 86.7).
8 Share Capital and Capital Reserves
Ordinary Share capital Capital reserves
Number of shares(in pcs)
Nominal amount (in MEUR)
Additional capital paid in (in MEUR)
Transaction costs (in MEUR)
Total (in MEUR)
At 1 January 2019 164,391,607 164.4 458.2 (9.8) 448.4
Issue of ordinary share capital 230,092 0.2 (0.6) (0) (0.6)
At 30 June 2018 164,621,699 164.6 457.6 (9.8) 447.8
The Company’s share capital changed in the first half of 2019 due to capital increases arising from the exercise of employee options.
In March 2019, some of the beneficiaries in connection with the Company’s call options program exercised parts of their vested options. Consequently, the Company’s share capital increased by 230,092 shares to 164,621,699 shares. This capital increase was entered into the commercial register on March 29, increasing the share capital of previously EUR 164,391,607 by a total of EUR 230,092 to EUR 164,621,699.
In addition, the Company settled certain exercised options through treasury shares, which resulted in a decrease of capital reserve in the amount of MEUR 0.6.
Interim Condensed Consolidated Statements Explanatory Notes
27
INTERIM REPORT 2019HelloFresh SE
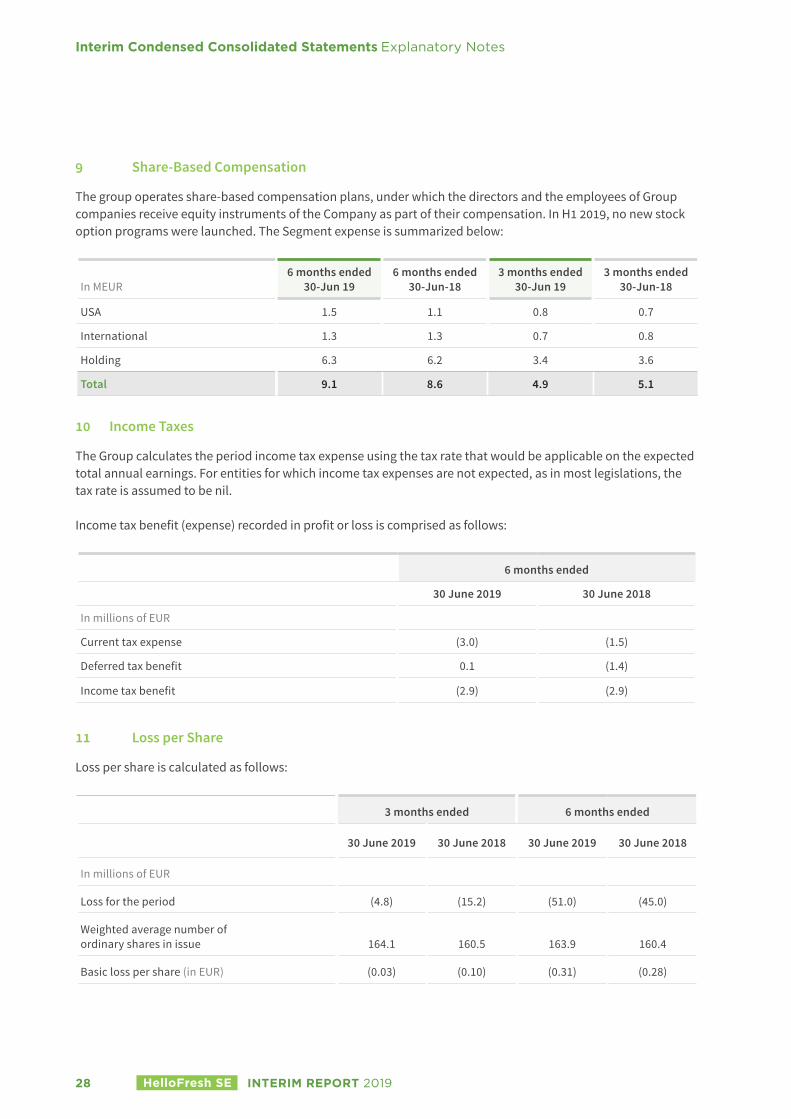
9 Share-Based Compensation
The group operates share-based compensation plans, under which the directors and the employees of Group companies receive equity instruments of the Company as part of their compensation. In H1 2019, no new stock option programs were launched. The Segment expense is summarized below:
In MEUR6 months ended
30-Jun 196 months ended
30-Jun-183 months ended
30-Jun 193 months ended
30-Jun-18
USA 1.5 1.1 0.8 0.7
International 1.3 1.3 0.7 0.8
Holding 6.3 6.2 3.4 3.6
Total 9.1 8.6 4.9 5.1
10 Income Taxes
The Group calculates the period income tax expense using the tax rate that would be applicable on the expected total annual earnings. For entities for which income tax expenses are not expected, as in most legislations, the tax rate is assumed to be nil.
Income tax benefit (expense) recorded in profit or loss is comprised as follows:
6 months ended
30 June 2019 30 June 2018
In millions of EUR
Current tax expense (3.0) (1.5)
Deferred tax benefit 0.1 (1.4)
Income tax benefit (2.9) (2.9)
11 Loss per Share
Loss per share is calculated as follows:
3 months ended 6 months ended
30 June 2019 30 June 2018 30 June 2019 30 June 2018
In millions of EUR
Loss for the period (4.8) (15.2) (51.0) (45.0)
Weighted average number of ordinary shares in issue 164.1 160.5 163.9 160.4
Basic loss per share (in EUR) (0.03) (0.10) (0.31) (0.28)
Interim Condensed Consolidated Statements Explanatory Notes
28

HelloFresh SEINTERIM REPORT 2019
12 Transactions with Related Parties
As of 30 June 2019, generally no new transactions occurred with related parties compared with the disclosures of transactions reported in the consolidated financial statements as of 31 December 2018.
13 Events after the Reporting Period
In July 2019 a cash capital increase was implemented at HelloFresh’s subsidiary HelloFresh Go GmbH in the course of which three external investors contributed cash payments against the issuance of new HelloFresh Go GmbH shares. As a consequence HelloFresh will no longer control HelloFresh Go GmbH and therefore record the entity through “at equity” accounting and not full consolidation going forward; the transaction will trigger a one-off non-cash accounting gain of c. MEUR 23, which will be recorded in HelloFresh’s Q3 financial results; EBIT, EBITDA and AEBITDA will not be affected by this transaction.
Berlin, 9 August 2019
Dominik S. RichterChief Executive Officer
Thomas W. GrieselChief Operating Officer and Chief Executive Officer International
Christian Gaertner Chief Financial Officer
Interim Condensed Consolidated Statements Explanatory Notes
29
INTERIM REPORT 2019HelloFresh SE
RESPONSIBILITY STATEMENT BY THE MANAGEMENT BOARD
To the best of our knowledge, and in accordance with the applicable reporting principles for interim financial reporting, the interim consolidated financial statements give a true and fair view of the assets, liabilities, financial position, and profit or loss of the Group, and the interim Group management report, includes a fair review of the development and performance of the business and the position of the Group, together with a description of the material opportunities and risks associated with the expected development of the Group for the remaining months of the financial year.
Berlin, 9 August 2019
Dominik S. RichterChief Executive Officer
Thomas W. GrieselChief Operating Officer and Chief Executive Officer International
Christian Gaertner Chief Financial Officer
C FURTHER INFORMATION
Further Information Responsibility Statement by the Management Board
30

HelloFresh SEINTERIM REPORT 2019
AUDITOR REVIEW REPORT
To HelloFresh SE, Berlin
We have reviewed the condensed interim consolidated financial statements of HelloFresh SE, Berlin – comprising Interim condensed Consolidated Statement of Financial Position, Interim condensed Consolidated Statement of Comprehensive Income, Interim condensed Consolidated Statement of Changes in Equity, Interim condensed Consolidated Statement of Cash Flows and Explanatory Notes – together with the interim group management report of HelloFresh SE, for the period from January 1, 2019 to June 30, 2019 that are part of the semi annual financial report according to Section 115 WpHG [“Wertpapierhandelsgesetz“: “German Securities Trading Act”]. The preparation of the condensed interim consolidated financial statements in accordance with International Accounting Standard IAS 34 “Interim Financial Reporting” as adopted by the EU, and of the interim group management report in accordance with the requirements of the WpHG applicable to interim group management reports, is the responsibility of the Company’s management. Our responsibility is to issue a report on the condensed interim consolidated financial statements and on the interim group management report based on our review.
We performed our review of the condensed interim consolidated financial statements and the interim group management report in accordance with the German generally accepted standards for the review of financial statements promulgated by the Institut der Wirtschaftsprüfer (IDW). Those standards require that we plan and perform the review so that we can preclude through critical evaluation, with a certain level of assurance, that the condensed interim consolidated financial statements have not been prepared, in material respects, in accord-ance with IAS 34, “Interim Financial Reporting” as adopted by the EU, and that the interim group management report has not been prepared, in material respects, in accordance with the requirements of the WpHG applicable to interim group management reports. A review is limited primarily to inquiries of company employees and analytical assessments and therefore does not provide the assurance attainable in a financial statement audit. Since, in accordance with our engagement, we have not performed a financial statement audit, we cannot issue an auditor’s report.
Based on our review, no matters have come to our attention that cause us to presume that the condensed interim consolidated financial statements have not been prepared, in material respects, in accordance with IAS 34, “Interim Financial Reporting” as adopted by the EU, or that the interim group management report has not been prepared, in material respects, in accordance with the requirements of the WpHG applicable to interim group management reports.
Berlin, August 9, 2019
KPMG AGWirtschaftsprüfungsgesellschaft [Original German version signed by:]
SternbergWirtschaftsprüfer[German Public Auditor]
MarschnerWirtschaftsprüferin[German Public Auditor]
Further Information Auditor Review Report
31

INTERIM REPORT 2019HelloFresh SE
GLOSSARY
Active CustomersActive customers refer to the number of uniquely identified customers who received at least one box within the preceding three months (including first-timers and trial customers, customers who received a discounted box and customers who ordered during the relevant period but discontinued their orders and registration with us before period end) counted from the end of the relevant period.
Adjusted EBITWe define adjusted EBIT as EBIT before share-based compensation expense, holding fees and other non-operat-ing one-time effects („special items”).
Adjusted EBITDAWe define adjusted EBITDA as EBITDA before share-based compensation expenses, holding fees and other non-operating one-time effects („special items”).
AppsApplications that were developed to optimize internet use for a specific task with a mobile phone or smartphone.
Average Order ValueAverage order value is calculated as the total revenue divided by the number of active customers in the corresponding period.
Constant CurrencyRevenue denominated in a currency other that the euro for a given month and the corresponding month in the prior year is translated into euro by using the average exchange rate for the respective month in the prior year for both periods.
Contribution MarginContribution Margin is defined as the Revenue less procurement expenses and fulfilment costs.
Corporate Responsibility Corporate Responsibility (CR) is a business approach that takes responsibility for social and environmental impacts resulting out of company activity. The goal is to create long-term value for shareholders, other stakeholders and communities by embracing the opportunities associated with economic, environmental and social developments.
Procurement Expenses Procurement expenses consist of the purchase price paid to suppliers for ingredients, salaries of ingredient procurement personnel and inbound shipping charges.
EBITEBIT is short for earnings before Interest and taxes.
EBIT MarginEBIT Margin is EBIT as a percentage of revenue.
EBITDAEBITDA is short for EBIT before depreciation and amortization of property, plant and equipment and intangible assets.
Further Information Glossary
32

HelloFresh SEINTERIM REPORT 2019
EBITDA MarginEBITDA Margin is EBIT as a percentage of revenue.
Free Cash FlowCash flow from operating activities plus cash flow form investing activities (excluding investments in time Fideposits and restricted cash).
Net working Capital We calculate net working capital as the sum of inventories, trade receivables, VAT and similar taxes less trade payables, deferred revenue, VAT and similar taxes.
Number of MealsNumber of meals is defined as the number of individual recipes have been delivered within the corresponding period.
Further Information Glossary
33

INTERIM REPORT 2019HelloFresh SE
FINANCIAL CALENDAR 2019
Publication of Quarterly Financial Statements Q3 2019 and Earnings Call 5 November 2019
Further Information Financial Calendar 2019
34

HelloFresh SEINTERIM REPORT 2019
IMPRINT
Editorial Team and Contact
Hello Fresh SESaarbrückerstraße 37a10405 Berlinwww.hellofreshgroup.com
Investor Relations
Lukas Schunkert / Head of IRir @hellofresh.com
Corporate Communications
Eva Switala/Global Head of [email protected]
Further Information Imprint
35

HelloFresh SE Saarbrücker Strasse 37a
10405 Berlin
HelloFreshgroup.com