hft performance & simulation studiesrnc.lbl.gov/~jhthomas/public/hft/hftsimulationssmall.pdf ·...
TRANSCRIPT
Jim Thomas - LBL 1
HFT Performance & Simulation Studies
A marriage of Intuition, Hand Calculations, and Detailed Geant Simulations
Jim Thomas
Lawrence Berkeley National Laboratory
February 24-25, 2008
Jim Thomas - LBL 2
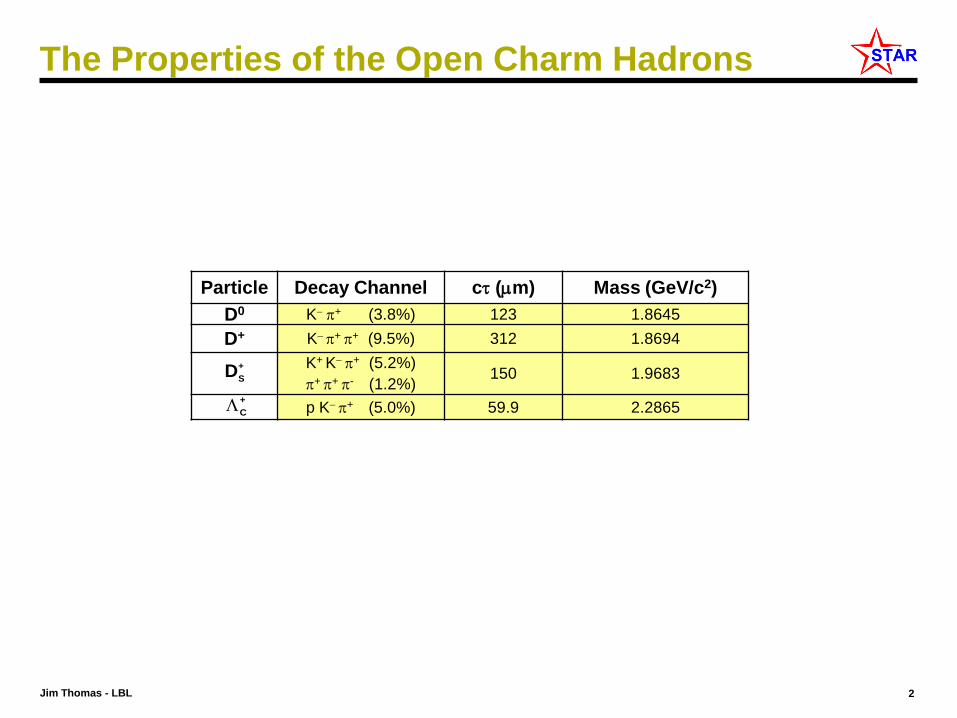
The Properties of the Open Charm Hadrons
Particle Decay Channel c (m) Mass (GeV/c2)
D0 K + (3.8%) 123 1.8645
D+ K + + (9.5%) 312 1.8694
K+ K + (5.2%)
+ + - (1.2%)150 1.9683
p K + (5.0%) 59.9 2.2865
+
SD
+
C
Jim Thomas - LBL 3
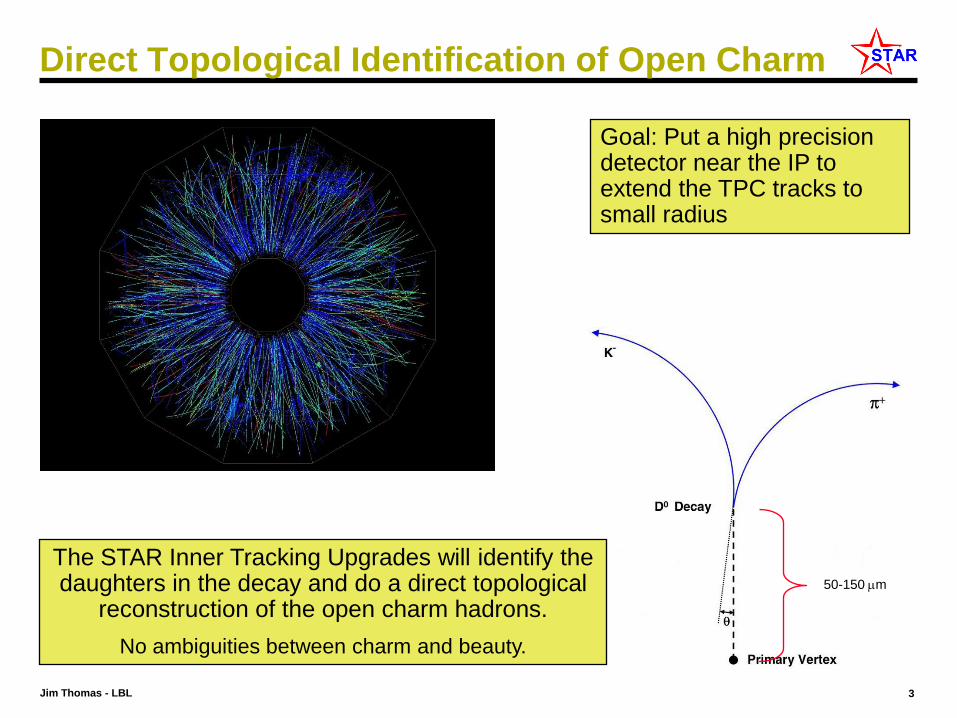
Direct Topological Identification of Open Charm
The STAR Inner Tracking Upgrades will identify the daughters in the decay and do a direct topological
reconstruction of the open charm hadrons.
No ambiguities between charm and beauty.
Goal: Put a high precision detector near the IP to extend the TPC tracks to small radius
50-150 m
Jim Thomas - LBL 4
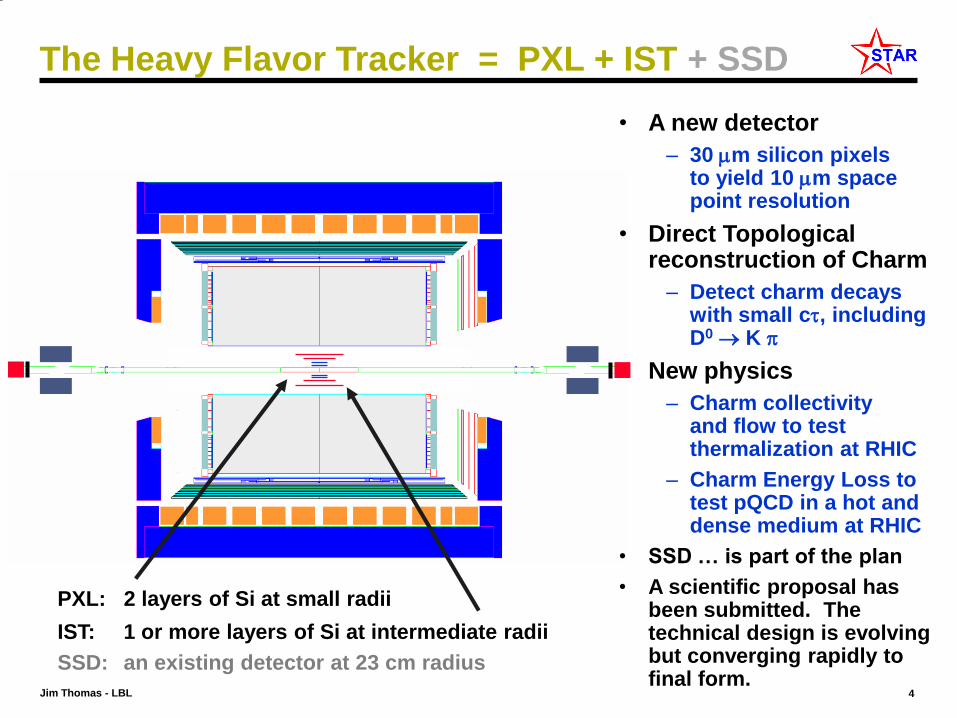
The Heavy Flavor Tracker = PXL + IST + SSD
• A new detector
– 30 m silicon pixelsto yield 10 m space point resolution
• Direct Topological reconstruction of Charm
– Detect charm decays with small c, including D0 K
• New physics
– Charm collectivity and flow to test thermalization at RHIC
– Charm Energy Loss to test pQCD in a hot and dense medium at RHIC
• SSD … is part of the plan
• A scientific proposal has been submitted. The technical design is evolving but converging rapidly to final form.
PXL: 2 layers of Si at small radii
IST: 1 or more layers of Si at intermediate radii
SSD: an existing detector at 23 cm radius
Jim Thomas - LBL 5
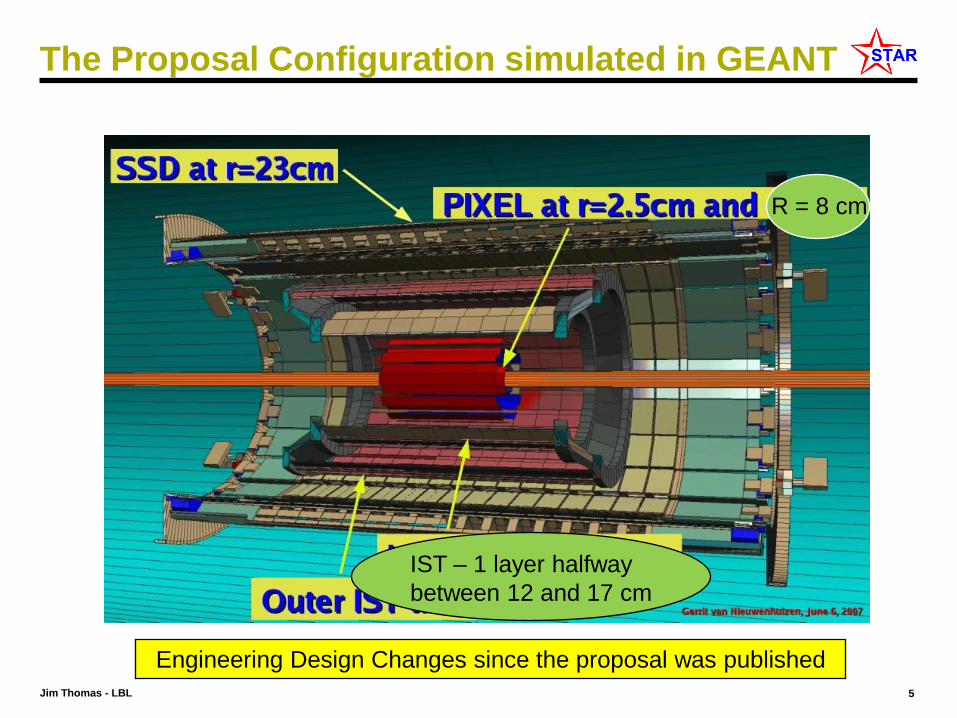
The Proposal Configuration simulated in GEANT
R = 8 cm
IST – 1 layer halfway
between 12 and 17 cm
Engineering Design Changes since the proposal was published
Jim Thomas - LBL 6
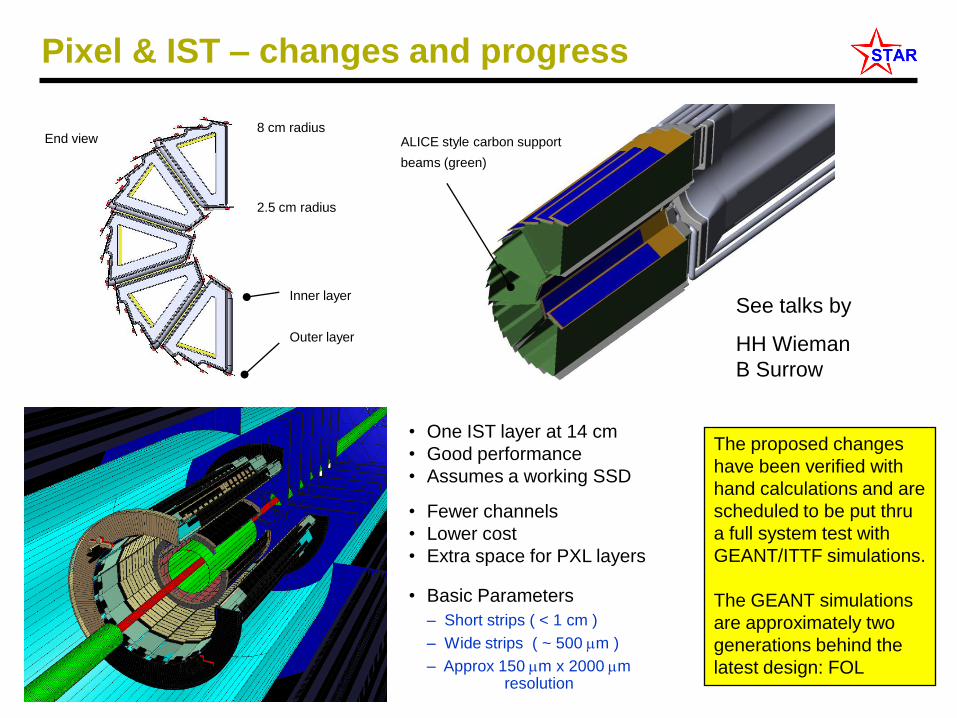
Pixel & IST – changes and progress
2.5 cm radius
8 cm radius
Inner layer
Outer layer
End view ALICE style carbon support
beams (green)
See talks by
HH Wieman
B Surrow
• One IST layer at 14 cm
• Good performance
• Assumes a working SSD
• Fewer channels
• Lower cost
• Extra space for PXL layers
• Basic Parameters
– Short strips ( < 1 cm )
– Wide strips ( ~ 500 m )
– Approx 150 m x 2000 m resolution
The proposed changes
have been verified with
hand calculations and are
scheduled to be put thru
a full system test with
GEANT/ITTF simulations.
The GEANT simulations
are approximately two
generations behind the
latest design: FOL
Jim Thomas - LBL 7
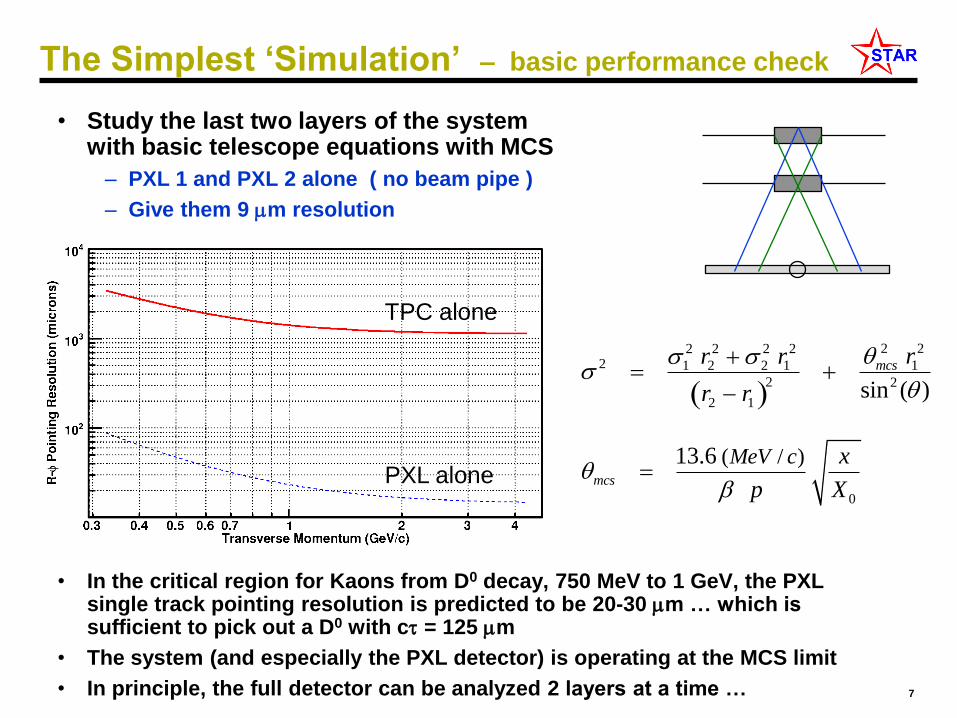
The Simplest ‘Simulation’ – basic performance check
• Study the last two layers of the system with basic telescope equations with MCS
– PXL 1 and PXL 2 alone ( no beam pipe )
– Give them 9 m resolution
0
( / )13.6mcs
MeV c x
p X
2 22 2 2 22 11 2 2 1
2 2
2 1sin ( )
mcs rr r
r r
hh
• In the critical region for Kaons from D0 decay, 750 MeV to 1 GeV, the PXL single track pointing resolution is predicted to be 20-30 m … which is sufficient to pick out a D0 with c = 125 m
• The system (and especially the PXL detector) is operating at the MCS limit
• In principle, the full detector can be analyzed 2 layers at a time …
TPC alone
PXL alone
Jim Thomas - LBL 8
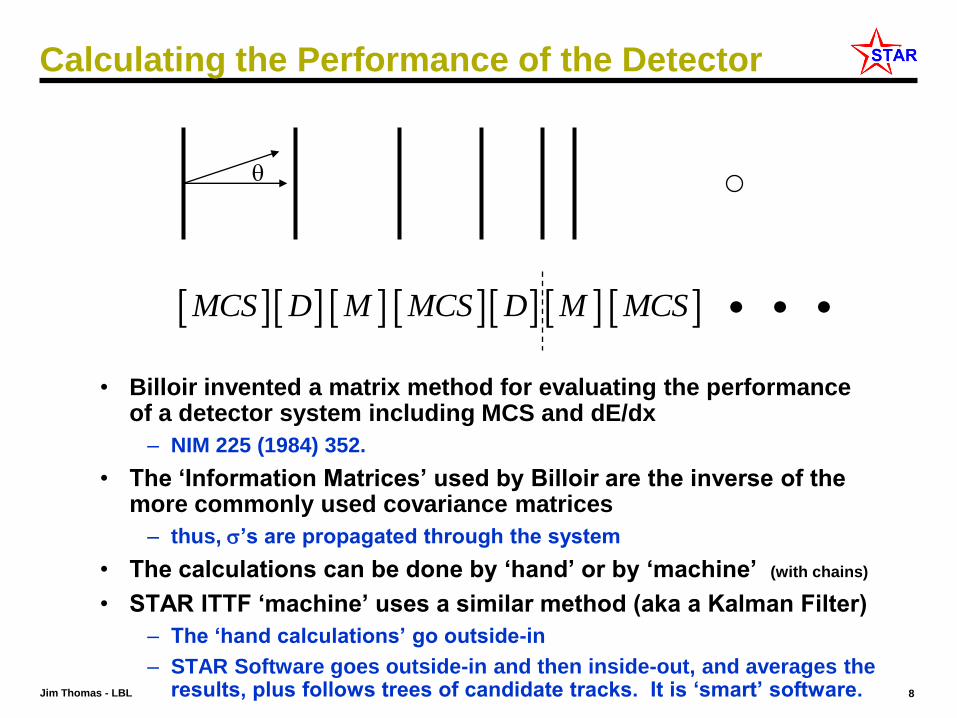
Calculating the Performance of the Detector
• Billoir invented a matrix method for evaluating the performance of a detector system including MCS and dE/dx
– NIM 225 (1984) 352.
• The ‘Information Matrices’ used by Billoir are the inverse of the more commonly used covariance matrices
– thus, ’s are propagated through the system
• The calculations can be done by ‘hand’ or by ‘machine’ (with chains)
• STAR ITTF ‘machine’ uses a similar method (aka a Kalman Filter)
– The ‘hand calculations’ go outside-in
– STAR Software goes outside-in and then inside-out, and averages the results, plus follows trees of candidate tracks. It is ‘smart’ software.
MCS D M MCS D M MCS
Jim Thomas - LBL 9
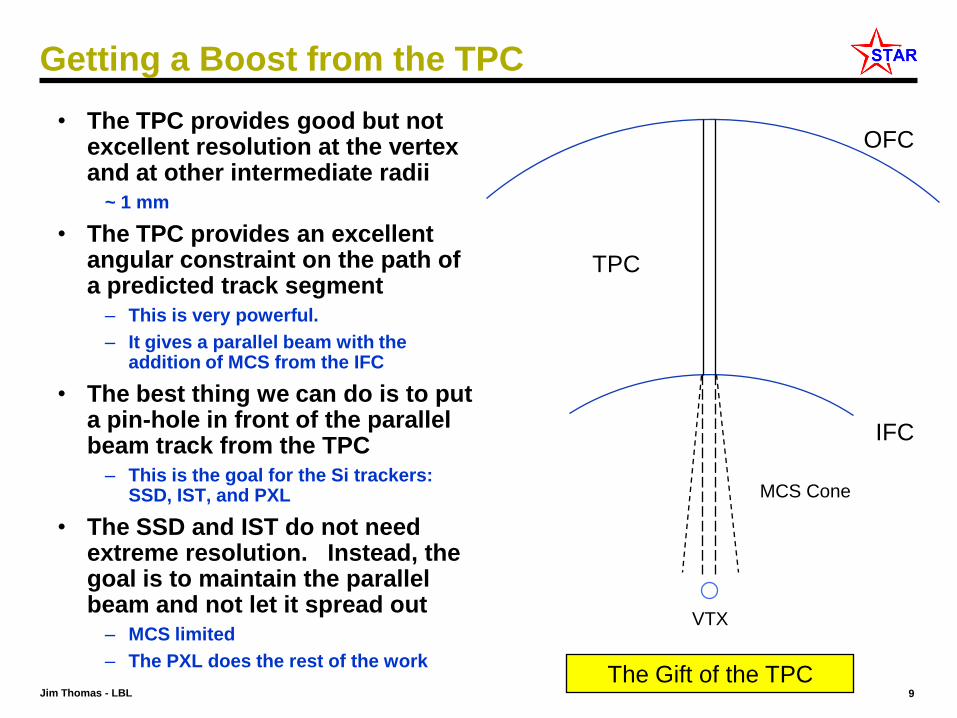
Getting a Boost from the TPC
• The TPC provides good but not excellent resolution at the vertex and at other intermediate radii
~ 1 mm
• The TPC provides an excellent angular constraint on the path of a predicted track segment
– This is very powerful.
– It gives a parallel beam with the addition of MCS from the IFC
• The best thing we can do is to put a pin-hole in front of the parallel beam track from the TPC
– This is the goal for the Si trackers: SSD, IST, and PXL
• The SSD and IST do not need extreme resolution. Instead, the goal is to maintain the parallel beam and not let it spread out
– MCS limited
– The PXL does the rest of the work
TPC
MCS Cone
VTX
The Gift of the TPC
OFC
IFC
Jim Thomas - LBL 10
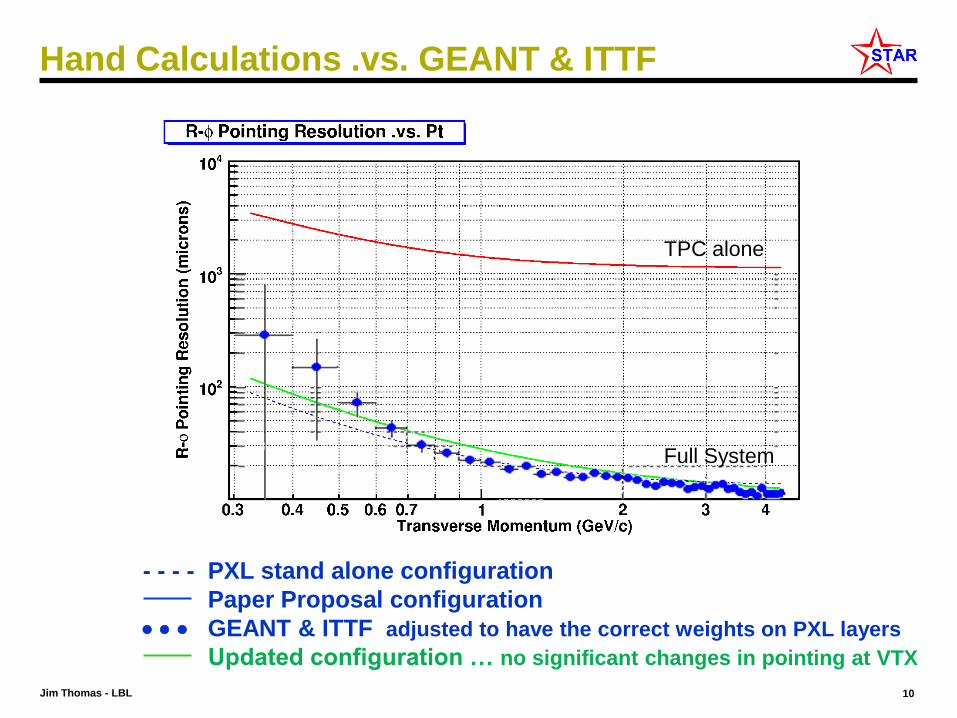
Hand Calculations .vs. GEANT & ITTF
- - - - PXL stand alone configuration
Paper Proposal configuration
GEANT & ITTF adjusted to have the correct weights on PXL layers
Updated configuration … no significant changes in pointing at VTX
TPC alone
Full System
Jim Thomas - LBL 11
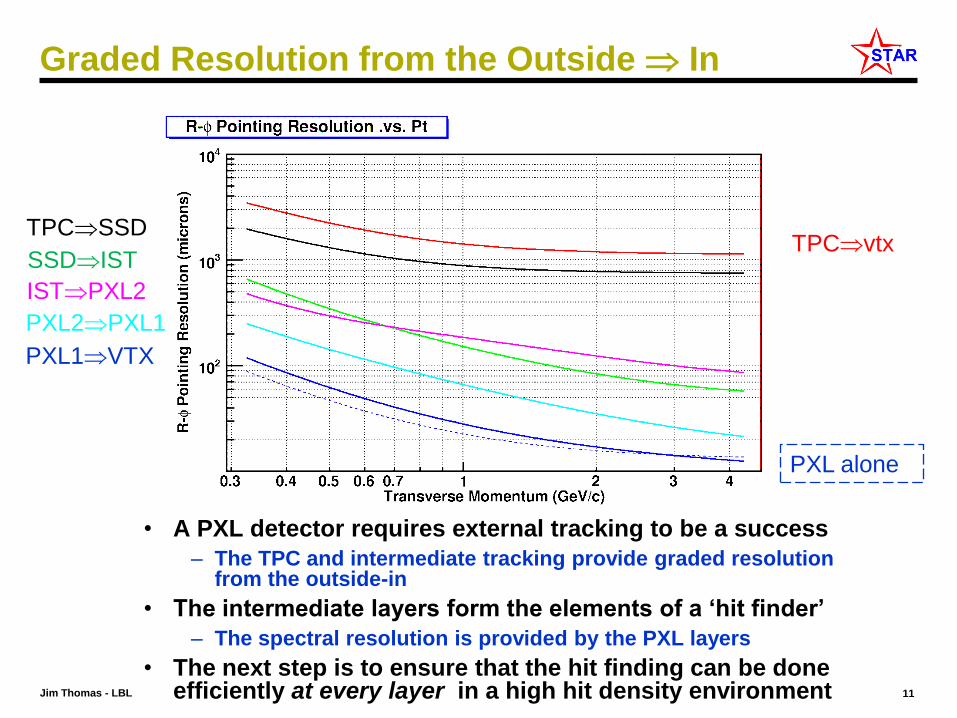
Graded Resolution from the Outside In
• A PXL detector requires external tracking to be a success
– The TPC and intermediate tracking provide graded resolution from the outside-in
• The intermediate layers form the elements of a ‘hit finder’
– The spectral resolution is provided by the PXL layers
• The next step is to ensure that the hit finding can be done efficiently at every layer in a high hit density environment
TPCvtx
PXL alone
TPCSSD
SSDIST
ISTPXL2
PXL2PXL1
PXL1VTX
Jim Thomas - LBL 12
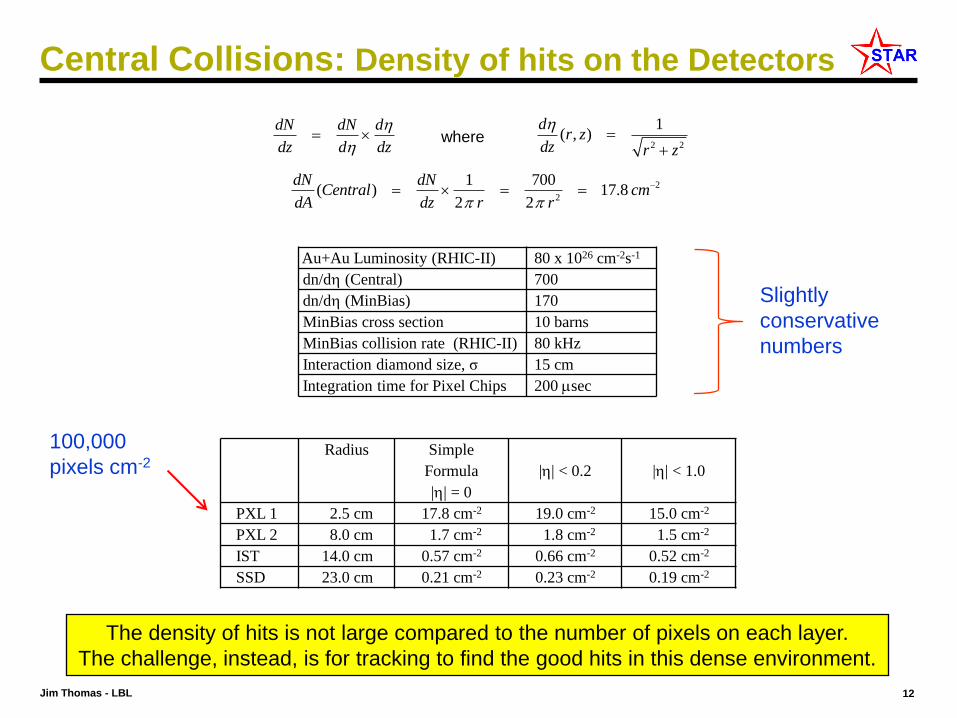
Central Collisions: Density of hits on the Detectors
dN dN d
dz d dz
2 2
1( , )
dr z
dz r z
where
2
2
1 700( ) 17.8
2 2
dN dNCentral cm
dA dz r r
Au+Au Luminosity (RHIC-II) 80 x 1026 cm-2s-1
dn/d (Central) 700
dn/d (MinBias) 170
MinBias cross section 10 barns
MinBias collision rate (RHIC-II) 80 kHz
Interaction diamond size, σ 15 cm
Integration time for Pixel Chips 200 sec
Radius Simple
Formula
|| = 0
|| < 0.2 || < 1.0
PXL 1 2.5 cm 17.8 cm-2 19.0 cm-2 15.0 cm-2
PXL 2 8.0 cm 1.7 cm-2 1.8 cm-2 1.5 cm-2
IST 14.0 cm 0.57 cm-2 0.66 cm-2 0.52 cm-2
SSD 23.0 cm 0.21 cm-2 0.23 cm-2 0.19 cm-2
The density of hits is not large compared to the number of pixels on each layer.
The challenge, instead, is for tracking to find the good hits in this dense environment.
Slightly
conservative
numbers
100,000
pixels cm-2
Jim Thomas - LBL 13
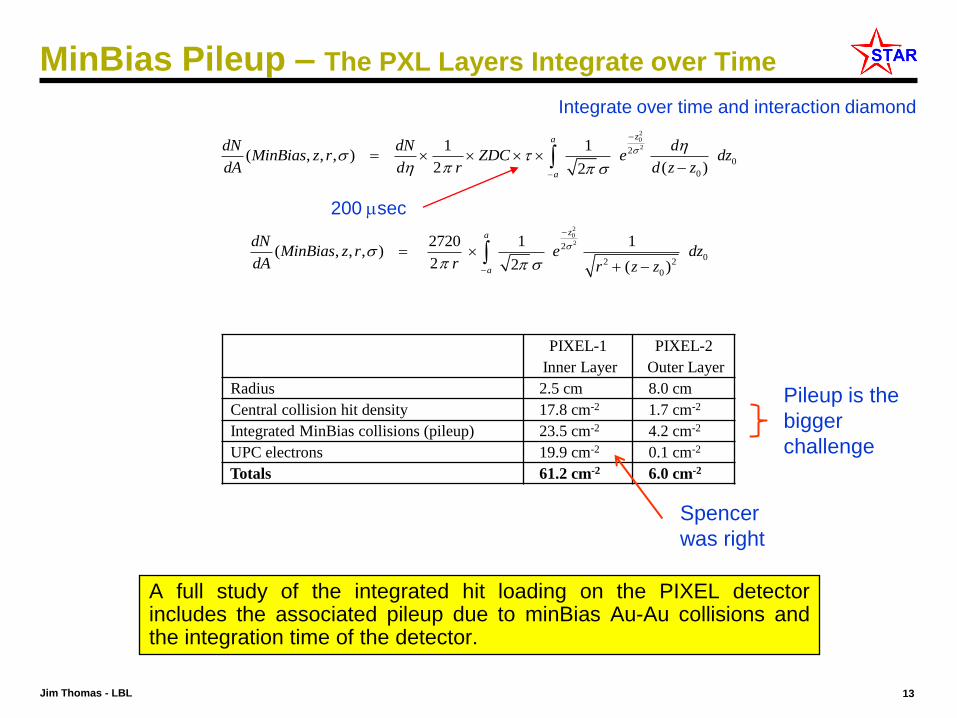
MinBias Pileup – The PXL Layers Integrate over Time
A full study of the integrated hit loading on the PIXEL detectorincludes the associated pileup due to minBias Au-Au collisions andthe integration time of the detector.
20
22
0
0
1 1( , , , )
2 ( )2
za
a
dN dN dMinBias z r ZDC e dz
dA d r d z z
20
22
02 2
0
2720 1 1( , , , )
2 2 ( )
za
a
dNMinBias z r e dz
dA r r z z
PIXEL-1
Inner Layer
PIXEL-2
Outer Layer
Radius 2.5 cm 8.0 cm
Central collision hit density 17.8 cm-2 1.7 cm-2
Integrated MinBias collisions (pileup) 23.5 cm-2 4.2 cm-2
UPC electrons 19.9 cm-2 0.1 cm-2
Totals 61.2 cm-2 6.0 cm-2
Pileup is the
bigger
challenge
Integrate over time and interaction diamond
200 sec
Spencer
was right
Jim Thomas - LBL 14
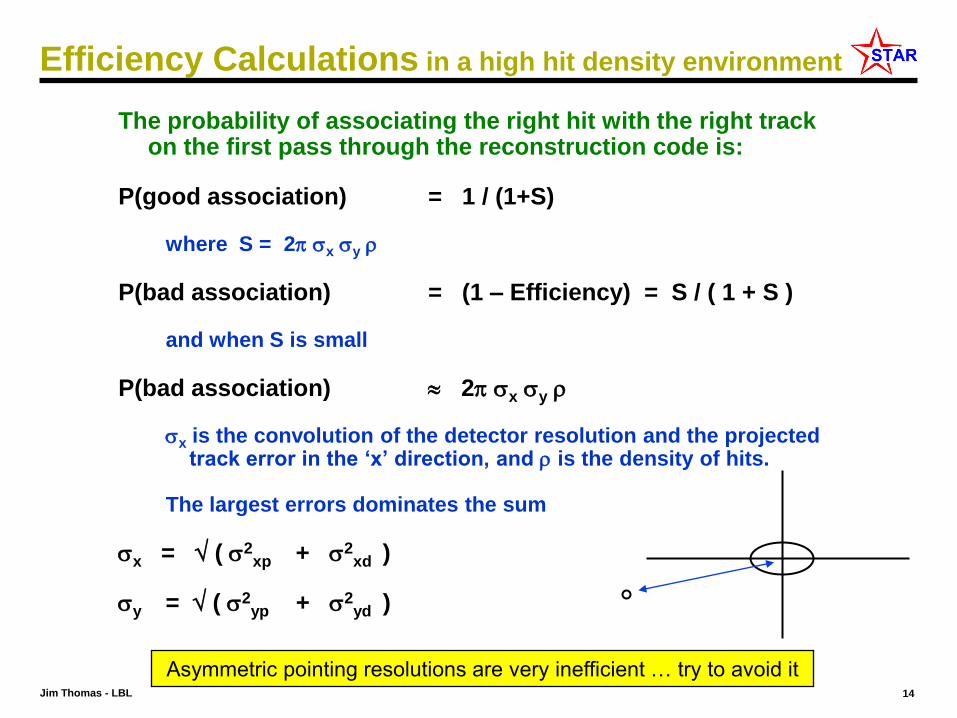
Efficiency Calculations in a high hit density environment
The probability of associating the right hit with the right track on the first pass through the reconstruction code is:
P(good association) = 1 / (1+S)
where S = 2 x y
P(bad association) = (1 – Efficiency) = S / ( 1 + S )
and when S is small
P(bad association) 2 x y
x is the convolution of the detector resolution and the projected track error in the ‘x’ direction, and is the density of hits.
The largest errors dominates the sum
x = ( 2xp + 2
xd )
y = ( 2yp + 2
yd )
Asymmetric pointing resolutions are very inefficient … try to avoid it
Jim Thomas - LBL 15
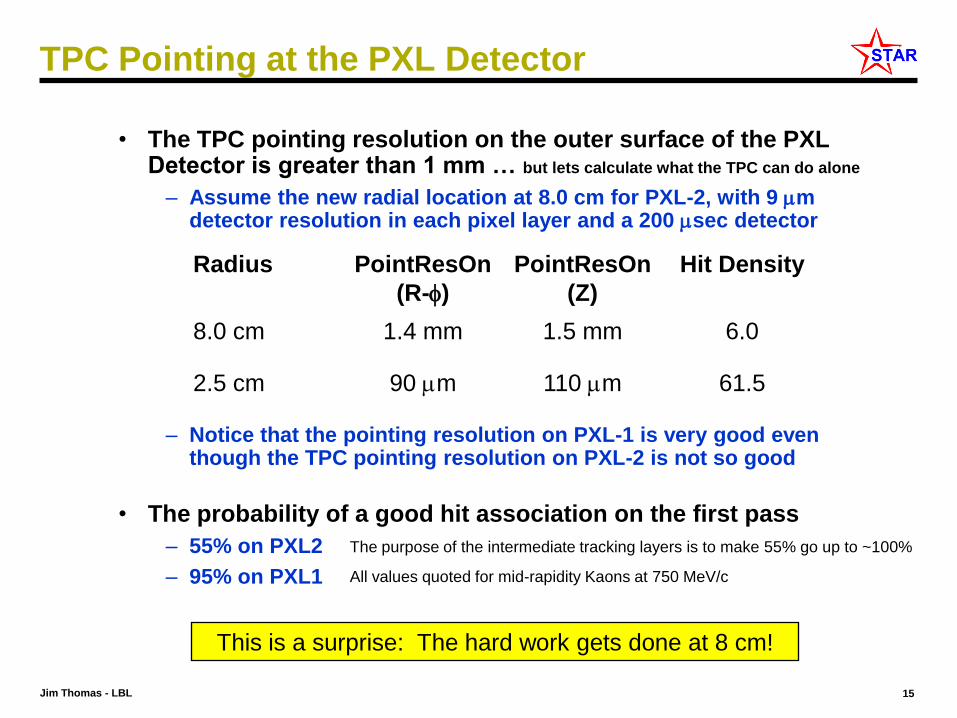
TPC Pointing at the PXL Detector
• The TPC pointing resolution on the outer surface of the PXL Detector is greater than 1 mm … but lets calculate what the TPC can do alone
– Assume the new radial location at 8.0 cm for PXL-2, with 9 mdetector resolution in each pixel layer and a 200 sec detector
– Notice that the pointing resolution on PXL-1 is very good even though the TPC pointing resolution on PXL-2 is not so good
• The probability of a good hit association on the first pass
– 55% on PXL2
– 95% on PXL1
Radius PointResOn
(R-)
PointResOn
(Z)
Hit Density
8.0 cm 1.4 mm 1.5 mm 6.0
2.5 cm 90 m 110 m 61.5
This is a surprise: The hard work gets done at 8 cm!
The purpose of the intermediate tracking layers is to make 55% go up to ~100%
All values quoted for mid-rapidity Kaons at 750 MeV/c
Jim Thomas - LBL 16
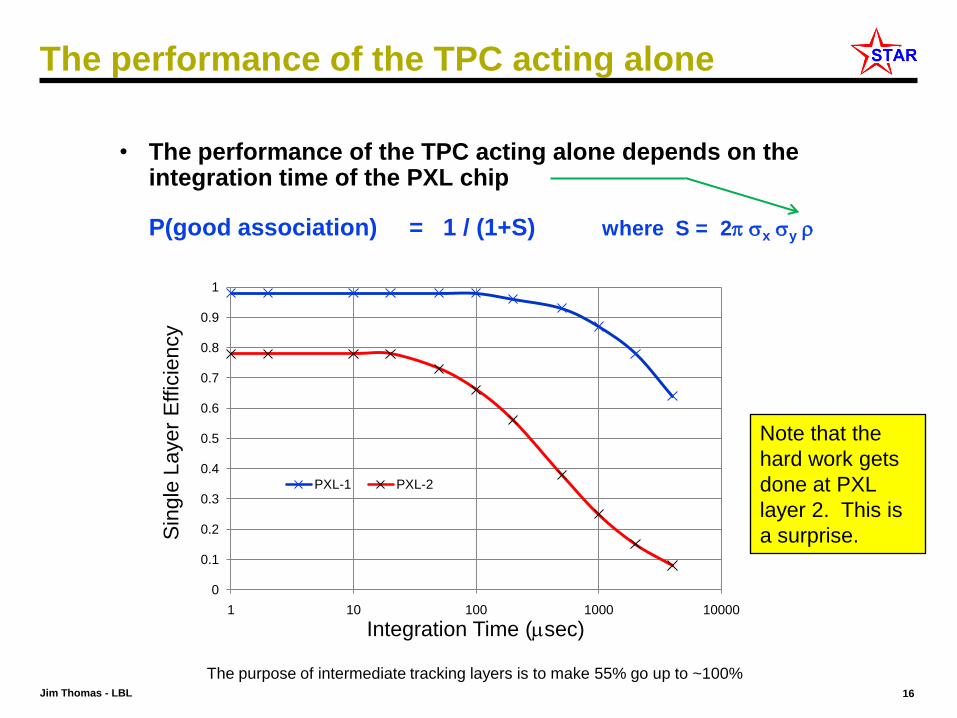
The performance of the TPC acting alone
• The performance of the TPC acting alone depends on the integration time of the PXL chip
P(good association) = 1 / (1+S) where S = 2 x y
0
0.1
0.2
0.3
0.4
0.5
0.6
0.7
0.8
0.9
1
1 10 100 1000 10000
PXL-1 PXL-2
Integration Time (sec)
Sin
gle
Layer
Effic
iency
The purpose of intermediate tracking layers is to make 55% go up to ~100%
Note that the
hard work gets
done at PXL
layer 2. This is
a surprise.
Jim Thomas - LBL 17
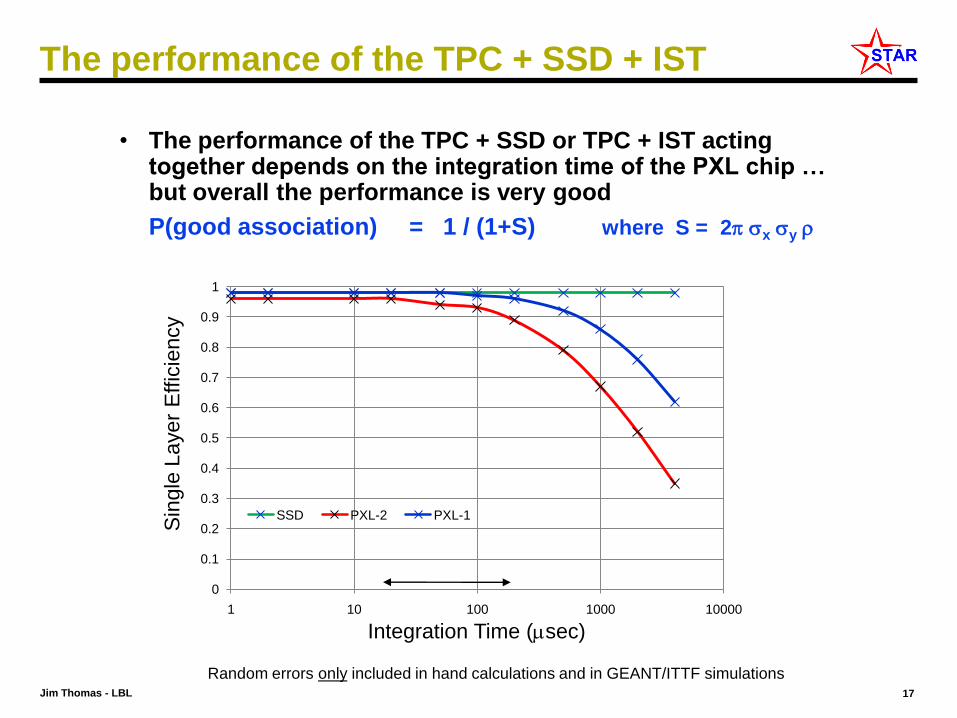
The performance of the TPC + SSD + IST
• The performance of the TPC + SSD or TPC + IST acting together depends on the integration time of the PXL chip … but overall the performance is very good
P(good association) = 1 / (1+S) where S = 2 x y
0
0.1
0.2
0.3
0.4
0.5
0.6
0.7
0.8
0.9
1
1 10 100 1000 10000
SSD PXL-2 PXL-1
Integration Time (sec)
Sin
gle
Layer
Effic
iency
Random errors only included in hand calculations and in GEANT/ITTF simulations
Jim Thomas - LBL 18
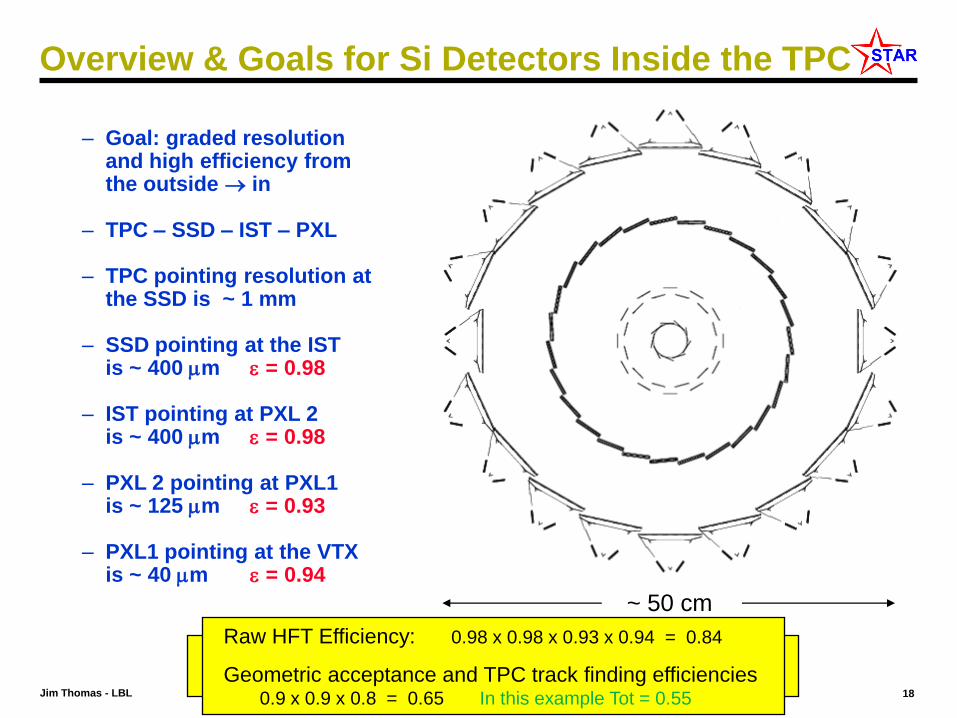
– Goal: graded resolution and high efficiency from the outside in
– TPC – SSD – IST – PXL
– TPC pointing resolution at the SSD is ~ 1 mm
– SSD pointing at the IST is ~ 400 m = 0.98
– IST pointing at PXL 2 is ~ 400 m = 0.98
– PXL 2 pointing at PXL1 is ~ 125 m = 0.93
– PXL1 pointing at the VTX is ~ 40 m = 0.94
Overview & Goals for Si Detectors Inside the TPC
The challenge is to find tracks in a high density environment
with high efficiency because a D0 needs single track 2
~ 50 cm
Raw HFT Efficiency: 0.98 x 0.98 x 0.93 x 0.94 = 0.84
Geometric acceptance and TPC track finding efficiencies0.9 x 0.9 x 0.8 = 0.65 In this example Tot = 0.55
Jim Thomas - LBL 19
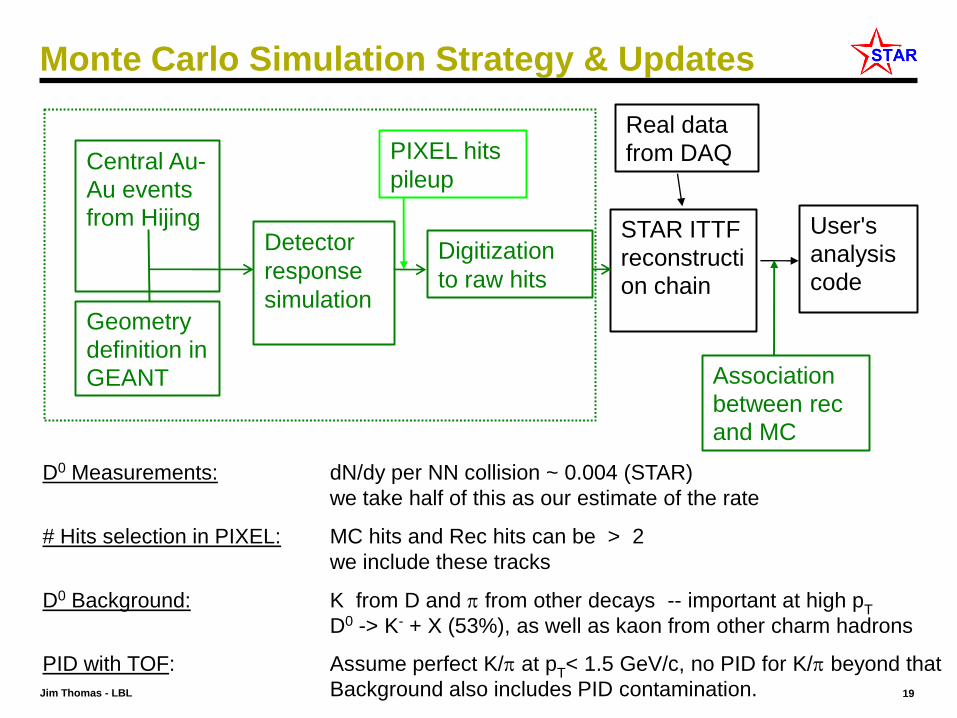
Monte Carlo Simulation Strategy & Updates
Central Au-
Au events
from Hijing
Geometry
definition in
GEANT
Detector
response
simulation
Digitization
to raw hits
STAR ITTF
reconstructi
on chain
User's
analysis code
Real data
from DAQ
Association
between rec
and MC
PIXEL hits
pileup
D0 Measurements: dN/dy per NN collision ~ 0.004 (STAR)
we take half of this as our estimate of the rate
# Hits selection in PIXEL: MC hits and Rec hits can be > 2
we include these tracks
D0 Background: K from D and from other decays -- important at high pT
D0 -> K- + X (53%), as well as kaon from other charm hadrons
PID with TOF: Assume perfect K/ at pT< 1.5 GeV/c, no PID for K/ beyond that
Background also includes PID contamination.
Jim Thomas - LBL 20
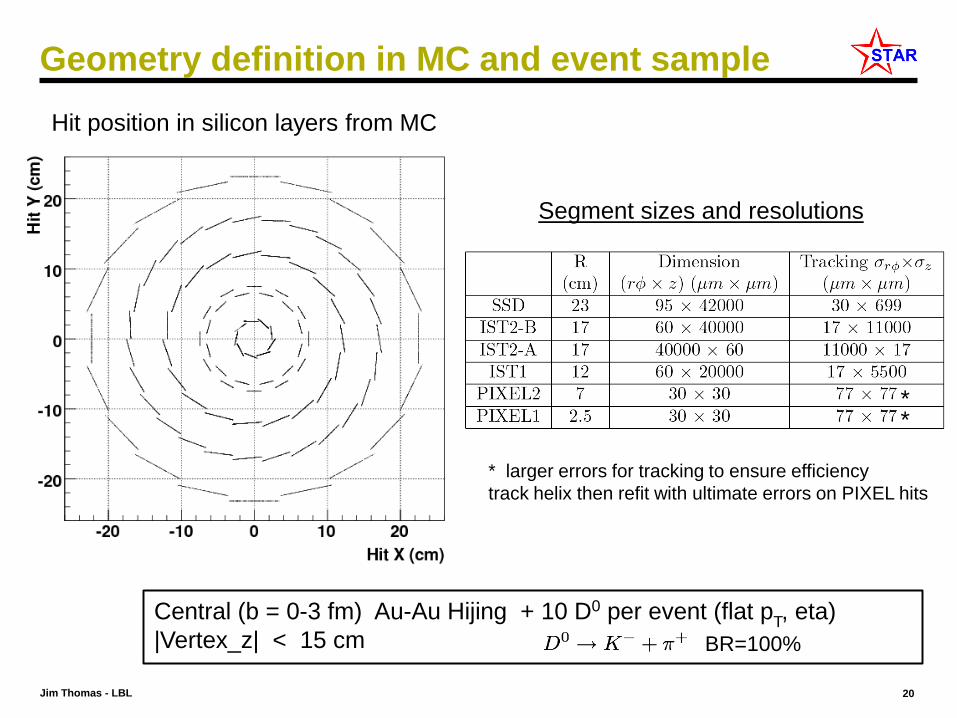
Geometry definition in MC and event sample
Hit position in silicon layers from MC
Segment sizes and resolutions
* larger errors for tracking to ensure efficiency
track helix then refit with ultimate errors on PIXEL hits
Central (b = 0-3 fm) Au-Au Hijing + 10 D0 per event (flat pT, eta)
|Vertex_z| < 15 cm BR=100%
**
Jim Thomas - LBL 21
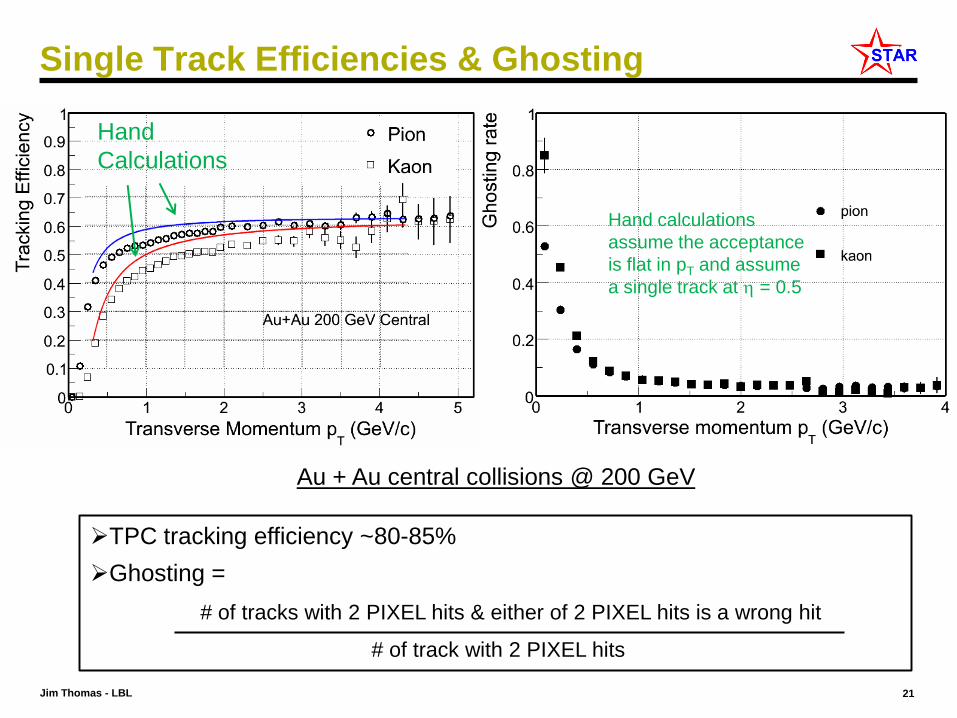
Single Track Efficiencies & Ghosting
Au + Au central collisions @ 200 GeV
TPC tracking efficiency ~80-85%
Ghosting =
# of tracks with 2 PIXEL hits & either of 2 PIXEL hits is a wrong hit
# of track with 2 PIXEL hits
Hand
Calculations
Hand calculations
assume the acceptance
is flat in pT and assume
a single track at = 0.5
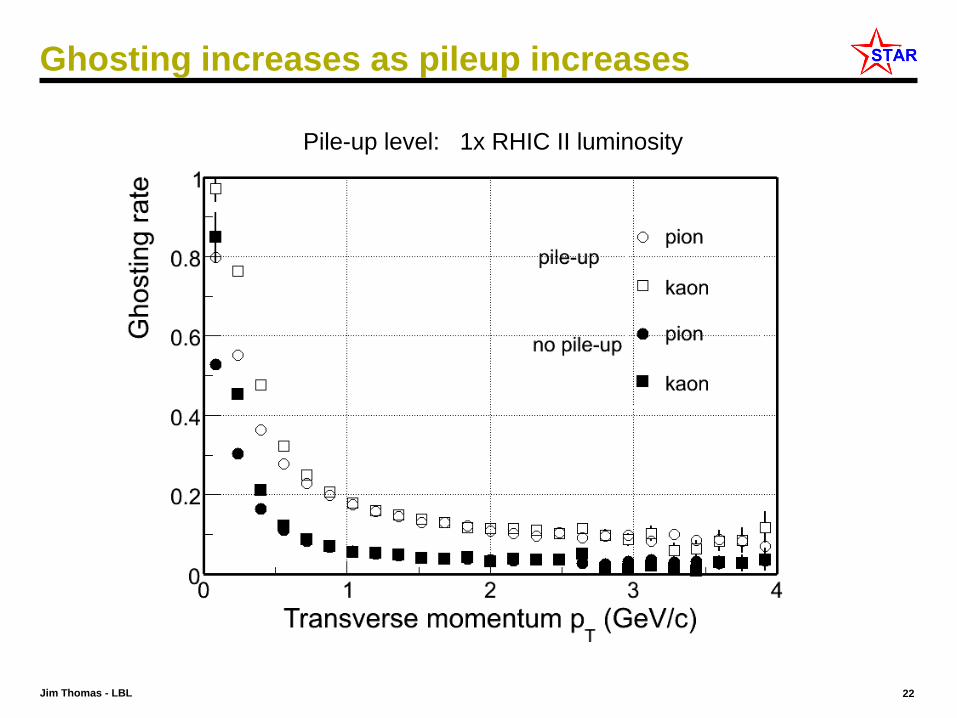
Jim Thomas - LBL 22
Ghosting increases as pileup increases
Pile-up level: 1x RHIC II luminosity
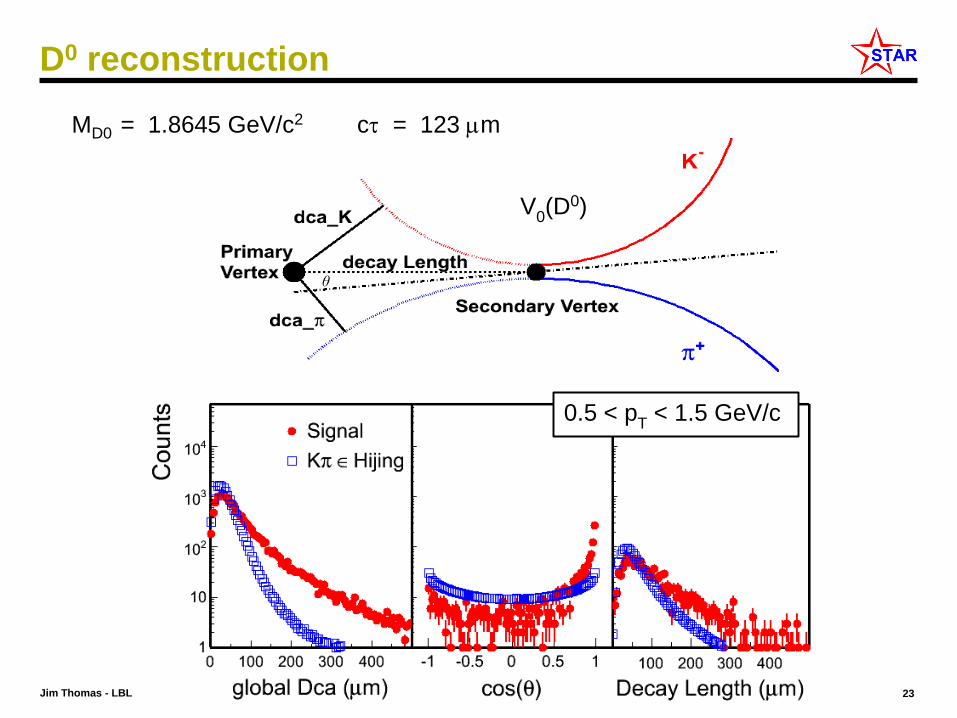
Jim Thomas - LBL 23
D0 reconstruction
0.5 < pT
< 1.5 GeV/c
θ
MD0 = 1.8645 GeV/c2 c = 123 m
V0(D0)
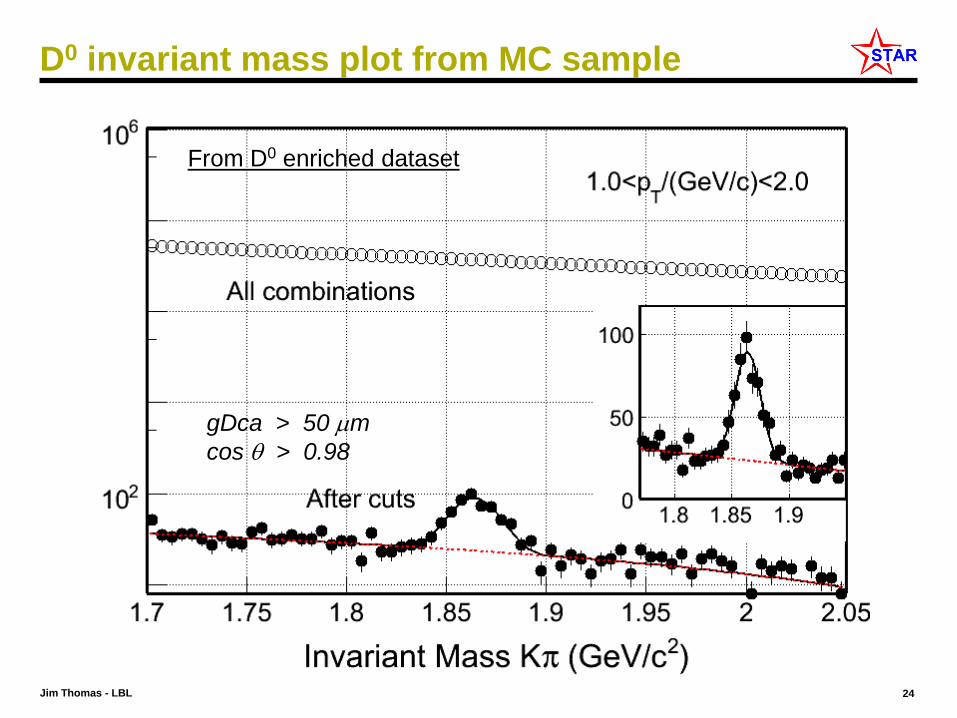
Jim Thomas - LBL 24
D0 invariant mass plot from MC sample
gDca > 50 m
cos > 0.98
From D0 enriched dataset
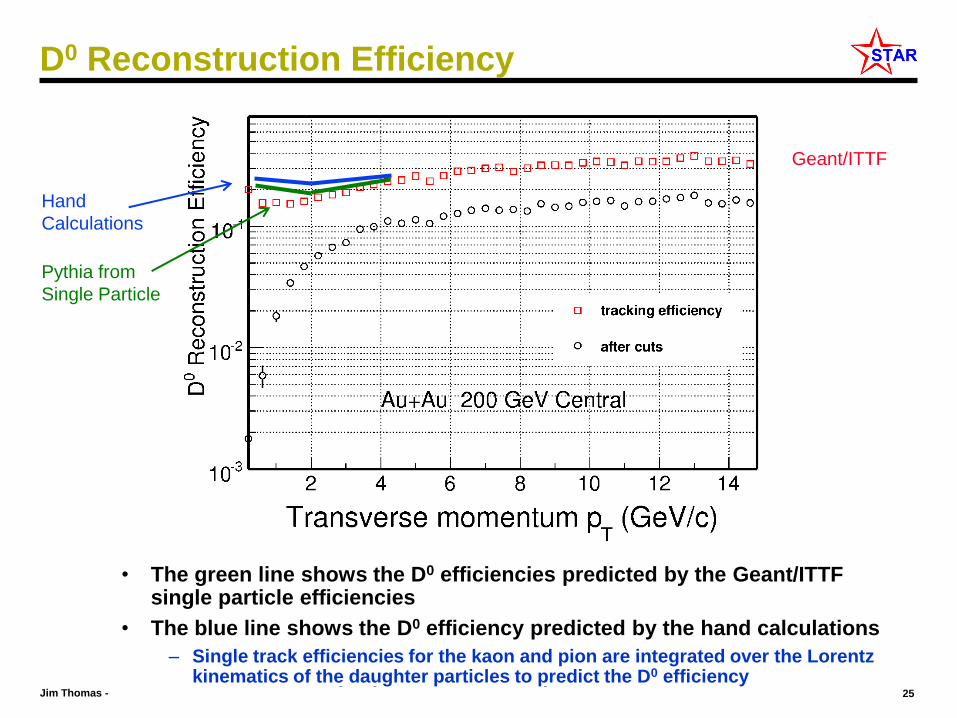
Jim Thomas - LBL 25
• The predicted absolute efficiency of the HFT detector.
– The red squares show the efficiency for finding the D0 meson with the full set of Geant/ITTF techniques. The black circles show the efficiency AFTER cuts.
• The single track efficiencies are improved by 20-30% compared to the simulations in the proposal. Due to improved hit selection in PXL.
D0 Reconstruction Efficiency
Geant/ITTF
Pythia from
Single Particle
Hand
Calculations
• The green line shows the D0 efficiencies predicted by the Geant/ITTF single particle efficiencies
• The blue line shows the D0 efficiency predicted by the hand calculations
– Single track efficiencies for the kaon and pion are integrated over the Lorentz kinematics of the daughter particles to predict the D0 efficiency
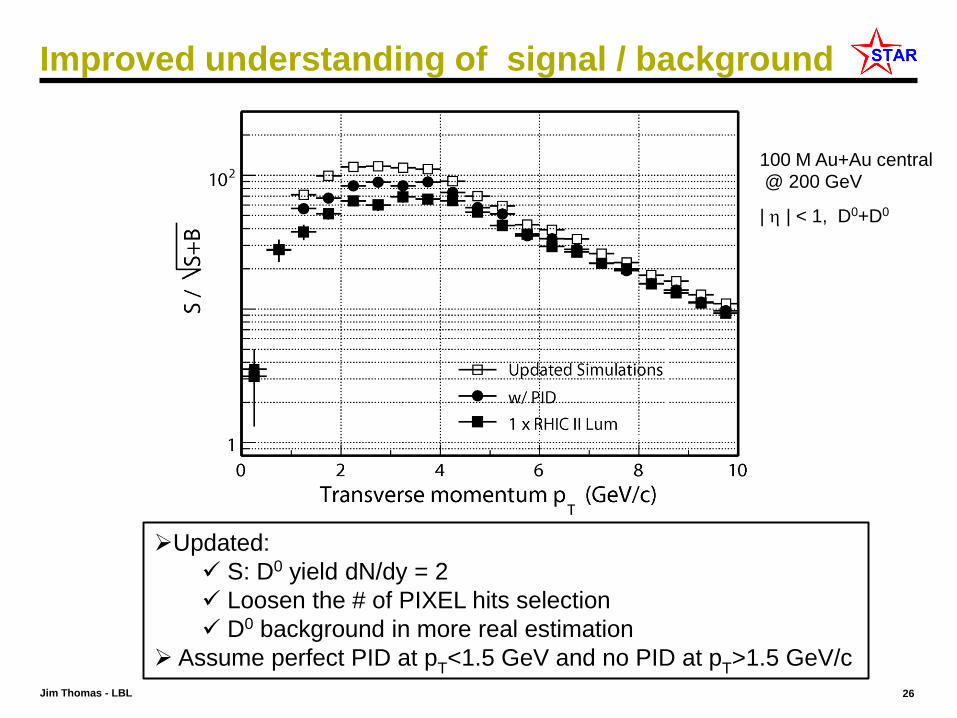
Jim Thomas - LBL 26
Improved understanding of signal / background
Updated:
S: D0 yield dN/dy = 2
Loosen the # of PIXEL hits selection
D0 background in more real estimation
Assume perfect PID at pT<1.5 GeV and no PID at p
T>1.5 GeV/c
100 M Au+Au central@ 200 GeV
| | < 1, D0+D0
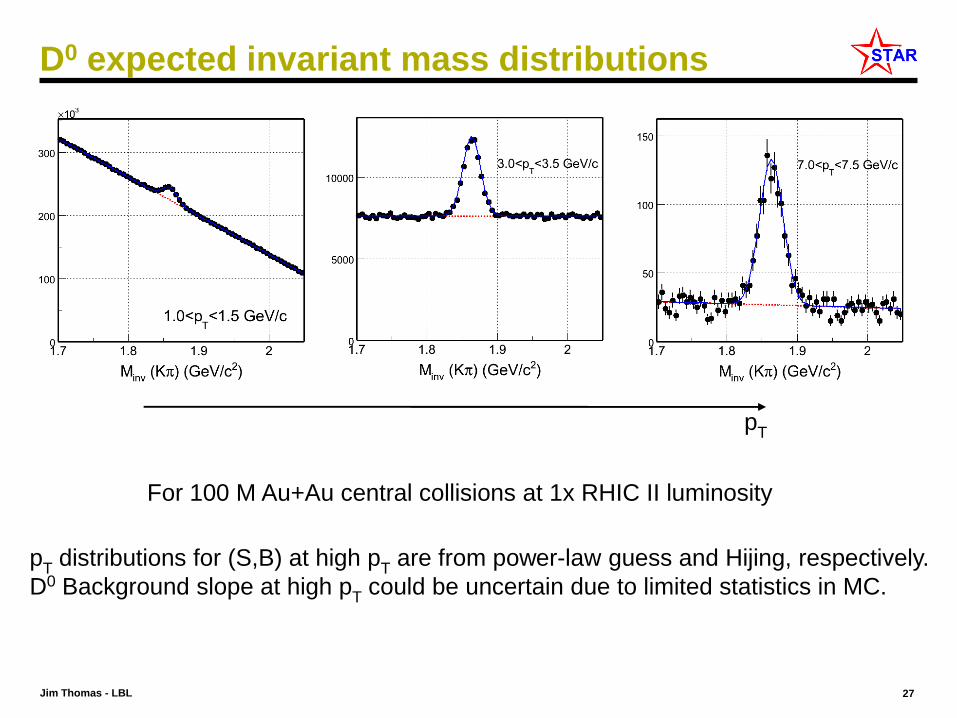
Jim Thomas - LBL 27
D0 expected invariant mass distributions
pT
pT
distributions for (S,B) at high pT
are from power-law guess and Hijing, respectively.
D0 Background slope at high pT
could be uncertain due to limited statistics in MC.
For 100 M Au+Au central collisions at 1x RHIC II luminosity
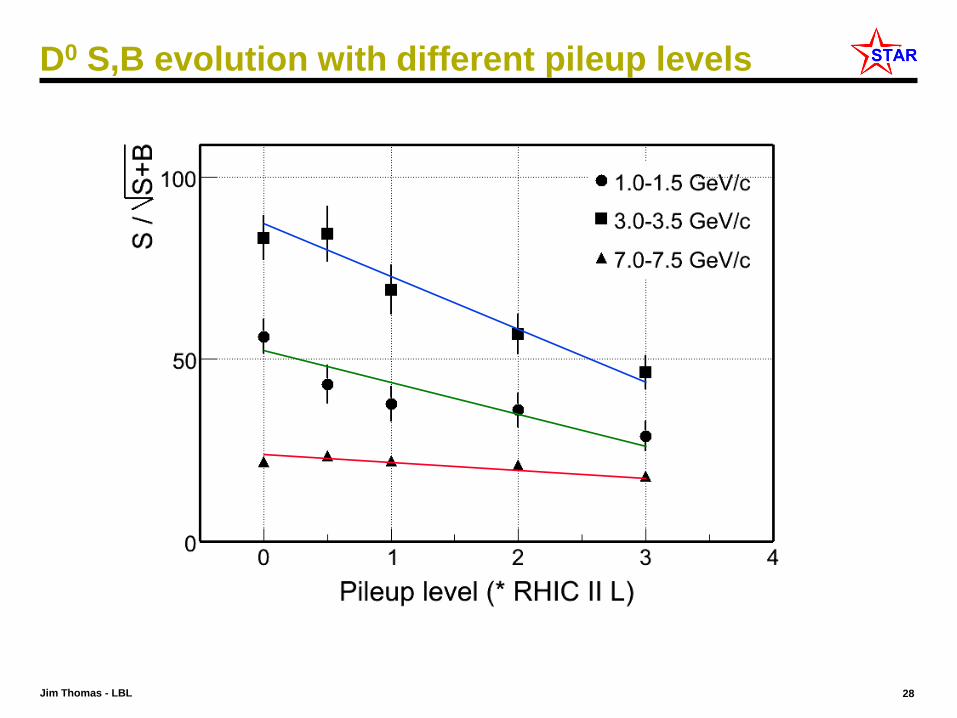
Jim Thomas - LBL 28
D0 S,B evolution with different pileup levels
Jim Thomas - LBL 29
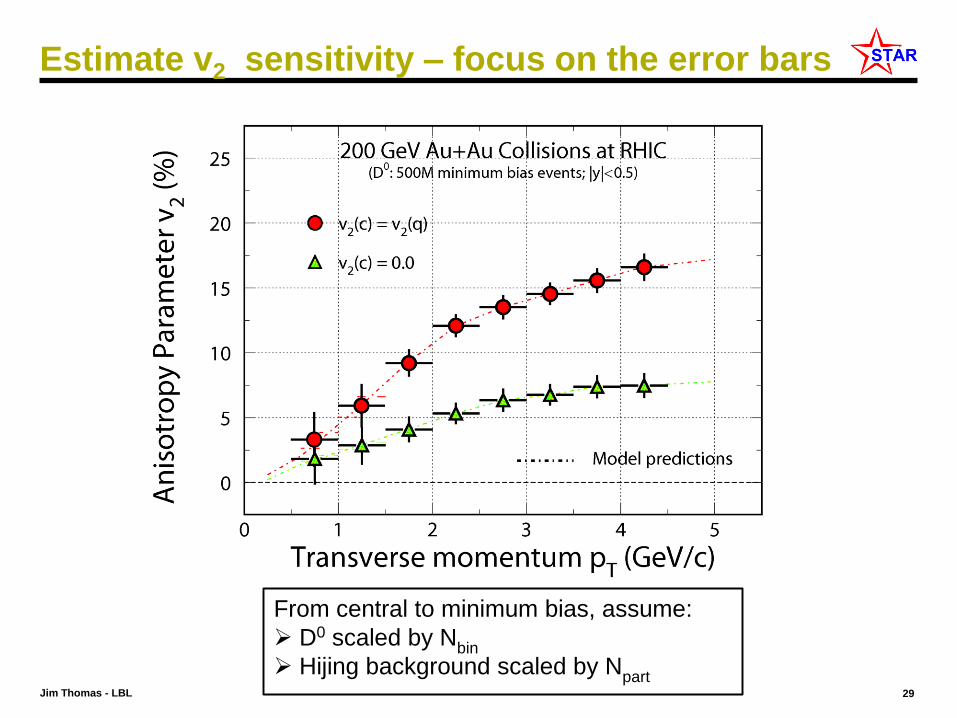
Estimate v2 sensitivity – focus on the error bars
From central to minimum bias, assume:
D0 scaled by Nbin
Hijing background scaled by Npart
Jim Thomas - LBL 30
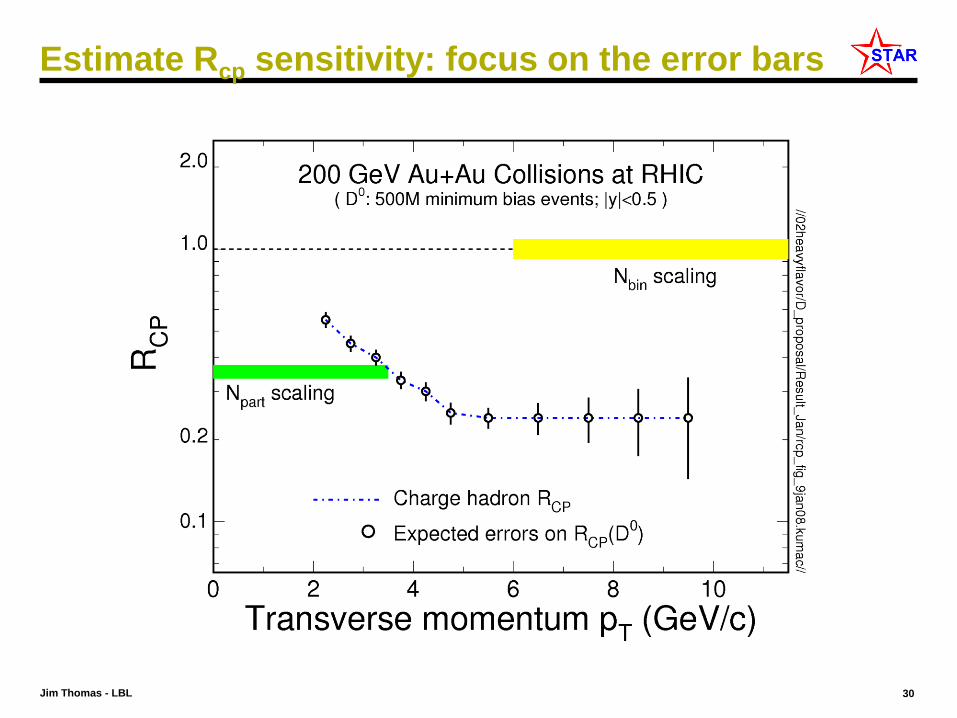
Estimate Rcp sensitivity: focus on the error bars
Jim Thomas - LBL 31
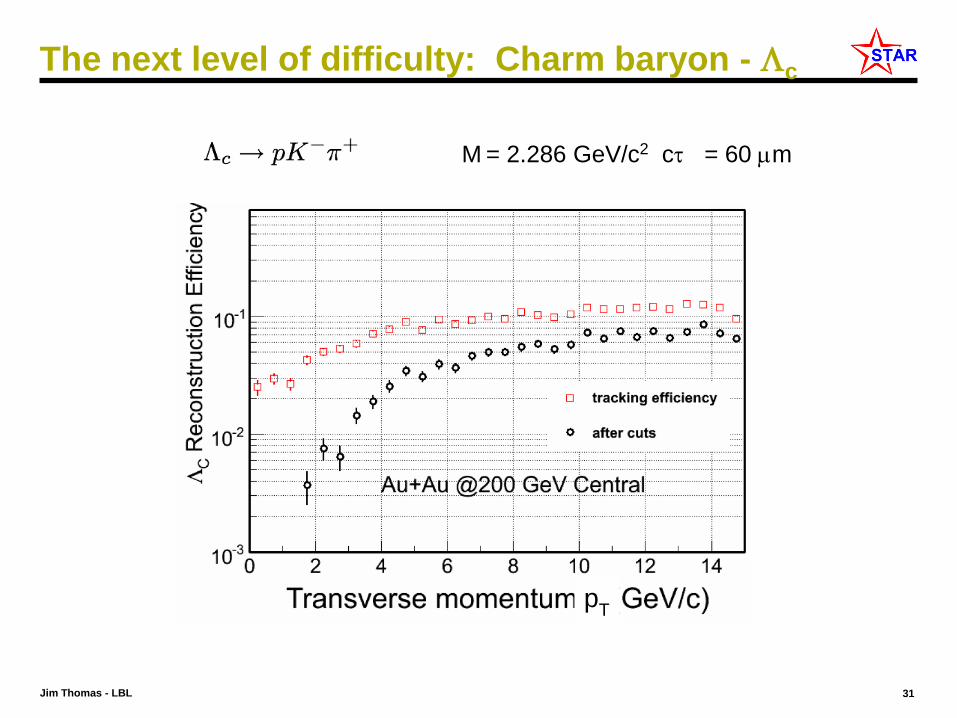
The next level of difficulty: Charm baryon - c
M = 2.286 GeV/c2 c = 60 m
pT
Jim Thomas - LBL 32
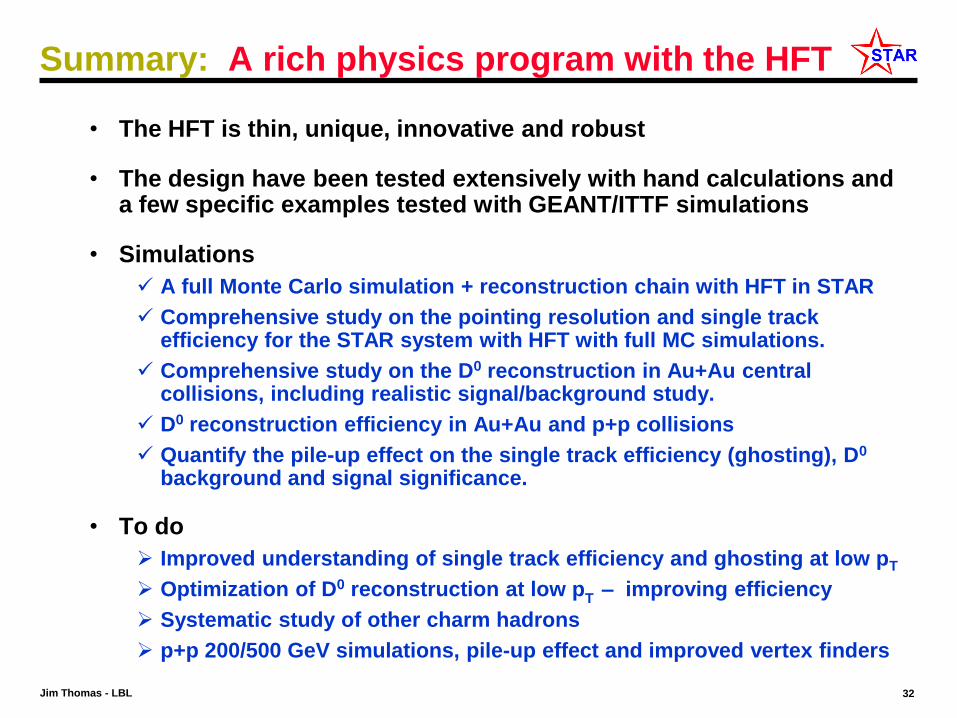
• The HFT is thin, unique, innovative and robust
• The design have been tested extensively with hand calculations and a few specific examples tested with GEANT/ITTF simulations
• Simulations
A full Monte Carlo simulation + reconstruction chain with HFT in STAR
Comprehensive study on the pointing resolution and single track efficiency for the STAR system with HFT with full MC simulations.
Comprehensive study on the D0 reconstruction in Au+Au central collisions, including realistic signal/background study.
D0 reconstruction efficiency in Au+Au and p+p collisions
Quantify the pile-up effect on the single track efficiency (ghosting), D0
background and signal significance.
• To do
Improved understanding of single track efficiency and ghosting at low pT
Optimization of D0 reconstruction at low pT
– improving efficiency
Systematic study of other charm hadrons
p+p 200/500 GeV simulations, pile-up effect and improved vertex finders
Summary: A rich physics program with the HFT

Jim Thomas - LBL 33
Deleted Slides
Jim Thomas - LBL 34
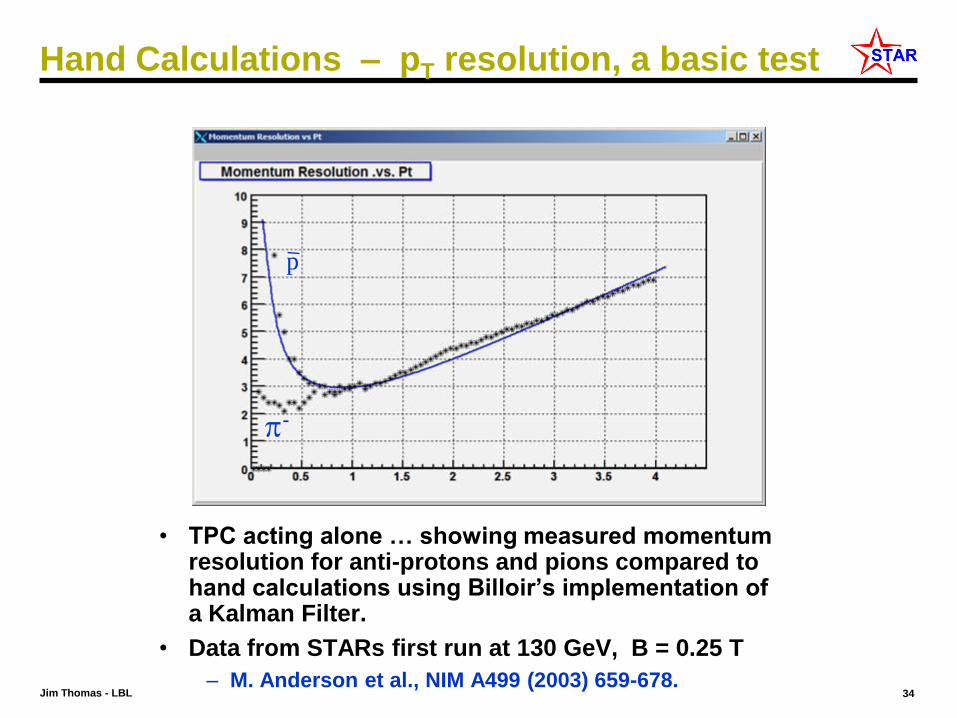
Hand Calculations – pT resolution, a basic test
• TPC acting alone … showing measured momentum resolution for anti-protons and pions compared to hand calculations using Billoir’s implementation of a Kalman Filter.
• Data from STARs first run at 130 GeV, B = 0.25 T
– M. Anderson et al., NIM A499 (2003) 659-678.
p
-
Jim Thomas - LBL 35
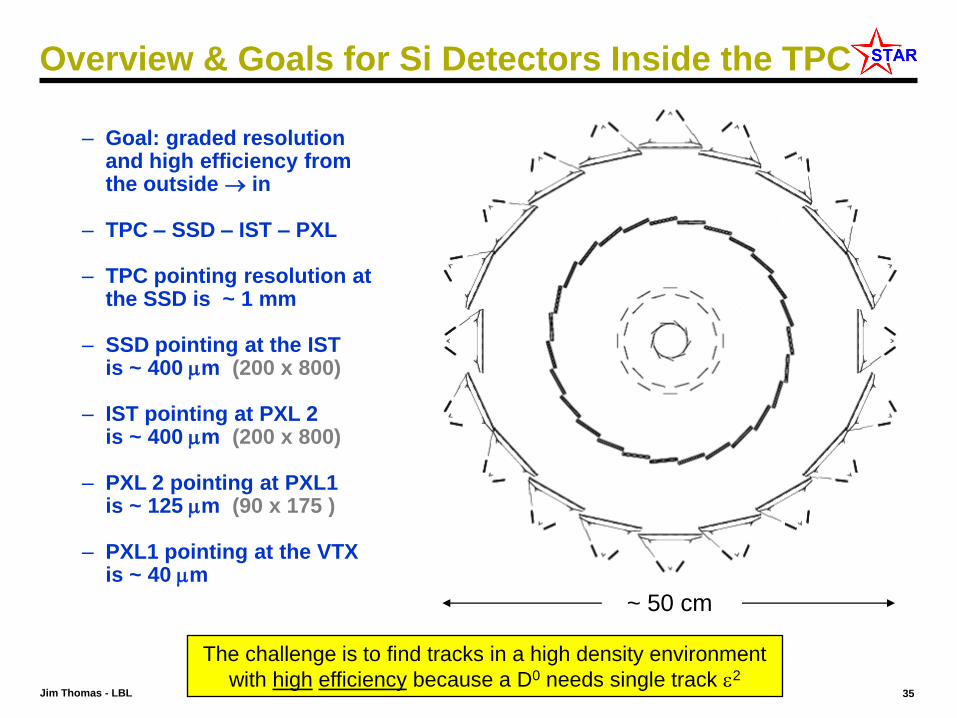
– Goal: graded resolution and high efficiency from the outside in
– TPC – SSD – IST – PXL
– TPC pointing resolution at the SSD is ~ 1 mm
– SSD pointing at the IST is ~ 400 m (200 x 800)
– IST pointing at PXL 2 is ~ 400 m (200 x 800)
– PXL 2 pointing at PXL1 is ~ 125 m (90 x 175 )
– PXL1 pointing at the VTX is ~ 40 m
Overview & Goals for Si Detectors Inside the TPC
The challenge is to find tracks in a high density environment
with high efficiency because a D0 needs single track 2
~ 50 cm
Jim Thomas - LBL 36
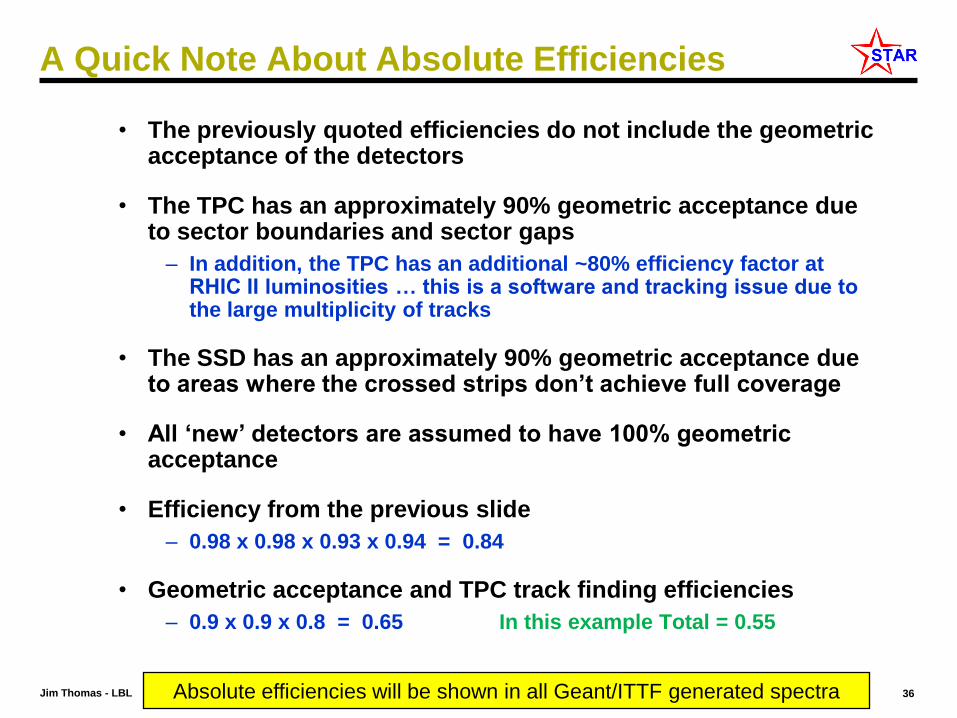
A Quick Note About Absolute Efficiencies
• The previously quoted efficiencies do not include the geometric acceptance of the detectors
• The TPC has an approximately 90% geometric acceptance due to sector boundaries and sector gaps
– In addition, the TPC has an additional ~80% efficiency factor at RHIC II luminosities … this is a software and tracking issue due to the large multiplicity of tracks
• The SSD has an approximately 90% geometric acceptance due to areas where the crossed strips don’t achieve full coverage
• All ‘new’ detectors are assumed to have 100% geometric acceptance
• Efficiency from the previous slide
– 0.98 x 0.98 x 0.93 x 0.94 = 0.84
• Geometric acceptance and TPC track finding efficiencies
– 0.9 x 0.9 x 0.8 = 0.65 In this example Total = 0.55
Absolute efficiencies will be shown in all Geant/ITTF generated spectra
Jim Thomas - LBL 37
Motivation
Understand the HFT performance in the STAR tracking (ITTF) environment
tracking (matching) efficiency
ghosting hits/tracks
pointing resolution & its impact on charm hadron secondary decay vertex
charm hadron reconstruction efficiency & signal / background estimation
performance under RHICII luminosity (pile-up effect on PIXELs)
performance in small systems (p+p)
Status report
Jim Thomas - LBL 38
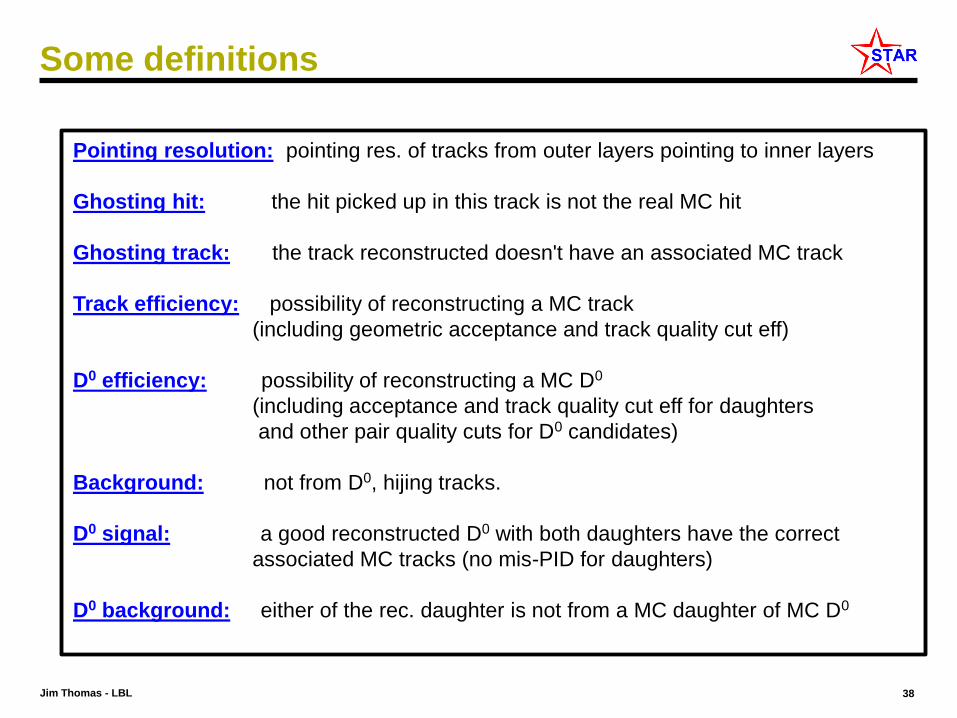
Some definitions
Pointing resolution: pointing res. of tracks from outer layers pointing to inner layers
Ghosting hit: the hit picked up in this track is not the real MC hit
Ghosting track: the track reconstructed doesn't have an associated MC track
Track efficiency: possibility of reconstructing a MC track
(including geometric acceptance and track quality cut eff)
D0 efficiency: possibility of reconstructing a MC D0
(including acceptance and track quality cut eff for daughters
and other pair quality cuts for D0 candidates)
Background: not from D0, hijing tracks.
D0 signal: a good reconstructed D0 with both daughters have the correct
associated MC tracks (no mis-PID for daughters)
D0 background: either of the rec. daughter is not from a MC daughter of MC D0
Jim Thomas - LBL 39
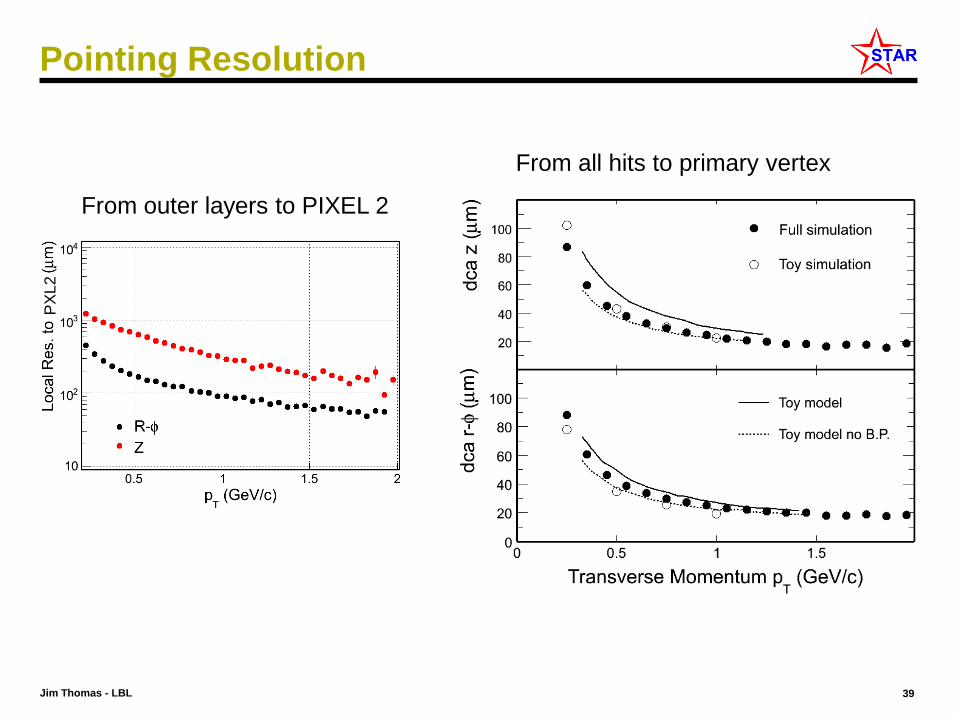
Pointing Resolution
From all hits to primary vertex
PX
L2
From outer layers to PIXEL 2
Jim Thomas - LBL 40
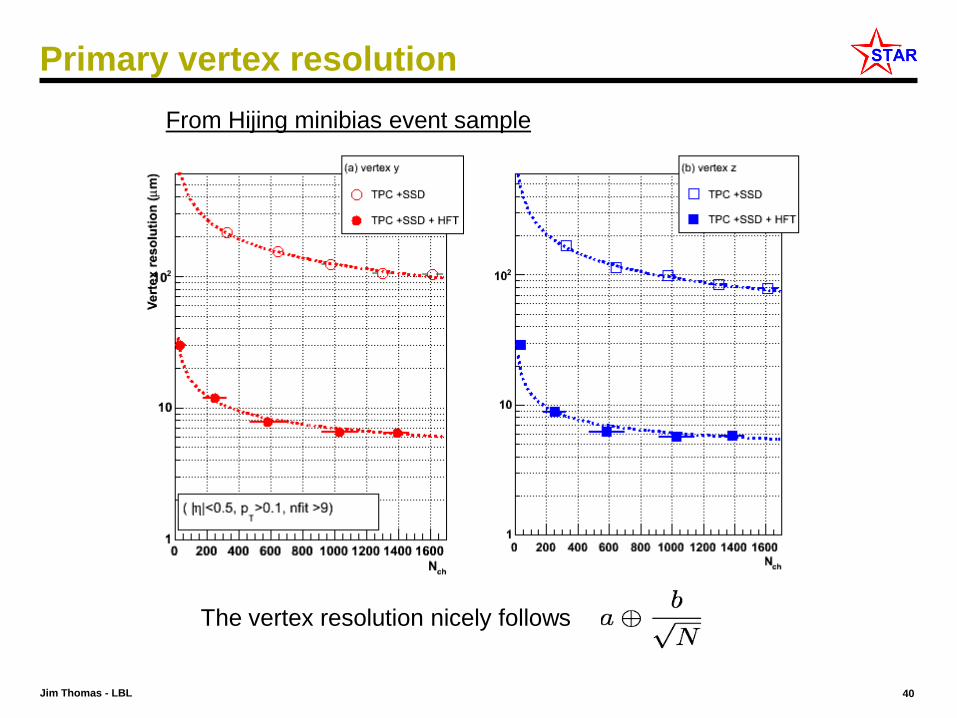
Primary vertex resolution
The vertex resolution nicely follows
From Hijing minibias event sample
Jim Thomas - LBL 41
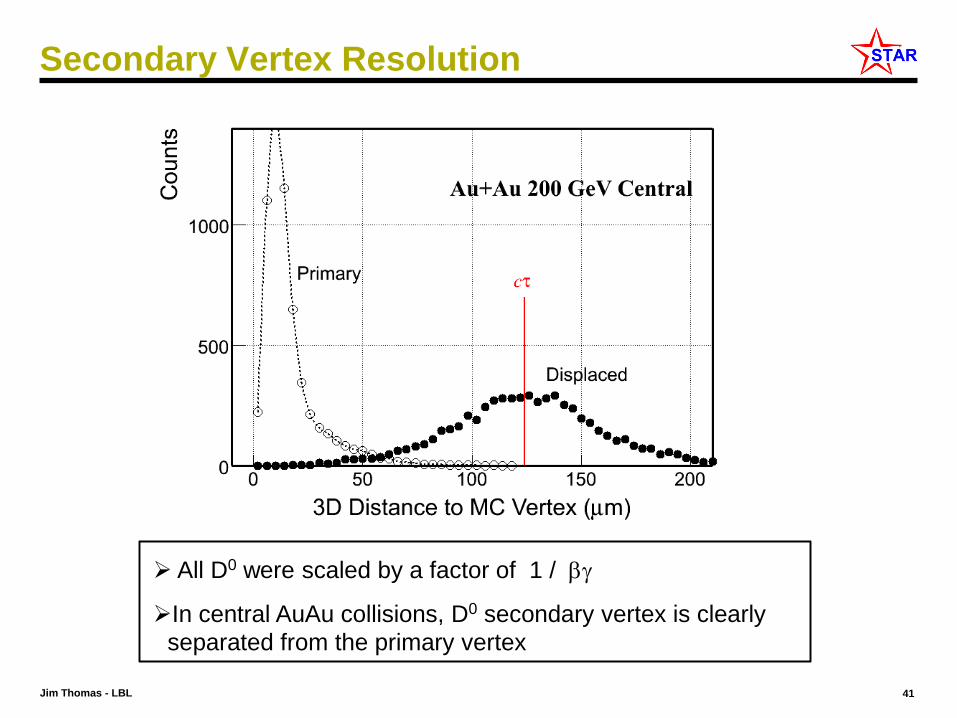
Secondary Vertex Resolution
All D0 were scaled by a factor of 1 /
In central AuAu collisions, D0 secondary vertex is clearly
separated from the primary vertex
Jim Thomas - LBL 42
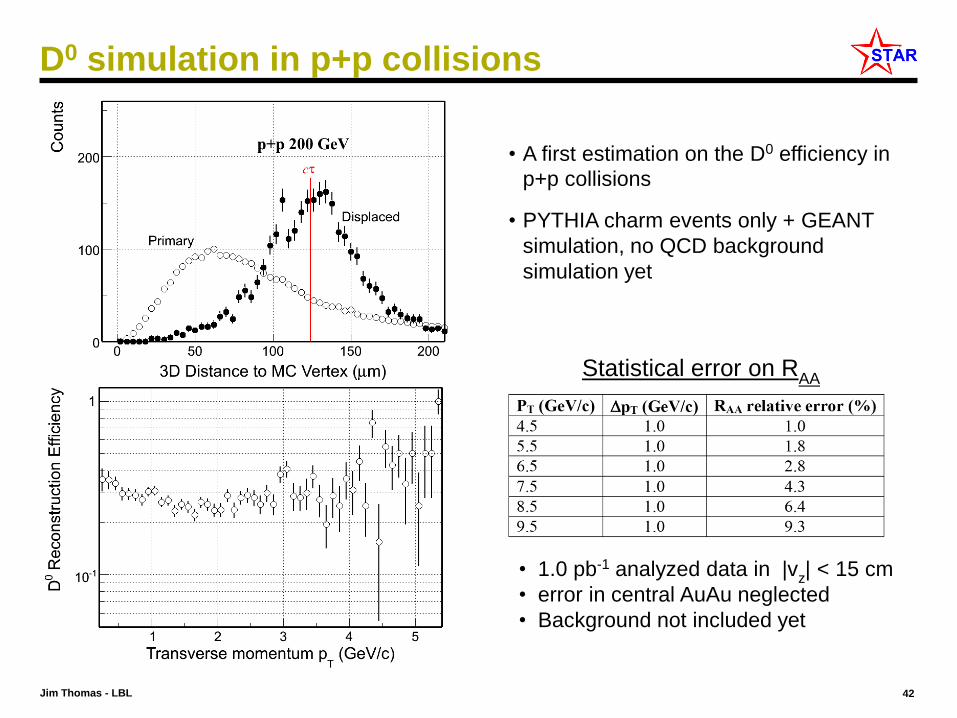
D0 simulation in p+p collisions
• A first estimation on the D0 efficiency in
p+p collisions
• PYTHIA charm events only + GEANT
simulation, no QCD background
simulation yet
Statistical error on RAA
• 1.0 pb-1 analyzed data in |vz| < 15 cm
• error in central AuAu neglected
• Background not included yet
Jim Thomas - LBL 43
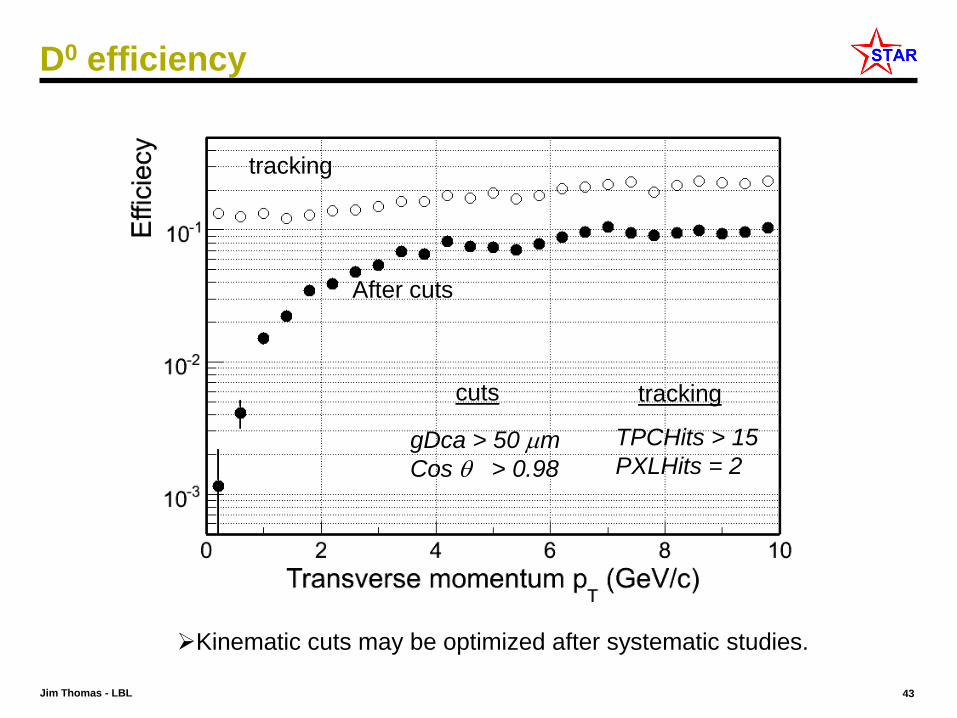
D0 efficiency
tracking
After cuts
gDca > 50 m
Cos > 0.98
TPCHits > 15
PXLHits = 2
trackingcuts
Kinematic cuts may be optimized after systematic studies.
Jim Thomas - LBL 44
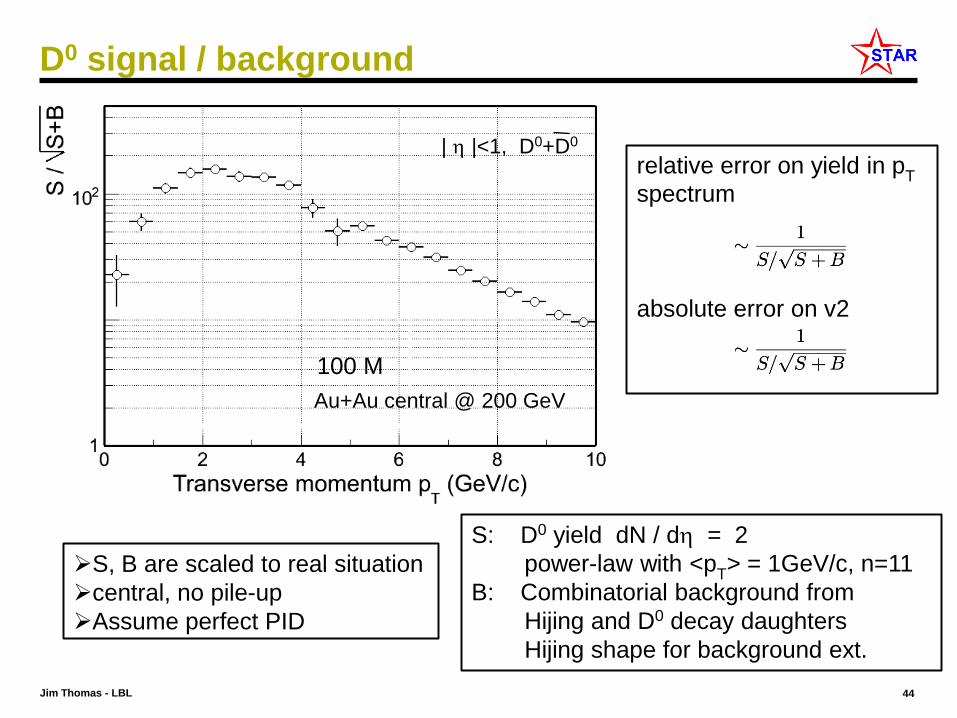
D0 signal / background
Au+Au central @ 200 GeV
S, B are scaled to real situation
central, no pile-up
Assume perfect PID
100 M
S: D0 yield dN / d = 2
power-law with <pT> = 1GeV/c, n=11
B: Combinatorial background from
Hijing and D0 decay daughters
Hijing shape for background ext.
| |<1, D0+D0
relative error on yield in pT
spectrum
absolute error on v2
Jim Thomas - LBL 45
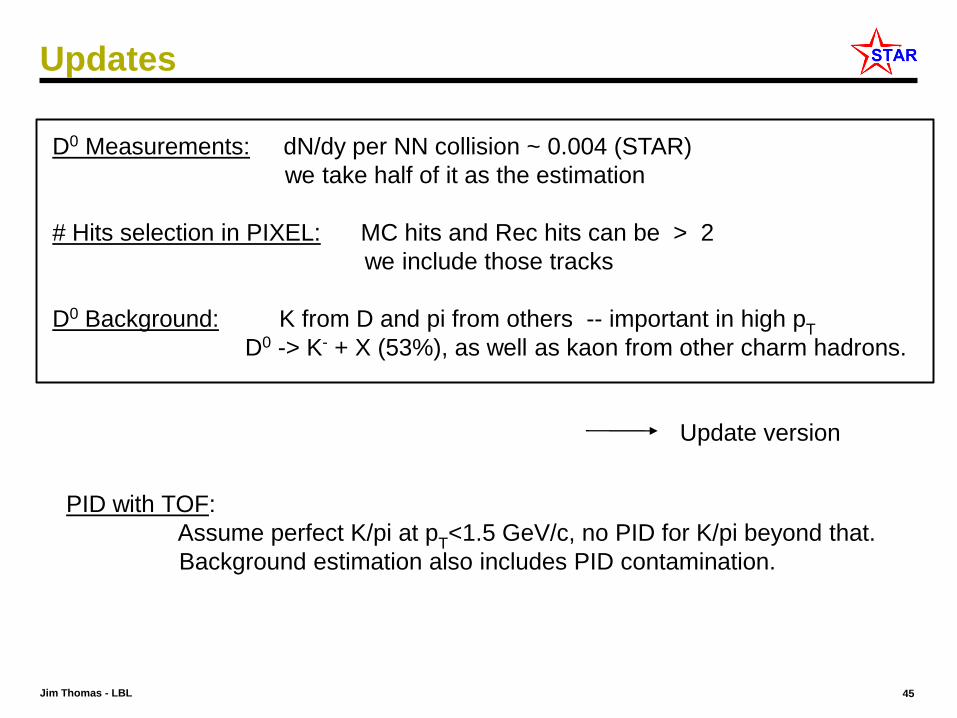
Updates
PID with TOF:
Assume perfect K/pi at pT<1.5 GeV/c, no PID for K/pi beyond that.
Background estimation also includes PID contamination.
D0 Measurements: dN/dy per NN collision ~ 0.004 (STAR)
we take half of it as the estimation
# Hits selection in PIXEL: MC hits and Rec hits can be > 2
we include those tracks
D0 Background: K from D and pi from others -- important in high pT
D0 -> K- + X (53%), as well as kaon from other charm hadrons.
Update version
Jim Thomas - LBL 46
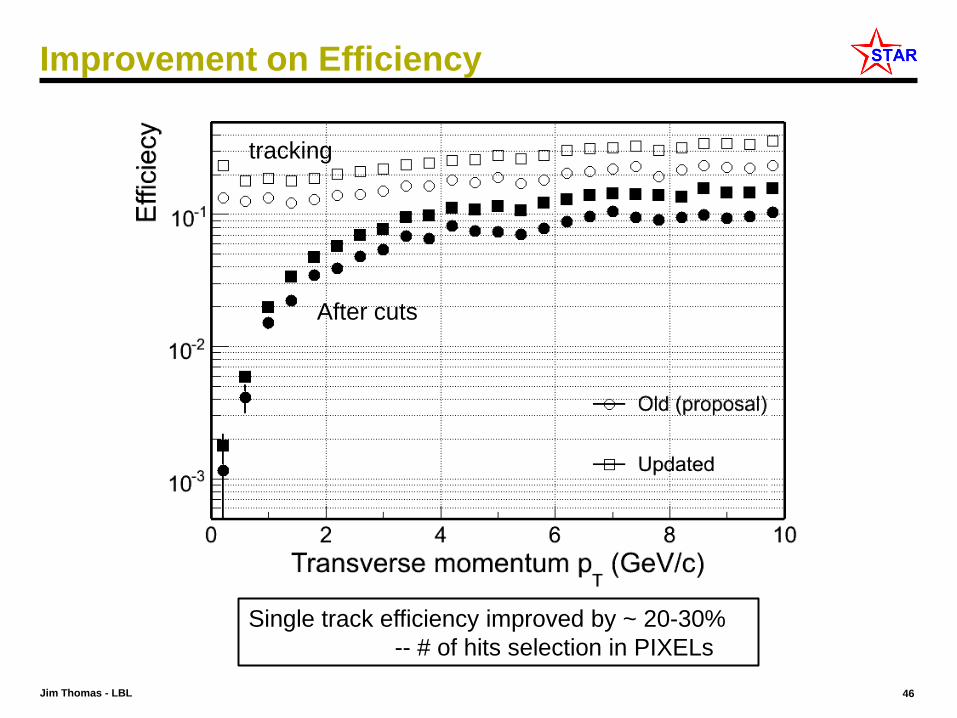
Improvement on Efficiency
tracking
After cuts
Single track efficiency improved by ~ 20-30%
-- # of hits selection in PIXELs
Jim Thomas - LBL 47
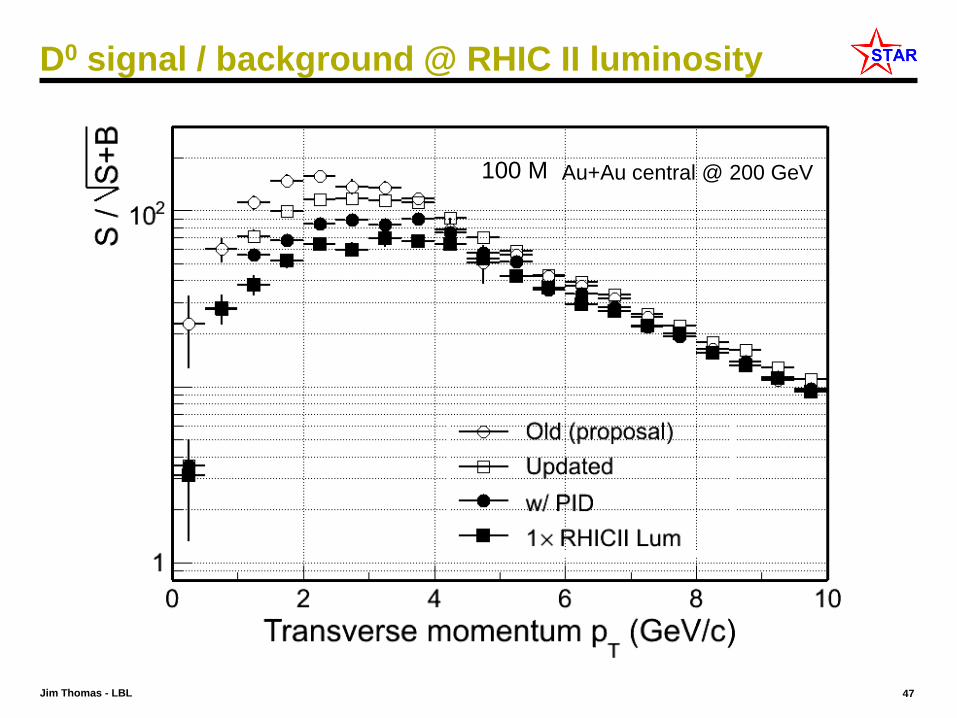
D0 signal / background @ RHIC II luminosity
Au+Au central @ 200 GeV100 M
Jim Thomas - LBL 48
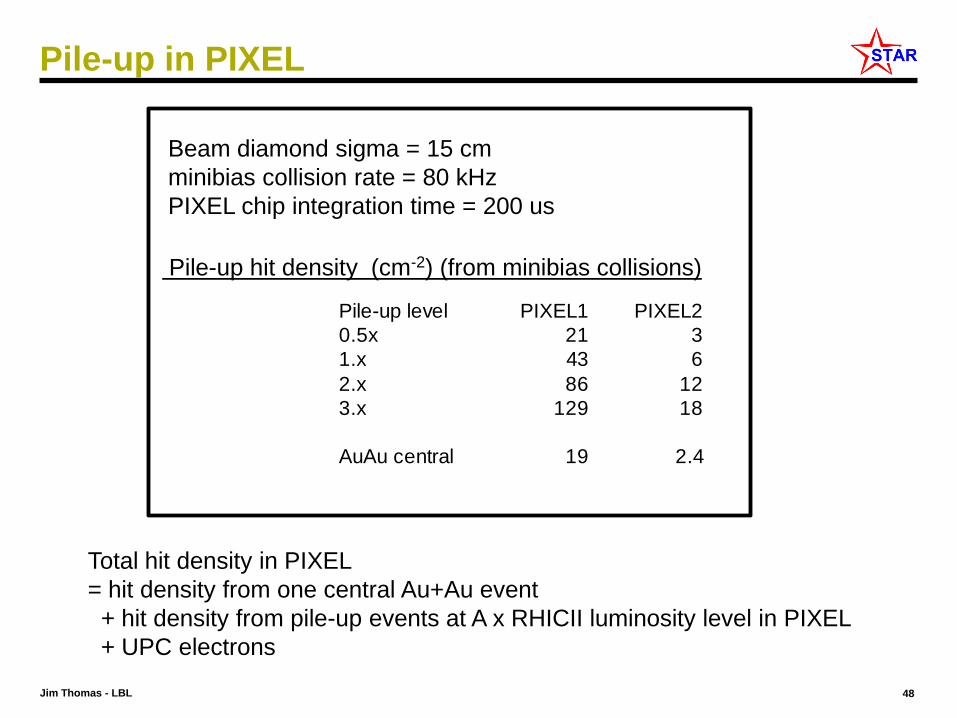
Pile-up in PIXEL
Total hit density in PIXEL
= hit density from one central Au+Au event
+ hit density from pile-up events at A x RHICII luminosity level in PIXEL
+ UPC electrons
Beam diamond sigma = 15 cm
minibias collision rate = 80 kHz
PIXEL chip integration time = 200 us
Pile-up hit density (cm-2) (from minibias collisions)
Pile-up level PIXEL1 PIXEL2
0.5x 21 3
1.x 43 6
2.x 86 12
3.x 129 18
AuAu central 19 2.4
Jim Thomas - LBL 49
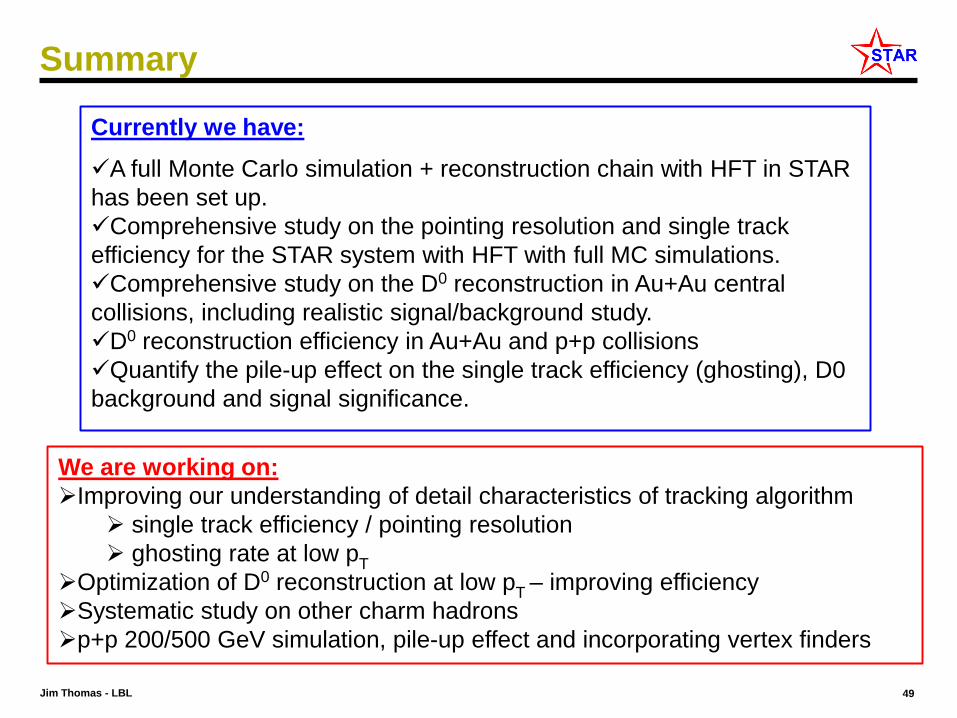
Summary
Currently we have:
A full Monte Carlo simulation + reconstruction chain with HFT in STAR
has been set up.
Comprehensive study on the pointing resolution and single track
efficiency for the STAR system with HFT with full MC simulations.
Comprehensive study on the D0 reconstruction in Au+Au central
collisions, including realistic signal/background study.
D0 reconstruction efficiency in Au+Au and p+p collisions
Quantify the pile-up effect on the single track efficiency (ghosting), D0
background and signal significance.
We are working on:
Improving our understanding of detail characteristics of tracking algorithm
single track efficiency / pointing resolution
ghosting rate at low pT
Optimization of D0 reconstruction at low pT
– improving efficiency
Systematic study on other charm hadrons
p+p 200/500 GeV simulation, pile-up effect and incorporating vertex finders