high-entropy alloys as high-temperature thermoelectric...
TRANSCRIPT
High-entropy alloys as high-temperature thermoelectric materials
Samrand Shafeie,1,2 Sheng Guo,1,a) Qiang Hu,3 Henrik Fahlquist,4 Paul Erhart,5
and Anders Palmqvist2,b)
1Surface and Microstructure Engineering Group, Materials and Manufacturing Technology,Chalmers University of Technology, SE-41296 Gothenburg, Sweden2Department of Chemistry and Chemical Engineering, Chalmers University of Technology,SE-41296 Gothenburg, Sweden3Institute of Applied Physics, Jiangxi Academy of Sciences, Nanchang 330029, People’s Republic of China4Bruker AXS Nordic AB, 17067 Solna, Sweden5Department of Applied Physics, Chalmers University of Technology, SE-41296 Gothenburg, Sweden
(Received 27 August 2015; accepted 26 October 2015; published online 12 November 2015)
Thermoelectric (TE) generators that efficiently recycle a large portion of waste heat will be an
important complementary energy technology in the future. While many efficient TE materials exist
in the lower temperature region, few are efficient at high temperatures. Here, we present the high
temperature properties of high-entropy alloys (HEAs), as a potential new class of high temperature
TE materials. We show that their TE properties can be controlled significantly by changing the va-
lence electron concentration (VEC) of the system with appropriate substitutional elements. Both
the electrical and thermal transport properties in this system were found to decrease with a lower
VEC number. Overall, the large microstructural complexity and lower average VEC in these types
of alloys can potentially be used to lower both the total and the lattice thermal conductivity. These
findings highlight the possibility to exploit HEAs as a new class of future high temperature TE
materials. VC 2015 AIP Publishing LLC. [http://dx.doi.org/10.1063/1.4935489]
INTRODUCTION
Waste heat recovery technologies are important future
complements to renewable energy sources.1 During the last
two decades, renewed interest in thermoelectric (TE) materi-
als for efficient waste heat recovery has spawned research
within nanostructured materials.2 In the search for TE mate-
rials with high conversion efficiency, the dimensionless TE
figure-of-merit zT has been used to estimate the performance.
It is defined as
zT ¼ S2rktot
T; (1)
where S is the Seebeck coefficient, r is the electrical conduc-
tivity, T is the absolute temperature in Kelvin, and jtot is the
total thermal conductivity. Maximizing the power factor
(PF ¼ S2r) while minimizing jtot is the most widely
employed strategy; however, due to the fundamentally inter-
connected nature of the three material parameters (S, r,jsos), the general approach for a specific material boils down
to a strongly nonlinear optimization problem.1 To this end,
new approaches related to low dimensional materials and
nanostructuring for decoupling and changing the parameters
independently have led to significant improvements in the zTof current state-of-the-art TE materials.2
To reach industrially feasible materials for global use,
high performance TE materials must contain low cost earth
abundant elements with low toxicity. Yet, most high perform-
ing TE materials at low to medium temperatures ranging up to
�600 �C (e.g., Bi2Te3, PbTe, and (Bi1�xSbx)2(Se1�yTey)3)
contain toxic or scarce elements based on p-block elements,
and recent focus has therefore shifted towards using new
structure types (e.g., half-Heusler alloys3) to meet this prereq-
uisite. For high temperature (HT) applications with
T> 800 �C, the aforementioned materials based on p-block
elements will quickly degrade, and therefore attention has
been directed towards thermally more stable materials, e.g.,
oxides, magnesium silicides, and Zintl compounds.1,4,5 The
advantages of HT TE materials are many (e.g., lower zT is
required to recover the same amount of energy compared with
lower temperatures, and large scale industrial waste heat re-
covery is possible), though few materials at the moment
deliver high performance (zT> 1) at T> 800 �C.1,2,6 Among
the state-of-the-art metallic compounds and alloys with n-type
conductivity, very few examples are known to exhibit high
enough zT values that can compete with the state-of-the-art n-
type SiGe compounds1 at T� 800 �C with zT� 1 (e.g., half-
Heusler type materials3,7,8). The main drawback of half-
Heusler compounds have long been their large lattice (jlatt)
and electrical thermal conductivity (je) that hamper their use
as commercial HT-TE materials (zT at least �1 at
�600–700 �C).8 Some high performance half-Heusler com-
pounds also contain costly precious metals such as Pd,9 or are
only efficient at very low temperatures.10
Recently, high entropy alloys (HEAs) have been proposed
as novel types of alloys with many intriguing structural and
functional properties.11–13 HEAs are constituted of at least 5
different elements in equimolar or close to equimolar amounts,
and the enhanced configurational entropic contribution, partic-
ularly at elevated temperatures, can thermodynamically stabi-
lize the formation of solid solutions.14 Apart from the
a)E-mail: [email protected])E-mail: [email protected]
0021-8979/2015/118(18)/184905/10/$30.00 VC 2015 AIP Publishing LLC118, 184905-1
JOURNAL OF APPLIED PHYSICS 118, 184905 (2015)
formation of solid solutions, the complex phase space of these
alloys15–17 can potentially be used as a means to achieve
exceptional properties in areas where nanostructuring is of im-
portance.2,18,19 As a result, HEAs are currently being evaluated
for, e.g., their mechanical properties.11,20–22 Many new and
unexplored avenues still remain for these types of materials
(e.g., superconductivity23 and soft magnetic materials24,25).
Generally, the reduction of jlatt is an important step
towards a high zT of a TE material. This usually requires the
use of three key strategies: first, the scattering of phonons on
atomic length scales through rattling atoms, vacancies,
impurities, interstitials, or substitutional atoms (all related to
point defects in the material); second, the concept of
“phonon-glass electron crystal” (PGEC)26 should ideally be
fulfilled, i.e., phonons are scattered by complexity or disor-
der in the crystal structure, while electrons move freely as in
an “electron-crystal” (associated with the long range order in
the material); and third, through interfaces, e.g., mesoscale
grain and phase boundaries.1,19,27
In HEAs, all of the above phonon scattering strategies can
in principle be achieved simultaneously through the intrinsi-
cally complex nature of the materials. In general, HEAs offer
large amounts of complexity through severe lattice distortions,
point defects, or the precipitation of secondary phases in order
to scatter phonons effectively, while maintaining a high mobil-
ity of the conduction electrons. In addition to effective means
for phonon scattering, HEAs possess mostly high symmetry
crystal structures such as simple face centered cubic close
packing (FCC) or body centered cubic close packing (BCC),
or in some cases hexagonal cubic close packing (HCP). They
are, therefore, also likely to achieve a high convergence of the
bands close to the Fermi level to obtain high Seebeck coeffi-
cient values.28 The challenge in achieving high zT in these
materials is at the moment, therefore, related to the decrease in
the electrical conductivity that has a large negative impact on
the total thermal conductivity, and also on the Seebeck coeffi-
cient due to the excessive number of charge carriers.
Controlling the properties with high accuracy in HEAs
is a great challenge. However, some well-established rules
for prediction of solid solutions in HEAs have been
reported,29,30 and are based on the following parameters:
VEC ¼Xn
i¼1ciðVECÞi; (2)
d ¼ffiffiffiffiffiffiffiffiffiffiffiffiffiffiffiffiffiffiffiffiffiffiffiffiffiffiffiffiffiffiffiffiffiffiffiffiffiffiffiffiffiffiffiffiffiffiffiffiffiffiffiffiXn
i¼1ci 1� riPn
j¼1 cjrj
� �2s
; (3)
DHmix ¼Xn
i¼1;j 6¼i4cicjDHA�B: (4)
Here, the valence electron concentration (VEC) is the total
number of valence electrons including d-electrons, d is the
weighted atomic radii mismatch, and DHmix is the total
weighted DHA-B (based on Miedema’s values for binary
alloys31). In the above equations, ci and cj are the atomic per-
centages of elements i and j, and ri and rj are their atomic
radii, respectively.
To our knowledge, HEAs have not been reported before
in the context of TE, and therefore, offer completely new
possibilities regarding the exploration for HT-TE materi-
als.32,33 Due to the difficulty of tuning the charge carrier con-
centration in metals, many alloys have not been considered
for TE applications due to their large electron concentration
and low Seebeck coefficients. Nevertheless, the possibility to
form complex microstructures in HEAs (see, e.g., Refs. 16
and 17) offers opportunities for the reduction of the thermal
conductivity by phonon scattering.
Here, we present the investigation of a model HEA sys-
tem with the composition AlxCoCrFeNi (0.0� x� 3.0,
where x is the atomic portion) as a potential HT-TE material.
We show that for this system (for which only electrical and
thermal conductivities at intermediate temperatures for
0.0� x� 2.0 have previously been reported32), the VEC
(which is a well-established parameter for estimating the sta-
bility of FCC and BCC phase regions among HEA systems)
can be used as a general parameter to change the electrical
conductivity and Seebeck coefficients of these materials into
suitable ranges for TE materials. As a result of the addition
of Al, which is inserted in order to decrease the VEC of the
system, we observed a significant decrease in electrical con-
ductivity. This decrease in electrical conductivity was fol-
lowed by an increase in the absolute value of the Seebeck
coefficient. Overall, we also observed a significant decrease
in jtot (¼jeþjlatt), primarily due to a lower electrical contri-
bution, je. Possible causes for the enhanced zT are discussed
mainly for compositions in the range of 2.0� x� 3.0.
EXPERIMENTAL SECTION
Ingots of AlxCoCrFeNi with 0.0� x� 3.0 and Dx¼ 0.25
were prepared from commercially pure elements (puri-
ty� 99.9 wt. %). The raw elements were alloyed by arc-
melting in a Ti-gettered high-purity argon atmosphere. The
melting of the ingots with intermediate flipping was repeated
at least five times in order to achieve a good homogeneity of
the alloys. The ingots were grinded and polished to obtain a
smooth and clean surface. Phase constitutions of the ingots
were obtained with a Bruker x-ray diffractometer (XRD) D8
Advance diffractometer equipped with a Cra target
(ka1¼ 1.5406 A and ka2¼ 1.54439 A), operated at a voltage
of 35 kV and a current of 40 mA. Data were acquired in the
2h range of 10�–135� with a step size of 0.08�/step and 6 s/
step. To observe if additional phases were formed, samples
with x¼ 0.25, 0.75, 1.25, and 3.0 were analyzed by XRD af-
ter the electrical transport measurements. Differential scan-
ning calorimetry (DSC) measurements were performed on
small pieces of as-cast samples (�40–50 mg) placed in an
Al2O3 crucible and heated in a Netzsch STA 449F3. Heating
and cooling were performed in flowing Argon gas with a
temperature ramp of 10 �C min�1 from 30 to 900 �C. The
high temperature thermal conductivity, jtot, of the ingots
(x¼ 0.0, 2.0, 2.25, 2.5, 2.75, and 3.0) was measured in a Hot
Disk Thermal Constant Analyser TPS 2500S. The data were
analyzed by using the Hot Disk Thermal Constant Analyser
(Version 7.1.22) software. A Hot Disk sensor C5465 with a
radius of 3.189 mm and a double spiral made of Ni were
used for the measurements. Due to the Curie transition
(355 �C) of the Nickel sensor, data were not measured
184905-2 Shafeie et al. J. Appl. Phys. 118, 184905 (2015)
between 300 and 450 �C in order to obtain physically sensi-
ble results. Measurements were made in helium atmosphere
by means of the transient plane source (TPS) method34
between 105 and 505 �C with 4 measurements at each tem-
perature to obtain better accuracy. The presented results are
averages of the 4 measurement points, where the correspond-
ing standard deviation at each temperature is indicated with
an error bar in the figures. For all samples, a measurement
time of 2 s with an applied power output between 150 and
250 mW was used with a waiting time between 40 and
60 min between each measurement. Single sided measure-
ments were made with the sensor sandwiched between the
flat polished ingot sample surface and thermally insulating
quartz fiber. The error for the measurement points is esti-
mated to be �3%–5% on average among measured points at
each temperature.
Temperature dependent electrical resistivity (1/r) and
Seebeck coefficients (S) for different samples were measured
using as-cast samples in an ULVAC ZEM-3 instrument.
Sample dimensions ranged between �6 and 11 mm in length,
with an average side length/diameter of �2–3 mm.
Measurements were performed from room temperature to
�900 �C with �0.1 bar helium gas in the measurement
chamber. In the ULVAC ZEM-3, the resistivity (1/r) was
measured with a standard 4-point probe method by sending
the current through the sample rod, while simultaneously
measuring the voltage difference along the length of the rod.
The Seebeck coefficient was simultaneously obtained by
heating one end of the sample, while measuring the gener-
ated voltage between the probes. For each measured temper-
ature point of the Seebeck coefficient, temperature
differences of DT¼ 20, 30, and 40 �C were used in order to
minimize measurement errors. All measurements were per-
formed using heating and cooling cycles in order to observe
possible hysteresis effects in the as-cast samples. The hyster-
esis effect from the first heating in the samples has been
excluded due to irreversible changes when starting from an
as-cast state; the presented values are thus represented as
average values for the measured temperature ranges with an
estimated total error of ��3% between two consecutive
measurements. For comparison, remeasured values for
x¼ 0.0 and 1.75 are shown in the supplementary material for
the electrical conductivity (Figure S1, supplementary mate-
rial), Seebeck coefficients (Figure S2, supplementary mate-
rial), and power factors (Figure S3, supplementary material);
in addition, the thermal conductivity (Figure S4, supplemen-
tary material) for x¼ 2.25 was remeasured after remelting to
check the reproducibility of the thermal conductivity values
for the same sample.35 In addition, the total, electronic, and
lattice thermal conductivities are also included for x¼ 2.0,
2.25, 2.5, 2.75, and 3.0 as additional information (Figures
S5–S9, supplementary material).35 Overall, it should be
noted that the 1st heating from room temperature up to
900 �C is excluded, due to a hysteresis effect in the electrical
conductivity and Seebeck coefficients that can be related to
microstructural changes as well as local compositional
changes. It was, however, noted that after reaching 900 �Csuch effects were not observed in the 2nd and 3rd cycles. We
observed that for some compositions with large x> 2, the
hysteresis could start already at �100 �C, thus indicating that
equilibration might start already at those temperatures. The
measurement time at �800–900 �C was estimated to be 5 h
from the time stamps in the raw data, and the total time for 3
cycles at T> 500 �C was �20 h. Assuming that the equilibra-
tion starts already at �100 �C, equilibration has taken place
for �90 h during the 3 cycles that were used. Hence, the av-
erage of those “equilibrated” measurements has been shown
in this report. The microstructural effects of before and after
annealing at the maximum temperature will be reported else-
where and are not the focus of this investigation.
RESULTS
Phase identification
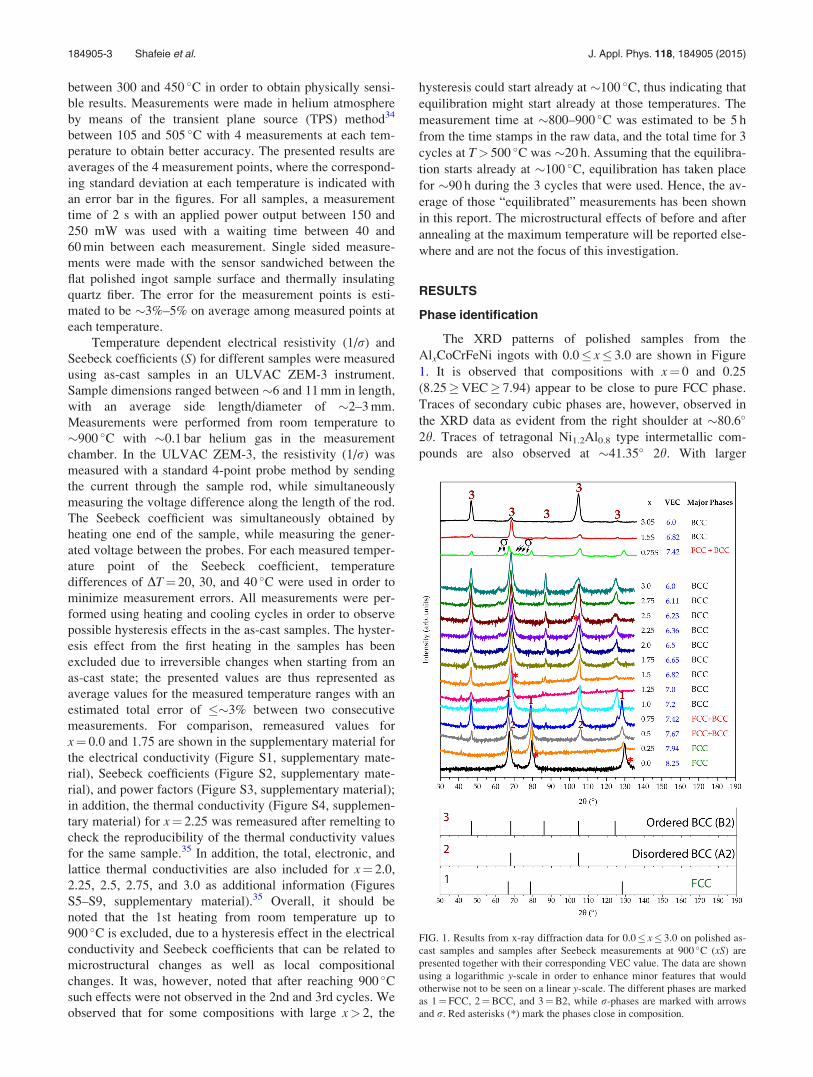
The XRD patterns of polished samples from the
AlxCoCrFeNi ingots with 0.0� x� 3.0 are shown in Figure
1. It is observed that compositions with x¼ 0 and 0.25
(8.25�VEC� 7.94) appear to be close to pure FCC phase.
Traces of secondary cubic phases are, however, observed in
the XRD data as evident from the right shoulder at �80.6�
2h. Traces of tetragonal Ni1.2Al0.8 type intermetallic com-
pounds are also observed at �41.35� 2h. With larger
FIG. 1. Results from x-ray diffraction data for 0.0� x� 3.0 on polished as-
cast samples and samples after Seebeck measurements at 900 �C (xS) are
presented together with their corresponding VEC value. The data are shown
using a logarithmic y-scale in order to enhance minor features that would
otherwise not to be seen on a linear y-scale. The different phases are marked
as 1¼FCC, 2¼BCC, and 3¼B2, while r-phases are marked with arrows
and r. Red asterisks (*) mark the phases close in composition.
184905-3 Shafeie et al. J. Appl. Phys. 118, 184905 (2015)
amounts of Al, with x¼ 0.5 and 0.75 (7.67�VEC� 7.42),
additional phases are present. These include disordered (A2)
and ordered (B2) BCC type phases. Compositions in the
range 1.0� x� 3.0 (7.2�VEC� 6) are observed to form a
mixture of A2 and B2 phases. For Al0.75CoCrFeNi, a
(re)measurement after exposure to T� 900 �C during electri-
cal resistivity and Seebeck coefficient measurements (0.75 S
in Figure 1) indicates the formation of minor intermetallic
phases (r-phase). Due to the strong preferred orientation
(seen in the XRD data as strong variations in the relative in-
tensity between peaks) commonly observed for HEAs,36 the
determination of the actual weight fractions of different
phases from XRD is subject to large errors, and it is therefore
not presented in this study.
Thermal analysis
From the DSC measurements on samples with 0.0< x� 3.0 (see Figure 2), a background typical for metals is
observed for all samples during heating. This change in
background is related to irreversible changes in the material.
For x¼ 0.25 and 0.5, no observable anomaly in the heat flow
is observed. For 0.75� x� 1.5 (mixed FCCþBCC region),
discernable endothermic features, however, start to appear in
the temperature range 500 �C<T< 700 �C, with a maximum
in magnitude observed for x¼ 1.0. At higher Al substitu-
tions, i.e., x> 1. 5, no significant features are observed.
Finally, for x¼ 0.25 (FCC) as well as x¼ 1.75, 2.0, 2.5, 2.75,
and 3.0 (ordered BCC phases) smooth curves are observed
up to 900 �C, indicating the absence of precipitation of sec-
ondary intermetallic phases.
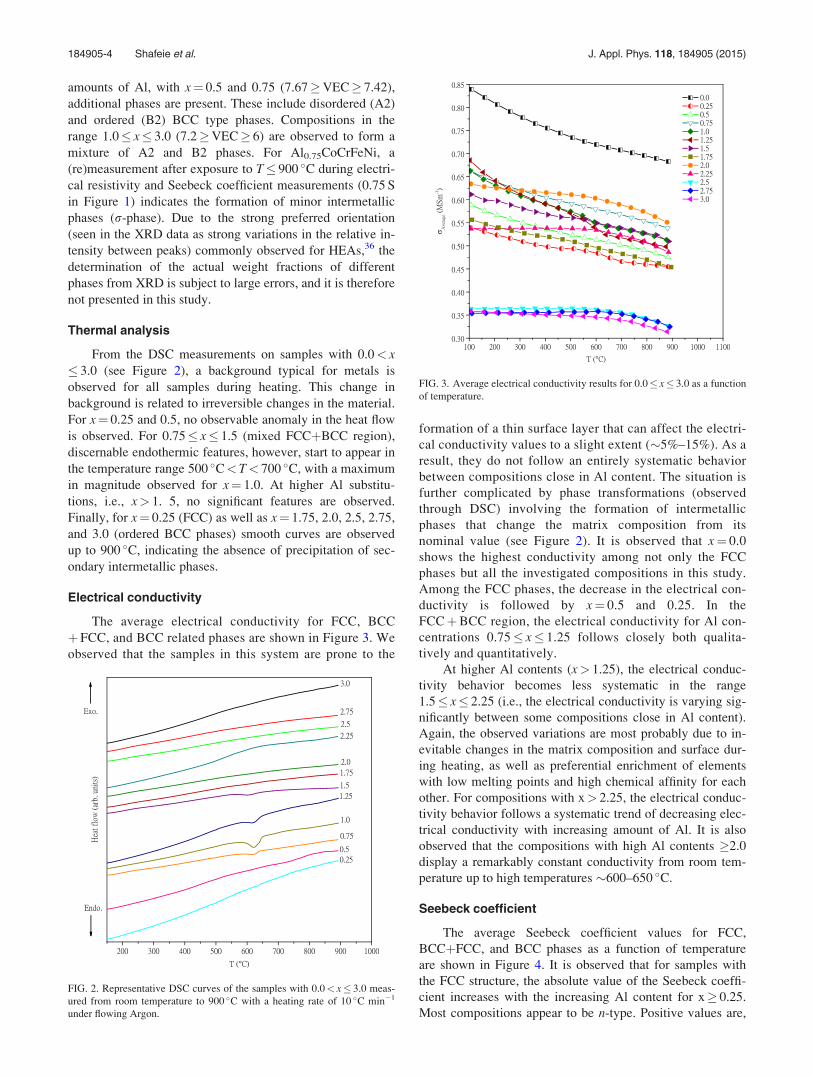
Electrical conductivity
The average electrical conductivity for FCC, BCC
þFCC, and BCC related phases are shown in Figure 3. We
observed that the samples in this system are prone to the
formation of a thin surface layer that can affect the electri-
cal conductivity values to a slight extent (�5%–15%). As a
result, they do not follow an entirely systematic behavior
between compositions close in Al content. The situation is
further complicated by phase transformations (observed
through DSC) involving the formation of intermetallic
phases that change the matrix composition from its
nominal value (see Figure 2). It is observed that x¼ 0.0
shows the highest conductivity among not only the FCC
phases but all the investigated compositions in this study.
Among the FCC phases, the decrease in the electrical con-
ductivity is followed by x¼ 0.5 and 0.25. In the
FCCþBCC region, the electrical conductivity for Al con-
centrations 0.75� x� 1.25 follows closely both qualita-
tively and quantitatively.
At higher Al contents (x> 1.25), the electrical conduc-
tivity behavior becomes less systematic in the range
1.5� x� 2.25 (i.e., the electrical conductivity is varying sig-
nificantly between some compositions close in Al content).
Again, the observed variations are most probably due to in-
evitable changes in the matrix composition and surface dur-
ing heating, as well as preferential enrichment of elements
with low melting points and high chemical affinity for each
other. For compositions with x> 2.25, the electrical conduc-
tivity behavior follows a systematic trend of decreasing elec-
trical conductivity with increasing amount of Al. It is also
observed that the compositions with high Al contents �2.0
display a remarkably constant conductivity from room tem-
perature up to high temperatures �600–650 �C.
Seebeck coefficient
The average Seebeck coefficient values for FCC,
BCCþFCC, and BCC phases as a function of temperature
are shown in Figure 4. It is observed that for samples with
the FCC structure, the absolute value of the Seebeck coeffi-
cient increases with the increasing Al content for x� 0.25.
Most compositions appear to be n-type. Positive values are,
FIG. 2. Representative DSC curves of the samples with 0.0< x� 3.0 meas-
ured from room temperature to 900 �C with a heating rate of 10 �C min�1
under flowing Argon.
FIG. 3. Average electrical conductivity results for 0.0� x� 3.0 as a function
of temperature.
184905-4 Shafeie et al. J. Appl. Phys. 118, 184905 (2015)
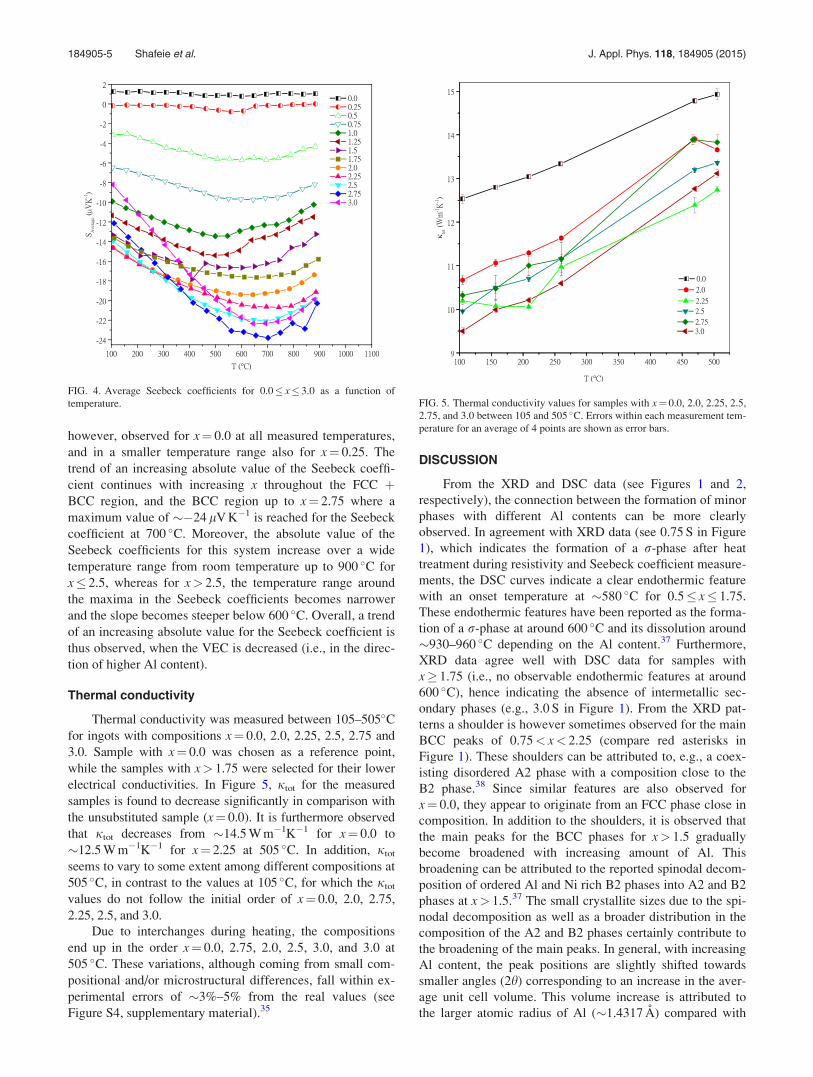
however, observed for x¼ 0.0 at all measured temperatures,
and in a smaller temperature range also for x¼ 0.25. The
trend of an increasing absolute value of the Seebeck coeffi-
cient continues with increasing x throughout the FCC þBCC region, and the BCC region up to x¼ 2.75 where a
maximum value of ��24 lV K�1 is reached for the Seebeck
coefficient at 700 �C. Moreover, the absolute value of the
Seebeck coefficients for this system increase over a wide
temperature range from room temperature up to 900 �C for
x� 2.5, whereas for x> 2.5, the temperature range around
the maxima in the Seebeck coefficients becomes narrower
and the slope becomes steeper below 600 �C. Overall, a trend
of an increasing absolute value for the Seebeck coefficient is
thus observed, when the VEC is decreased (i.e., in the direc-
tion of higher Al content).
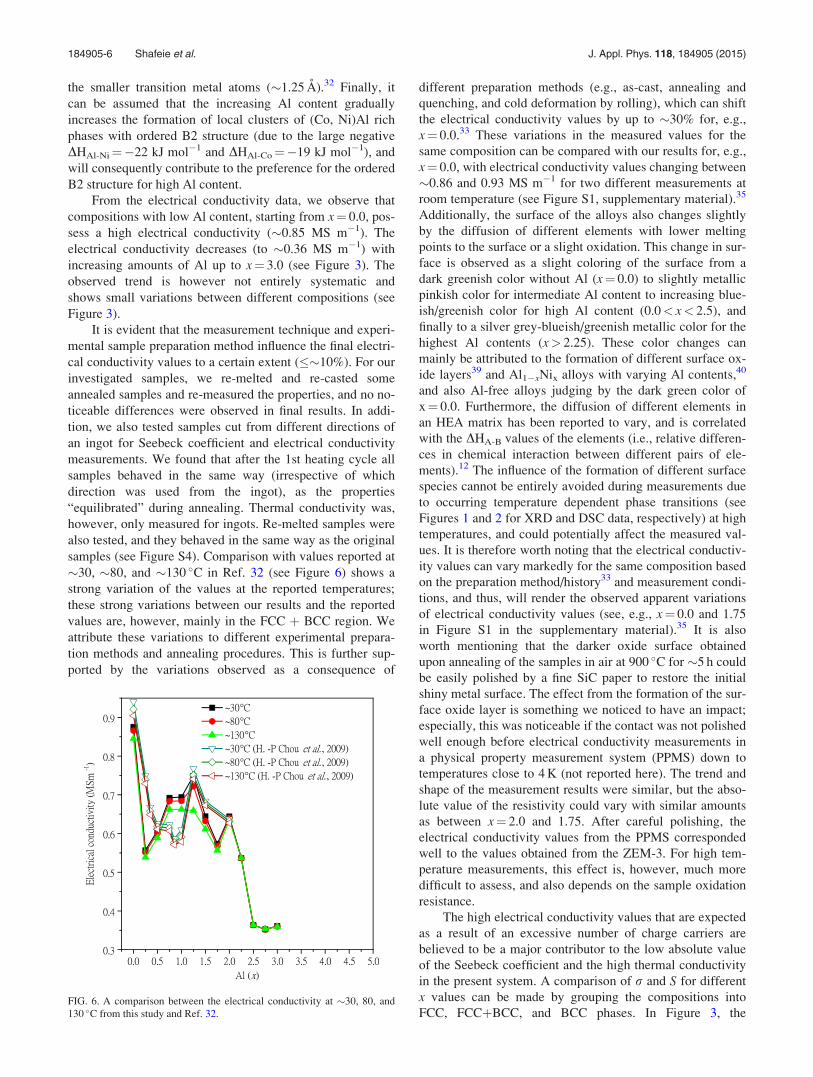
Thermal conductivity
Thermal conductivity was measured between 105–505�Cfor ingots with compositions x¼ 0.0, 2.0, 2.25, 2.5, 2.75 and
3.0. Sample with x¼ 0.0 was chosen as a reference point,
while the samples with x> 1.75 were selected for their lower
electrical conductivities. In Figure 5, jtot for the measured
samples is found to decrease significantly in comparison with
the unsubstituted sample (x¼ 0.0). It is furthermore observed
that jtot decreases from �14.5 W m�1K�1 for x¼ 0.0 to
�12.5 W m�1K�1 for x¼ 2.25 at 505 �C. In addition, jtot
seems to vary to some extent among different compositions at
505 �C, in contrast to the values at 105 �C, for which the jtot
values do not follow the initial order of x¼ 0.0, 2.0, 2.75,
2.25, 2.5, and 3.0.
Due to interchanges during heating, the compositions
end up in the order x¼ 0.0, 2.75, 2.0, 2.5, 3.0, and 3.0 at
505 �C. These variations, although coming from small com-
positional and/or microstructural differences, fall within ex-
perimental errors of �3%–5% from the real values (see
Figure S4, supplementary material).35
DISCUSSION
From the XRD and DSC data (see Figures 1 and 2,
respectively), the connection between the formation of minor
phases with different Al contents can be more clearly
observed. In agreement with XRD data (see 0.75 S in Figure
1), which indicates the formation of a r-phase after heat
treatment during resistivity and Seebeck coefficient measure-
ments, the DSC curves indicate a clear endothermic feature
with an onset temperature at �580 �C for 0.5� x� 1.75.
These endothermic features have been reported as the forma-
tion of a r-phase at around 600 �C and its dissolution around
�930–960 �C depending on the Al content.37 Furthermore,
XRD data agree well with DSC data for samples with
x� 1.75 (i.e., no observable endothermic features at around
600 �C), hence indicating the absence of intermetallic sec-
ondary phases (e.g., 3.0 S in Figure 1). From the XRD pat-
terns a shoulder is however sometimes observed for the main
BCC peaks of 0.75< x< 2.25 (compare red asterisks in
Figure 1). These shoulders can be attributed to, e.g., a coex-
isting disordered A2 phase with a composition close to the
B2 phase.38 Since similar features are also observed for
x¼ 0.0, they appear to originate from an FCC phase close in
composition. In addition to the shoulders, it is observed that
the main peaks for the BCC phases for x> 1.5 gradually
become broadened with increasing amount of Al. This
broadening can be attributed to the reported spinodal decom-
position of ordered Al and Ni rich B2 phases into A2 and B2
phases at x> 1.5.37 The small crystallite sizes due to the spi-
nodal decomposition as well as a broader distribution in the
composition of the A2 and B2 phases certainly contribute to
the broadening of the main peaks. In general, with increasing
Al content, the peak positions are slightly shifted towards
smaller angles (2h) corresponding to an increase in the aver-
age unit cell volume. This volume increase is attributed to
the larger atomic radius of Al (�1.4317 A) compared with
FIG. 4. Average Seebeck coefficients for 0.0� x� 3.0 as a function of
temperature. FIG. 5. Thermal conductivity values for samples with x¼ 0.0, 2.0, 2.25, 2.5,
2.75, and 3.0 between 105 and 505 �C. Errors within each measurement tem-
perature for an average of 4 points are shown as error bars.
184905-5 Shafeie et al. J. Appl. Phys. 118, 184905 (2015)
the smaller transition metal atoms (�1.25 A).32 Finally, it
can be assumed that the increasing Al content gradually
increases the formation of local clusters of (Co, Ni)Al rich
phases with ordered B2 structure (due to the large negative
DHAl-Ni¼�22 kJ mol�1 and DHAl-Co¼�19 kJ mol�1), and
will consequently contribute to the preference for the ordered
B2 structure for high Al content.
From the electrical conductivity data, we observe that
compositions with low Al content, starting from x¼ 0.0, pos-
sess a high electrical conductivity (�0.85 MS m�1). The
electrical conductivity decreases (to �0.36 MS m�1) with
increasing amounts of Al up to x¼ 3.0 (see Figure 3). The
observed trend is however not entirely systematic and
shows small variations between different compositions (see
Figure 3).
It is evident that the measurement technique and experi-
mental sample preparation method influence the final electri-
cal conductivity values to a certain extent (��10%). For our
investigated samples, we re-melted and re-casted some
annealed samples and re-measured the properties, and no no-
ticeable differences were observed in final results. In addi-
tion, we also tested samples cut from different directions of
an ingot for Seebeck coefficient and electrical conductivity
measurements. We found that after the 1st heating cycle all
samples behaved in the same way (irrespective of which
direction was used from the ingot), as the properties
“equilibrated” during annealing. Thermal conductivity was,
however, only measured for ingots. Re-melted samples were
also tested, and they behaved in the same way as the original
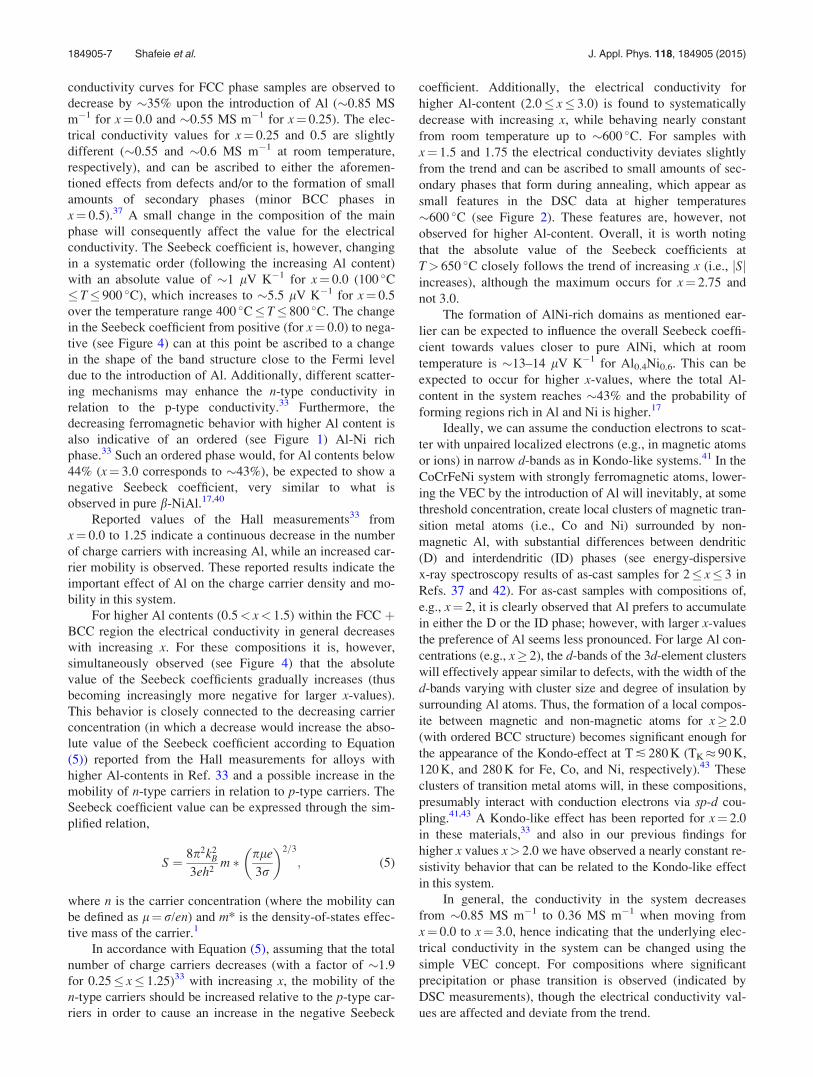
samples (see Figure S4). Comparison with values reported at
�30, �80, and �130 �C in Ref. 32 (see Figure 6) shows a
strong variation of the values at the reported temperatures;
these strong variations between our results and the reported
values are, however, mainly in the FCC þ BCC region. We
attribute these variations to different experimental prepara-
tion methods and annealing procedures. This is further sup-
ported by the variations observed as a consequence of
different preparation methods (e.g., as-cast, annealing and
quenching, and cold deformation by rolling), which can shift
the electrical conductivity values by up to �30% for, e.g.,
x¼ 0.0.33 These variations in the measured values for the
same composition can be compared with our results for, e.g.,
x¼ 0.0, with electrical conductivity values changing between
�0.86 and 0.93 MS m�1 for two different measurements at
room temperature (see Figure S1, supplementary material).35
Additionally, the surface of the alloys also changes slightly
by the diffusion of different elements with lower melting
points to the surface or a slight oxidation. This change in sur-
face is observed as a slight coloring of the surface from a
dark greenish color without Al (x¼ 0.0) to slightly metallic
pinkish color for intermediate Al content to increasing blue-
ish/greenish color for high Al content (0.0< x< 2.5), and
finally to a silver grey-blueish/greenish metallic color for the
highest Al contents (x> 2.25). These color changes can
mainly be attributed to the formation of different surface ox-
ide layers39 and Al1�xNix alloys with varying Al contents,40
and also Al-free alloys judging by the dark green color of
x¼ 0.0. Furthermore, the diffusion of different elements in
an HEA matrix has been reported to vary, and is correlated
with the DHA-B values of the elements (i.e., relative differen-
ces in chemical interaction between different pairs of ele-
ments).12 The influence of the formation of different surface
species cannot be entirely avoided during measurements due
to occurring temperature dependent phase transitions (see
Figures 1 and 2 for XRD and DSC data, respectively) at high
temperatures, and could potentially affect the measured val-
ues. It is therefore worth noting that the electrical conductiv-
ity values can vary markedly for the same composition based
on the preparation method/history33 and measurement condi-
tions, and thus, will render the observed apparent variations
of electrical conductivity values (see, e.g., x¼ 0.0 and 1.75
in Figure S1 in the supplementary material).35 It is also
worth mentioning that the darker oxide surface obtained
upon annealing of the samples in air at 900 �C for �5 h could
be easily polished by a fine SiC paper to restore the initial
shiny metal surface. The effect from the formation of the sur-
face oxide layer is something we noticed to have an impact;
especially, this was noticeable if the contact was not polished
well enough before electrical conductivity measurements in
a physical property measurement system (PPMS) down to
temperatures close to 4 K (not reported here). The trend and
shape of the measurement results were similar, but the abso-
lute value of the resistivity could vary with similar amounts
as between x¼ 2.0 and 1.75. After careful polishing, the
electrical conductivity values from the PPMS corresponded
well to the values obtained from the ZEM-3. For high tem-
perature measurements, this effect is, however, much more
difficult to assess, and also depends on the sample oxidation
resistance.
The high electrical conductivity values that are expected
as a result of an excessive number of charge carriers are
believed to be a major contributor to the low absolute value
of the Seebeck coefficient and the high thermal conductivity
in the present system. A comparison of r and S for different
x values can be made by grouping the compositions into
FCC, FCCþBCC, and BCC phases. In Figure 3, theFIG. 6. A comparison between the electrical conductivity at �30, 80, and
130 �C from this study and Ref. 32.
184905-6 Shafeie et al. J. Appl. Phys. 118, 184905 (2015)
conductivity curves for FCC phase samples are observed to
decrease by �35% upon the introduction of Al (�0.85 MS
m�1 for x¼ 0.0 and �0.55 MS m�1 for x¼ 0.25). The elec-
trical conductivity values for x¼ 0.25 and 0.5 are slightly
different (�0.55 and �0.6 MS m�1 at room temperature,
respectively), and can be ascribed to either the aforemen-
tioned effects from defects and/or to the formation of small
amounts of secondary phases (minor BCC phases in
x¼ 0.5).37 A small change in the composition of the main
phase will consequently affect the value for the electrical
conductivity. The Seebeck coefficient is, however, changing
in a systematic order (following the increasing Al content)
with an absolute value of �1 lV K�1 for x¼ 0.0 (100 �C�T� 900 �C), which increases to �5.5 lV K�1 for x¼ 0.5
over the temperature range 400 �C�T� 800 �C. The change
in the Seebeck coefficient from positive (for x¼ 0.0) to nega-
tive (see Figure 4) can at this point be ascribed to a change
in the shape of the band structure close to the Fermi level
due to the introduction of Al. Additionally, different scatter-
ing mechanisms may enhance the n-type conductivity in
relation to the p-type conductivity.33 Furthermore, the
decreasing ferromagnetic behavior with higher Al content is
also indicative of an ordered (see Figure 1) Al-Ni rich
phase.33 Such an ordered phase would, for Al contents below
44% (x¼ 3.0 corresponds to �43%), be expected to show a
negative Seebeck coefficient, very similar to what is
observed in pure b-NiAl.17,40
Reported values of the Hall measurements33 from
x¼ 0.0 to 1.25 indicate a continuous decrease in the number
of charge carriers with increasing Al, while an increased car-
rier mobility is observed. These reported results indicate the
important effect of Al on the charge carrier density and mo-
bility in this system.
For higher Al contents (0.5< x< 1.5) within the FCC þBCC region the electrical conductivity in general decreases
with increasing x. For these compositions it is, however,
simultaneously observed (see Figure 4) that the absolute
value of the Seebeck coefficients gradually increases (thus
becoming increasingly more negative for larger x-values).
This behavior is closely connected to the decreasing carrier
concentration (in which a decrease would increase the abso-
lute value of the Seebeck coefficient according to Equation
(5)) reported from the Hall measurements for alloys with
higher Al-contents in Ref. 33 and a possible increase in the
mobility of n-type carriers in relation to p-type carriers. The
Seebeck coefficient value can be expressed through the sim-
plified relation,
S ¼ 8p2k2B
3eh2m � ple
3r
� �2=3
; (5)
where n is the carrier concentration (where the mobility can
be defined as l¼ r/en) and m* is the density-of-states effec-
tive mass of the carrier.1
In accordance with Equation (5), assuming that the total
number of charge carriers decreases (with a factor of �1.9
for 0.25� x� 1.25)33 with increasing x, the mobility of the
n-type carriers should be increased relative to the p-type car-
riers in order to cause an increase in the negative Seebeck
coefficient. Additionally, the electrical conductivity for
higher Al-content (2.0� x� 3.0) is found to systematically
decrease with increasing x, while behaving nearly constant
from room temperature up to �600 �C. For samples with
x¼ 1.5 and 1.75 the electrical conductivity deviates slightly
from the trend and can be ascribed to small amounts of sec-
ondary phases that form during annealing, which appear as
small features in the DSC data at higher temperatures
�600 �C (see Figure 2). These features are, however, not
observed for higher Al-content. Overall, it is worth noting
that the absolute value of the Seebeck coefficients at
T> 650 �C closely follows the trend of increasing x (i.e., jSjincreases), although the maximum occurs for x¼ 2.75 and
not 3.0.
The formation of AlNi-rich domains as mentioned ear-
lier can be expected to influence the overall Seebeck coeffi-
cient towards values closer to pure AlNi, which at room
temperature is �13–14 lV K�1 for Al0.4Ni0.6. This can be
expected to occur for higher x-values, where the total Al-
content in the system reaches �43% and the probability of
forming regions rich in Al and Ni is higher.17
Ideally, we can assume the conduction electrons to scat-
ter with unpaired localized electrons (e.g., in magnetic atoms
or ions) in narrow d-bands as in Kondo-like systems.41 In the
CoCrFeNi system with strongly ferromagnetic atoms, lower-
ing the VEC by the introduction of Al will inevitably, at some
threshold concentration, create local clusters of magnetic tran-
sition metal atoms (i.e., Co and Ni) surrounded by non-
magnetic Al, with substantial differences between dendritic
(D) and interdendritic (ID) phases (see energy-dispersive
x-ray spectroscopy results of as-cast samples for 2� x� 3 in
Refs. 37 and 42). For as-cast samples with compositions of,
e.g., x¼ 2, it is clearly observed that Al prefers to accumulate
in either the D or the ID phase; however, with larger x-values
the preference of Al seems less pronounced. For large Al con-
centrations (e.g., x� 2), the d-bands of the 3d-element clusters
will effectively appear similar to defects, with the width of the
d-bands varying with cluster size and degree of insulation by
surrounding Al atoms. Thus, the formation of a local compos-
ite between magnetic and non-magnetic atoms for x� 2.0
(with ordered BCC structure) becomes significant enough for
the appearance of the Kondo-effect at T � 280 K (TK� 90 K,
120 K, and 280 K for Fe, Co, and Ni, respectively).43 These
clusters of transition metal atoms will, in these compositions,
presumably interact with conduction electrons via sp-d cou-
pling.41,43 A Kondo-like effect has been reported for x¼ 2.0
in these materials,33 and also in our previous findings for
higher x values x> 2.0 we have observed a nearly constant re-
sistivity behavior that can be related to the Kondo-like effect
in this system.
In general, the conductivity in the system decreases
from �0.85 MS m�1 to 0.36 MS m�1 when moving from
x¼ 0.0 to x¼ 3.0, hence indicating that the underlying elec-
trical conductivity in the system can be changed using the
simple VEC concept. For compositions where significant
precipitation or phase transition is observed (indicated by
DSC measurements), though the electrical conductivity val-
ues are affected and deviate from the trend.
184905-7 Shafeie et al. J. Appl. Phys. 118, 184905 (2015)
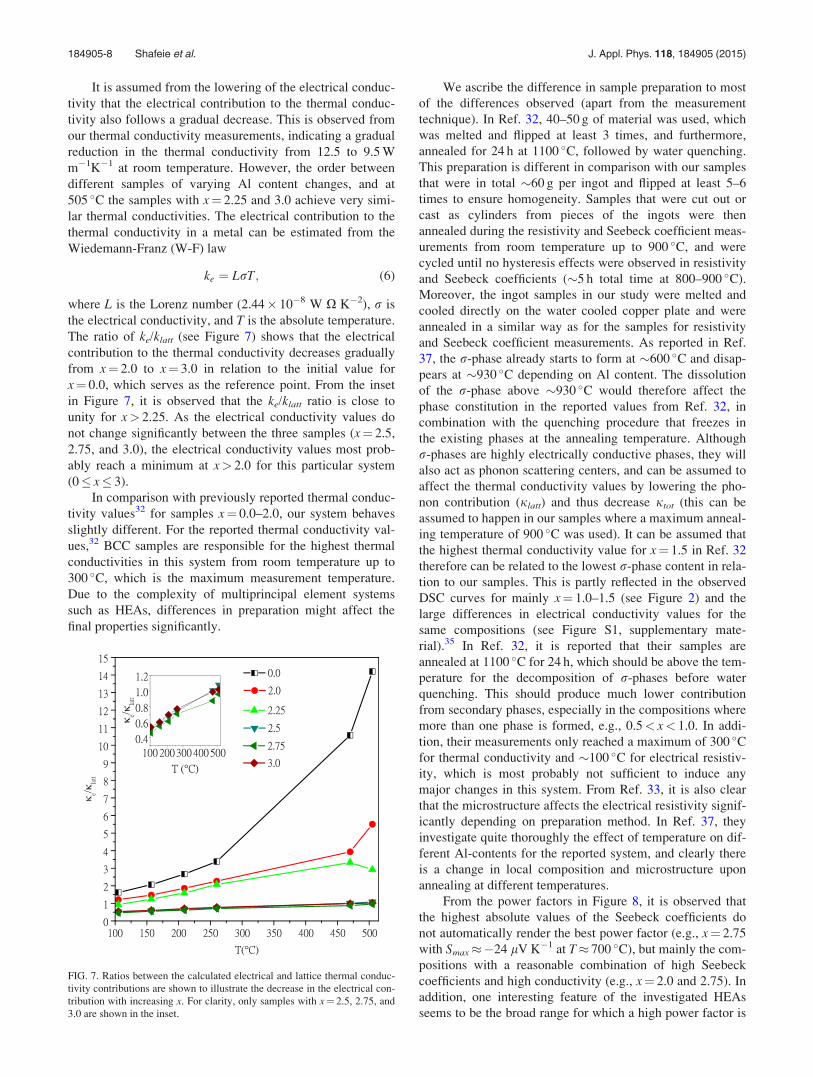
It is assumed from the lowering of the electrical conduc-
tivity that the electrical contribution to the thermal conduc-
tivity also follows a gradual decrease. This is observed from
our thermal conductivity measurements, indicating a gradual
reduction in the thermal conductivity from 12.5 to 9.5 W
m�1K�1 at room temperature. However, the order between
different samples of varying Al content changes, and at
505 �C the samples with x¼ 2.25 and 3.0 achieve very simi-
lar thermal conductivities. The electrical contribution to the
thermal conductivity in a metal can be estimated from the
Wiedemann-Franz (W-F) law
ke ¼ LrT; (6)
where L is the Lorenz number (2.44 10�8 W X K�2), r is
the electrical conductivity, and T is the absolute temperature.
The ratio of ke/klatt (see Figure 7) shows that the electrical
contribution to the thermal conductivity decreases gradually
from x¼ 2.0 to x¼ 3.0 in relation to the initial value for
x¼ 0.0, which serves as the reference point. From the inset
in Figure 7, it is observed that the ke/klatt ratio is close to
unity for x> 2.25. As the electrical conductivity values do
not change significantly between the three samples (x¼ 2.5,
2.75, and 3.0), the electrical conductivity values most prob-
ably reach a minimum at x> 2.0 for this particular system
(0� x� 3).
In comparison with previously reported thermal conduc-
tivity values32 for samples x¼ 0.0–2.0, our system behaves
slightly different. For the reported thermal conductivity val-
ues,32 BCC samples are responsible for the highest thermal
conductivities in this system from room temperature up to
300 �C, which is the maximum measurement temperature.
Due to the complexity of multiprincipal element systems
such as HEAs, differences in preparation might affect the
final properties significantly.
We ascribe the difference in sample preparation to most
of the differences observed (apart from the measurement
technique). In Ref. 32, 40–50 g of material was used, which
was melted and flipped at least 3 times, and furthermore,
annealed for 24 h at 1100 �C, followed by water quenching.
This preparation is different in comparison with our samples
that were in total �60 g per ingot and flipped at least 5–6
times to ensure homogeneity. Samples that were cut out or
cast as cylinders from pieces of the ingots were then
annealed during the resistivity and Seebeck coefficient meas-
urements from room temperature up to 900 �C, and were
cycled until no hysteresis effects were observed in resistivity
and Seebeck coefficients (�5 h total time at 800–900 �C).
Moreover, the ingot samples in our study were melted and
cooled directly on the water cooled copper plate and were
annealed in a similar way as for the samples for resistivity
and Seebeck coefficient measurements. As reported in Ref.
37, the r-phase already starts to form at �600 �C and disap-
pears at �930 �C depending on Al content. The dissolution
of the r-phase above �930 �C would therefore affect the
phase constitution in the reported values from Ref. 32, in
combination with the quenching procedure that freezes in
the existing phases at the annealing temperature. Although
r-phases are highly electrically conductive phases, they will
also act as phonon scattering centers, and can be assumed to
affect the thermal conductivity values by lowering the pho-
non contribution (jlatt) and thus decrease jtot (this can be
assumed to happen in our samples where a maximum anneal-
ing temperature of 900 �C was used). It can be assumed that
the highest thermal conductivity value for x¼ 1.5 in Ref. 32
therefore can be related to the lowest r-phase content in rela-
tion to our samples. This is partly reflected in the observed
DSC curves for mainly x¼ 1.0–1.5 (see Figure 2) and the
large differences in electrical conductivity values for the
same compositions (see Figure S1, supplementary mate-
rial).35 In Ref. 32, it is reported that their samples are
annealed at 1100 �C for 24 h, which should be above the tem-
perature for the decomposition of r-phases before water
quenching. This should produce much lower contribution
from secondary phases, especially in the compositions where
more than one phase is formed, e.g., 0.5< x< 1.0. In addi-
tion, their measurements only reached a maximum of 300 �Cfor thermal conductivity and �100 �C for electrical resistiv-
ity, which is most probably not sufficient to induce any
major changes in this system. From Ref. 33, it is also clear
that the microstructure affects the electrical resistivity signif-
icantly depending on preparation method. In Ref. 37, they
investigate quite thoroughly the effect of temperature on dif-
ferent Al-contents for the reported system, and clearly there
is a change in local composition and microstructure upon
annealing at different temperatures.
From the power factors in Figure 8, it is observed that
the highest absolute values of the Seebeck coefficients do
not automatically render the best power factor (e.g., x¼ 2.75
with Smax��24 lV K�1 at T� 700 �C), but mainly the com-
positions with a reasonable combination of high Seebeck
coefficients and high conductivity (e.g., x¼ 2.0 and 2.75). In
addition, one interesting feature of the investigated HEAs
seems to be the broad range for which a high power factor is
FIG. 7. Ratios between the calculated electrical and lattice thermal conduc-
tivity contributions are shown to illustrate the decrease in the electrical con-
tribution with increasing x. For clarity, only samples with x¼ 2.5, 2.75, and
3.0 are shown in the inset.
184905-8 Shafeie et al. J. Appl. Phys. 118, 184905 (2015)
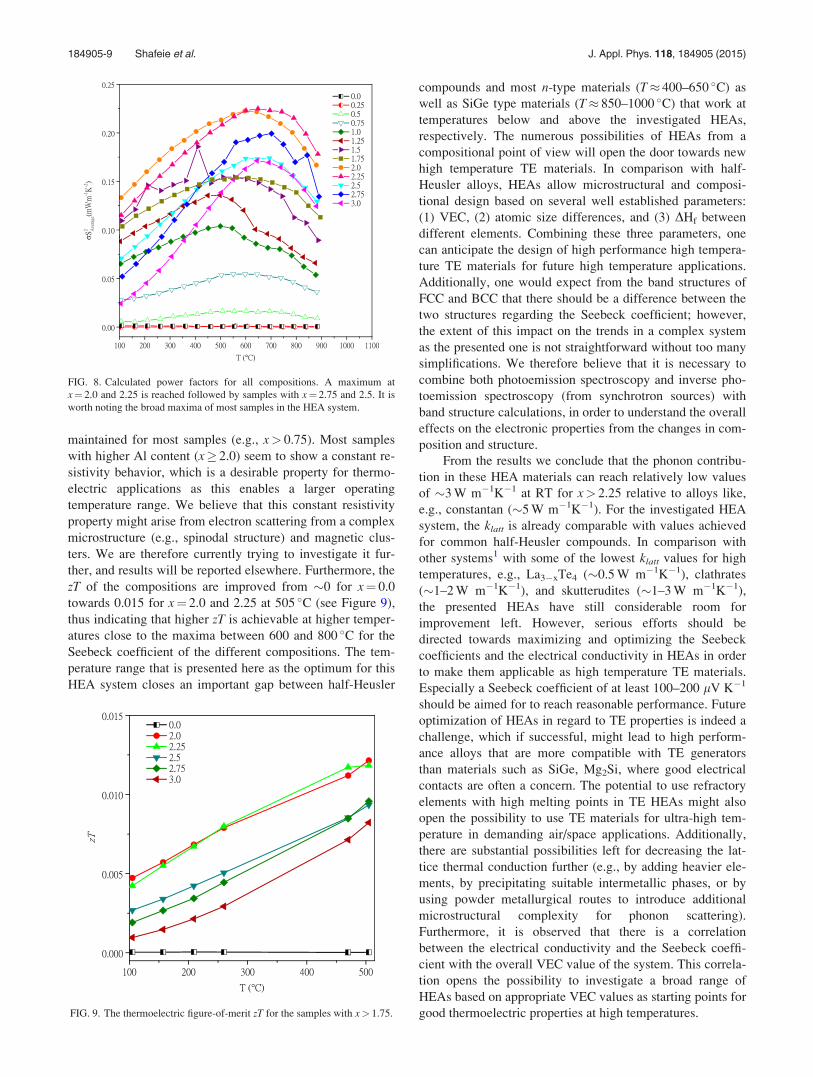
maintained for most samples (e.g., x> 0.75). Most samples
with higher Al content (x� 2.0) seem to show a constant re-
sistivity behavior, which is a desirable property for thermo-
electric applications as this enables a larger operating
temperature range. We believe that this constant resistivity
property might arise from electron scattering from a complex
microstructure (e.g., spinodal structure) and magnetic clus-
ters. We are therefore currently trying to investigate it fur-
ther, and results will be reported elsewhere. Furthermore, the
zT of the compositions are improved from �0 for x¼ 0.0
towards 0.015 for x¼ 2.0 and 2.25 at 505 �C (see Figure 9),
thus indicating that higher zT is achievable at higher temper-
atures close to the maxima between 600 and 800 �C for the
Seebeck coefficient of the different compositions. The tem-
perature range that is presented here as the optimum for this
HEA system closes an important gap between half-Heusler
compounds and most n-type materials (T� 400–650 �C) as
well as SiGe type materials (T� 850–1000 �C) that work at
temperatures below and above the investigated HEAs,
respectively. The numerous possibilities of HEAs from a
compositional point of view will open the door towards new
high temperature TE materials. In comparison with half-
Heusler alloys, HEAs allow microstructural and composi-
tional design based on several well established parameters:
(1) VEC, (2) atomic size differences, and (3) DHf between
different elements. Combining these three parameters, one
can anticipate the design of high performance high tempera-
ture TE materials for future high temperature applications.
Additionally, one would expect from the band structures of
FCC and BCC that there should be a difference between the
two structures regarding the Seebeck coefficient; however,
the extent of this impact on the trends in a complex system
as the presented one is not straightforward without too many
simplifications. We therefore believe that it is necessary to
combine both photoemission spectroscopy and inverse pho-
toemission spectroscopy (from synchrotron sources) with
band structure calculations, in order to understand the overall
effects on the electronic properties from the changes in com-
position and structure.
From the results we conclude that the phonon contribu-
tion in these HEA materials can reach relatively low values
of �3 W m�1K�1 at RT for x> 2.25 relative to alloys like,
e.g., constantan (�5 W m�1K�1). For the investigated HEA
system, the klatt is already comparable with values achieved
for common half-Heusler compounds. In comparison with
other systems1 with some of the lowest klatt values for high
temperatures, e.g., La3�xTe4 (�0.5 W m�1K�1), clathrates
(�1–2 W m�1K�1), and skutterudites (�1–3 W m�1K�1),
the presented HEAs have still considerable room for
improvement left. However, serious efforts should be
directed towards maximizing and optimizing the Seebeck
coefficients and the electrical conductivity in HEAs in order
to make them applicable as high temperature TE materials.
Especially a Seebeck coefficient of at least 100–200 lV K�1
should be aimed for to reach reasonable performance. Future
optimization of HEAs in regard to TE properties is indeed a
challenge, which if successful, might lead to high perform-
ance alloys that are more compatible with TE generators
than materials such as SiGe, Mg2Si, where good electrical
contacts are often a concern. The potential to use refractory
elements with high melting points in TE HEAs might also
open the possibility to use TE materials for ultra-high tem-
perature in demanding air/space applications. Additionally,
there are substantial possibilities left for decreasing the lat-
tice thermal conduction further (e.g., by adding heavier ele-
ments, by precipitating suitable intermetallic phases, or by
using powder metallurgical routes to introduce additional
microstructural complexity for phonon scattering).
Furthermore, it is observed that there is a correlation
between the electrical conductivity and the Seebeck coeffi-
cient with the overall VEC value of the system. This correla-
tion opens the possibility to investigate a broad range of
HEAs based on appropriate VEC values as starting points for
good thermoelectric properties at high temperatures.
FIG. 8. Calculated power factors for all compositions. A maximum at
x¼ 2.0 and 2.25 is reached followed by samples with x¼ 2.75 and 2.5. It is
worth noting the broad maxima of most samples in the HEA system.
FIG. 9. The thermoelectric figure-of-merit zT for the samples with x> 1.75.
184905-9 Shafeie et al. J. Appl. Phys. 118, 184905 (2015)

CONCLUSIONS
High entropy alloys within the AlxCoCrFeNi-system
(0.0� x� 3.0) have been investigated for TE properties in
the temperature range of 100–900 �C. We found that the
addition of Al improves the TE properties through an
increase in the maximum absolute value of the Seebeck coef-
ficient (�1 lV K�1 for x¼ 0.0 to �23 lV K�1 for x¼ 3.0),
and a simultaneous decrease in the electrical conductivity
(from �0.85 MS m�1 for x¼ 0.0 to �0.36 for x¼ 3.0). The
thermal conductivity is in addition decreasing from �15 W
m�1K�1 for x¼ 0.0 to �12.5–13 W m�1K�1 for x¼ 2.25
and 3.0, which is indicative of the lower electrical contribu-
tion (ke), to the total thermal conductivity. This is also
reflected in the ratio between the electrical and lattice ther-
mal conductivity (ke/klatt), which decreases towards unity for
high Al contents (i.e., x¼ 2.5, 2.75, and 3.0). Moreover, it is
found that the investigated compositions reach a zT� 0.015
for x¼ 2.0 and 2.25 at T� 505 �C, which was the upper limit
for our thermal conductivity measurements. The zT values
follow the power factors for the different compositions with
x¼ 0.0, 2.0, 2.25, 2.5, 2.75, and 3.0. We therefore conclude
that the potential to reach an intrinsically low lattice thermal
conductivity through complexity in the microstructure for
HEAs (e.g., by spinodal decompositions and mass fluctuation
through substitutional elements), in combination with a sys-
tematic control of the electrical conductivity and the
Seebeck coefficient through carefully chosen combinations
of elements will open the possibility towards the design of
high performance bulk TE materials for applications at high
temperatures.
ACKNOWLEDGMENTS
The authors acknowledge the financial support from the
Area of Advance Materials Science at Chalmers University
of Technology. S.G. thanks the start-up funding from Area
of Advance Materials Science at Chalmers. P.E. was
partially supported by a Young Researcher Grant from the
Swedish Research Council.
1G. J. Snyder and E. S. Toberer, Nat. Mater. 7, 105 (2008).2M. S. Dresselhaus, G. Chen, M. Y. Tang, R. Yang, H. Lee, D. Wang, Z.
Ren, J. P. Fleurial, and P. Gogna, Adv. Mater. 19, 1043 (2007).3S. Chen and Z. Ren, Mater. Today 16, 387 (2013).4J. de Boor, T. Dasgupta, H. Kolb, C. Compere, K. Kelm, and E. Mueller,
Acta Mater. 77, 68 (2014).5J. G. Noudem, S. Quetel-Weben, R. Retoux, G. Chevallier, and C.
Estournes, Scr. Mater. 68, 949 (2013).6C. J. Vineis, A. Shakouri, A. Majumdar, and M. G. Kanatzidis, Adv.
Mater. 22, 3970 (2010).7H. Xie, H. Wang, Y. Pei, C. Fu, X. Liu, G. J. Snyder, X. Zhao, and T. Zhu,
Adv. Funct. Mater. 23, 5123 (2013).8S. Chen, K. C. Lukas, W. Liu, C. P. Opeil, G. Chen, and Z. Ren, Adv.
Energy Mater. 3, 1210 (2013).
9Q. Shen, L. Chen, T. Goto, T. Hirai, J. Yang, G. P. Meisner, and C. Uher,
Appl. Phys. Lett. 79, 4165 (2001).10S. Populoh, M. H. Aguirre, O. C. Brunko, K. Galazka, Y. Lu, and A.
Weidenkaff, Scr. Mater. 66, 1073 (2012).11Y. Zhang, T. T. Zuo, Z. Tang, M. C. Gao, K. a. Dahmen, P. K. Liaw, and
Z. P. Lu, Prog. Mater. Sci. 61, 1 (2014).12L. J. Santodonato, Y. Zhang, M. Feygenson, C. M. Parish, M. C. Gao, R. J.
K. Weber, J. C. Neuefeind, Z. Tang, and P. K. Liaw, Nat. Commun. 6,
5964 (2015).13O. N. Senkov, J. D. Miller, D. B. Miracle, and C. Woodward, Nat.
Commun. 6, 6529 (2015).14D. Miracle, J. Miller, O. Senkov, C. Woodward, M. Uchic, and J. Tiley,
Entropy 16, 494 (2014).15F. Zhang, C. Zhang, S. L. Chen, J. Zhu, W. S. Cao, and U. R. Kattner,
CALPHAD: Comput. Coupling Phase Diagrams Thermochem. 45, 1
(2014).16C. Tong, Y.-L. Chen, J. Yeh, S. Lin, S. Chen, T. Shun, C. Tsau, and S.
Chang, Metall. Mater. Trans. A 36, 881 (2005).17A. Manzoni, H. Daoud, R. V€olkl, U. Glatzel, and N. Wanderka,
Ultramicroscopy 132, 212 (2013).18R. Valiev, Nat. Mater. 3, 511 (2004).19L.-D. Zhao, V. P. Dravid, and M. G. Kanatzidis, Energy Environ. Sci. 7,
251 (2014).20B. Gludovatz, A. Hohenwarter, D. Catoor, E. H. Chang, E. P. George, and
R. O. Ritchie, Science 345, 1153 (2014).21K. M. Youssef, A. J. Zaddach, C. Niu, D. L. Irving, and C. C. Koch,
Mater. Res. Lett. 3, 95 (2015).22M. J. Yao, K. G. Pradeep, C. C. Tasan, and D. Raabe, Scr. Mater. 72–73, 5
(2014).23P. Ko�zelj, S. Vrtnik, A. Jelen, S. Jazbec, Z. Jaglicic, S. Maiti, M.
Feuerbacher, W. Steurer, and J. Dolin�sek, Phys. Rev. Lett. 113, 107001
(2014).24Y. Zhang and W. J. Peng, Procedia Eng. 27, 1169 (2012).25M.-H. Tsai, Entropy 15, 5338 (2013).26G. A. Slack, in CRC Handbook Thermoelectrics, edited by D. M. Rowe
(CRC Press, 1995), pp. 407–440.27K. Biswas, J. He, I. D. Blum, C.-I. Wu, T. P. Hogan, D. N. Seidman, V. P.
Dravid, and M. G. Kanatzidis, Nature 490, 570 (2012).28Y. Pei, X. Shi, A. LaLonde, H. Wang, L. Chen, and G. J. Snyder, Nature
473, 66 (2011).29S. Guo, C. Ng, J. Lu, and C. T. Liu, J. Appl. Phys. 109, 103505 (2011).30S. Guo, Q. Hu, C. Ng, and C. T. Liu, Intermetallics 41, 96 (2013).31F. R. de Boer, R. Boom, W. C. M. Mattens, A. R. Miedema, and A. K.
Niessen, Cohesion in Metals: Transition Metal Alloys (Cohesion andStructure) (North Holland, 1989).
32H. P. Chou, Y. S. Chang, S. K. Chen, and J. W. Yeh, Mater. Sci. Eng., B
163, 184 (2009).33Y.-F. F. Kao, S. K. Chen, T.-J. J. Chen, P.-C. C. Chu, J.-W. W. Yeh, and
S.-J. J. Lin, J. Alloys Compd. 509, 1607 (2011).34S. E. Gustafsson, Rev. Sci. Instrum. 62, 797 (1991).35See supplementary material at http://dx.doi.org/10.1063/1.4935489 for
additional material on thermoelectric properties.36S. Guo, C. Ng, Z. Wang, and C. T. Liu, J. Alloys Compd. 583, 410 (2014).37W. R. Wang, W. L. Wang, and J. W. Yeh, J. Alloys Compd. 589, 143
(2014).38F. Findik, Mater. Des. 42, 131 (2012).39D. K€onig, C. Eberling, M. Kieschnick, S. Virtanen, and A. Ludwig, Adv.
Eng. Mater. 17, 1365 (2015).40H. Jacobi, B. Vassos, and H.-J. Engell, J. Phys. Chem. Solids 30, 1261
(1969).41J. Kondo, Prog. Theor. Phys. 32, 37 (1964).42C. Li, J. C. Li, M. Zhao, and Q. Jiang, J. Alloys Compd. 504, S515 (2010).43M. R. Calvo, J. Fern�andez-Rossier, J. J. Palacios, D. Jacob, D. Natelson,
and C. Untiedt, Nature 458, 1150 (2009).
184905-10 Shafeie et al. J. Appl. Phys. 118, 184905 (2015)