high performance computing - u.s. army research … risc-based hpc systems supported some sort of...
TRANSCRIPT


Approved for public release; distribution is unlimited.
Army Research Laboratory Aberdeen Proving Ground, MD 21005-5067
ARL-MR-528 February 2002
Cache-Based Architectures for
High Performance Computing
Daniel M. Pressel Computational and Information Sciences Directorate, ARL

Abstract Many researchers have noted that scientific codes perform poorly on computer architectures involving a memory hierarchy (cache). Furthermore, a number of researchers and some vendors concluded that simply making the caches larger would not solve this problem. Alternatively, some vendors of HPC systems have opted to equip their systems with fast memory interfaces, but with a limited amount of on-chip cache and no off-chip cache.
Some RISC-based HPC systems supported some sort of prefetching or streaming facility that allows one to more efficiently stream data between main memory and the processor (e.g., the Cray T3E). However, there are fundamental limitations on the benefits of these approaches which makes it difficult to see how these approaches by themselves will eliminate the “Memory Wall.” It has been shown that if one relies solely on this approach for the Cray T3E, one is unlikely to achieve much better than 4–6% of the machine’s peak performance.
Does this mean that as the speed of RISC/CISC processors increases, systems designed to process scientific data are doomed to hit the Memory Wall? The answer to that question depends on the ability of programmers to find innovative ways to take advantage of caches. This report discusses some of the techniques that can be used to overcome this hurdle allowing one to consider what types of hardware resources are required to support these techniques.
ii

Acknowledgments
The author would like to thank Marek Behr for permission to use his results in this report. He would also like to thank the entire CHSSI CFD-6 team for their assistance in this work as part of that team. He would like to thank his many colleagues that have graciously assisted him in all aspects of the preparation of this report. Additional acknowledgments go to Tom Kendall, Denice Brown, and the systems staff for all of their help. He would also like to thank the employees of Business Plus Corp., especially Claudia Coleman and Maria Brady, who assisted in the preparation and editing of this report.
This work was made possible by the grant of computer time by the DOD HPCM Program. Additionally, it is largely based on work that was funded as part of the CHSSI administered by the DOD HPCM Program.
Note: All items in bold are in the Glossary.
iii

INTENTIONALLY LEFT BLANK.
iv
Contents
Acknowledgments 1
List of Tables vii
1. Introduction 1
2. Caches and High Performance Computing 1
3. Understanding the Limitations of a Stride-1 Access Pattern 3
4. Results 4
5. Prefetching and Stream Buffers vs. Large Caches 8
6. Prefetching and Stream Buffers in Combination With Large Caches 9
7. Conclusions 10
8. References 11
Glossary 13
Distribution List 15
Report Documentation Page 19
v

INTENTIONALLY LEFT BLANK.
vi

List of Tables
Table 1. Single processor results from the STREAM benchmark for commonly used HPC systems.a............................................................................... 4
Table 2. The size of the working set for a 1-million grid point problem................. 5 Table 3. The performance of the RISC optimized version of F3D for single
processor runs for the 3-million grid point test case. ........................................... 6 Table 4. The performance of the RISC optimized version of F3D for single
processor runs on the SGI Origin 2000, the SGI Origin 3000, the SUN HPC 10000, and the HP Superdome for a range of test cases. ............................ 7
Table 5. A summary of the test cases. .......................................................................... 7 Table 6. Comparative performance from running two versions of F3D using
eight processors with the 1-million grid point test case. ..................................... 8 Table 7. Comparative performance from running the Department of Energy
(DOE) Parallel Climate Model (PCM) using 16 processors.a,b ............................ 8 Table 8. The predicted performance increase resulting from upgrading a
195-MHz R10000 Processor to a 300-MHz R12000 Processor in an SGI Origin 2000. ................................................................................................................ 9
vii

INTENTIONALLY LEFT BLANK.
viii

1. Introduction
Many researchers have noted that scientific codes perform poorly on computer architectures involving a memory hierarchy (cache) (Bailey 1993; Mucci and London 1998). Furthermore, as a result of simulation studies, running microbenchmarks on real machines, and running real codes on real machines, a number of researchers and some vendors concluded that simply making the caches larger would not solve this problem. As a result of these conclusions, some vendors of high performance computing systems have opted to equip their systems with fast memory interfaces, but with a limited amount of on-chip cache and no off-chip cache (e.g., the Cray T3D, Cray T3E, and the IBM SP with the POWER 2 Super Chip). However, none of these systems approach the memory bandwidth of a vector processor. For example, it has been shown that if one relies solely on this approach for the Cray T3E, one is unlikely to achieve much better than 4–6% of the machine’s peak performance (O’Neal and Urbanic 1997).
Does this mean that as the speed of RISC/CISC processors increases, systems designed to process scientific data are doomed to hit the “Memory Wall”? The answer to that question depends on the ability of programmers to find innovative ways to take advantage of caches. This report discusses some of the techniques that can be used to overcome this hurdle. Once these techniques have been identified, one can then consider what types of hardware resources are required to support them.
It is important to note that this work is based on the following two key concepts:
(1) It is acceptable to make significant modifications to the programs at the implementation level.
(2) Not all computer architectures are created equal. Therefore, one will frequently have to define a minimum set of resources for tuning purposes (e.g., cache size).
2. Caches and High Performance Computing
Many researchers have noted that scientific codes perform poorly on computer architectures involving a memory hierarchy (cache) (Bailey 1993; Mucci and London 1998). Furthermore, as a result of simulation studies (Kessler 1991), running microbenchmarks on real machines (Mucci and London 1998), and
1
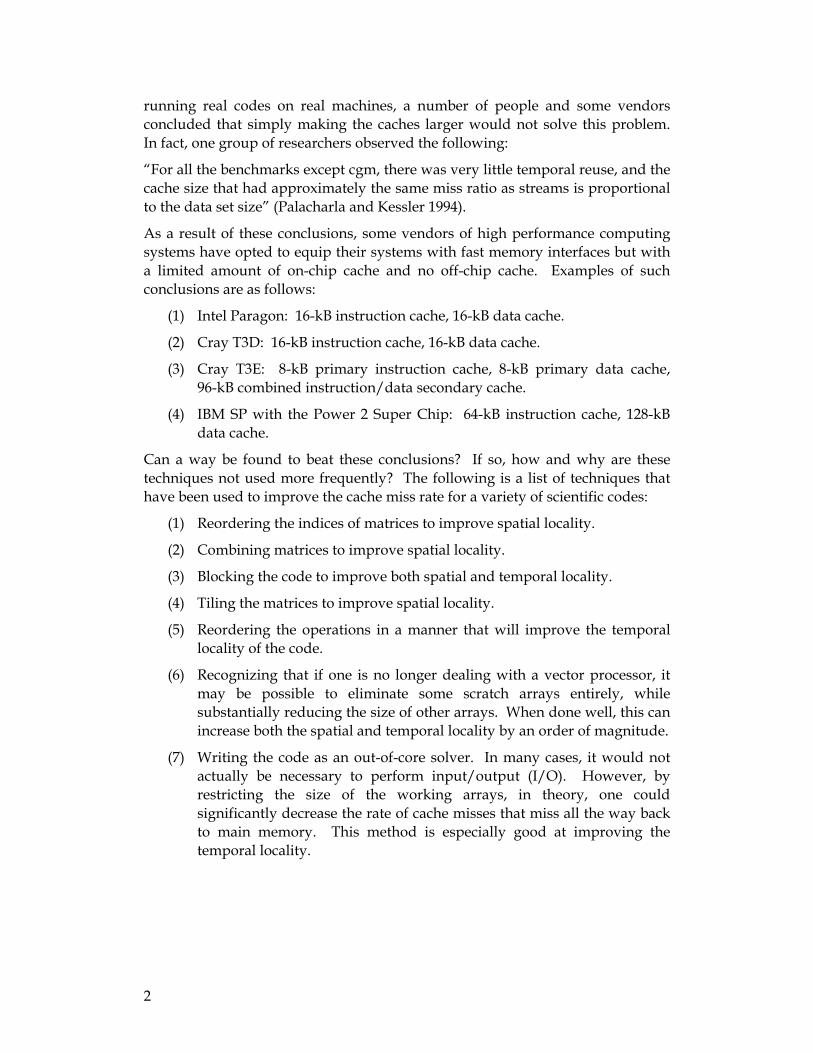
running real codes on real machines, a number of people and some vendors concluded that simply making the caches larger would not solve this problem. In fact, one group of researchers observed the following:
“For all the benchmarks except cgm, there was very little temporal reuse, and the cache size that had approximately the same miss ratio as streams is proportional to the data set size” (Palacharla and Kessler 1994).
As a result of these conclusions, some vendors of high performance computing systems have opted to equip their systems with fast memory interfaces but with a limited amount of on-chip cache and no off-chip cache. Examples of such conclusions are as follows:
(1) Intel Paragon: 16-kB instruction cache, 16-kB data cache.
(2) Cray T3D: 16-kB instruction cache, 16-kB data cache.
(3) Cray T3E: 8-kB primary instruction cache, 8-kB primary data cache, 96-kB combined instruction/data secondary cache.
(4) IBM SP with the Power 2 Super Chip: 64-kB instruction cache, 128-kB data cache.
Can a way be found to beat these conclusions? If so, how and why are these techniques not used more frequently? The following is a list of techniques that have been used to improve the cache miss rate for a variety of scientific codes:
(1) Reordering the indices of matrices to improve spatial locality.
(2) Combining matrices to improve spatial locality.
(3) Blocking the code to improve both spatial and temporal locality.
(4) Tiling the matrices to improve spatial locality.
(5) Reordering the operations in a manner that will improve the temporal locality of the code.
(6) Recognizing that if one is no longer dealing with a vector processor, it may be possible to eliminate some scratch arrays entirely, while substantially reducing the size of other arrays. When done well, this can increase both the spatial and temporal locality by an order of magnitude.
(7) Writing the code as an out-of-core solver. In many cases, it would not actually be necessary to perform input/output (I/O). However, by restricting the size of the working arrays, in theory, one could significantly decrease the rate of cache misses that miss all the way back to main memory. This method is especially good at improving the temporal locality.
2

(8) Borrowing the concept of domain decomposition, which is frequently used as an approach to parallelizing programs. While this approach is not without its consequences, it can significantly decrease the size of the working set (or help to create one where it would otherwise not exist). Again, this method is aimed at improving the temporal locality.
This demonstrates that there are methods for significantly decreasing the cache miss rate. However, as will be seen later in this report, some of these techniques work best when dealing with large caches. Unfortunately, many of the more popular MPPs either lacked caches entirely (e.g., the NCUBE2 and the CM5 when equipped with vector units) or were equipped with small to modest sized caches (e.g., the Intel Paragon, Cray T3D and T3E, and the IBM SP with the POWER2 Super Chip processors). As a result, for many programmers working on high performance computers, there was no opportunity to experiment with ways to tune code for large caches. Furthermore, since many codes are required to be portable across platforms, there was little incentive to tune for architectural features that were not uniformly available.
3. Understanding the Limitations of a Stride-1 Access Pattern
Before continuing, we will briefly discuss spatial and temporal locality. Let us consider the case of an R12000-based SGI Origin 2000 with prefetching turned off, specifically, a 300-MHz processor generating one load per cycle with a Stride 1 access pattern and no temporal locality (this is an example of pure spatial locality of reference), with a cache line size of 128 bytes for 64-bit data. This arrangement will have a 6.25% cache miss rate. Assuming no other methods of latency hiding are used and assuming a memory latency of 945 ns (Laudon and Lenoski 1997), then this processor will spend 95% of its time stalled on cache misses. Phrasing this another way, if one assumes that the peak speed of the processor is one multiply-add instruction per cycle, the best that the processor will deliver is 32 MFLOPS out of a peak of 600 MFLOPS. This result compares favorably with the measured performance in Table 1.
From this, it can seen that for large problem sizes, relying on spatial locality alone will not produce an acceptable level of performance. Instead, one must combine spatial locality with temporal locality (data reuse at the cache level). However, if a vector optimized code is run on this machine with the same assumptions, one can, at best, work on 131,072 values per megabyte of cache (the
3
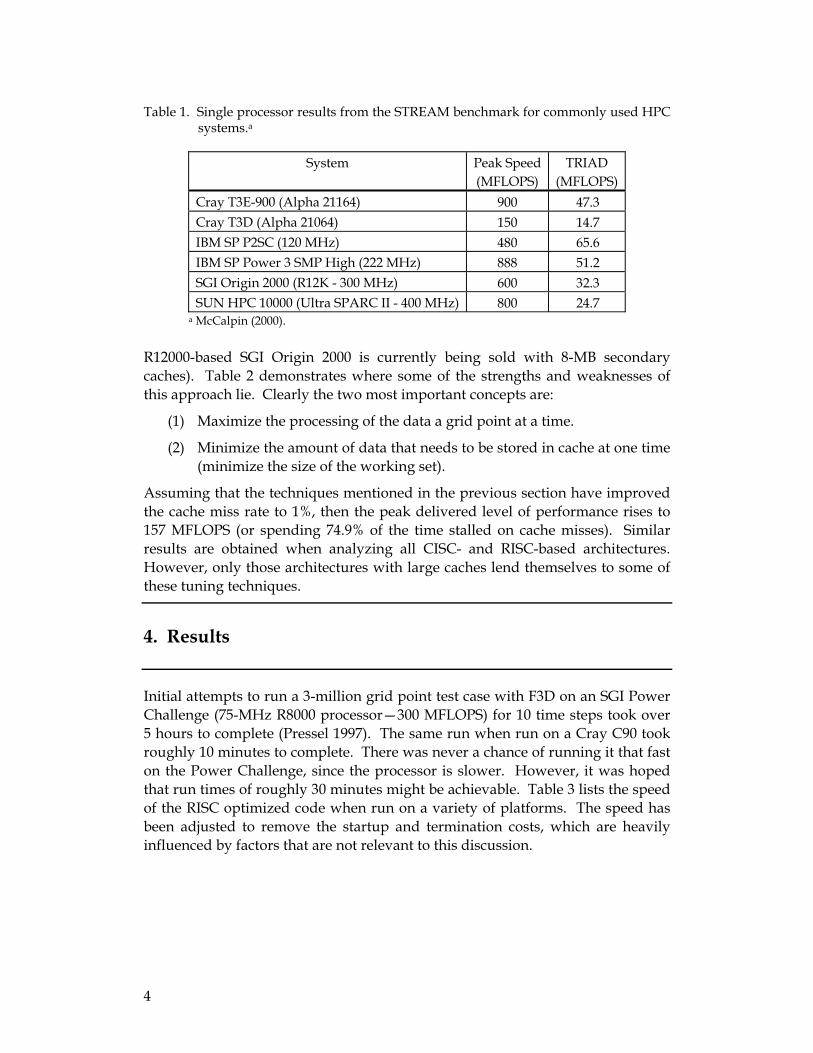
Table 1. Single processor results from the STREAM benchmark for commonly used HPC systems.a
System Peak Speed (MFLOPS)
TRIAD (MFLOPS)
Cray T3E-900 (Alpha 21164) 900 47.3 Cray T3D (Alpha 21064) 150 14.7 IBM SP P2SC (120 MHz) 480 65.6 IBM SP Power 3 SMP High (222 MHz) 888 51.2 SGI Origin 2000 (R12K - 300 MHz) 600 32.3 SUN HPC 10000 (Ultra SPARC II - 400 MHz) 800 24.7
a McCalpin (2000).
R12000-based SGI Origin 2000 is currently being sold with 8-MB secondary caches). Table 2 demonstrates where some of the strengths and weaknesses of this approach lie. Clearly the two most important concepts are:
(1) Maximize the processing of the data a grid point at a time.
(2) Minimize the amount of data that needs to be stored in cache at one time (minimize the size of the working set).
Assuming that the techniques mentioned in the previous section have improved the cache miss rate to 1%, then the peak delivered level of performance rises to 157 MFLOPS (or spending 74.9% of the time stalled on cache misses). Similar results are obtained when analyzing all CISC- and RISC-based architectures. However, only those architectures with large caches lend themselves to some of these tuning techniques.
4. Results
Initial attempts to run a 3-million grid point test case with F3D on an SGI Power Challenge (75-MHz R8000 processor—300 MFLOPS) for 10 time steps took over 5 hours to complete (Pressel 1997). The same run when run on a Cray C90 took roughly 10 minutes to complete. There was never a chance of running it that fast on the Power Challenge, since the processor is slower. However, it was hoped that run times of roughly 30 minutes might be achievable. Table 3 lists the speed of the RISC optimized code when run on a variety of platforms. The speed has been adjusted to remove the startup and termination costs, which are heavily influenced by factors that are not relevant to this discussion.
4
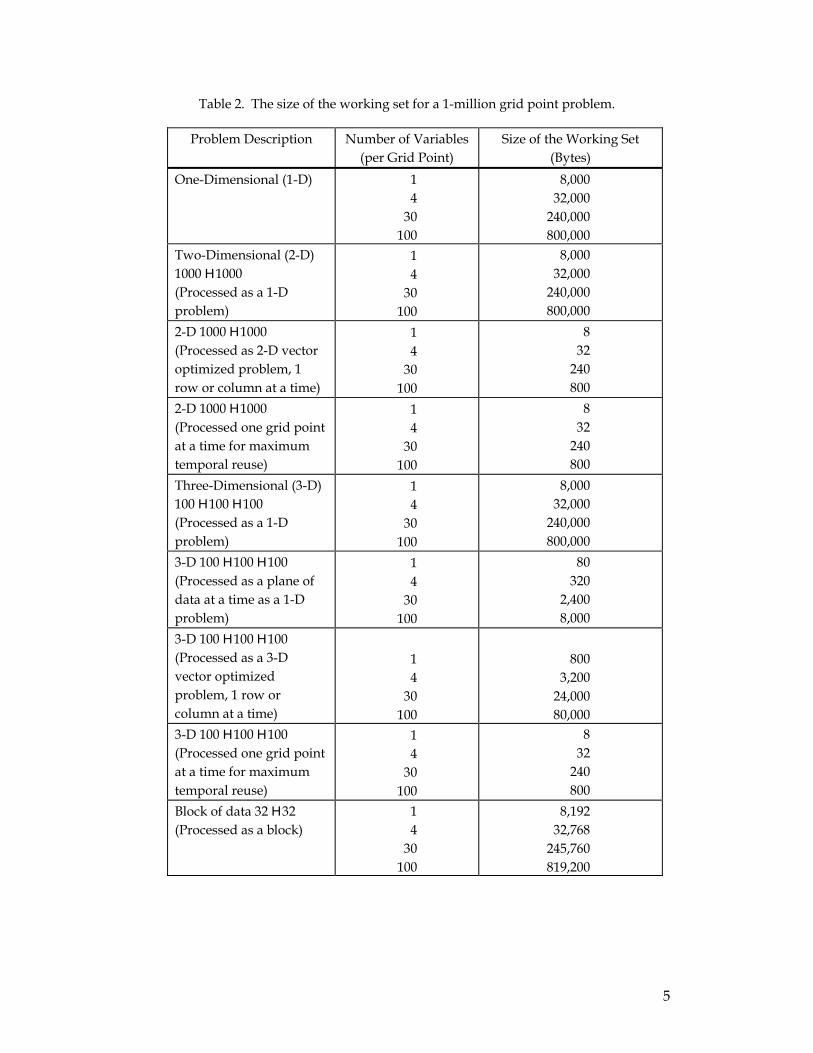
Table 2. The size of the working set for a 1-million grid point problem.
Problem Description Number of Variables (per Grid Point)
Size of the Working Set (Bytes)
One-Dimensional (1-D) 1 4
30 100
8,000 32,000
240,000 800,000
Two-Dimensional (2-D) 1000 H 1000 (Processed as a 1-D problem)
1 4
30 100
8,000 32,000
240,000 800,000
2-D 1000 H 1000 (Processed as 2-D vector optimized problem, 1 row or column at a time)
1 4
30 100
8 32
240 800
2-D 1000 H 1000 (Processed one grid point at a time for maximum temporal reuse)
1 4
30 100
8 32
240 800
Three-Dimensional (3-D) 100 H 100 H 100 (Processed as a 1-D problem)
1 4
30 100
8,000 32,000
240,000 800,000
3-D 100 H 100 H 100 (Processed as a plane of data at a time as a 1-D problem)
1 4
30 100
80 320
2,400 8,000
3-D 100 H 100 H 100 (Processed as a 3-D vector optimized problem, 1 row or column at a time)
1 4
30 100
800
3,200 24,000 80,000
3-D 100 H 100 H 100 (Processed one grid point at a time for maximum temporal reuse)
1 4
30 100
8 32
240 800
Block of data 32 H 32 (Processed as a block)
1 4
30 100
8,192 32,768
245,760 819,200
5

Table 3. The performance of the RISC optimized version of F3D for single processor runs for the 3-million grid point test case.
System Name Processor Clock Rate Peak Speed Performance
(MHz) (MFLOPS) (Time Steps/Hr) (MFLOPS)
Convex Exemplar SPP-1600
HP PA 7200 120 240 16. 63.
Cray C90a Proprietary 238 952 81. 319.
HP Superdome HP PA 8600 552 2208 135. 532.
SGI Challenge R4400 200 100 10. 39.
SGI Origin 2000 R10000 195 390 41. 162.
SGI Origin 2000 R12000 300 600 61. 241.
SGI Origin 3000 R12000 400 800 89. 351.
SGI Power Challenge R8000 75 300 23. 91.
SGI Power Challenge R10000 195 390 32. 126.
SUN HPC 10000 Ultra SPARC II
400 800 46. 181.
a Cray C90 ran the vector optimized code.
Table 4 lists the speed of the RISC optimized code for a variety of problem sizes when run on the SGI Origin 2000 (R12000), the SGI Origin 3000 (R12000), the SUN HPC 10000, and the HP Superdome (HP PA 8600). The SGI Origin 2000 was equipped with 128, 300-MHz R12000 processors with 8-MB secondary caches and 2 GB of memory per 2-processor node. The SGI Origin 3000 was equipped with 256, 400-MHz R12000 processors with 8-MB secondary caches and 4 GB of memory per 4-processor node. The SUN HPC 10000 was equipped with 64, 400-MHz Ultra SPARC II processors with either 4 or 8 MB of secondary caches (one of our systems was upgraded before the series of runs was finished) and 4 GB of memory per 4-processor node. There was insufficient memory to run the 206-million grid point test case on the SUN HPC 10000. The HP Superdome was configured with 48, 552-MHz HP PA 8600 processors with 1 MB of on-chip data cache and 1 GB of memory per processor. For some unknown reasons, we could not run several of the cases on this system, even when there was more than enough memory to run the job.
6

Table 4. The performance of the RISC optimized version of F3D for single processor runs on the SGI Origin 2000, the SGI Origin 3000, the SUN HPC 10000, and the HP Superdome for a range of test cases.
Test Case Size (Millions of Grid Points)
Speed (Time Steps/Hr)
Performance (Time Steps/Million Grid Points-Hr)
SGI Origin 2000
SGI Origin 3000 SUN
HP Superdome
SGI Origin 2000
SGI Origin 3000 SUN
HP Superdome
1.00 181. 275. 138. 403. 181. 275. 138. 403.
3.01 61. 89. 46. 135. 184. 268. 138. 406.
12.0 11.7 22. 10.6 30. 140. 264. 127. 360.
35.6 4.0 6.92 3.4 10.4 142. 246. 121. 370.
59.4 2.3 3.93 2.1 Would not run.
137. 233. 125. Would not run.
124. 1.05 1.48 0.93 NA 130. 184. 115. NA
206. 0.62 0.99 NA NA 128. 204. NA NA
Table 5 lists the dimensions of the grids used for each of these test cases. For historical reasons, there were some differences between the 1- and 3-million grid point test cases. All of the remaining test cases were based on the 3-million grid point test case. Only the 1-million grid point test case has been run out to a converged solution. The remaining test cases were only used for scalability testing.
Table 5. A summary of the test cases.
Test Case Size JMAX KMAX LMAX (Millions of Grid Points) Zone 1 Zone 2 Zone 3
1.00 15 87 89 75 70 3.01 15 87 89 225 70
12.0 15 87 89 450 140 35.6 29 173 175 450 210 59.4 29 173 175 450 350
124. 43 254 266 450 490 206. 71 421 442 450 490
7

5. Prefetching and Stream Buffers vs. Large Caches
Now that it has been established that large caches can be of value, let us consider the relative performance of systems that stressed prefetching and/or a fast low latency memory system vs. those that include a large cache. Tables 6 and 7 contain some real world examples of codes that were able to benefit from the presence of a large cache. This is not to say that all codes will benefit from the presence of a large cache. In particular, it is no accident that the version of F3D that was parallelized using compiler directives was able to take advantage of a large cache. It was extensively tuned for such an architecture. Other codes might perform better on the Cray T3E, especially if they were never tuned for cache-based systems.
Table 6. Comparative performance from running two versions of F3D using eight processors with the 1-million grid point test case.
System
Peak Processor Speed
Parallelization Method
Performance
(MFLOPS) (Time Steps/Hr) (MFLOPS)
SGI R10K Origin 2000 390 Compiler Directives
793 1.04E3
SGI R12K Origin 3000 800 Compiler Directives
1764 2.31E3
SUN HPC 10000 800 Compiler Directives
999 1.31E3
HP V-Class 1760 Compiler Directives
1632 2.13E3
HP Superdome 2208 Compiler Directives
2851 3.74E3
SGI R12K Origin 2000a 600 SHMEM 349 4.56E2
Cray T3E-1200a 1200 SHMEM 382 4.99E2
IBM SPa 640 MPI 199 2.60E2 a Results provided courtesy of Marek Behr, formerly of the U.S. Army High Performance Computing Research
Center (AHPCRC).
Table 7. Comparative performance from running the Department of Energy (DOE) Parallel Climate Model (PCM) using 16 processors.a,b
System Peak Processor Speed (MFLOPS)
Performance (MFLOPS/PE)
SGI R10K Origin 2000 500 60 Cray T3E-900 900 38
a This data is based on runs done using the T42L18 test case. b Bettge et al. (1999).
8
6. Prefetching and Stream Buffers in Combination With Large Caches
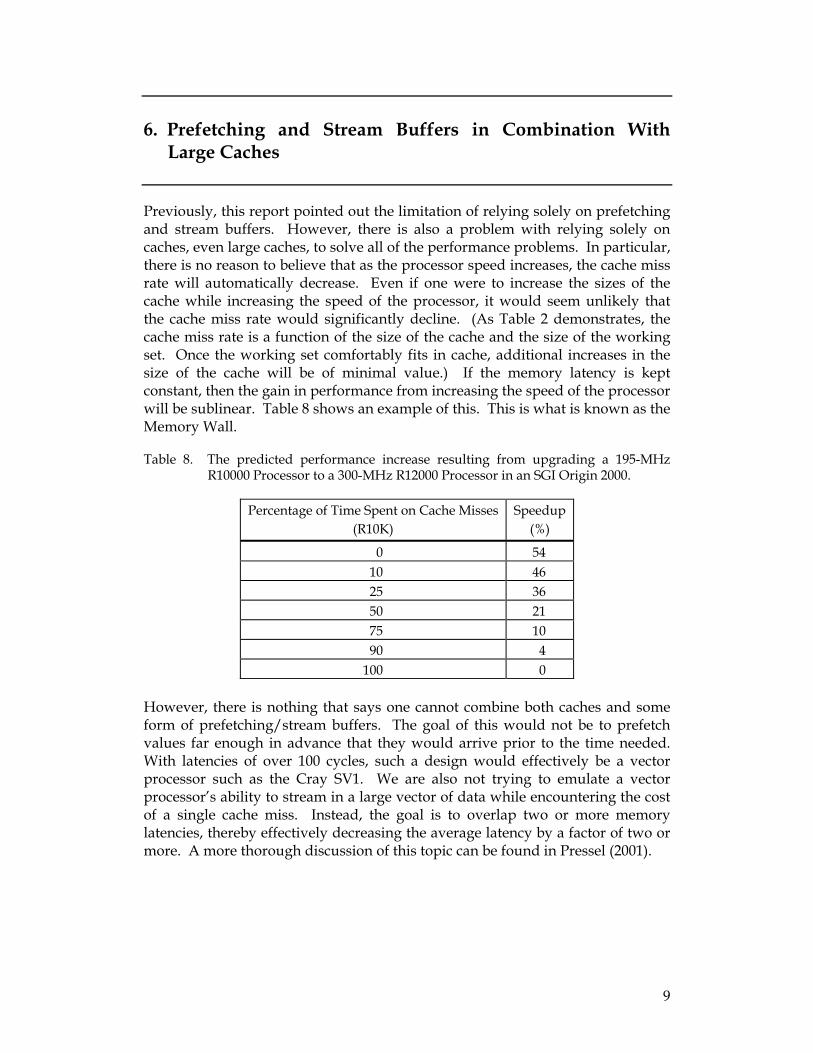
Previously, this report pointed out the limitation of relying solely on prefetching and stream buffers. However, there is also a problem with relying solely on caches, even large caches, to solve all of the performance problems. In particular, there is no reason to believe that as the processor speed increases, the cache miss rate will automatically decrease. Even if one were to increase the sizes of the cache while increasing the speed of the processor, it would seem unlikely that the cache miss rate would significantly decline. (As Table 2 demonstrates, the cache miss rate is a function of the size of the cache and the size of the working set. Once the working set comfortably fits in cache, additional increases in the size of the cache will be of minimal value.) If the memory latency is kept constant, then the gain in performance from increasing the speed of the processor will be sublinear. Table 8 shows an example of this. This is what is known as the Memory Wall.
Table 8. The predicted performance increase resulting from upgrading a 195-MHz R10000 Processor to a 300-MHz R12000 Processor in an SGI Origin 2000.
Percentage of Time Spent on Cache Misses (R10K)
Speedup (%)
0 54 10 46 25 36 50 21 75 10 90 4
100 0 However, there is nothing that says one cannot combine both caches and some form of prefetching/stream buffers. The goal of this would not be to prefetch values far enough in advance that they would arrive prior to the time needed. With latencies of over 100 cycles, such a design would effectively be a vector processor such as the Cray SV1. We are also not trying to emulate a vector processor’s ability to stream in a large vector of data while encountering the cost of a single cache miss. Instead, the goal is to overlap two or more memory latencies, thereby effectively decreasing the average latency by a factor of two or more. A more thorough discussion of this topic can be found in Pressel (2001).
9

7. Conclusions
It is possible to tune some scientific codes to take good advantage of systems with a memory hierarchy. It appears as though two- and three-dimensional problems have an inherent advantage to one-dimensional problems. Also, algorithms that do a lot of work per time step (e.g., implicit CFD codes) but exhibit a rapid rate of convergence may be better suited for use with caches than algorithms that do very little work per time step but require a large number of time steps to generate an answer (e.g., explicit CFD codes). For example, if Code A performs 1000 floating point operations per time step per grid point and requires 1000 time steps to converge, then it will perform 1 million floating point operations per grid point. In contrast, if Code B performs 3500 floating point operations per time step per grid point and requires 5000 time steps to produce an answer, then it will perform 1.5 million floating point operations per grid point. If one assumes that both programs are efficiently implemented, then Code A might have twice as many cache misses per time step as Code B. However, over the life of the run, Code B will have 2.5 times as many cache misses as Code A. Presumably, Code B will take close to 2.5 times as long to run as Code A. This is an example of how performing more work per time step can increase the potential for data reuse. In any case, one should be prepared to spend a significant amount of time and effort retuning the code.
On a side note, a surprising outcome of this work is that BLAS 1, and, to a lesser extent, BLAS 2, subroutines should be avoided when working with systems that use cache. The BLAS 1 subroutines have little or no ability to optimize for either spatial or temporal locality if it does not already exist. The BLAS 2 subroutines can generate spatial locality through the use of blocking but are inherently unlikely to support temporal locality since they operate on planes of data. Similarly, it was shown that other programming styles that were commonly used with vector processors are distinctly suboptimal for the newer systems. Therefore, while some researchers have expressed a strong desire to maintain a single code for use with both RISC- and vector-based systems, it appears as though this is not a good idea.
To an increasing extent when designing or buying a computer for high performance computing, the correct choice when faced with the choice of large cache or prefetching/stream buffers will be both. Of course, this assumes that the rest of the system is compatible with that choice.
10

8. References
Bailey, D. H. “RISC Microprocessors and Scientific Computing.” Proceedings for Supercomputing 93, Los Alamitos, CA: IEEE Computer Society Press, 1993.
Bettge, T., A. Craig, R. James, W. G. Strand, Jr., and V. Wayland. “Performance of the Parallel Climate Model on the SGI Origin 2000 and the Cray T3E.” The 41st Cray Users Group Conference, Minneapolis, MN: Cray Users Group, May 1999.
Kessler, R. E. “Analysis of Multi-Megabyte Secondary CPU Cache Memories.” University of Wisconsin, Madison, WI, <ftp://ftp.cs.wisc.edu/markhill /Theses/richard-kessler-body.pdf>, 1991.
Laudon, J., and D. Lenoski. “The SGI Origin: A ccNUMA Highly Scalable Server.” Proceedings for the 24th Annual International Symposium on Computer Architecture, New York: ACM, 1997.
McCalpin, J. D. “STREAM Standard Results.” <http://www.cs.virginia.edu /streams/standard/MFLOPS.html>, 2000.
Mucci, P. J., and K. London. “The CacheBench Report.” CEWES MSRC/PET TR/98-25, Vicksburg, MS, <http://www.wes.hpc.mil>, 1998.
O’Neal, D., and J. Urbanic. “On Performance and Efficiency: Cray Architectures.” Pittsburgh Supercomputing Center, <http://www.psc.edu /~oneal/eff/eff.html>, August 1997.
Palacharla, S., and R. E. Kessler. “Evaluating Stream Buffers as a Secondary Cache Replacement.” Proceedings for the 21st Annual International Symposium on Computer Architecture, Los Alamitos, CA: IEEE Computer Society Press, 1994.
Pressel, D. M. “Early Results From the Porting of the Computational Fluid Dynamics Code, F3D, to the Silicon Graphics Power Challenge.” ARL-TR-1562, U.S. Army Research Laboratory, Aberdeen Proving Ground, MD, December 1997.
Pressel, D. M. “Fundamental Limitations on the Use of Prefetching and Stream Buffers for Scientific Applications.” ARL-TR-2538, U.S. Army Research Laboratory, Aberdeen Proving Ground, MD, June 2001.
11

INTENTIONALLY LEFT BLANK.
12

Glossary
AHPCRC Army High Performance Computing Research Center
BLAS Basic linear algebra subroutines
CFD Computational fluid dynamics
CHSSI Common High Performance Computing Software Support Initiative
CISC Complicated instruction set computer
DOD Department of Defense
DOE Department of Energy
HPC High performance computing
HPCM High performance computing modernization
MFLOPS Million floating point operations per second
MPP Massively parallel processor
RISC Reduced instruction set computer
13

INTENTIONALLY LEFT BLANK.
14
NO. OF NO. OF COPIES ORGANIZATION COPIES ORGANIZATION 2 DEFENSE TECHNICAL 3 DIRECTOR INFORMATION CENTER US ARMY RESEARCH LAB DTIC OCA AMSRL CI LL 8725 JOHN J KINGMAN RD 2800 POWDER MILL RD STE 0944 ADELPHI MD 20783-1197 FT BELVOIR VA 22060-6218 3 DIRECTOR 1 HQDA US ARMY RESEARCH LAB DAMO FDT AMSRL CI IS T 400 ARMY PENTAGON 2800 POWDER MILL RD WASHINGTON DC 20310-0460 ADELPHI MD 20783-1197 1 OSD
ABERDEEN PROVING GROUND OUSD(A&T)/ODDR&E(R) DR R J TREW 2 DIR USARL 3800 DEFENSE PENTAGON AMSRL CI LP (BLDG 305) WASHINGTON DC 20301-3800
1 COMMANDING GENERAL US ARMY MATERIEL CMD AMCRDA TF 5001 EISENHOWER AVE ALEXANDRIA VA 22333-0001 1 INST FOR ADVNCD TCHNLGY THE UNIV OF TEXAS AT AUSTIN 3925 W BRAKER LN STE 400 AUSTIN TX 78759-5316 1 US MILITARY ACADEMY MATH SCI CTR EXCELLENCE MADN MATH THAYER HALL WEST POINT NY 10996-1786 1 DIRECTOR US ARMY RESEARCH LAB AMSRL D DR D SMITH 2800 POWDER MILL RD ADELPHI MD 20783-1197 1 DIRECTOR US ARMY RESEARCH LAB AMSRL CI AI R 2800 POWDER MILL RD ADELPHI MD 20783-1197
15

NO. OF NO. OF COPIES ORGANIZATION COPIES ORGANIZATION 1 PROGRAM DIRECTOR 1 NAVAL RSCH LAB C HENRY R RAMAMURTI CODE 6410 1010 N GLEBE RD STE 510 4555 OVERLOOK AVE SW ARLINGTON VA 22201 WASHINGTON DC 20375-5344 1 DPTY PROGRAM DIRECTOR 1 ARMY AEROFLIGHT L DAVIS DYNAMICS DIRECTORATE 1010 N GLEBE RD STE 510 R MEAKIN M S 258 1 ARLINGTON VA 22201 MOFFETT FIELD CA 94035-1000 1 DISTRIBUTED CENTERS 1 NAVAL RSCH LAB PROJECT OFFICER HEAD OCEAN DYNAMICS V THOMAS & PREDICTION BRANCH 1010 N GLEBE RD STE 510 J W MCCAFFREY JR CODE 7320 ARLINGTON VA 22201 STENNIS SPACE CENTER MS 39529 1 HPC CTRS PROJECT MNGR J BAIRD 1 US AIR FORCE WRIGHT LAB 1010 N GLEBE RD STE 510 WL FIM ARLINGTON VA 22201 J J S SHANG 2645 FIFTH ST STE 6 1 CHSSI PROJECT MNGR WPAFB OH 45433-7912 L PERKINS 1010 N GLEBE RD STE 510 1 US AIR FORCE PHILIPS LAB ARLINGTON VA 22201 OLAC PL RKFE CAPT S G WIERSCHKE 1 RICE UNIVERSITY 10 E SATURN BLVD MECHANICAL ENGRNG & EDWARDS AFB CA 93524-7680 MATERIALS SCIENCE M BEHR MS 321 1 NAVAL RSCH LAB 6100 MAIN ST DR D PAPACONSTANTOPOLOUS HOUSTON TX 77005 CODE 6390 4555 OVERLOOK AVE SW 1 NAVAL RSCH LAB WASHINGTON DC 20375-5000 J OSBURN CODE 5594 BLDG A49 RM 15 1 AIR FORCE RSCH LAB DEHE 4555 OVERLOOK AVE SW R PETERKIN WASHINGTON DC 20375-5340 3550 ABERDEEN AVE SE KIRTLAND AFB NM 87117-5776 1 NAVAL RSCH LAB J BORIS CODE 6400 1 NAVAL RSCH LAB 4555 OVERLOOK AVE SW RSCH OCEANOGRAPHER CNMOC WASHINGTON DC 20375-5344 G HEBURN BLDG 1020 RM 178 1 WL FIMC STENNIS SPACE CENTER MS B STRANG 39529 BLDG 450 2645 FIFTH ST STE 7 1 AIR FORCE RSCH LAB WPAFB OH 45433-7913 INFORMATION DIRECTORATE
R W LINDERMAN 26 ELECTRONIC PKWY ROME NY 13441-4514
16

NO. OF NO. OF COPIES ORGANIZATION COPIES ORGANIZATION 49590 LASSING RD 1 SPAWARSYSCEN D4402 SAN DIEGO CA 92152-6148 R A WASILAUSKY 1 UNIVERSITY OF TENNESSEE BLDG 33 RM 0071A COMPUTER SCIENCE DEPT 53560 HULL ST S MOORE SAN DIEGO CA 92152-5001 1122 VOLUNTEER BLVD STE 203 1 USAE WATERWAYS KNOXVILLE TN 37996-3450 EXPERIMENT STATION CEWES HV C
ABERDEEN PROVING GROUND J P HOLLAND 3909 HALLS FERRY RD 23 DIR USARL VICKSBURG MS 39180-6199 AMSRL CI N RADHAKRISHNAN 1 US ARMY CECOM RSCH AMSRL CI H DEVELOPMENT & ENGRNG CTR C NIETUBICZ AMSEL RD C2 AMSRL CI HC B S PERLMAN D PRESSEL FT MONMOUTH NJ 07703 D HISLEY R NAMBURU 1 SPACE & NAVAL WARFARE R VALISETTY SYSTEMS CTR D SHIRES K BROMLEY CODE D7305 M HURLEY BLDG 606 RM 325 P CHUNG 53140 SYSTEMS ST J CLARKE SAN DIEGO CA 92152-5001 C ZOLTANI A MARK 1 RICE UNIVERSITY AMSRL CI HI MECHANICAL ENGRNG & T PRESSLEY MATERIALS SCIENCE AMSRL CI HS T TEZDUYAR MS 321 D BROWN 6100 MAIN ST R PRABHAKARAN HOUSTON TX 77005 T KENDALL P MATTHEWS 3 ARMY HIGH PERFORMANCE K SMITH COMPUTING RSCH CTR AMSRL WM BC B BRYAN P PLOSTINS P MUZIO AMSRL WM BF V KUMAR H EDGE 1200 WASHINGTON AVE AMSRL WM BC S MINNEAPOLIS MN 55415 J SAHU K HEAVEY 1 ARMY HIGH PERFORMANCE P WEINACHT COMPUTING RSCH CTR G V CANDLER
1200 WASHINGTON AVE S MINNEAPOLIS MN 55415 1 NAVAL CMD CNTRL & OCEAN SURVEILLANCE CTR L PARNELL NCCOSC RDTE DIV D3603
17

INTENTIONALLY LEFT BLANK.
18

19