high-resolution 4d imaging in live · pdf filehigh-resolution 4d imaging in live cells maya...
TRANSCRIPT

High-Resolution 4D Imagingin Live Cells
Maya Shamir and Daniel KaganovichDepartment of Cell and Developmental Biology,Alexander Silberman Institute of Life Sciences,Hebrew University of Jerusalem, Jerusalem, Israel
1 Introduction 12 Fluorescence in Live Systems (Resolution) 2
2.1 What to Image: Ideal Model Systemsfor 4D Imaging 2
2.2 How to Image: Detecting Proteins inLive Cells 2
2.3 The Sample: Special Considerations forLive-Cell Imaging 4
2.4 The Imaging Setup: The Microscopeand Coping With Challenges of 4DImaging 5
2.5 The Special Case of Breaking the‘Resolution Limit’ – Super Resolution 7
3 Approaches to Study Protein–ProteinInteractions 83.1 Forster Resonance Energy Transfer 83.2 Fluorescence Correlation
Spectroscopy/Fluorescence LifetimeImaging 9
3.3 Fluorescence Loss in Photo-bleaching/Fluorescence Recoveryafter Photobleaching/Photoactivation 10
3.4 Bimolecular FluorescenceComplementation 12
4 Reporters of Protein Function 124.1 Calcium Signaling 124.2 RedOx-Sensitive GFP 134.3 Folding Sensors 13
5 Future Research in Live-Cell Imaging 135.1 Optogenetics 135.2 Subcellular Protein Atlas 155.3 4D Imaging in Protein Aggregation and
Quality Control 15Abbreviations and Acronyms 16Related Articles 16References 16
The technological sophistication of microscopyapproaches has grown by leaps and bounds over the pastdecade. This has yielded microscopes capable of greatersensitivity, faster acquisition, and higher resolution, as wellas fluorophores and imaging tools that demonstrate moreand more diversity of properties and applications. Yet forall the putative improvements to the cell biologists’ tool kit,the application of potentially invaluable tools to unsolvedscientific problems is still in its infancy. The purpose ofour review is to discuss important innovations in live-cellimaging, focusing on practical considerations for probingbiological systems at the molecular level while remainingrooted in a live-cell context.
1 INTRODUCTION
The central challenge of cell biology in the current ageis to integrate the reductionist, atomistic view of biolog-ical function propounded by biochemists into a holistic,qualitative analysis of cellular function and viability. Atthe most basic level, this requires a technological shift inexperimental approaches that bridges several length andtimescales of molecular organization. On one hand, to askquestions about the function of subcellular components(nucleic acids, lipids, proteins, etc.), we need to assay theirmolecular properties (size, shape(s), mobility, and inter-active affinities) in relative isolation. On the other hand,mounting evidence of the substantial differences betweenthe test tube and the crowded, sticky, inhomogeneous, andspatially confined intracellular environment compels usto incorporate techniques that assay events at the atomicscale into live-cell experimental systems. What this means,practically speaking, is that imaging approaches that havetraditionally been used on the microscale to make quali-tative observations (is the cell alive or dead?, is a specificprotein expressed?, where is it localized?) must now berefined to operate on the nanoscale, bringing biochem-ical questions into living cells (do two proteins interact?,what is the spatiotemporal distribution of a network ofproteins and how is it regulated?, what molecular eventsaffect cellular function and health?). In discussing theimprovements in live-cell imaging approaches that havebegun to make these types of multiscale in-vivo biochem-istry experiments possible, we would like also to cast aneye toward the changing paradigm of protein biochem-istry and biophysics. In this new paradigm of intracellularbiochemistry, concentration becomes a variable propertyof specific nanoenvironments; protein–protein interac-tions can be established by assaying probabilities fromstatistical distributions of observables; ‘structure’ refersto an ensemble of different conformational states; and thebiochemical properties of a protein are subpopulation-specific.
Encyclopedia of Analytical Chemistry, Online © 2006–2013 John Wiley & Sons, Ltd.This article is © 2013 John Wiley & Sons, Ltd.This article was published in the Encyclopedia of Analytical Chemistry in 2013 by John Wiley & Sons, Ltd.DOI: 10.1002/9780470027318.a9326

2 NUCLEIC ACIDS STRUCTURE AND MAPPING
In this article, we will discuss a number of establishedtechniques and new innovations pertaining to the typesof molecular and cell biological events, which we can nowmeasure in living cells. We have divided our discussionof live-cell imaging into three overlapping sections:resolution (measuring the subcellular distribution anddynamics of proteins in a cell); interaction (measuringprotein–protein association in living systems); andfunction (assaying protein function in living cells). Aslive-cell imaging approaches have evolved, it has becomepossible and desirable to simultaneously obtain imagesfrom the entire sample along all three axes: x, y, and z.With the added dimension of time, the state of the artfor live-cell imaging is now to acquire the complete set ofvoxels for a sample (a 3D image) over time – rendering thedata a 3D time-lapse, or 4D image. This added resolutionis essential for the types of measurements mentionedabove and is described in detail in this article. Giventhe wide availability of informative, in-depth articles andreviews on many of the live-cell imaging approachesthat we discuss, we have tried to narrow our focus totechniques that can be robustly and practically integratedwith 3D time-lapse imaging in live samples, or 4D imaging.
2 FLUORESCENCE IN LIVE SYSTEMS(RESOLUTION)
2.1 What to Image: Ideal Model Systems for 4DImaging
Live-cell imaging, for the most part, means imaging usingvisible light (see Fluorescence Imaging). For this reason,transparent model organisms such as the nematode,Caenorhabditis elegans, the Zebrafish, Danio rerio, andthe Baker’s Yeast, Saccharomyces cerevisiae, have alwaysbeen a favorite for live-cell imaging. Detailed cell biologyexperiments, however, were often left for cultured cells,owing to their relatively large size and relative flatness.Today, these classical model systems are getting a secondlook as ideal platforms for combining the awesomepower of yeast genetics,(1) the experimental transparencyof C. elegans, and the transparent window into thedevelopment of the vertebrate D. rerio, with recentimprovements in imaging throughput, resolution, andsensitivity.(2,3) Using these powerful systems as the basisfor in vivo biochemistry carries with it the rewardof incorporating their unique advantages into the 4Dimaging application. There are several notable examples.High-throughput, high-content imaging now enablesfull-genome investigation of microscopic phenotypesin yeast.(4) Four-dimensional imaging of C. elegans athigh resolution enables the study of tissue-specific cells,such as neurons, in a functional multicellular organism.Long-term noninvasive imaging of Zebrafish allows
for the study of organ development and function inunprecedented mechanistic detail.(3)
2.2 How to Image: Detecting Proteins in Live Cells
Traditional immunofluorescence techniques have beenindispensable to track proteins in fixed cells, butpresent obstacles for experiments in live cells owingto the extensive treatments the cells must undergobefore the immunoreactive proteins can be visualized.Immunofluorescence experiments are easy to carryout in a vast array of cell lines, without need totransfect or genetically modify the cells. There aremany available immune-reactive fluorescent probes,suited for diverse needs of the exact cell line andexperiment (see Fluorescence Imaging). On the otherhand, the fixation process drastically perturbs delicatecellular structures and may cause artifacts in the imageowing to cross-reactivity. In addition, the primary andsecondary antibody complex is quite large, especiallyrelative to a small protein of interest. The fluorescenceamplification effect due to the antibody chain can distortthe original protein amount. For these reasons andmany others, cell biologists increasingly appreciate theadvantages of live imaging over immunofluorescence.Without fluorescent antibodies, genetically engineeredfluorescent fusion proteins are essential for visualizinglive-cell components.
Most biologically relevant molecules are nonfluores-cent, or fluoresce very dimly, creating a homogeneousbackground. In order to track a specific population ofproteins while imaging, the protein must be attached toa fluorescent moiety. The discovery of the green fluo-rescent protein (GFP) revolutionized the very essence ofresearch approaches in many biological fields. Originatingin the jellyfish Aequorea Victoria, the gene was clonedand expressed heterologously in many different organ-isms, emitting a bright fluorescent signal in response toa variety of light sources. These initial experiments indi-cated that the gene is self-sufficient in that it carries allthe necessary information for fluorescence, without theaid of jellyfish-specific chaperones, but with requirementfor O2 in the maturation process.(5) This finding openeda world of possible applications: GFP can be geneti-cally fused with proteins to produce chimeras; many ofthese can maintain their native biological function andlocalization despite the fusion. Shortly following theadoption of GFP as a staple of cell biological anal-ysis, several additional spectral variants were created,while the initial protein was improved.(6) Today thereare dozens of spectral variants that can meet differentexperimental needs with versatility and enable multi-color labeling of different cellular components. Whenpicking the appropriate set of fluorophores for a live-cell
Encyclopedia of Analytical Chemistry, Online © 2006–2013 John Wiley & Sons, Ltd.This article is © 2013 John Wiley & Sons, Ltd.This article was published in the Encyclopedia of Analytical Chemistry in 2013 by John Wiley & Sons, Ltd.DOI: 10.1002/9780470027318.a9326

HIGH-RESOLUTION 4D IMAGING IN LIVE CELLS 3
Table 1 Comparison of selected available fluorescent proteins
Name of fluorescence probe Advantages Disadvantages
EGFP Photostable, bright, appropriate for two-colorimaging with mCherry
Hard to do multicolor, partial overlap withblue fluorophores
mCherry Photostable, bright, appropriate for two-colorimaging with EGFP
Hard to do multicolor without good spectraldetectors to distinguish other redfluorophores (e.g. E2-crimson, tomato)
tdTomato Very bright, a broad spectrum Less photostable, a broad spectra, large, andbulky
E2-Crimson Tissue penetration, less phototoxicity, lowerbackground noise
Less bright
Cerulean Quite bright High background fluorescence, high energythat may harm cells, not very photostable
Venus Very bright Very close to GFP and mCherry spectra
imaging experiment, there are a few important consider-ations. The usefulness of a fluorophore for cell imagingis usually the result of a combination of three param-eters: its photostability (how quickly the fluorophorebleaches when activated), its quantum yield (how brightlyit fluoresces), and the breadth of its excitation/emissionpeaks (will its fluorescence overlap with other fluo-rophores used in the experiment). There are a few otherparameters that should be kept in mind when picking fluo-rophores, including maturation time (how quickly will thefluorophore mature post translationally, and fluoresce),tendency to oligomerize, and size (some fluorophores aretandem dimers).(6) In our hands, EGFP and mCherryremain two of the most useful fluorophores as they areamong the most photostable, extremely bright, and haveeasily resolvable excitation/emission peaks, enabling two-color imaging. Three-color imaging remains somewhatof a challenge, and usually requires a compromise onsome of the three parameters mentioned. The tdTomatotandem dimer is among the brightest of all fluorescentproteins, although in our hands it is less photostable thanGFP and mCherry and has a very broad yellow excita-tion/emission spectra, making it very difficult to resolvebetween GFP, mCherry, and tdTomato for three-colorimaging (Table 1). tdTomato is also twice as large asmost other fluorophores, because it is a tandem dimer.However, the extreme brightness and broad excitationspectrum of tdTomato can be turned to advantage.Although its size makes it less preferable for detectinga functional protein (for fear that a 60-kDa fusion maydisrupt mobility and function), it can be used very effec-tively as a marker for cellular compartments, such as thenucleus, cytosol, ER, mitochondria, and so forth.(7,8) Inaddition, it can be excited by the 488-nm wavelength,usually used for GFP, but will emit in a region that canbe spectrally separated from GFP with a simple filter,making it a nice tool for simultaneous detection of twofluorophores in imaging or FACS experiments.
Red shifted fluorophores are of particular importanceas fluorescent proteins excited by longer wavelength lightprovide greater tissue penetration, and the lower energyof the wavelength minimizes the potential harm, or photo-toxicity, to the surrounding cellular environment. Anadditional benefit of far red fluorophores is the lowerbackground noise, as living samples usually autofluorescein the blue/green wavelength zone.(10) Recent progress inthe development of red fluorescent proteins (RFPs) hasyielded a number of useful tools, such as DsRed2, mStraw-berry, and mPlum. For reasons mentioned earlier, anoptimal fluorescent protein for in vivo imaging would haveexcitation and emission spectra near the infrared region,and a class of proteins with this property has recentlyemerged. Examples include E2-Crimson and tagRFP657,as well as iRFP, which are based on a phytochrome ofa bacterial origin.(11) iRFP has been used successfullyin deep-tissue imaging by photoacoustic tomography.(12)
Although red shifted fluorophores are constantly beingimproved, so far EGFP and mCherry remain the mostreliable pair.
It is important to keep in mind that fusing anadditional amino acid sequence to any protein mayaffect its localization and biological activity. This shouldnot discourage live-cell experiments, as appropriatecontrols can usually verify proper protein functionand localization. Still, GFP and all its derivatives aresignificantly large, around 238 amino acids, and thismay have unwanted steric effects. Therefore, it is highlyrecommended to consider the site of fusion relative to thestructure and function of the protein of interest (is therean active site or targeting sequence on the N-terminus?, isone of the termini buried inside the protein core?). Owingto some of the constraints of using protein fluorophores,alternatives to GFP have always been of interest.
One such GFP alternative is the use of biarsenicreagents for site-specific protein labeling in live cells.The Tsien lab and colleagues first developed the FlAsH(Fluorescein Arsenical Helix binder) labeling technology
Encyclopedia of Analytical Chemistry, Online © 2006–2013 John Wiley & Sons, Ltd.This article is © 2013 John Wiley & Sons, Ltd.This article was published in the Encyclopedia of Analytical Chemistry in 2013 by John Wiley & Sons, Ltd.DOI: 10.1002/9780470027318.a9326

4 NUCLEIC ACIDS STRUCTURE AND MAPPING
in 1998, which exploits the high-affinity of arsenic forthiols.(13) The system is composed of two interactingcomponents: a 6-amino acid sequence (tetracysteine)serving as receptor domain, which can be integrated intothe DNA sequence of the protein to be labeled, and asmall synthetic biarsenic compound, FlAsH, that becomesfluorescent and emits green light on binding to the above-mentioned motif in a reducing environment. The aminoacids composition can be substituted and elongated,(14)
but the initial best fluorescence results were obtainedwhen abundant cysteines were placed as a parallelogramin one side of an α-helix. When FlAsH is unbound tothe tetracysteine, it is bound to ethane dithiol (EDT),reducing its potential toxicity in the cell, and in this state, itis virtually nonfluorescent. A competition game of affinitytoward the FlAsH is played among the EDT, serving asantidote, the tetracysteine domain, which activates thefluorescence, and other adjacent thiol-pairs present indifferent proteins in the cell. The FlAsH–cystein bondingis covalent but reversible.
The FlAsH method has a few potential advantagesover the traditional fluorescent proteins such as GFP: theprotein can be visualized immediately after translation,as there is no need for a maturation process to occur;the tetracysteine tag can be easily subcloned and is smallenough as to not interfere with the protein’s endogenousbehavior; and similar biarsenic molecules are availabletoday that emit light in red and blue, allowing a choice ofcolorful labeling (ReAsH and CHoXAsH, respectively).This method was proved valuable in a variety ofapplications, from Forster resonance energy transfer(FRET) and single-molecule analysis to protein stabilityreporters and affinity purification,(15,16) and ReAsH caneven be used in electron microscopy.(17) However, theFlAsH technique has its drawbacks – poor labelingspecificity, cellular toxicity, and undesired palmitoylationand oxidation of the tetracysteine motif.(18) Moreover, theFlAsH reagent is relatively expensive (certainly relativeto DNA-encoded fluorophores), and displays a fair bit ofbackground fluorescence.
The development of FlAsH paved the way for thedesigning of similar systems, based on a nongeneticallyencoded fluorescent probe, targeted at a cellular local-ization by a fused recognition motif. The next level isthe addition of a mediator, which does not fluoresce onits own, but rather binds the fluorophore to the properlocation, such as a ligase. Generally, this is regarded asan enzyme-mediated labeling method and is unique inthe high labeling specificity that can be achieved. In 2010,the Ting lab introduced the PRIME method (PRobeIncorporation Mediated by Enzymes), utilizing an engi-neered Escherichia coli lipoic acid ligase. The mutatedligase can bind covalently between a blue fluorophore,7-hydroxycoumarin, and a 13-amino acids recognition
motif, and proved to efficiently ‘highlight’ a variety ofnuclear and cytosolic proteins.(18) The approaches are intheir infancy but have tremendous potential. Chemicalfluorophores can be engineered to emit in far-red wave-lengths much more readily than protein fluorophores andto fluoresce brightly and with high photostability. The13-amino acids long tag can be inserted anywhere inthe protein (not just the N- or C-terminus), and it is agreat improvement from the 30-kDa payload of a GFP ormCherry.
2.3 The Sample: Special Considerations for Live-CellImaging
Living things tend to move around, they consist of manydynamic parts, and are sensitive to damage. These areamong the most important considerations for conductinglive-cell imaging over time. Movement can obviouslytake the sample out of the field of view, but can alsoobscure rapid dynamic processes, and even resolution,if movement occurs on a smaller timescale than imageacquisition. Prolonged imaging, especially with lower-wavelength blue light which is used to activate GFP, willresult in phototoxicity by way of free radical generation.As a corollary, prolonged imaging with too high anintensity will also photobleach the fluorophore, depletingthe signal. An excellent review that surveys the full scopeof considerations needed to be taken into account in live-cell imaging was published by Dailey et al.(19) Finally,some live samples require specialized environmentalcontrol (such as CO2, humidity, and temperature).
Sample mobility problems can be solved by adheringcells to the coverslip. This is usually easier with culturedmammalian cells, which naturally adhere strongly to avariety of matrices. This is less so the case with glass,which is ideal for high-magnification, high-resolutionimaging, but coating the glass with polylysine is effective.For yeast, which do not effectively adhere to lysine,Concanavalin A is a somewhat effective adherent. Anumber of solutions have been devised to completelyimmobilize samples that tend to move around a lot, suchas yeast and C. elegans. Agarose pads can also be usedto keep cells in place, and sometimes also to flattenthem.(20) The most effective solution is immobilizationwith microfluidic flow.(21,22) In order to control theenvironment, chambered glass coverslips or 35-mm glass-bottom petri dishes are ideal. Microfluidics also allow fora variety of subtle approaches to maintain and rapidlymodulate the environment surrounding the sample.(21)
Minimizing phototoxicity is similarly critical for alllive-cell imaging and relates to almost every aspect ofthe imaging approach discussed in this article. The mosteffective approach is to design the right imaging system(which will be further discussed subsequently) optimizingsensitivity and speed of acquisition. In some cases, it
Encyclopedia of Analytical Chemistry, Online © 2006–2013 John Wiley & Sons, Ltd.This article is © 2013 John Wiley & Sons, Ltd.This article was published in the Encyclopedia of Analytical Chemistry in 2013 by John Wiley & Sons, Ltd.DOI: 10.1002/9780470027318.a9326
HIGH-RESOLUTION 4D IMAGING IN LIVE CELLS 5
may be necessary to compromise on the resolution andquality of the image in order to minimize exposureand photobleaching. Finally, the development of far-red fluorophores promises to help address this challengeas well, as there is less endogenous activation at thesewavelengths, which are also longer.
2.4 The Imaging Setup: The Microscope and CopingWith Challenges of 4D Imaging
In order to be useful for visualizing biological sampleslabeled with any of the fluorophores discussed, amicroscope must have at least three components: a sourceof high-intensity light in a coherent wavelength (this isusually achieved by filtering the light or simply by usinglasers); an objective to focus the light on the sample(ideally a PlanApo objective ensuring correction ofchromatic aberration and an NA, or numerical aperture,that is as high as possible); and a way to record the lightemerging from the sample (a camera, charge-coupleddevice (CCD), or photomultiplier (PMT) discussed laterin this article). Once these basic components are at hand,an extensive process of optimization of all of them isneeded. The things that must be optimized, often as acompromise between all of these related components arespatial resolution (x,y,z), time resolution (t) (i.e. speed ofacquisition), and sensitivity.
2.4.1 Spatial Resolution
There are a number of factors that confound axial (x, y)resolution. One issue is related to z resolution: conven-tional microscopy (e.g. epifluorescence microscopy – and
also looking through the eyepiece of any microscope)usually has a much greater axial resolution than z
resolution, or depth of field. The result is that xydetails from different parts of the z-section are super-imposed obscuring xy structural detail. In addition, athick (2–3 micrometer for conventional epifluorescence)depth of field obscures axial resolution with out-of-focuslight, resulting from the point-spread function (PSF) ofthe microscope, or in other words, the optical response ofthe imaging system to an object in a point in space. Thisout-of-focus light and spherical aberration is the result oflight going through the various different media that liebetween the sample and the recording instrument (objec-tive, immersion medium, sample medium, etc.). Lighttravels differently through these media and perturbationsand refraction of the signal result in the PSF.(23)
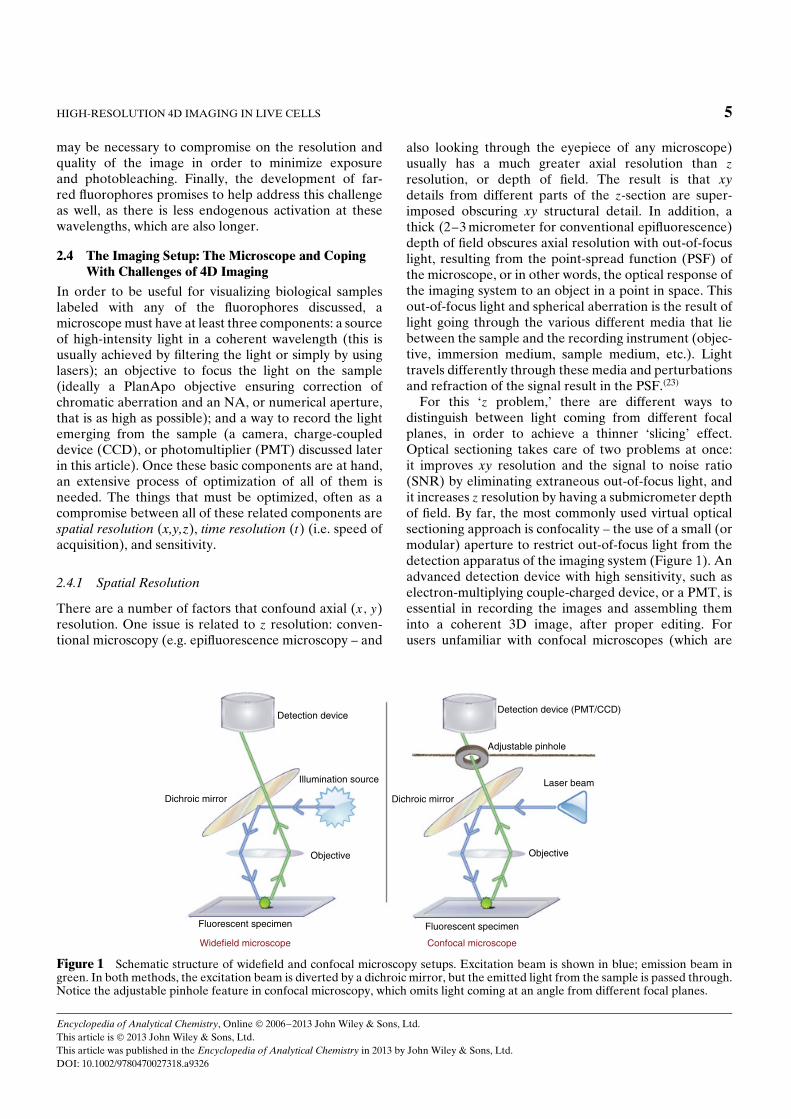
For this ‘z problem,’ there are different ways todistinguish between light coming from different focalplanes, in order to achieve a thinner ‘slicing’ effect.Optical sectioning takes care of two problems at once:it improves xy resolution and the signal to noise ratio(SNR) by eliminating extraneous out-of-focus light, andit increases z resolution by having a submicrometer depthof field. By far, the most commonly used virtual opticalsectioning approach is confocality – the use of a small (ormodular) aperture to restrict out-of-focus light from thedetection apparatus of the imaging system (Figure 1). Anadvanced detection device with high sensitivity, such aselectron-multiplying couple-charged device, or a PMT, isessential in recording the images and assembling theminto a coherent 3D image, after proper editing. Forusers unfamiliar with confocal microscopes (which are
Dichroic mirror
Illumination source
Fluorescent specimen
Objective
Dichroic mirror
Laser beam
Fluorescent specimen
Detection device (PMT/CCD)
Objective
Adjustable pinhole
Widefield microscope Confocal microscope
Detection device
Figure 1 Schematic structure of widefield and confocal microscopy setups. Excitation beam is shown in blue; emission beam ingreen. In both methods, the excitation beam is diverted by a dichroic mirror, but the emitted light from the sample is passed through.Notice the adjustable pinhole feature in confocal microscopy, which omits light coming at an angle from different focal planes.
Encyclopedia of Analytical Chemistry, Online © 2006–2013 John Wiley & Sons, Ltd.This article is © 2013 John Wiley & Sons, Ltd.This article was published in the Encyclopedia of Analytical Chemistry in 2013 by John Wiley & Sons, Ltd.DOI: 10.1002/9780470027318.a9326

6 NUCLEIC ACIDS STRUCTURE AND MAPPING
quite widely available these days), it is important tokeep in mind that the confocal pinhole is part of thedetection device, not the eyepiece. When inspecting asample by eye, before imaging, a regular halogen lamp andepifluorescence imaging is used to visualize the sample.
2.4.2 Time Resolution
Confocality, however, comes with its own challengesand downsides. Because a pinhole must be used in theacquisition, the sample must essentially be scanned pointby point. This, of course, slows down acquisition and canlead to excess illumination (causing photobleaching andphototoxicity) as getting enough focal plane signal pastthe pinhole from each point requires considerable pixel-dwell for the laser.(24) This bottleneck can be resolvedin a couple of ways. One is to scan multiple pointssimultaneously, as in spinning disk confocal microscopy.This microscope structure resembles many mini confocalsystems working simultaneously on different parts ofthe specimen, by rotating a metal disk (Nipkow disk)spirally embedded with as many as 20,000 pinholes(Yokogawa Spinning Disk Scanning Unit). The rotationalspeed can reach 10,000 rpm and more, corresponding to2000 frames per second.(25) Increasing the number ofpinholes will make greater use of the available light, buteventually a ‘cross-talk’ between the adjacent pinholescan occur, leading to a decrease in the number ofavailable confocal systems operating de facto. This againmay be bypassed by using state-of-the-art disks with astringent control of each pinhole opening and closingperformance in perfect timing as to not interfere withits neighbors. The main advantage of the spinning diskapproach is that the rate of acquisition is made very fastby the ability to essentially acquire the entire field ofview simultaneously, and the decreased exposure timeleads to the minimization of phototoxicity. Unlike point-scanning confocal instruments which usually use PMTdetectors, spinning disk confocal microscopes often useCCD cameras for detection, which have higher photonefficiency (sensitivity). The main disadvantage of spinningdisks is their decreased versatility (pinholes cannot bevaried for different objectives and different sectioningparameters) and the quality of the image is generallysomewhat lower than for point scanning.
There are a couple of additional alternatives totraditional (galvanometer mirror-based) point scanningthat can usually acquire an image in anywhere between0.5 and 2 s. Resonant scanners, which are mechanicallyand optically engineered for high-speed imaging, canperform point scanning much faster than the galvano-scanners that are generally used.(24) Resonant scanningmirrors can rival the speed of spinning disk systems(at around 30 frames per second), with most of their
advantages and few of the disadvantages. As always, theincreased speed comes at the cost of pixel dwell and hence,image quality. In addition, grating-based systems can usemovable nanometer-sized gratings to computationallyremove out-of-focus light, although this technology isfairly new to the market.
An additional confocal approach that is worthmentioning is multiphoton confocal imaging. Here, twohigh-wavelength photons intersect paths just at the pointintended for imaging. This approach greatly increasessample penetration (as biological samples simply donot absorb at far-red wavelengths) and virtually elimi-nates phototoxicity and extraneous illumination of thesample.(26) There is some indication, however, that multi-photon illumination delivers a very high payload ofenergy at the point being imaged,(27) but otherwise thisapproach is extremely noninvasive over time and drasti-cally improves SNR.
On a final note regarding confocal scanning, many ofthe live-cell imaging, in vivo biochemistry approachesdiscussed in this article can benefit tremendously from adual-scanning system. Such a system will have one laserpath continuously imaging, while another laser path isavailable for simultaneous laser perturbation (bleachingor photoactivation – these will be discussed in more detailsubsequently).
The fourth dimension, time, may require some addi-tional consideration. An imaging system capable of veryrapid scanning of the field of view is essential, althoughthere is an inevitable trade-off between the quality ofpixel scanning and speed of acquisition. Confocal opticalsectioning makes possible imaging in voxels rather thanpixels (all three spatial axis, x, y, and z). Virtual slicingof the sample into thin layers that can be reconstructedafterward to a full volume provides essential insights intothe spatial organization of the protein of interest, as intra-cellular components move in the z-direction as well as inxy.(28) Even when out-of-focus light is blocked by confo-cality, all focal planes are important for live-cell imagingbecause particles may go in and out of a specific z planeover time. A method to acquire all of the z-planes isessential. For rapid imaging in z, piezoelectric stages offerprecise and fast steps along the z-axis, and are essentialfor good temporal resolution (so that the xyz acquisitiondoes not take longer than the movement of the proteinor object being imaged).
2.4.3 Detection Sensitivity
Since recording the data of an imaging experimentrequires its conversion into a digital signal, a microscopeis only as good as its ability to successfully detect asmany of the (right) photons that are coming from thesample. Two major technological approaches excel at
Encyclopedia of Analytical Chemistry, Online © 2006–2013 John Wiley & Sons, Ltd.This article is © 2013 John Wiley & Sons, Ltd.This article was published in the Encyclopedia of Analytical Chemistry in 2013 by John Wiley & Sons, Ltd.DOI: 10.1002/9780470027318.a9326

HIGH-RESOLUTION 4D IMAGING IN LIVE CELLS 7
capturing the photons very effectively: CCDs and PMTs.In choosing between them, there are two concerns thatpredominate: sensitivity and SNR. Sensitivity is itself atwofold question, consisting of quantum efficiency andamplification. High quantum efficiency means capturinga high percentage of the available signal.(29) Amplificationtakes whatever signal is available and amplifies it via thedetection device. CCDs can have quantum efficiency thatis up to 96%, whereas PMTs generally only go up toaround 40–50% (GaAsP).(30) PMTs, however, amplifythe signal much more than CCDs. PMTs work somewhatfaster than CCDs and have a higher dynamic range.(31)
For multicolor imaging, an additional and somewhatorthogonal concern is spectral resolution. The standardtechnology for spectral resolution is to use band-passfilters to collect light in a specific wavelength range.(32)
This can be done with several PMTs in parallel, enablingsimultaneous multicolor imaging. Several spectral detec-tors, that are capable of separating wavelengths of lightat very high spectral resolution, have also recently beendeveloped. This can theoretically enable the use of fluo-rophores with very close emissions spectra, especiallywhen combined with spectral unmixing.(33) A seriouslimitation of this approach is the decreased sensitivity ofspectral detectors, which have to split the incoming lightinto a multitude of different paths.
Finally, an additional factor in all the considerations(mainly in spatial resolution and sensitivity) is theobjective being used to capture the image. In ways thatmight be intuitive, the objective is the business end of themicroscope, and there are a number of ways to optimize itfor the type of imaging that must be done. The numericalaperture (NA) of an objective is thought to be (justifiably)one of its most important qualities. A higher NA leadsto higher resolution (resolution radius = 0.6(wavelengthused to image)/NA).(34) However, NA is itself a product ofthe medium through which the light travels (NA=(indexof refraction of the objects medium)sin(half angle oflight collection by the lens)). Thus, oil objectives havethe highest NA (up to 1.49 for some objectives – oilbreaks light more than water, hence more light reachesthe objective). Water objectives, on the other hand, canhave NA up to 1.27.(35) The key point, however, is thatliving samples usually exist in an aqueous environment.For a high NA oil objective, moving away from theoil medium for even a few micrometers will severelydegrade the actual NA. Moreover, NAs of ∼1.4 and∼1.2 are not actually huge differences in resolution.Therefore, water objectives are worth considering forlive-cell imaging, where much of the sample is aqueous,and in many cases far removed from the coverslip.Water is also substantially cleaner to work with than oil,and the alignment between the immersion medium andthe sample medium eliminates much of the aberration
‘stretching’ that is often seen in the z-axis with oil-based imaging. Objectives often come with correctioncollars to adjust for differences in optical thickness ofthe coverslip on which the sample sits. It is criticalto adjust the correction collar for the actual opticalthickness (not just the reported thickness) of the coverslip.Generally, it is good practice to measure the PSF withfluorescent calibration beads before imaging with aparticular plate or multiwell chambered coverslip. Thisway, the correction collar can be adjusted to producethe appropriate point-spread function (there should beeven circular rings around the beads moving out offocus in both directions (up and down)). When workingwith oil objectives, as is often necessary and beneficial(such as when doing total internal reflection fluorescence(TIRF) (see following paragraphs) or otherwise imagingclose to the coverslip), it is important to choose animmersion oil with a refractive index that matches theobjective and the coverslip. Air objectives have muchlower NAs than either water or oil but can be usedto seamlessly go from well to well for high-throughputimaging.(36)
2.5 The Special Case of Breaking the ‘ResolutionLimit’ – Super Resolution
A rapidly emerging family of microscope technologies hasbeen credited the name ‘super resolution microscopy.’Back in 1873, Ernst Abbe realized that light microscopeshave limited spatial resolution, as fundamentally derivedby the light wavelength and the objective numerical aper-ture. As long as standard objectives and wavelengthsin the visible spectrum are used (more than 400 nm tominimize harm to the cells), the uppermost lateral reso-lution that can be achieved with a wide-field microscopeis 200 nm (see Fluorescence Imaging Microscopy).
This barrier seemed impassable for nearly 200 years,until the end of the twentieth century, when the firstsuper-resolution images were obtained (Figure 2). Twomethods are considered to be ‘near-field,’ exploiting thephysical phenomenon of an evanescent wave resultingfrom intense illumination (laser or glass fiber). In TIRF, aray of light is directed at the specimen’s surface at an anglethat is beyond the critical angle in those circumstances,resulting in total internal reflection by Snell’s law. At thesame time, an evanescent wave is generated but decaysexponentially with distance, thus exciting only a thinlayer of fluorophores that are 100–200 nm away fromthe original excited point. This is an artificial ‘confocal’situation, with the advantage of improved axial resolutionand reduced SNR, but confined to the outermost layer ofthe specimen closest to the glass cover.
The second method, near-field scanning opticalmicroscopy (NSOM) scans samples with a very small,
Encyclopedia of Analytical Chemistry, Online © 2006–2013 John Wiley & Sons, Ltd.This article is © 2013 John Wiley & Sons, Ltd.This article was published in the Encyclopedia of Analytical Chemistry in 2013 by John Wiley & Sons, Ltd.DOI: 10.1002/9780470027318.a9326

8 NUCLEIC ACIDS STRUCTURE AND MAPPING
Super resolutionapproaches
Near field Far field
TIRF NSOM SIM, STED PALM, STORM
PSFStochasticimaging
Figure 2 Different super-resolution techniques can be dividedinto different subgroups, based on their general conceptand operating principle. Represented here are the majorsuper-resolution imaging techniques available today.
sharp physical aperture without any objective lenses, andgenerates an image that bypasses the diffraction limit inall three dimensions (20–50 nm). The near-field methodsare in wide use nowadays, including research on endo-cytosis and exocytosis processes, but lack in ability topenetrate the cell’s outer layers.
Further advancements in super-resolution providedthe far-field methods, which rely on various theoreticalparameters in the diffraction limit and try to attackeach one (Figure 2). There are two main approachesto improving resolution further than the TIRF limit:sharpening the point-spread function and stochasticimaging or ‘pointillism.’ Two techniques work bysharpening the PSF, structured illumination microscopy(SIM), and stimulated emission depletion (STED).In SIM, a unique light pattern (Moire fringes) isobtained through interference of the emitted light fromthe specimen with a projected gridlike illuminationpattern. Acquisition of multiple images of the samespecimen in different orientations of the projectedillumination enriches the data available to constructthe image, resulting in a twofold improvement of theresolution.(37) This advancement can be further appliedin 3D (3D-SIM), with more light beams producingmore complex interference patterns, and enhancing theresolution an additional twofold in each dimension,all in all eightfold in comparison with traditional lightmicroscopy.(38) In 2009, a work published by Kner et al.(39)
demonstrated for the first time the relevance of SIM insuper-resolution video microscopy, enabled by using asilicon spatial light modulator that reduces the speed-limiting attribute of the illumination pattern production.Ensemble techniques, such as STED, attend to theproblem by modulating the excitation light to saturatethe fluorophores and desaturate them in a controlled
manner.(40) The system’s intrinsic attributes allow fordesaturating of all fluorophores except in the very centerof the beam, thereby producing a precise fluorescentspot that can be detected and analyzed so as to achieve30–80 nm resolution.(41) SIM and STED are constantlyevolving to improve resolution. Their main advantageand promise is that they are relatively fast. Live-cellimaging and super-resolution imaging are an awkwardmatch, as any movement in the sample will translateinto a devastating artifact in an imaging approach thatrelies on any kind of processing of raw data basedon assumptions of static localization. Moreover, theseand similar techniques crave photons, requiring an everincreasing amount of illumination to generate an image,thus increasing the risk of phototoxicity. That aside,new technological developments in super-resolutionare promising and may enable dynamic sub-100-nmresolution of moving samples in the nearby future.
Stochastic imaging techniques can achieve much higherspatial resolution than SIM, at least at the moment.These techniques (PALM and STORM) were madepossible with the development of photoactivatable dyes(PALM) and photoswitchable dye pairs or proteins(STORM), creating a system in which light can controlfluorescence of a subset of molecules instead of thewhole population.(42) If the excited fluorophores in eachtime point are properly dispersed, in proximity notunder 200 nm, then the exact localization of each onecan be determined. The excited fluorophores return toground state but excite neighboring fluorophores, thustemporally providing a series of pointillistic images thatonce combined, constitute an image with resolution rangeapproaching 30 nm.(43 – 47) The main disadvantage of theseapproaches for live-cell imaging is that they are extremelyslow, requiring hundreds of images to make a stochasticsampling. For now, this is essentially prohibitive when itcomes to working with live samples.
3 APPROACHES TO STUDYPROTEIN–PROTEIN INTERACTIONS
3.1 Forster Resonance Energy Transfer
Forster or Fluorescent Resonance Energy Transfer isa process in which energy is transferred via long-rangedipole–dipole coupling, from a donor excited fluorophoreto a nearby acceptor. The energy transfer takes place onlyif the two components are spatially separated by no morethan 10 nm. The transfer rate is inversely proportionalto the sixth power of the distance between the donorand the acceptor, making the energy transfer extremelysensitive to subtle changes in the distance. The range of1–10 nm was found relevant for most biomolecules and
Encyclopedia of Analytical Chemistry, Online © 2006–2013 John Wiley & Sons, Ltd.This article is © 2013 John Wiley & Sons, Ltd.This article was published in the Encyclopedia of Analytical Chemistry in 2013 by John Wiley & Sons, Ltd.DOI: 10.1002/9780470027318.a9326

HIGH-RESOLUTION 4D IMAGING IN LIVE CELLS 9
their interacting associates.(48) This method can be appliedto measure either intramolecular or intermoleculardistances and thus gain insights into protein folding orprotein–protein interactions (see Amyloids and ProteinAggregation – Analytical Methods).
The FRET pair should meet the following spectro-scopic requirements: the donor fluorophore should besufficiently exclusive in the excitation spectrum comparedto the acceptor, so that the latter does not emit light inde-pendently of the FRET process; a good separation of theemission spectra of the donor and the acceptor, so as todistinguish each of them and measure the extent of theFRET; and a partial overlap (>30%) of the donor’s emis-sion spectrum and the acceptor’s excitation spectrum, toallow for FRET.(49) Excessive spectral overlap will resultin significant background fluorescence, also referred toas spectral bleed-through (SBT), and careful calibration,correction methods, and wise choice of fluorophore pairsare required. The most commonly used FRET pair is notonly CFP/YFP but also BFP/EGFP, EGFP/mRFP1, andmTFP/mVenus.(50)
In theory, the energy transfer can be detected eitherby the fluorescence emission of the acceptor (calledsensitized emission) or by disrupting the quenchingeffect of the donor by the, for example, acceptorphotobleaching. The latter approach is highly accurateand will be elaborated further in the ‘FLIM’ section.
Sensitized emission can be readily imaged in live cells bymost microscopy techniques.(51,52) It amounts to excitingthe donor and recording emission from the acceptor. Itsmain caveat is that the acceptor will be excited bothby the sensitized emission (coming from the donor, i.e.FRET) and by the wavelength used to excite the donor(albeit to a lesser extent). The key to false-positive-freesensitized emission FRET imaging is to be sure of thestoichiometry of the pair from the outset (for example,if the FRET pair is fused to the same protein, thenthere is the exact same amount of each). If stoichiometryis unknown, it is nearly impossible to know how muchof the acceptor excitation is coming from the donor,and how much is coming from off-peak excitation fromthe donor laser. Acceptor photobleaching, on the otherhand, is much more reliable. If bleaching the acceptorunquenched donor molecules and results in an increaseof the green-shifted donor fluorescence, this increasedfluorescence cannot come from any other source than anunquenched donor. It is important to note that the FRETexperiments can yield false negatives, e.g. it is plausiblethat the FRET pair is in close proximity but orientated ina way that does not produce FRET.
3.2 Fluorescence CorrelationSpectroscopy/Fluorescence Lifetime Imaging
The fluorescence of a labeled protein can provide insightinto its cellular localization in the cell, its behavior underdifferent conditions, and many of its interactions withother proteins. It is interesting that even the fluctuationsof the fluorescence over time can teach us about theprotein, such as the diffusion rate and kinetic parameters,and this lies in the heart of fluorescence correlationspectroscopy (FCS). The amplitudes of the fluctuationscan also provide thermodynamic information.
In FCS, spontaneous fluorescence intensity fluctuationsare measured in a microscopic detection volume andare processed to give certain properties of the proteinpopulation. While most analytical methods to calculatediffusion coefficients, for example, are founded ondisturbance of an equilibrated system in an initialstate and measurement of the time it takes to regainequilibrium, in FCS the system remains in steady state,whether in equilibrium or nonequilibrium. Owing toBrownian motion, spontaneous momentary fluctuationsin the fluorescence of a sample can be detected, asa stochastic process. In a spatial manner, fluorescentmolecules diffusing in and out of a defined subvolumewill inevitably change the local concentration and thusthe fluorescence emitted from that subvolume. Byestablishing a direct link, or autocorrelation, between thefluorescence and the concentration of the molecules, withconsideration of the specific absorbance, the quantumyield of the molecule, and the laser beam intensity, onecan deduce the temporal concentration dependence andthe diffusion rates.(53)
Because FCS is based on averaging fluctuations, itis important that the measured particles sample shouldnot exceed a certain limit, as an average of a largegroup will eventually cross out the impact of eachfluctuation. Therefore the focal subvolume should includeup to 1000 molecules, equivalent to a submicromolarconcentration in a femtoliter volume.(54) As a result,FCS can be applied only to dilute solutions, a challengein the densely packed, semifluid cytoplasmic milieuin the cell. Additional limitations to FCS in vivoregard the movement restrictions in a highly disorderedenvironment, due to specific and nonspecific bindingof other cellular components to the diffusing entity.FCS analysis fits observables to an assumed theoreticaldiffusion coefficient. In the cell, it is not always clearwhich particles are diffusing and which are binding toother proteins or being shuttled around by transportmachinery.(1,55)
FCS has been utilized in a vast array of applica-tions, ranging from mobility-related parameters(56) toconformational changes, sometimes in combinations withimaging techniques presented here, such as TIRF and
Encyclopedia of Analytical Chemistry, Online © 2006–2013 John Wiley & Sons, Ltd.This article is © 2013 John Wiley & Sons, Ltd.This article was published in the Encyclopedia of Analytical Chemistry in 2013 by John Wiley & Sons, Ltd.DOI: 10.1002/9780470027318.a9326
10 NUCLEIC ACIDS STRUCTURE AND MAPPING
STED, to enhance spatial resolution. For example, FCScan be used to assess a protein’s folding state, as moltenglobules, intermediate folding states and the final, nativefolding of a protein are distinguishable in their exact diffu-sion coefficient. FCS is useful to measure processes in awide range of time-scales, spanning from microseconds tomolecularly slow, seconds-long processes, and thereforesuit a variety of proteins. However, the analysis durationextends accordingly, as there are many components takeninto account in the theoretical calculations. An excellentreview of in vivo and in vitro applications can be found inRef. 53 and in Ref. 57.
Fluorescence lifetime imaging (FLIM) and has becomea critical research tool to assess the spatial and temporaldistribution of fluorophore lifetimes inside living cells.For an extensive review of all aspects of fluorescencelifetime we refer the reader to Ref. 58.
The fluorescence lifetime, τ, is the average time afluorophore spends in the excited state before returningto ground state, accompanied by the emission of aphoton, and is an intrinsic property of the fluorophoreindependent of most external influences. The decay ofthe fluorescence intensity follows an exponential decaylaw, and the key parameter is τ. The fluorescence decaytime of most biological fluorophores is in the nanosecondrange but may be altered in accordance with the localenvironment conditions: pH, temperature, calcium ions,and so on.(51)
For biological applications such as identification ofFRET, FLIM is particularly useful, as the measurementis independent of local probe concentration, excitationintensity, and stoichiometry of donor and acceptormolecules. The donor’s lifetime is shortened by the FRETprocess, which can be measured with great precisionwith FLIM. In addition, the SBT, which is a majorhazard in FRET imaging, is avoided by FLIM owingto the sole measurement of the donor’s lifetime. FLIM isrestricted to live specimens, as the probe lifetime can varyunpredictably under different environmental conditions,as inevitably takes place in sample fixation.(59)
3.3 Fluorescence Loss in Photobleaching/FluorescenceRecovery after Photobleaching/Photoactivation
Fluorescence recovery after photobleaching (FRAP) hasbecome a dominant technique to assess the mobility of aprotein in a living cell. In FRAP, fluorescent proteinsare irreversibly bleached in a defined compartmentusing a localized high-intensity laser beam, and thefluorescence in that area is measured over time. The basicassumption is that a highly mobile protein populationwill be able to regain high fluorescence level faster thanthat of an immobile or low-mobile protein population.It is important to note that the fluorescent proteins
themselves do not recover, but rather the diffusion of new,unbleached proteins from the surrounding environmentinto the region of interest (ROI) is the cause offluorescence recovery. The results are plotted on a typicalcurve and two main quantitative parameters can beextracted: the mobile fraction of fluorescent moleculesand the rate of mobility.(60) This technique is specificallyuseful in the study of lateral movement of lipids in proteinsin the cell plasma membrane, as in the continuity ofcellular membranes and the dynamics of many cellularproteins.(61 – 64)
Although FRAP has become an indispensable part ofthe cell biology tool kit, there are a few things worthnoting when applying it to 4D imaging. FRAP recoverymeasurements inherently rely on time-lapse imaging,but so far this has mostly been done with imaginga single z-plane. Thinking in terms of voxels ratherthan pixels, in other words, being conscious of the z-dimension, is important for designing FRAP experimentsand analyzing the results. Confocal imaging offers theFRAP advantage of selecting a specific ROI and bleachingwith high-intensity laser only in that ROI. However,it is always good to keep in mind that the intensityof the laser will always have a 100% intensity in theROI, but will also have a much wider distribution oflower intensities in z, coming in and out of the ROI.Therefore, one should not be under the illusion thatthe only fluorophores being bleached with each high-intensity laser pulse are those in the ROI. Too muchbleaching in FRAP will deplete fluorescence in the rest ofthe cell, and will essentially result in fluorescence loss inphotobleaching (FLIP) (discussed subsequently). If thecellular fluorescence pool is depleted, there will be lessfluorescent material from which to recover fluorescencein the ROI, creating an artifactually apparent lack ofmobility of the sample in the ROI. The trick is to bleachas intensely and as quickly as possible, especially whenFRAPing mobile samples. Dual-scanning microscopesoffer the valuable advantage of enabling simultaneousbleaching and acquisition, so even in a mobile samplethe bleached area will be visible and recorded beforerecovery takes place. As with FCS, cell biologist shouldbe wary of computing diffusion coefficients for proteinsfrom FRAP data by fitting the recovery curve to first- orsecond-order exponentials. For some samples it is fair toassume uniform diffusion, but for many cellular factorsthis assumption is completely invalid. This aside, FRAP,and its inversion photoactivation (PhAc), are invaluablein determining the mobility of proteins in a subcellularcompartment and can be used to assay transport,solubility, and on/off rates of proteins.(8,65) For all theseapproaches, careful controls are needed to determine therate of bleaching simply due to acquisition of the image,separate from the intense bleaching by the laser.
Encyclopedia of Analytical Chemistry, Online © 2006–2013 John Wiley & Sons, Ltd.This article is © 2013 John Wiley & Sons, Ltd.This article was published in the Encyclopedia of Analytical Chemistry in 2013 by John Wiley & Sons, Ltd.DOI: 10.1002/9780470027318.a9326

HIGH-RESOLUTION 4D IMAGING IN LIVE CELLS 11
FLIP is a complementary method that assays contiguitybetween two compartments with respect to proteinmovement. FLIP differs from FRAP in that a continuousbleaching of an area some distance from the ROI depletesall mobile fluorophores in the cell, whose mobility willeventually bring them into the laser path, at sometime limit. Simultaneously measuring the fluorescencein the ROI can then determine whether all or aportion of the fluorescent material in the ROI is alsomobile. The off rate of the ROI fluorescence willhave a relationship to how much of the fluorescenceis depleted. A highly mobile population will cause rapidfluorescence loss in the ROI itself owing to the fluxof bleached molecules. In contrast, no or little changein the fluorescence would suggest that the moleculesin the ROI and the bleached area are separatedfrom one another and enclosed in a distinct cellularcompartment. FLIP is often used in combination withFRAP to characterize the dynamics of cellular transportand structure and can be used de facto as a controlfor FRAP studies.(66) Although theoretically completelyimmobile material in the ROI should remain fluorescentforever, in reality FLIP theoretical assumptions obtainand should be trusted only on a relatively short time-limit. As noted above, the ROI-targeted laser will havemaximum intensity only in the ROI voxels but will havesome fraction of that intensity in a much larger xy-footprint above and below the ROI. Only multiphotonFRAP/FLIP/PhAc is able to get around this problemby having a truly voxel-specific bleaching effect. Hence,on a point-scanning confocal microscope, a long-enoughFLIP experiment will also deplete fluorescence in acompletely immobile ROI, as some fraction of maximallaser intensity may make contact with it in other z-planes.
A somewhat more recent approach, which is quicklygaining momentum, represents the inverse of FRAP.Instead of bleaching the sample, which can haveadverse effects on the live cells, one can control theillumination of the fluorescence through photoactivationor PhAc. The ongoing pursuit of gathering moreinformation about the labeled protein has invigorated thedevelopment of a new class of fluorophores, collectivelynamed photoactivatable proteins. These fluorophores,sometimes called highlighters,(10) can be ‘turned on’to fluoresce only under specific conditions, adding asophisticated layer of control to many experimentssuch as the marking of specific organelles or proteinsubpopulations, and then tracking them over time.An example of a photoactivatable protein is PA-GFP, which undergoes a significant increase in 488-nmfluorescence on illumination with 413-nm light. Anotherpromising photoswitchable protein is Dendra, which canbe photoconverted from green to red fluorescent state
on exposure to blue light.(67) Dendra2 is an improvedversion of the initial Dendra, exhibiting faster maturationand brighter fluorescence both before and after thephotoactivation.(68) Dendra and Dendra2 proteins weremodified to be truly monomeric, as opposed to GFPand mCherry, which were derived from self-associatingproteins. This important property reduces the potentialcontribution of the fluorophore toward the formation ofartifactual protein complexes.
The ongoing efforts to extend the available paletteof photoactivatable fluorescent proteins have yieldedpSmOrange, in the Verkhusha laboratory in 2011.(69)
This protein can be photoconverted from orange tofar-red emission spectra using blue-green light, andexcels in its brightness and photostability. An improvedversion, pSmOrange2, is now available and has even beenshown to be of value in FRET experiments, on excita-tion from green donor fluorophores (FRET-facilitatedphotoswitching,(70)).The true power of photoswitchableproteins stems from the ability to track a distinctsubpopulation over time, in a quantifiable manner. Theconsiderations that needed to be taken into accountwhen choosing a photoactivatable protein are similarto any other fluorophore (e.g. desired wavelengths andmonomer) with the added aspect of the speed and effi-ciency of the photoconversion and the photostability ofthe resulting shifted fluorophore.
A divergent branch of photoactivatable proteinsincludes those that are photoswitchable between afluorescent and a nonfluorescent state. Theoretically,photoswitchable proteins are distinguished from photoac-tivatable proteins by the ability to be repeatedly turnedon and off. Practically, photoswitchable proteins canbe controlled by different wavelengths, but they wouldoverlap with the wavelength required for generating thefluorescence emission, thus creating a complicated, inter-twined pattern of fluorescence and switching.
In 2011, a photoswitchable variant of GFP by thename of Dreiklang was introduced as a breakthroughin the field of reversible switchable fluorescent proteins(RSFP).(71) Dreiklang was derived from site-directed andrandom mutagenesis of the yellow fluorescent proteincitrine, originating from GFP. Dreiklang can be switchedon on radiation with light of 365 nm, switched off with405 nm, and the fluorescence is excited at 515 nm. With amaturation half-time time of 2 h in 37°C, it might imposesome limitation on in vivo experiments that require fastreaction rates, but the fluorophore can be switched fivetimes on and off without any noticeable phototoxic effecton the cells. However, 20 cycles of switching did have adire effect on the cells viability. Dreiklang’s usefulnesswas demonstrated in an FRAP-like experiment, termedfluorescence recovery after switching (FRAS), and even insuper-resolution microscopy.
Encyclopedia of Analytical Chemistry, Online © 2006–2013 John Wiley & Sons, Ltd.This article is © 2013 John Wiley & Sons, Ltd.This article was published in the Encyclopedia of Analytical Chemistry in 2013 by John Wiley & Sons, Ltd.DOI: 10.1002/9780470027318.a9326
12 NUCLEIC ACIDS STRUCTURE AND MAPPING
3.4 Bimolecular Fluorescence Complementation
In addition to FRET, protein–protein interaction canbe detected through protein complementation assays(PCA), in which a biological function is obtainedonly through interaction of separate reporter halves.Each fragment is fused to a different protein, hencean indirect method to test the interaction betweenthe proteins. The split reporter can be any one ofbiological proteins functioning in a detectable manner:split β-lactamase, split-luciferase, split-ubiquitin system(relevant to cytoplasmic/membrane-compartmentalizedproteins), yeast two-hybrid system, or, most usefulfor live-cell imaging, split fluorophores such as GFP.The latter method, which is also termed bimolecularfluorescence complementation (BiFC), involves the fusionof two fragments of GFP (not fluorescent by themselves)to two proteins of interest. If the two GFP fragmentsare brought into close proximity by virtue of aninteraction between the two proteins of interest, theyfold into quasi-native structure and reconstitute thefluorescence.(72) Early versions of BiFC fluorophores,such as GFP, required an incubation temperatureof 30°C in order for the recombined fluorophoreto achieve maturity. Advanced Venus(73) derivativesallow for experimental procedure to take place at37°C, the optimum temperature for most mammaliancells. Another problematic implication of the syntheticfragments is the possibility of self-assembly, creating afalse-positive effect, but that as well was resolved with thedevelopment of a reduced self-assembly prone derivativeof Venus.(73) BiFC has many important advantages forlive-cell work, provided that controls are done to ruleout self-assembly. The binary signal/no signal readout isconvenient and easy to follow in living cells over time.BiFC can only detect the first successful protein–proteininteraction. The maturation of the fluorophore is covalentand irreversible; therefore, this approach is less suitedthan FRET and others discussed for visualizing transientand on/off interactions.
4 REPORTERS OF PROTEIN FUNCTION
The current frontier of live-cell imaging is the visualiza-tion of localized protein function, and its modulation inliving samples. This is very much a work in progress,but new sensors of stress, protein folding, and enzymaticactivity are constantly coming online. When compared toglobal enzymatic assays as reporters of protein function,an interesting feature of fluorophores is the linearity inregard to the number of proteins expressed. While anenzymatic reaction is not strictly linear because of theabundance of the substrate, each fluorophore is fused
to one protein sequence, thus the fluorescence producedcan serve as a good indication of the protein expressionand even functionality. However, this can be regardedas a disadvantage, as occasionally the signal propagationresulting from amplified turnover of multiple substratesaid in the observation of the protein at hand.
4.1 Calcium Signaling
Calcium is a central signal transduction molecule, andplays a crucial role in the metabolism and physiologyof most organisms. It usually exists as a gradient acrossthe plasma membrane, and in increased levels mediatesmany regulatory processes through binding to differentproteins. Calmodulin is one such protein (CALcium-MODULated protein, or CaM) that transduces thecalcium signal to form a biological response, throughbinding to different protein targets such as M13 (myosinlight-chain kinase). This network of interactions wasexploited to construct calcium sensors for imaging. In1997, a fluorescent indicator was presented, consistingof two different GFP variants linked by a CaM andpart of the M13 peptide chain that binds the CaM.(74)
The CaM–M13 hybrid undergoes conformational changeon increase in local Ca2+ concentration, which bringscloser together the two fluorophores, and FRET takesplace. Alternatively, the chimera could be devised soas the binding of calcium disrupts ongoing FRET.(75)
These genetically chimeric encoded Ca2+ indicators areknown as cameleons.(76) This method enables tracking andresolving of rapid calcium events in the cellular milieu.Furthermore, the chimeras can be directed to organellesby addition of the appropriate targeting sequences.However, problems rose as the CaM or the M13 mighthave undesired biological function,(5) as well as intrinsicfaults in FRET sensitivity and accuracy.
A leap forward was made possible by the discovery thata single GFP could tolerate insertions of whole proteins,in the right locations in the peptide sequence.(77) The firstexample of a single GFP-based Ca2+ probe was namedCamgaroo1. Soon followed enhanced versions based onthe same idea, of conformational changes of the GFP itselfin the presence of calcium: G-CaMP(78) and pericams.(79)
Instead of using two different fluorophores that undergoFRET, a single GFP which was circularly permutatedwas applied (cpGFP). The C′ terminal and N′ terminalof the GFP were interchanged and reconnected via ashort linker. The chromophore now formed was moreaccessible to protons, making its electrostatic potentialmore prone to external changes. Once fused to CaM andM13, likewise the conformational alteration resulted influorescence. This chimeric protein was named ‘pericam,’and several manipulations of the original moleculeprovided ‘inverse-pericam,’ in which the fluorescence
Encyclopedia of Analytical Chemistry, Online © 2006–2013 John Wiley & Sons, Ltd.This article is © 2013 John Wiley & Sons, Ltd.This article was published in the Encyclopedia of Analytical Chemistry in 2013 by John Wiley & Sons, Ltd.DOI: 10.1002/9780470027318.a9326

HIGH-RESOLUTION 4D IMAGING IN LIVE CELLS 13
dimmed on calcium binding; and ‘ratiometric-pericam,’that changed the excitation wavelength in accordancewith the surrounding calcium concentration.(79) G-CaMPwas later improved by introducing mutations in thecp-EGFP part as to increase the stability, brightness,and SNR, through G-CaMP1.6(80) and G-CaMP2.(9,81,82)
Recently, red-shifted G-CaMP3 was demonstrated in invivo imaging of neural circuits in various organisms.(83)
4.2 RedOx-Sensitive GFP
Another role for GFP derivatives as indicators is in vivosensors of redox conditions. The cell maintains highlyregulated homeostasis of redox state, which is delicatelycontrolled in different intracellular compartments. Thecytoplasm is considered a reducing environment, andrarely can disulfide bridges be found. The endoplasmicreticulum, on the other hand, is highly oxidizing, owingto its necessity in proper protein folding and functionof proteins destined to be secreted. Subtle changes inthe redox conditions mediate many cellular physiologicalresponses, such as growth regulation, gene expression,metabolism, apoptosis, aging, and many more. Oxygenradicals cause protein damage and carbonylation,(84)
leading to protein dysfunction and aggregation. Hence,an accurate reflection of the redox state of cellularcompartments and subcompartments is highly usefulfor assessing health and viability. By substituting twosurface-exposed residues with cysteines able to forma disulfide bond, the mutant roGFP (RedOx-sensitiveGFP) alters its excitation wavelength according tothe reducing/oxidizing environment. On oxidation, thechromophore increases its protonation state, and theexcitation maxima is shifted from ∼490 to ∼400 nm.(85)
It is important to note that the redox-reactive groupschange the fluorophore properties in a ratiometricmanner that is not influenced by the probe concentration,the illumination stability, excitation light path, andother distorting factors. Another major advantage overprevious chemical indicators is that roGFP is geneticallyencoded, making it amenable to molecular engineeringand targeting specific organelles according to thebiological question in hand.(86) For extensive review ofavailable roGFPs and their variants, as well as theirmolecular properties we refer the reader to Ref. 87.It is also extremely rapid and very sensitive. With adual color imaging system (two PMTs for example)the ratiometric view can be acquired in real time,enabling high temporal resolution of redox changes inthe cell. roGFP was used extensively to measure theoxidative state in several intracellular compartmentsunder different conditions, such as the mitochondria andthe ER.
Other similar reporters based on GFP have also beenused to measure pH,(88) ER stress,(89) and apoptoticsignaling(90) in the cell. Recently, an archaerhodopsinmutant was developed for real-time voltage sensingin live cells.(91) Its submillisecond response time andfar-red emission spectrum hold a lot of potential for real-time visualization of action potentials in subneuronaldistances, and for visualizing voltage changes in othervoltage-sensitive cells. Another study devised a subtlestrategy for measuring protein stability in cells byexploiting the different maturation times of EGFP andmCherry.(92) Finally, it is now possible to track individualmRNAs in live cells, by inserting a protein-bindingloop.(93)
4.3 Folding Sensors
Proper protein folding is essential to all living thingsand functional proteins. Hence, the ability to assay thefolding state of the cell, globally or locally, is importantfor any assessment of the cell’s biology. A number ofreporters have been generated, mostly exploiting the factthat marginally stable proteins, such as thermosensitive(ts) mutants and thermosensitive luciferase, have a lowerthreshold for misfolding than normal natively foldedproteins. Therefore, when the protein folding homeostasis(or proteostasis) of the cell is perturbed, ts mutantsand luciferase misfold first, lose solubility, and can bedetected in aggregates of proteins in the cell. Proteostasissensors have been successfully utilized in a variety ofmodel systems including yeast,(8) C. elegans,(94) andmammalian cells.(95) These reporters (including Ubc9ts,Rasts, Myots, and LUC) can only report on the globalstate of proteostasis in the cell, as their aggregation isa secondary effect of a global decline. Very recently,an exciting study generated local real-time reporters ofmisfolding, but making a GFP–mCherry FRET pair on ats protein, PGK.(96) Since the donor and acceptor were onthe N- and C-termini of the protein, respectively, and asthe N- and C termini were relatively close together in thefolded state, there was FRET whenever the protein wasfolded. The authors of the study were able to visualizelocal fluctuations in the folding state of PGKts –FRET pairby looking for localized loss of FRET, which resulted fromfluctuations in the structure causing temporary unfolding.
5 FUTURE RESEARCH IN LIVE-CELLIMAGING
5.1 Optogenetics
The reporters outlined have tremendous potential whencombined with 4D imaging approaches. New reporters of
Encyclopedia of Analytical Chemistry, Online © 2006–2013 John Wiley & Sons, Ltd.This article is © 2013 John Wiley & Sons, Ltd.This article was published in the Encyclopedia of Analytical Chemistry in 2013 by John Wiley & Sons, Ltd.DOI: 10.1002/9780470027318.a9326

14 NUCLEIC ACIDS STRUCTURE AND MAPPING
z
z
z
Fig
ure
34D
conf
ocal
imag
ing
ofa
live
spec
imen
incl
udes
acqu
isit
ion
ofvi
rtua
lst
acks
over
z-a
xis
and
over
tim
e.T
hez-a
xis
isob
tain
edby
usin
ga
piez
oele
ctri
cst
age
that
chan
ges
the
spec
imen
’sre
lati
vedi
stan
ceve
ryra
pidl
y,so
that
the
fluor
esce
ntpr
otei
n‘s
loca
lizat
ion
ata
give
nm
omen
tcan
bede
term
ined
inhi
ghre
solu
tion
.R
epet
itio
nof
this
proc
ess
over
tim
eal
low
sfo
rtr
acki
ngof
the
prot
ein‘
sm
ovem
ent
thro
ugho
utth
ece
llor
the
spec
ific
orga
nelle
.Thi
ste
chni
que
also
ensu
res
that
the
enti
rece
llula
rpo
pula
tion
ofth
epr
otei
nbe
ing
trac
ked
isvi
sibl
e.C
ombi
ning
the
data
and
rend
erin
gth
eim
ages
enab
leth
evi
sual
izat
ion
ofpr
oces
ses
that
may
beob
scur
edfr
omvi
ewin
conv
enti
onal
2Dti
me
laps
e.F
orex
ampl
e,vi
sual
izin
gth
etw
ono
velq
ualit
yco
ntro
lcom
part
men
tssh
own
inth
efig
ure
isgr
eatl
yfa
cilit
ated
by4D
imag
ing.
The
JUN
Q(j
uxta
-nuc
lear
qual
ity
cont
rolc
ompa
rtm
ent)
isth
ece
llula
rqu
alit
yco
ntro
lcen
ter
whe
reso
lubl
eag
greg
ates
from
the
cyto
sola
ccum
ulat
efo
rpr
otea
som
alde
grad
atio
n.T
heIP
OD
(ins
olub
lepr
otei
nde
posi
t),w
hich
isad
jace
ntto
the
vacu
ole,
sequ
este
rsha
rmfu
lagg
rega
tes
and
amyl
oids
from
the
rest
ofth
ecy
toso
l,th
ereb
yse
rvin
ga
prot
ecti
vefu
ncti
on.T
his
dist
inct
com
part
men
taliz
atio
nis
aph
enom
enon
wel
lcon
serv
edam
ong
euka
ryot
esan
dha
sm
ajor
impl
icat
ions
inm
any
prot
ein-
aggr
egat
ion-
rela
ted
dise
ases
.Ow
ing
toth
esp
heri
caln
atur
eof
yeas
t,an
dth
etr
ansi
ent
natu
reof
cert
ain
mis
fold
edpr
otei
nsan
dag
greg
ates
,4D
imag
ing
ises
sent
ialf
orvi
sual
izin
gth
eJU
NQ
,nuc
leus
,IP
OD
,and
vacu
ole,
whi
chm
ayal
lbe
insl
ight
lydi
ffer
entf
ocal
plan
es.
Encyclopedia of Analytical Chemistry, Online © 2006–2013 John Wiley & Sons, Ltd.This article is © 2013 John Wiley & Sons, Ltd.This article was published in the Encyclopedia of Analytical Chemistry in 2013 by John Wiley & Sons, Ltd.DOI: 10.1002/9780470027318.a9326
HIGH-RESOLUTION 4D IMAGING IN LIVE CELLS 15
protein interaction and function are coming online everyyear. When combined with additional novel techniquesfor modulating cellular function, they offer insight intosome of the most elusive biological processes. Forexample, G-CaMP and Arch imaging can be combinedwith the new method of optogenetics, or the abilityto selectively activate or repress an action potentialin a neuron by laser stimulation. Developed recentlyby Zhang and colleagues,(97) optogenetic channels(Channelrhodopsin, Archaerhodopsin, and others) haveevolved to offer exquisite live-cell and live-animal controlof neuronal activation and function. Optogenetic channelsare light-sensitive and can be activated in a specific neuronor on a specific subneuronal location, by a laser pulse.They have been utilized in nearly every model systemand in cell culture. Calcium sensors and voltage sensorscan then be used, post activation, to visualize the actionpotential and signal propagation. These tools can nowbe combined with other reporters of protein function,cellular stress, and protein interaction. This is just oneexample of many emerging tools that will allow us tobridge the scale gap from the single protein to the entirecell and organism.
5.2 Subcellular Protein Atlas
Current imaging techniques have created an opportunityto peer into the subcellular level and attempts have
been made to map out the architecture of the cell inunprecedented detail.(98) Systematic, large-scale studiesof protein localizations have been carried out and theirresults are accessible in several databases (LocDB,(99)
LOCATE,(100) and HPRD(101)). However, most ofthese studies involved fixation or fractionation of thecells, mostly with immunofluorescence methods. High-throughput imaging of full-genome fluorescent proteinsin live cells have so far been done only in yeast(102,103)
and in the nematode C. elegans,(104) and at relatively lowresolution. Recently, some proteins in live human cellswere systematically localized by labeling with YFP usinga sophisticated transfection method, with the added valueof the proteins dynamics characterization with time-lapsemovies.(105) In the future, similar libraries assembled with4D imaging will provide further insights into each proteinfunction and dynamics.
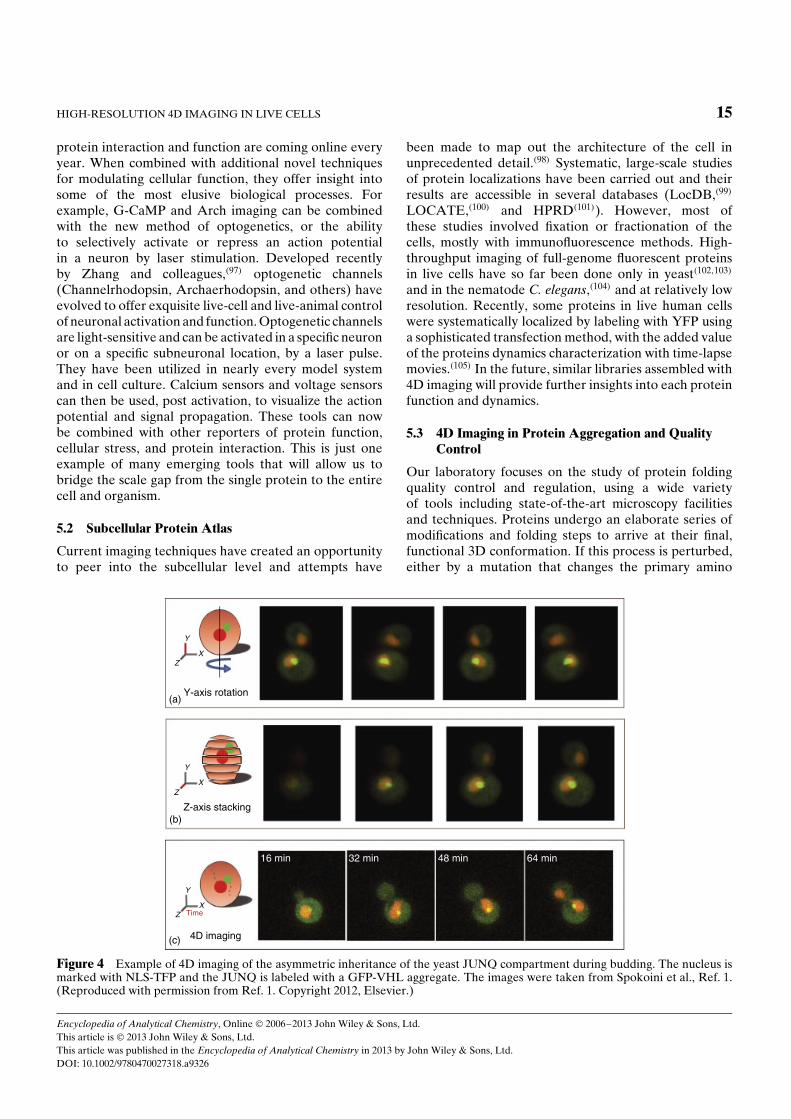
5.3 4D Imaging in Protein Aggregation and QualityControl
Our laboratory focuses on the study of protein foldingquality control and regulation, using a wide varietyof tools including state-of-the-art microscopy facilitiesand techniques. Proteins undergo an elaborate series ofmodifications and folding steps to arrive at their final,functional 3D conformation. If this process is perturbed,either by a mutation that changes the primary amino
Time
X
Y
Z
Y-axis rotation
X
Y
Z
Z-axis stacking
X
Y
Z
4D imaging
16 min 32 min 48 min 64 min
(a)
(b)
(c)
Figure 4 Example of 4D imaging of the asymmetric inheritance of the yeast JUNQ compartment during budding. The nucleus ismarked with NLS-TFP and the JUNQ is labeled with a GFP-VHL aggregate. The images were taken from Spokoini et al., Ref. 1.(Reproduced with permission from Ref. 1. Copyright 2012, Elsevier.)
Encyclopedia of Analytical Chemistry, Online © 2006–2013 John Wiley & Sons, Ltd.This article is © 2013 John Wiley & Sons, Ltd.This article was published in the Encyclopedia of Analytical Chemistry in 2013 by John Wiley & Sons, Ltd.DOI: 10.1002/9780470027318.a9326
16 NUCLEIC ACIDS STRUCTURE AND MAPPING
acids sequence or by an environmental shift from thenatural conditions that allow the folding, then qualitycontrol systems kick in to maintain cellular viability. Themisfolded protein may undergo any of the followingpathways: aggregation, degradation, sequestration inprotective inclusions, and extensive interactions withfolding chaperones. Understanding more of the cellularstruggle with misfolded proteins will help shed lighton many pathologies related to protein aggregates,mainly neurodegenerative diseases (e.g. Alzheimer’s,Parkinson’s, Huntington’s). Tracing a protein populationas it undergoes spatial organization and distributionover time according to its folding state and the qualitycontrol machinery is one such method to learn more(Figure 3). With some of the methods presented earlier,including confocal and super-resolution microscopy, wehave been able to observe an asymmetric inheritancephenomenon that characterizes stress foci formed bymisfolded proteins in the yeast cell in great detail(Figure 4).(1) This is a regulated process that activelyensures misfolded, harmful proteins are retained in themother cell and are not passed on to the next generation.This study helps clarify the importance of aggregationcompartmentalization in eukaryotic cells, and with furtheradvancement in resolution and microscopy applications,may help understand more about protein dynamics inhealth and disease.
ABBREVIATIONS AND ACRONYMS
BiFC Bimolecular FluorescenceComplementation
CCD Charge-Coupled DeviceFLIP Fluorescence Loss in PhotobleachingFCS Fluorescence Correlation SpectroscopyFLIM Fluorescence Lifetime ImagingFRAP Fluorescence Recovery after
PhotobleachingFRET Forster Resonance Energy TransferPhAc PhotoactivationPMT PhotomultiplierPSF Point-Spread functionSIM Structured Illumination MicroscopeSTED Stimulated Emission Depletion
RELATED ARTICLES
Biomedical Spectroscopy (Volume 1)Fluorescence Imaging
Electronic Absorption and Luminescence (Volume 12)Fluorescence Imaging Microscopy
Amyloids and Protein Aggregation – Analytical Methods
Protein Dynamics
REFERENCES
1. R. Spokoini, O. Moldavski, Y. Nahmias, J.L. England,M. Schuldiner, Kaganovich D., ‘Confinement toOrganelle-Associated Inclusion Structures MediatesAsymmetric Inheritance of Aggregated Protein inBudding Yeast’, Cell Rep., 2, 738–747 (2012).
2. J. Lippincott-Schwartz, ‘Imaging: Visualizing thePossibilities’, J. Cell Sci., 123, 3619–3620 (2010).
3. K. Yaniv, S. Isogai, D. Castranova, L. Dye, J. Hitomi,B.M. Weinstein, ‘Live Imaging of LymphaticDevelopment in the Zebrafish’, Nat. Med., 12, 711–716(2006).
4. N. Rimon, M. Schuldiner, ‘Getting the Whole Picture:Combining Throughput with Content in Microscopy’, J.Cell Sci., 124, 3743–3751 (2011).
5. R.Y. Tsien, ‘The Green Fluorescent Protein’, Annu. Rev.Biochem., 67, 509–544 (1998).
6. N.C. Shaner, M.Z. Lin, M.R. McKeown, P.A. Steinbach,K.L. Hazelwood, M.W. Davidson, R.Y. Tsien, ‘Improv-ing the Photostability of Bright Monomeric Orange andRed Fluorescent Proteins’, Nat. Methods, 5, 545–551(2008).
7. S.J. Weisberg, R. Lyakhovetsky, A.C. Werdiger, A.D.Gitler, Y. Soen, D. Kaganovich, ‘Compartmentalization
of Superoxide Dismutase 1 (SOD1G93A) AggregatesDetermines Their Toxicity’, Proc. Natl. Acad. Sci. U.S.A.,109, 15811–15816 (2012).
8. D. Kaganovich, R. Kopito, J. Frydman, ‘MisfoldedProteins Partition Between Two Distinct Quality ControlCompartments’, Nature, 454, 1088 (2008).
9. R.L. Strack, R.J. Keenan, B.S. Glick, ‘NoncytotoxicDsRed Derivatives for Whole-Cell Labeling’, MethodsMol. Biol., 699, 355–370 (2011).
10. J. Zhang, R.E. Campbell, A.Y. Ting, R.Y. Tsien,‘Creating New Fluorescent Probes for Cell Biology’, Nat.Rev. Mol. Cell Biol., 3, 906–918 (2002).
11. G.S. Filonov, K.D. Piatkevich, L.-M. Ting, J. Zhang,K. Kim, V.V. Verkhusha, ‘Bright and Stable Near-infrared Fluorescent Protein for In Vivo Imaging’, Nat.Biotechnol., 29(8), 757–761 (2011). doi: 10.1038/nbt.1918.
12. G.S. Filonov, A. Krumholz, J. Xia, J. Yao, L.V. Wang,V.V. Verkhusha, ‘Deep-tissue Photoacoustic Tomog-raphy of a Genetically Encoded Near-infraredFluorescent Probe’, Angew. Chem. (Internationaledition in English), 51(6), 1448–1451 (2012). doi:10.1002/anie.201107026.
Encyclopedia of Analytical Chemistry, Online © 2006–2013 John Wiley & Sons, Ltd.This article is © 2013 John Wiley & Sons, Ltd.This article was published in the Encyclopedia of Analytical Chemistry in 2013 by John Wiley & Sons, Ltd.DOI: 10.1002/9780470027318.a9326

HIGH-RESOLUTION 4D IMAGING IN LIVE CELLS 17
13. B.A. Griffin, S.R. Adams, R.Y. Tsien, ‘Specific CovalentLabeling of Recombinant Protein Molecules Inside LiveCells’, Science, 281, 269–272 (1998).
14. B.R. Martin, B.N. Giepmans, S.R. Adams, R.Y. Tsien,‘Mammalian Cell-based Optimization of the Biarsenical-binding Tetracysteine Motif for Improved Fluorescenceand Affinity’, Nat. Biotechnol., 23, 1308–1314 (2005).
15. T. Machleidt, M. Robers, G.T. Hanson, ‘Protein Labelingwith FlAsH and ReAsH’, Methods Mol. Biol. (Clifton,NJ), 356, 209–220 (2007).
16. Z. Ignatova, L.M. Gierasch, ‘Monitoring Protein Stabilityand Aggregation InVivo by Real-time FluorescentLabeling’, Proc. Natl. Acad. Sci. U.S.A., 101, 523–528(2004).
17. G. Gaietta, T.J. Deerinck, S.R. Adams, J. Bouwer,O. Tour, D.W. Laird, G.E. Sosinsky, R.Y. Tsien, M.H.Ellisman, ‘Multicolor and Electron Microscopic Imagingof Connexin Trafficking’, Science, 296, 503–507 (2002).
18. C. Uttamapinant, K.A. White, H. Baruah, S. Thompson,M. Fernandez-Suarez, S. Puthenveetil, A.Y. Ting, ‘AFluorophore Ligase for Site-specific Protein LabelingInside Living Cells’, Proc. Natl. Acad. Sci. U.S.A., 107,10914–10919 (2010).
19. M.E. Dailey, E. Manders, D.R. Soll, M. Terasaki.‘’Confocal Microscopy of Living Cells’’, in Handbookof Biological Confocal Microscopy, 3rd edition, ed. J.B.Pawley, Plenum, New York, 2006.
20. S.L. Fleming, C.L. Rieder, ‘Flattening Drosophila Cellsfor High-resolution Light Microscopic Studies of MitosisIn Vitro’, Cell Motil. Cytoskel., 56, 141–146 (2003).
21. P. Rosa, S. Tenreiro, V. Chu, T.F. Outeiro, J.P. Conde,‘High-throughput Study of Alpha-synuclein Expressionin Yeast Using Microfluidics for Control of Local CellularMicroenvironment’, Biomicrofluidics, 6, 14109–141099(2012).
22. N. Chronis, M. Zimmer, C.I. Bargmann, ‘Microfluidicsfor In Vitro Imaging of Neuronal and Behavioral Activityin Caenorhabditis Elegans’, Nat. Methods, 4, 727–731(2007).
23. J.W. Lichtman, J.A. Conchello, ‘Fluorescence Microscopy’, Nat. Methods, 2, 910–919 (2005).
24. D.J. Stephens, V.J. Allan, ‘Light Microscopy Techniquesfor Live Cell Imaging’, Science, 300, 82–86 (2003).
25. T. Wilson, ‘Spinning-disk Microscopy Systems’, ColdSpring Harb. Protoc., 2010, 1208–1213 (2010).
26. R. Yuste, ‘Fluorescence Microscopy Today’, Nat.Methods, 2, 902–904 (2005).
27. K.G. Heinze, S. Costantino, P. De Koninck, P.W.Wiseman, ‘Beyond Photobleaching, Laser IlluminationUnbinds Fluorescent Proteins’, J. Phys. Chem., B, 113,5225–5233 (2009).
28. C. Fink, F. Morgan, L.M. Loew, ‘Intracellular Fluores-cent Probe Concentrations by Confocal Microscopy’,Biophys. J., 75, 1648–1658 (1998).
29. G. Ball, R.M. Parton, R.S. Hamilton, I. Davis, ‘A CellBiologist’s Guide to High Resolution Imaging’, MethodsEnzymol., 504, 29–55 (2012).
30. T.Y. Saito, E. Bernardini, D. Bose, M.V. Fonseca,E. Lorenz, K. Mannheim, R. Mirzoyan, R. Orito,T. Schweizer, M. Shayduk, M. Teshima, ‘Very High QEHPDs with a GaAsP Photocathode for the MAGICTelescope Project’, Nucl. Instrum. Methods Phys. Res.,Sect. A, 610, 258–261 (2009).
31. J.A. Conchello, J.W. Lichtman, ‘Optical SectioningMicroscopy’, Nat. Methods, 2, 920–931 (2005).
32. T. Zimmermann, J. Rietdorf, R. Pepperkok, ‘SpectralImaging and Its Applications in Live Cell Microscopy’,FEBS Lett., 546, 87–92 (2003).
33. Y. Garini, I.T. Young, G. McNamara, ‘Spectral Imaging:Principles and Applications’, Cytometry A, 69, 735–747(2006).
34. D.W. Piston, ‘Choosing Objective Lenses: TheImportance of Numerical Aperture and Magnification inDigital Optical Microscopy’, Biol. Bull., 195, 1–4 (1998).
35. M. Abramowitz, K.R. Spring, H.E. Keller, M.W.Davidson, ‘Basic principles of Microscope Objectives’,
Biotechniques, 33, 772–774, 776–778, 780–771 (2002).
36. G. Sluder, J.J. Nordberg, ‘Microscope Basics’, MethodsCell Biol., 72, 1–10 (2003).
37. M.G. Gustafsson, L. Shao, P.M. Carlton, C.J. Wang,I.N. Golubovskaya, W.Z. Cande, D.A. Agard, J.W.Sedat, ‘Three-dimensional Resolution Doubling inWide-field Fluorescence Microscopy by StructuredIllumination’, Biophys. J., 94, 4957–4970 (2008).
38. L. Shao, P. Kner, E.H. Rego, M.G.L. Gustafsson, ‘Super-resolution 3D Microscopy of Live Whole Cells UsingStructured Illumination’, Nat. Methods, 8,, (2011).
39. P. Kner, B.B. Chhun, E.R. Griffis, L. Winoto, M.G.Gustafsson, ‘Super-resolution Video Microscopy of Live
Cells by Structured Illumination’, Nat. Methods, 6,339–342 (2009).
40. A. Punge, S.O. Rizzoli, R. Jahn, J.D. Wildanger,L. Meyer, A. Schonle, L. Kastrup, S.W. Hell, ‘3D Recons-truction of High-resolution STED Microscope Images’,Microsc. Res. Tech., 71(9), 644–650 (2008). doi:10.1002/jemt.20602.
41. L. Schermelleh, R. Heintzmann, H. Leonhardt, ‘A Guideto Super-resolution Fluorescence Microscopy’, J. CellBiol., 190, 165–175 (2010).
42. G.H. Patterson, E. Betzig, J. Lippincott-Schwartz, H.F.Hess, ’Developing Photoactivated Localization Micro
scopy (PALM)’, 4th IEEE International Symposium on
Encyclopedia of Analytical Chemistry, Online © 2006–2013 John Wiley & Sons, Ltd.This article is © 2013 John Wiley & Sons, Ltd.This article was published in the Encyclopedia of Analytical Chemistry in 2013 by John Wiley & Sons, Ltd.DOI: 10.1002/9780470027318.a9326

18 NUCLEIC ACIDS STRUCTURE AND MAPPING
Biomedical Imaging From Nano to Macro, Washington,DC, USA 940–943, 2007.
43. I. Davis, ‘The ‘‘Super-resolution’’ Revolution’, Biochem.Soc. Trans., 37, 1042–1044 (2009).
44. M. Fernandez-Suarez, A.Y. Ting, ‘Fluorescent Probes forSuper-resolution Imaging in Living Cells’, Nat. Rev. Mol.Cell Biol., 9, 929–943 (2008).
45. C.G. Galbraith, J.A. Galbraith, ‘Super-resolutionMicroscopy at a Glance’, J. Cell Sci., 124, 1607–1611(2011).
46. B. Huang, M. Bates, X. Zhuang, ‘Super-resolutionFluorescence Microscopy’, Annu. Rev. Biochem., 78,993–1016 (2009).
47. J. Lippincott-Schwartz, S. Manley, ‘Putting Super-resolution Fluorescence Microscopy to Work’, Nat.Methods, 6, 21–23 (2009).
48. E.A. Jares-Erijman, T.M. Jovin, ‘FRET Imaging’, Nat.Biotechnol., 21, 1387–1395 (2003).
49. R.B. Sekar, A. Periasamy, ‘Fluorescence ResonanceEnergy Transfer (FRET) Microscopy Imaging of LiveCell Protein Localizations’, J. Cell Biol., 160, 629–633(2003).
50. P.E. Morton, M. Parsons, ‘Measuring FRET Using Time-resolved FLIM’, Methods Mol. Biol., 769, 403–413 (2011).
51. Y. Chen, J.D. Mills, A. Periasamy, ‘Protein Localizationin Living Cells and Tissues Using FRET and FLIM’,Differentiation, 71, 528–541 (2003).
52. S.J. Holden, S. Uphoff, J. Hohlbein, D. Yadin, L. LeReste, O.J. Britton, A.N. Kapanidis, ‘Defining theLimits of Single-molecule FRET Resolution in TIRFMicroscopy’, Biophys. J., 99, 3102–3111 (2010).
53. E.L. Elson, ‘Fluorescence Correlation Spectroscopy:Past, Present, Future’, Biophys. J., 101, 2855–2870 (2011).
54. E. Haustein, P. Schwille, ‘Fluorescence CorrelationSpectroscopy: Novel Variations of An EstablishedTechnique’, Annu. Rev. Biophys. Biomol. Struct., 36,151–169 (2007).
55. J.A. Fitzpatrick, B.F. Lillemeier, ‘Fluorescence Corre-lation Spectroscopy: Linking Molecular Dynamics toBiological Function In Vitro and InSitu’, Curr. Opin.Struct. Biol., 21, 650–660 (2011).
56. J. Capoulade, M. Wachsmuth, L. Hufnagel, M. Knop,‘Quantitative Fluorescence Imaging of Protein Diffusionand Interaction in Living Cells’, Nat. Biotechnol., 29,835–839 (2011).
57. M. Gosch, R. Rigler, ‘Fluorescence Correlation Spec-troscopy of Molecular Motions and Kinetics’, Adv. DrugDelivery Rev., 57, 169–190 (2005).
58. M.Y. Berezin, S. Achilefu, ‘Fluorescence LifetimeMeasurements and Biological Imaging’, Chem. Rev., 110,2641–2684 (2010).
59. F. Festy, S.M. Ameer-Beg, T. Ng, K. Suhling, ‘ImagingProteins In Vitro Using Fluorescence Lifetime Microscopy’, Mol. Biosyst., 3, 381–391 (2007).
60. E.A.J. Reits, J.J. Neefjes, ‘From Fixed to FRAP:Measuring Protein Mobility and Activity in Living Cells’,Nat. Cell Biol., 3, E145–E147 (2001).
61. M. Edidin, Y. Zagyansky, T.J. Lardner, ‘Measurement ofMembrane Protein Lateral Diffusion in Single Cells’,Science, 191, 466–468 (1976).
62. R.D. Phair, T. Misteli, ‘High Mobility of Proteins in theMammalian Cell Nucleus’, Nature, 404, 604–609 (2000).
63. M. Nissim-Rafinia, E. Meshorer, ‘Photobleaching Assays(FRAP & FLIP) to Measure Chromatin ProteinDynamics in Living Embryonic Stem Cells’, J. Visual.Exp.: JoVE, 52, (2011).
64. M. Kang, C.A. Day, K. Drake, A.K. Kenworthy, E.DiBenedetto, ‘A Generalization of Theory for Two-dimensional Fluorescence Recovery After Photo-bleaching Applicable to Confocal Laser Scanning Micro-scopes’, Biophys. J., 97, 1501–1511 (2009).
65. J.L. England, D. Kaganovich, ‘Polyglutamine Shows aUrea-like Affinity for Unfolded Cytosolic Protein’, FEBSLett., 585, 381–384 (2011).
66. H.C. Ishikawa-Ankerhold, R. Ankerhold, G.P.Drummen, ‘Advanced Fluorescence Microscopy
Techniques-FRAP, FLIP, FLAP, FRET and FLIM’,Molecules, 17, 4047–4132 (2012).
67. N.G. Gurskaya, V.V. Verkhusha, A.S. Shcheglov, D.B.Staroverov, T.V. Chepurnykh, A.F. Fradkov,S. Lukyanov, K.A. Lukyanov, ‘Engineering of aMonomeric Green-to-red Photoactivatable FluorescentProtein Induced by Blue Light’, Nat. Biotechnol., 24(4),461–465 (2006). doi: 10.1038/nbt1191.3.
68. D.M. Chudakov, S.Lukyanov, K.A. Lukyanov, ‘UsingPhotoactivatable Fluorescent Protein Dendra2 to TrackProtein Movement’, BioTechniques, 42(5), 553–563,(2007).
69. O.M. Subach, G.H. Patterson, L.-M. Ting, Y. Wang,J.S. Condeelis, V.V. Verkhusha, ‘A Photoswitch-able Orange-to-far-red Fluorescent Protein, PSmOr-ange’, Nat. Methods, 8(9), 771–777 (2011). doi:10.1038/nmeth.1664.
70. O.M. Subach, D. Entenberg, J.S. Condeelis, V.V.Verkhusha, ‘A FRET-Facilitated Photoswitching Usingan Orange Fluorescent Protein with the FastPhotoconversion Kinetics’, J. Am. Chem. Soc., 134(36),14789–14799 (2012). doi: 10.1021/ja3034137.
71. T. Brakemann, A.C. Stiel, G. Weber, M. Andresen,I. Testa, T. Grotjohann, M. Leutenegger, U. Plessmann,H. Urlaub, C. Eggeling, M.C. Wahl, S.W. Hell, S. Jakobs,‘A Reversibly Photoswitchable GFP-like Protein withFluorescence Excitation Decoupled from Switching’, Nat.Biotechnol., 29, 942–947 (2011).
Encyclopedia of Analytical Chemistry, Online © 2006–2013 John Wiley & Sons, Ltd.This article is © 2013 John Wiley & Sons, Ltd.This article was published in the Encyclopedia of Analytical Chemistry in 2013 by John Wiley & Sons, Ltd.DOI: 10.1002/9780470027318.a9326

HIGH-RESOLUTION 4D IMAGING IN LIVE CELLS 19
72. S.A. Goncalves, J.E. Matos, T.F. Outeiro, ‘Zooming IntoProtein Oligomerization in Neurodegeneration UsingBiFC’, Trends Biochem. Sci., 35, 643–651 (2010).
73. Y. Kodama, C.-D. Hu, ‘An Improved BimolecularFluorescence Complementation Assay with a HighSignal-to-noise Ratio’, BioTechniques, 49, 793–805(2010).
74. A. Miyawaki, J. Llopis, R. Heim, J.M. Mccaffery,J.A. Adams, M. Ikurak, R.Y. Tsien, ‘FluorescentIndicators for Ca2+ Based on Green Fluorescent Proteinsand Calmodulin’, Nature, 388, 882–887 (1997).
75. A. Persechini, J. Lynch, V. Romoser, ‘Novel FluorescentIndicator Proteins for Monitoring Free IntracellularCa2+’, Cell Calcium, 22, 209–216 (1997).
76. K. Truong, A. Sawano, H. Mizuno, H. Hama, K.I. Tong,T.K. Mal, A. Miyawaki, M. Ikura, ‘FRET-based In VitroCa2+ Imaging by a New Calmodulin-GFP FusionMolecule’, Nat. Struct. Biol., 8, 1069–1073 (2001).
77. G.S. Baird, D.A. Zacharias, R.Y. Tsien, ‘CircularPermutation and Receptor Insertion within GreenFluorescent Proteins’, Proc. Natl. Acad. Sci. U.S.A., 96,11241–11246 (1999).
78. J. Nakai, M. Ohkura, K. Imoto, ‘A High Signal-to-noiseCa(2+) Probe Composed of a Single Green FluorescentProtein’, Nat. Biotechnol., 19, 137–141 (2001).
79. T. Nagai, A. Sawano, E.S. Park, A. Miyawaki, ‘CircularlyPermuted Green Fluorescent Proteins Engineered toSense Ca2+’, PNAS, 98, 3197–3202 (2001).
80. M. Ohkura, M. Matsuzaki, H. Kasai, K. Imoto, J. Nakai,‘Genetically Encoded Bright Ca2+ Probe Applicablefor Dynamic Ca2+ Imaging of Dendritic Spines’, Anal.Chem., 77, 5861–5869 (2005).
81. Y.N. Tallini, M. Ohkura, B.R. Choi, G. Ji, K. Imoto,R. Doran, J. Lee, P. Plan, J. Wilson, H.B. Xin, A. Sanbe,J. Gulick, J. Mathai, J. Robbins, G. Salama, J. Nakai,M.I. Kotlikoff, ‘Imaging Cellular Signals in the HeartIn Vitro : Cardiac Expression of the High-signal Ca2+Indicator GCaMP2’, Proc. Natl. Acad. Sci. U.S.A., 103,4753–4758 (2006).
82. J. Akerboom, J.D.V. Rivera, M.M.R. Guilbe, E.C.A.Malave, H.H. Hernandez, L. Tian, S.A. Hires, J.S.Marvin, L.L. Looger, E.R. Schreiter, ‘Crystal Structuresof the GCaMP Calcium Sensor Reveal the Mechanism ofFluorescence Signal Change and Aid Rational Design’, J.Biol. Chem., 284, 6455–6464 (2009).
83. L. Tian, S.A. Hires, T. Mao, D. Huber, M.E. Chiappe,S.H. Chalasani, L. Petreanu, J. Akerboom, S.A.McKinney, E.R. Schreiter, C.I. Bargmann, V. Jayaraman,K. Svoboda, L.L. Looger, ‘imaging Neural Activity inWorms, Flies and Mice with Improved GcamP CalciumIndicators’, Nat. Methods, 6, 875–881 (2009).
84. H. Aguilaniu, L. Gustafsson, M. Rigoulet, T. Nystrom,‘Asymmetric Inheritance of Oxidatively Damaged
Proteins During Cytokinesis’, Science, 299, 1751–1753(2003).
85. G.T. Hanson, R. Aggeler, D. Oglesbee, M. Cannon,Ra. Capaldi, R.Y. Tsien, S.J. Remington, ‘InvestigatingMitochondrial Redox Potential with Redox-sensitiveGreen Fluorescent Protein Indicators’, J. Biol. Chem.,279, 13044–13053 (2004).
86. C.T. Dooley, T.M. Dore, G.T. Hanson, W.C. Jackson,S.J. Remington, R.Y. Tsien, ‘Imaging Dynamic RedoxChanges in Mammalian Cells with Green FluorescentProtein Indicators’, J. Biol. Chem., 279, 22284–22293(2004).
87. A.J. Meyer, T.P. Dick, ‘Fluorescent Protein-based RedoxProbes’, Antioxid. Redox Signal., 13, 621–650 (2010).
88. V.V. Belousov, A.F. Fradkov, K.A. Lukyanov, D.B.Staroverov, K.S. Shakhbazov, A.V. Terskikh,
S. Lukyanov, ‘Genetically Encoded Fluorescent Indicatorfor Intracellular Hydrogen Peroxide’, Nat. Methods, 3,281–286 (2006).
89. K. Yoshiuchi, H. Kaneto, T.A. Matsuoka, K. Kohno,T. Iwawaki, Y. Nakatani, Y. Yamasaki, M. Hori, M.Matsuhisa, ‘Direct Monitoring of In Vitro ER Stress
During the Development of Insulin Resistance with ERStress-activated Indicator Transgenic Mice’, Biochem.Biophys. Res. Commun., 366, 545–550 (2008).
90. N. Yivgi-Ohana, M. Eifer, Y. Addadi, M. Neeman,A. Gross, ‘Utilizing Mitochondrial Events as Biomarkersfor Imaging Apoptosis’, Cell Death Dis., 2, e166–e166(2011).
91. J.M. Kralj, A.D. Douglass, D.R. Hochbaum,D. Maclaurin, A.E. Cohen, ‘Optical Recording of ActionPotentials in Mammalian Neurons Using a MicrobialRhodopsin’, Nat. Methods, 9, 90–95 (2012).
92. A. Khmelinskii, P.J. Keller, A. Bartosik, M. Meurer,J.D. Barry, B.R. Mardin, A. Kaufmann, S. Trautmann,M. Wachsmuth, G. Pereira, W. Huber, E. Schiebel,M. Knop, ‘Tandem Fluorescent Protein Timers for InVitro Analysis of Protein Dynamics’, Nat. Biotechnol.,85, 708–714 (2012).
93. L. Haim-Vilmovsky, N. Gadir, R.H. Herbst, J.E. Gerst,‘A Genomic Integration Method for the SimultaneousVisualization of Endogenous mRNAs and theirTranslation Products in Living Yeast’, RNA, 17,2249–2255 (2011).
94. A. Ben-Zvi, E.A. Miller, R.I. Morimoto, ‘Collapse ofProteostasis Represents an Early Molecular Event inCaenorhabditis Elegans Aging’, Proc. Natl. Acad. Sci.U.S.A., 106, 14914–14919 (2009).
95. J. Hageman, M.J. Vos, M.A. van Waarde, H.H.Kampinga, ‘Comparison of Intra-organellar ChaperoneCapacity for Dealing with Stress-induced ProteinUnfolding’, J. Biol. Chem., 282, 34334–34345 (2007).
Encyclopedia of Analytical Chemistry, Online © 2006–2013 John Wiley & Sons, Ltd.This article is © 2013 John Wiley & Sons, Ltd.This article was published in the Encyclopedia of Analytical Chemistry in 2013 by John Wiley & Sons, Ltd.DOI: 10.1002/9780470027318.a9326

20 NUCLEIC ACIDS STRUCTURE AND MAPPING
96. S. Ebbinghaus, A. Dhar, J.D. McDonald, M. Gruebele,‘Protein Folding Stability and Dynamics Imaged in aLiving Cell’, Nat. Methods, 7, 319–323 (2010).
97. F. Zhang, L.P. Wang, E.S. Boyden, K. Deisseroth,‘Channelrhodopsin-2 and Optical Control of ExcitableCells’, Nat. Methods, 3, 785–792 (2006).
98. L. Barbe, E. Lundberg, P. Oksvold, A. Stenius, E. Lewin,E. Bjorling, A. Asplund, F. Ponten, H. Brismar,M. Uhlen, H. Andersson-Svahn, ‘Toward a ConfocalSubcellular Atlas of the Human Proteome’, Mol. Cell.Proteomics: MCP, 7, 499–508 (2008).
99. S. Rastogi, B. Rost, ‘LocDB: Experimental Annotationsof Localization for Homo Sapiens and ArabidopsisThaliana’, Nucleic Acids Res., 39, D230–D234 (2011).
100. J. Sprenger, J. Lynn Fink, S. Karunaratne, K. Hanson,N.A. Hamilton, R.D. Teasdale, ‘LOCATE: AMammalian Protein Subcellular Localization Database’,Nucleic Acids Res., 36, D230–D233 (2008).
101. S. Peri, J.D. Navarro, R. Amanchy, T.Z. Kristiansen,C.K. Jonnalagadda, V. Surendranath, V. Niranjan, B.Muthusamy, T.K. Gandhi, M. Gronborg, N. Ibarrola,N. Deshpande, K. Shanker, H.N. Shivashankar, B.P.Rashmi, M.A. Ramya, Z. Zhao, K.N. Chandrika,N. Padma, H.C. Harsha, A.J. Yatish, M.P. Kavitha,M. Menezes, D.R. Choudhury, S. Suresh, N. Ghosh,R. Saravana, S. Chandran, S. Krishna, M. Joy, S.K.Anand, V. Madavan, A. Joseph, G.W. Wong, W.P.Schiemann, S.N. Constantinescu, L. Huang, R. Khosravi-Far, H. Steen, M. Tewari, S. Ghaffari, G.C. Blobe,C.V. Dang, J.G. Garcia, J. Pevsner, O.N. Jensen,
P. Roepstorff, K.S. Deshpande, A.M. Chinnaiyan,A. Hamosh, A. Chakravarti, A. Pandey, ‘Developmentof Human Protein Reference Database as an InitialPlatform for Approaching Systems Biology in Humans’,Genome Res., 13, 2363–2371 (2003).
102. W.K. Huh, J.V. Falvo, L.C. Gerke, A.S. Carroll, R.W.Howson, J.S. Weissman, E.K. O’Shea, ‘Global Analysisof Protein Localization in Budding Yeast’, Nature, 425,686–691 (2003).
103. D.Q. Ding, Y. Tomita, A. Yamamoto, Y. Chikashige,T. Haraguchi, Y. Hiraoka, ‘Large-scale Screening ofIntracellular Protein Localization in Living Fission YeastCells by the Use of a GFP-fusion Genomic DNA Library’,Genes Cells, 5, 169–190 (2000).
104. M. Sarov, J.I. Murray, K. Schanze, A. Pozniakovski,W. Niu, K. Angermann, S. Hasse, M. Rupprecht,E. Vinis, M. Tinney, E. Preston, A. Zinke, S. Enst,T. Teichgraber, J. Janette, K. Reis, S. Janosch,S. Schloissnig, R.K. Ejsmont, C. Slightam, X. Xu,S.K. Kim, V. Reinke, A.F. Stewart, M. Snyder, R.H.Waterston, A.A. Hyman, ‘A Genome-Scale Resource forIn Vitro Tag-based Protein Function Exploration in C.Elegans’, Cell, 150, 855–866 (2012).
105. A. Sigal, T. Danon, A. Cohen, R. Milo, N. Geva-Zatorsky, G. Lustig, Y. Liron, U. Alon, N. Perzov,‘Generation of a Fluorescently Labeled EndogenousProtein Library in Living Human Cells’, Nat. Protoc.,2, 1515–1527 (2007).
Encyclopedia of Analytical Chemistry, Online © 2006–2013 John Wiley & Sons, Ltd.This article is © 2013 John Wiley & Sons, Ltd.This article was published in the Encyclopedia of Analytical Chemistry in 2013 by John Wiley & Sons, Ltd.DOI: 10.1002/9780470027318.a9326