high school predictors of college readiness - vdoe · successful completion of first-year...
TRANSCRIPT
High School Predictors of College Readiness:
Determinants of High School Graduates’ Enrollment and Successful Completion of First-Year Mathematics and
English College Courses in Virginia
May 2012
Texas Schools Project • Virginia Department of Education • National Center for Educational Achievement/ACT, Inc

ii
High School Predictors of College Readiness: Determinants of High School Graduates’ Enrollment and Successful Completion of First-Year Mathematics and English College Courses in Virginia
iii
High School Predictors of College Readiness: Determinants of High School Graduates’ Enrollment and Successful Completion of First-Year Mathematics and English College Courses in Virginia
High School Predictors of College Readiness:
Determinants of High School Graduates’ Enrollment and Successful Completion of First-Year Mathematics and
English College Courses in Virginia
Virginia Department of EducationDeborah Jonas
National Center for Educational Achievement/ACT, IncChrys Dougherty
Texas Schools ProjectAngelica Ware Herrera
Jason LaTurner Marshall Garland
Anne Ware
iv
High School Predictors of College Readiness: Determinants of High School Graduates’ Enrollment and Successful Completion of First-Year Mathematics and English College Courses in Virginia
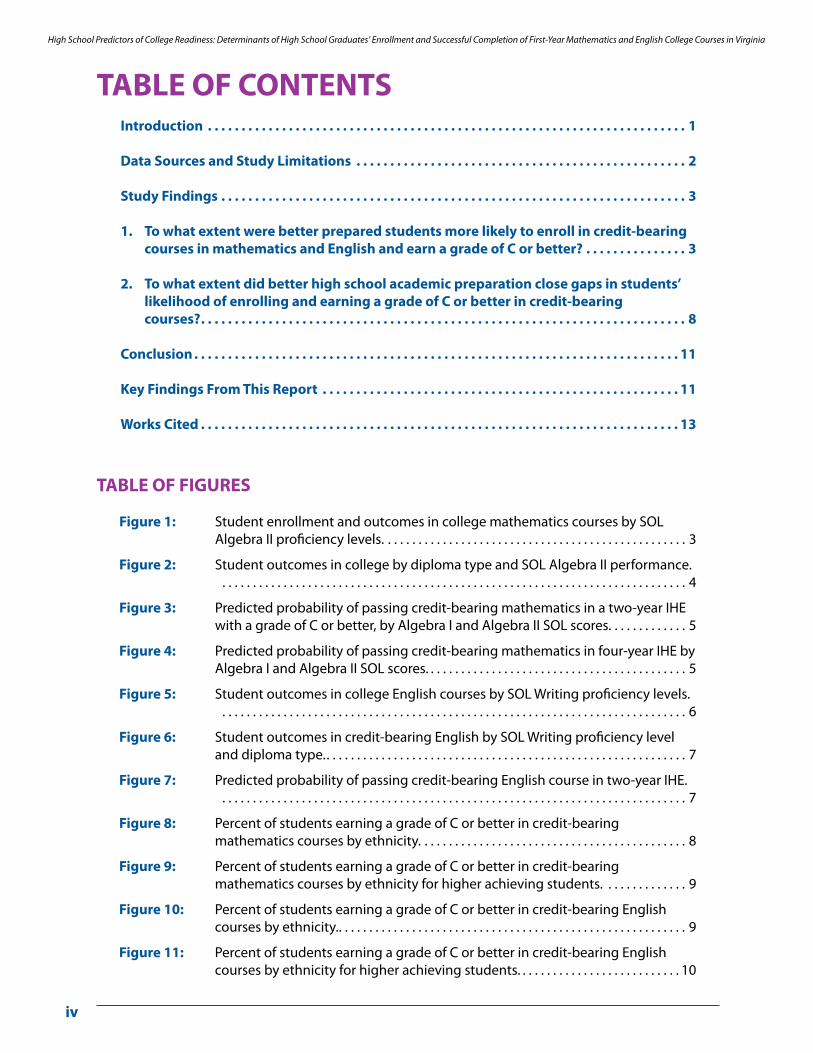
TABLE OF CONTENTSIntroduction . . . . . . . . . . . . . . . . . . . . . . . . . . . . . . . . . . . . . . . . . . . . . . . . . . . . . . . . . . . . . . . . . . . . . . . 1
Data Sources and Study Limitations . . . . . . . . . . . . . . . . . . . . . . . . . . . . . . . . . . . . . . . . . . . . . . . . . 2
Study Findings . . . . . . . . . . . . . . . . . . . . . . . . . . . . . . . . . . . . . . . . . . . . . . . . . . . . . . . . . . . . . . . . . . . . . 3
1 . To what extent were better prepared students more likely to enroll in credit-bearing courses in mathematics and English and earn a grade of C or better? . . . . . . . . . . . . . . . 3
2 . To what extent did better high school academic preparation close gaps in students’ likelihood of enrolling and earning a grade of C or better in credit-bearing
courses? . . . . . . . . . . . . . . . . . . . . . . . . . . . . . . . . . . . . . . . . . . . . . . . . . . . . . . . . . . . . . . . . . . . . . . . . 8
Conclusion . . . . . . . . . . . . . . . . . . . . . . . . . . . . . . . . . . . . . . . . . . . . . . . . . . . . . . . . . . . . . . . . . . . . . . . . 11
Key Findings From This Report . . . . . . . . . . . . . . . . . . . . . . . . . . . . . . . . . . . . . . . . . . . . . . . . . . . . . 11
Works Cited . . . . . . . . . . . . . . . . . . . . . . . . . . . . . . . . . . . . . . . . . . . . . . . . . . . . . . . . . . . . . . . . . . . . . . . 13
TABLE OF FIGURES
Figure 1: Student enrollment and outcomes in college mathematics courses by SOL Algebra II proficiency levels. . . . . . . . . . . . . . . . . . . . . . . . . . . . . . . . . . . . . . . . . . . . . . . . . . 3
Figure 2: Student outcomes in college by diploma type and SOL Algebra II performance. . . . . . . . . . . . . . . . . . . . . . . . . . . . . . . . . . . . . . . . . . . . . . . . . . . . . . . . . . . . . . . . . . . . . . . . . . . . . 4
Figure 3: Predicted probability of passing credit-bearing mathematics in a two-year IHE with a grade of C or better, by Algebra I and Algebra II SOL scores. . . . . . . . . . . . . 5
Figure 4: Predicted probability of passing credit-bearing mathematics in four-year IHE by Algebra I and Algebra II SOL scores. . . . . . . . . . . . . . . . . . . . . . . . . . . . . . . . . . . . . . . . . . . 5
Figure 5: Student outcomes in college English courses by SOL Writing proficiency levels. . . . . . . . . . . . . . . . . . . . . . . . . . . . . . . . . . . . . . . . . . . . . . . . . . . . . . . . . . . . . . . . . . . . . . . . . . . . . 6
Figure 6: Student outcomes in credit-bearing English by SOL Writing proficiency level and diploma type.. . . . . . . . . . . . . . . . . . . . . . . . . . . . . . . . . . . . . . . . . . . . . . . . . . . . . . . . . . . 7
Figure 7: Predicted probability of passing credit-bearing English course in two-year IHE. . . . . . . . . . . . . . . . . . . . . . . . . . . . . . . . . . . . . . . . . . . . . . . . . . . . . . . . . . . . . . . . . . . . . . . . . . . . . 7
Figure 8: Percent of students earning a grade of C or better in credit-bearing mathematics courses by ethnicity. . . . . . . . . . . . . . . . . . . . . . . . . . . . . . . . . . . . . . . . . . . . 8
Figure 9: Percent of students earning a grade of C or better in credit-bearing mathematics courses by ethnicity for higher achieving students. . . . . . . . . . . . . . 9
Figure 10: Percent of students earning a grade of C or better in credit-bearing English courses by ethnicity.. . . . . . . . . . . . . . . . . . . . . . . . . . . . . . . . . . . . . . . . . . . . . . . . . . . . . . . . . 9
Figure 11: Percent of students earning a grade of C or better in credit-bearing English courses by ethnicity for higher achieving students. . . . . . . . . . . . . . . . . . . . . . . . . . . 10
1
High School Predictors of College Readiness: Determinants of High School Graduates’ Enrollment and Successful Completion of First-Year Mathematics and English College Courses in Virginia
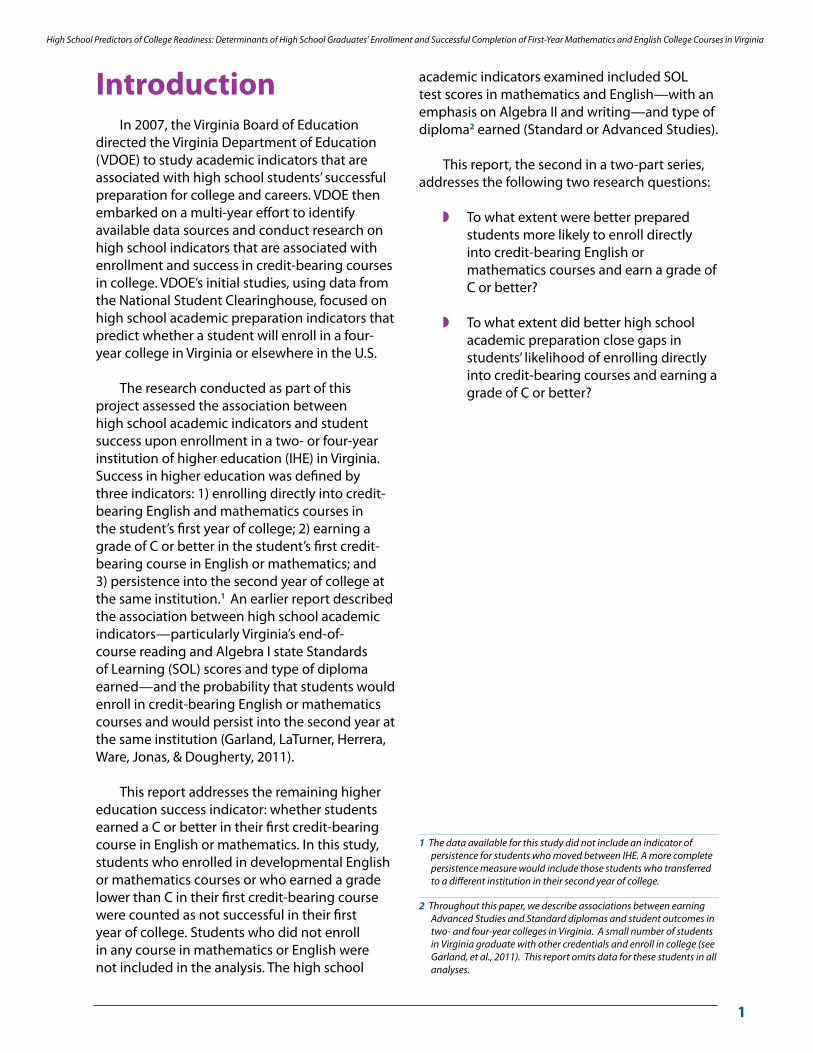
IntroductionIn 2007, the Virginia Board of Education
directed the Virginia Department of Education (VDOE) to study academic indicators that are associated with high school students’ successful preparation for college and careers. VDOE then embarked on a multi-year effort to identify available data sources and conduct research on high school indicators that are associated with enrollment and success in credit-bearing courses in college. VDOE’s initial studies, using data from the National Student Clearinghouse, focused on high school academic preparation indicators that predict whether a student will enroll in a four-year college in Virginia or elsewhere in the U.S.
The research conducted as part of this project assessed the association between high school academic indicators and student success upon enrollment in a two- or four-year institution of higher education (IHE) in Virginia. Success in higher education was defined by three indicators: 1) enrolling directly into credit-bearing English and mathematics courses in the student’s first year of college; 2) earning a grade of C or better in the student’s first credit-bearing course in English or mathematics; and 3) persistence into the second year of college at the same institution.1 An earlier report described the association between high school academic indicators—particularly Virginia’s end-of-course reading and Algebra I state Standards of Learning (SOL) scores and type of diploma earned—and the probability that students would enroll in credit-bearing English or mathematics courses and would persist into the second year at the same institution (Garland, LaTurner, Herrera, Ware, Jonas, & Dougherty, 2011).
This report addresses the remaining higher education success indicator: whether students earned a C or better in their first credit-bearing course in English or mathematics. In this study, students who enrolled in developmental English or mathematics courses or who earned a grade lower than C in their first credit-bearing course were counted as not successful in their first year of college. Students who did not enroll in any course in mathematics or English were not included in the analysis. The high school
academic indicators examined included SOL test scores in mathematics and English—with an emphasis on Algebra II and writing—and type of diploma2 earned (Standard or Advanced Studies).
This report, the second in a two-part series, addresses the following two research questions:
w To what extent were better prepared students more likely to enroll directly into credit-bearing English or mathematics courses and earn a grade of C or better?
w To what extent did better high school academic preparation close gaps in students’ likelihood of enrolling directly into credit-bearing courses and earning a grade of C or better?
1 The data available for this study did not include an indicator of persistence for students who moved between IHE. A more complete persistence measure would include those students who transferred to a different institution in their second year of college.
2 Throughout this paper, we describe associations between earning Advanced Studies and Standard diplomas and student outcomes in two- and four-year colleges in Virginia. A small number of students in Virginia graduate with other credentials and enroll in college (see Garland, et al., 2011). This report omits data for these students in all analyses.

2
High School Predictors of College Readiness: Determinants of High School Graduates’ Enrollment and Successful Completion of First-Year Mathematics and English College Courses in Virginia
Data Sources and Study Limitations
The Virginia Department of Education (VDOE) provided researchers at the Texas Schools Project (TSP) with a file containing de-identified data on high school graduates and non-graduate completers from the 2007-2008 school year. Data from this file was merged with three files from the State Council of Higher Education for Virginia (SCHEV) which also contained de-identified data from students who entered two- and four-year higher education institutions in Virginia in 2008-2009. The files from SCHEV included students’ mathematics and English course data, including the course level and grades (i.e., outcomes). Merging those four files yielded a database of 31,434 unduplicated, matched students with information on their high school test scores, type of high school credential earned (e.g., Standard or Advanced Studies Diploma3, freshman mathematics and English courses taken, course level, and grades earned in those courses, and whether students re-enrolled in the same institution in the following year (2009-10).4
Policymakers in Virginia were interested in this research as part of a broader effort to understand factors that contribute to students successfully enrolling in and satisfactorily completing credit-bearing (versus developmental) courses in college. For purposes of this research, VDOE worked with SCHEV’s research and data experts to define student success in terms of enrollment and course outcome. Students were considered to have successfully completed a mathematics or English college course if: a) the first course the student took in college was credit-bearing, not developmental, and b) the student earned a grade of C or better in this credit-bearing course. Thus, a student who took a developmental mathematics course in their first semester and a credit-bearing course in their second semester with a grade of C or above was not treated as successful in mathematics under the first criterion, and a student who enrolled first in a credit-bearing mathematics course but only earned a grade of D was not successful under the second criterion. Students who took no courses
at all in English or mathematics in the 2008-2009 school year were not included in the analysis for that subject. As well, data from students who attended three private four-year institutions of higher education in Virginia—Bridgewater, Eastern Mennonite, and Hollins—were dropped from the analysis because these students’ grades were not reported to SCHEV.
Descriptive analyses and logistic regression models were used to understand the associations between high school achievement indicators and college course outcomes. High school indicators, specifically, included students’ high school Standards of Learning (SOL) test scores in writing, reading, Algebra I, and Algebra II, and the type of diploma that the student earned (Standard or Advanced Studies). Student demographics variables were included in some analyses to control for factors that are known to be associated with student achievement.
3 To earn a Standard Diploma, students were required to earn at least 22 standard units of credit. These included four credits in English; three credits each in mathematics, laboratory science, and history and social sciences; two credits in health and physical education; one credit in fine arts or career and technical education; and six credits in electives. For an Advanced Studies Diploma, students were required to earn at least 24 standard units of credit. Of these credit hours, students must earn at least four credits each in English, mathematics, laboratory science, and history and social sciences; three credits in foreign language; two credits in health and physical education; one credit in fine arts or career and technical education; and two credits in electives. (http://www.doe.virginia.gov/instruction/graduation/)
4 Additional information on the four files and the merging process is contained in the prior report in this series, Garland, et al., 2011.

3
High School Predictors of College Readiness: Determinants of High School Graduates’ Enrollment and Successful Completion of First-Year Mathematics and English College Courses in Virginia
Figure 1: Student enrollment and outcomes in college mathematics courses by SOL Algebra II proficiency levels .
NOTE: Students not enrolled in mathematics courses or whose grades were not provided were excluded from the analyses.
Study Findings1 . To what extent were better prepared students more likely to enroll in credit-bearing courses in mathematics and English and earn a grade of C or better?
Algebra II and Success in the Student’s First Mathematics Course
Students’ success in Algebra II in high school was strongly associated with whether they enrolled in credit-bearing mathematics courses in college and whether they earned a grade of C or better in their first college mathematics course. Approximately 83 percent of students who took Algebra II and scored advanced proficient on Virginia’s SOL test took a credit-bearing first mathematics course and earned a C or better in that course. Fifty-four percent of students who earned pass proficient scores
on the Algebra II SOL enrolled in and were successful in credit-bearing mathematics, and 19 percent of students who failed the Algebra II SOL were successful (see Figure 1).
Students who earned Advanced Studies diplomas also did better in their first mathematics course taken in two- or four-year colleges compared to students who earned Standard diplomas. Figure 2 shows how the type of diploma earned and students’ Algebra II SOL performance are jointly associated with their odds of avoiding the need for developmental courses in mathematics and earning a C or better in a credit-bearing mathematics course in the freshman year. Students who earned Advanced Studies diplomas and passed the Algebra II SOL test were more likely to be successful in credit-bearing mathematics courses than students who earned Standard diplomas. Specifically, 62 percent of students who earned Advanced Studies diplomas and earned proficient scores on the Algebra II SOL enrolled in and were successful in their first-year credit-bearing
0%
10%
20%
30%
40%
50%
60%
70%
80%
90%
100%
No Algebra II data
(N=2,809)
Fail
(N=1,045)
Pass Pro�cient(N=12,153)
Advanced Pro�cient
(N=4,750)
Percent of students in developmental mathematics in college
Percent of students who earned a grade lower than a C in credit-bearing college mathematics
Percent of students earning a C or better in credit-bearing college mathematics
Perc
ent o
f stu
dent
s en
rolle
d in
col
lege
mat
hem
atic
s
Algebra II SOL Pro�ciency Level2%
15%
83%
22%
24%
54%
61%
20%
19%
68%
13%
19%

4
High School Predictors of College Readiness: Determinants of High School Graduates’ Enrollment and Successful Completion of First-Year Mathematics and English College Courses in Virginia
Figure 2: Student outcomes in college by diploma type and SOL Algebra II performance .
NOTE: Students who were not enrolled in mathematics or who were missing grades were excluded from calculations.
0%
10%
20%
30%
40%
50%
60%
70%
80%
90%
100%
Standard Diploma(N=3,894)
Advanced Studies Diploma(N=13,841)
FailedAdvanced Pro�cient Pass Pro�cient
Prob
abili
ty o
f stu
dent
s ea
rnin
g a
grad
e of
C o
r bet
ter
in a
cre
dit-
bear
ing
cou
rse
85%
58%62%
30%
38%
13%
mathematics course in college. However, only 58 percent of students who earned Standard diplomas and earned advanced proficient scores had comparable outcomes in college. Only 30 percent of students who earned Standard diplomas and passed the Algebra II SOL at the proficient level enrolled in and were successful in their first credit-bearing mathematics course in college.
For students entering two-year colleges, Algebra II performance was a stronger predictor than Algebra I of earning a C or better in a credit-bearing first mathematics course. This can be seen by the steeper slope of the line for Algebra II than for Algebra I in Figure 3, indicating that for a Virginia student with typical characteristics, scoring higher in Algebra II has a stronger impact on the probability that the student will
earn a C in a credit-bearing mathematics course in a two-year IHE than does scoring higher in Algebra I. It is important to note that based on prior research, both taking an Algebra II course and performance on the Algebra II assessment are associated with the probability of enrolling in credit-bearing courses in two- and four-year schools (see Garland, et al., 2011).
This differential association was not apparent in four-year IHE, where performance on Algebra I and Algebra II are equally predictive of passing a credit-bearing mathematics course (see Figure 4). This is at least in part a function of Virginia’s four-year IHE not offering developmental courses as a matter of policy—according to Virginia law, all mathematics and English courses in Virginia’s public four-year IHE are credit-bearing.
SOL Algebra II Proficiency Level

5
High School Predictors of College Readiness: Determinants of High School Graduates’ Enrollment and Successful Completion of First-Year Mathematics and English College Courses in Virginia
Figure 3: Predicted probability of passing credit-bearing mathematics in a two-year IHE with a grade of C or better, by Algebra I and Algebra II SOL scores .
NOTE: Predicted probabilities derived from logistic regression with standard errors adjusted for clustering at the IHE level. Variables included in the estimation were: race/ethnicity, LEP status, gender, economically disadvantaged status, high school attendance rate, diploma type, college course level, and SOL test scores in Algebra I, Algebra II, and English reading and writing.
0.0
0.1
0.2
0.3
0.4
0.5
0.6
0.7
0.8
0.9
1.0Two-Year IHE Credit-bearing Mathematics Course
Prob
abili
ty o
f stu
dent
s ea
rnin
g a
grad
e of
C o
r bet
ter
in a
cre
dit-
bear
ing
mat
hem
atic
s co
urse
Algebra IIAlgebra I
400 425 450 475 500 525 550 575 600
0.42
0.34
0.77
0.64
Figure 4: Predicted probability of passing credit-bearing mathematics in four-year IHE by Algebra I and Algebra II SOL scores .
NOTE: Predicted probabilities derived from logistic regression with standard errors adjusted for clustering at the IHE level. Variables included in the estimation were: race/ethnicity, LEP status, gender, economically disadvantaged status, high school attendance rate, diploma type, college course level, and SOL test scores in Algebra I, Algebra II, and English reading and writing.
Four-Year IHE Credit-bearing Mathematics Course
0.0
0.1
0.2
0.3
0.4
0.5
0.6
0.7
0.8
0.9
1.0
Algebra IIAlgebra I
Prob
abili
ty o
f stu
dent
s ea
rnin
g a
grad
e of
C o
r bet
ter
in a
cre
dit-
bear
ing
mat
hem
atic
s co
urse
400 425 450 475 500 525 550 575 600
0.70
0.65
0.82
0.78
6
High School Predictors of College Readiness: Determinants of High School Graduates’ Enrollment and Successful Completion of First-Year Mathematics and English College Courses in Virginia
Writing and Success in the Student’s First English Course
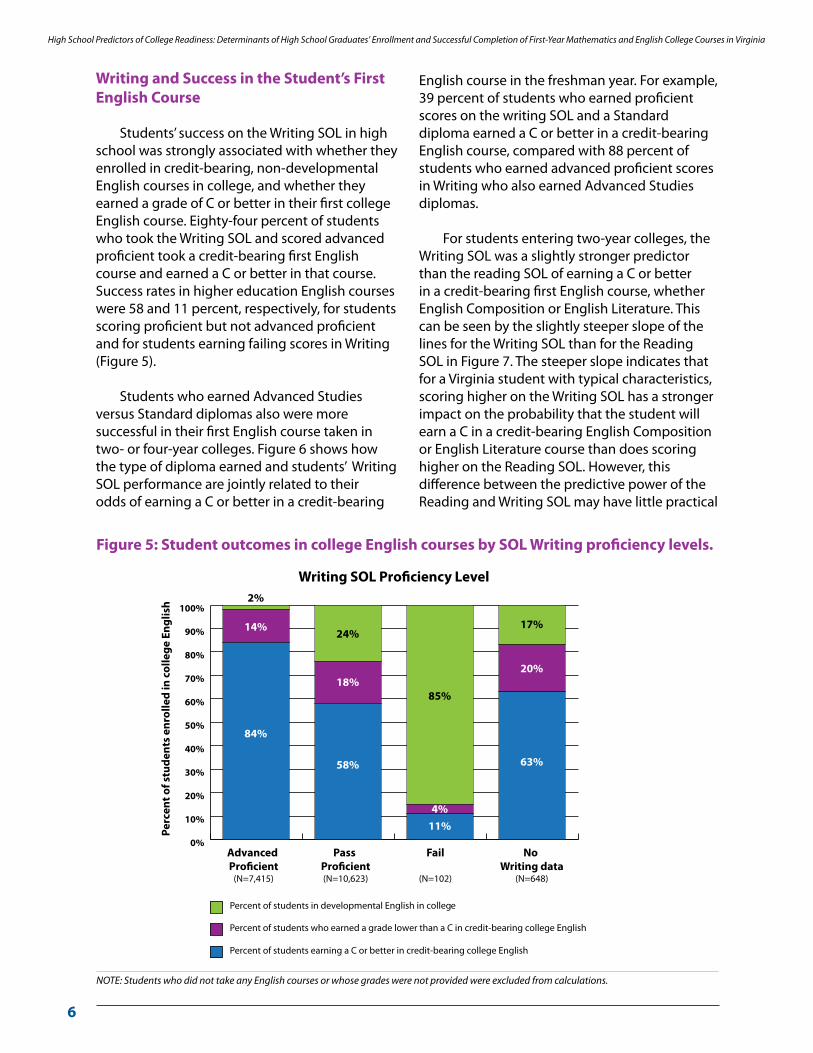
Students’ success on the Writing SOL in high school was strongly associated with whether they enrolled in credit-bearing, non-developmental English courses in college, and whether they earned a grade of C or better in their first college English course. Eighty-four percent of students who took the Writing SOL and scored advanced proficient took a credit-bearing first English course and earned a C or better in that course. Success rates in higher education English courses were 58 and 11 percent, respectively, for students scoring proficient but not advanced proficient and for students earning failing scores in Writing (Figure 5).
Students who earned Advanced Studies versus Standard diplomas also were more successful in their first English course taken in two- or four-year colleges. Figure 6 shows how the type of diploma earned and students’ Writing SOL performance are jointly related to their odds of earning a C or better in a credit-bearing
English course in the freshman year. For example, 39 percent of students who earned proficient scores on the writing SOL and a Standard diploma earned a C or better in a credit-bearing English course, compared with 88 percent of students who earned advanced proficient scores in Writing who also earned Advanced Studies diplomas.
For students entering two-year colleges, the Writing SOL was a slightly stronger predictor than the reading SOL of earning a C or better in a credit-bearing first English course, whether English Composition or English Literature. This can be seen by the slightly steeper slope of the lines for the Writing SOL than for the Reading SOL in Figure 7. The steeper slope indicates that for a Virginia student with typical characteristics, scoring higher on the Writing SOL has a stronger impact on the probability that the student will earn a C in a credit-bearing English Composition or English Literature course than does scoring higher on the Reading SOL. However, this difference between the predictive power of the Reading and Writing SOL may have little practical
Figure 5: Student outcomes in college English courses by SOL Writing proficiency levels .
NOTE: Students who did not take any English courses or whose grades were not provided were excluded from calculations.
0%
10%
20%
30%
40%
50%
60%
70%
80%
90%
100%
No Writing data
(N=648)
2%
14%
84%
24%
18%
58%
85%
4%11%
17%
20%
63%
Perc
ent o
f stu
dent
s en
rolle
d in
col
lege
Eng
lish
Percent of students in developmental English in college
Percent of students who earned a grade lower than a C in credit-bearing college English
Percent of students earning a C or better in credit-bearing college English
Writing SOL Pro�ciency Level
Fail
(N=102)
Pass Pro�cient(N=10,623)
Advanced Pro�cient
(N=7,415)

7
High School Predictors of College Readiness: Determinants of High School Graduates’ Enrollment and Successful Completion of First-Year Mathematics and English College Courses in Virginia
Figure 6: Student outcomes in credit-bearing English by SOL Writing proficiency level and diploma type .
NOTES: Students who did not have course grades were excluded from calculations. There were too few students who earned an Advanced Studies diploma and failed the SOL writing assessments to report outcomes.
Figure 7: Predicted probability of passing credit-bearing English course in two-year IHE .
NOTE: Predicted probabilities derived from logistic regression with standard errors adjusted for clustering at the IHE level. Variables included in the estimation were: race/ethnicity, LEP status, gender, economically disadvantaged status, high school attendance rate, diploma type, college course level, and SOL test scores in Algebra I, Algebra II, and English reading and writing.
0.0
0.1
0.2
0.3
0.4
0.5
0.6
0.7
0.8
0.9
1.0
Reading SOLWriting SOL
Two-Year IHE Credit-bearing English Course
Prob
abili
ty o
f stu
dent
s ea
rnin
g a
grad
e of
C o
r bet
ter
in a
cre
dit-
bear
ing
Engl
ish
cour
se
400 425 450 475 500 525 550 575 600
0.65
0.61
0.84
0.79
significance. SOL scores on the reading and writing test were equally predictive of success
at Virginia’s four-year IHE with higher scores associated with greater chance of success.
0%
10%
20%
30%
40%
50%
60%
70%
80%
90%
100%
Standard Diploma(N=5,894)
Advanced Studies Diploma(N=11,989)
62%
FailedAdvanced Pro�cient Pass Pro�cient
88%
75%
39%
18%
Perc
ent o
f stu
dent
s ea
rnin
g a
grad
e of
C o
r bet
ter
in a
cre
dit-
bear
ing
cour
se
SOL Writing Proficiency Level

8
High School Predictors of College Readiness: Determinants of High School Graduates’ Enrollment and Successful Completion of First-Year Mathematics and English College Courses in Virginia
2 . To what extent did better high school academic preparation close gaps in students’ likelihood of enrolling and earning a grade of C or better in credit-bearing courses?
Algebra II and Demographic Gaps in Higher Education Mathematics Success
As is the case with many other education indicators, large gaps in performance in higher education mathematics courses exist across student demographic groups.5 For example, looking at the first mathematics course students took in their freshman year, Figure 8 shows an 18-percentage-point gap in the percentage of Asian and Hispanic students taking a credit-bearing mathematics course and earning a C or better in that course.
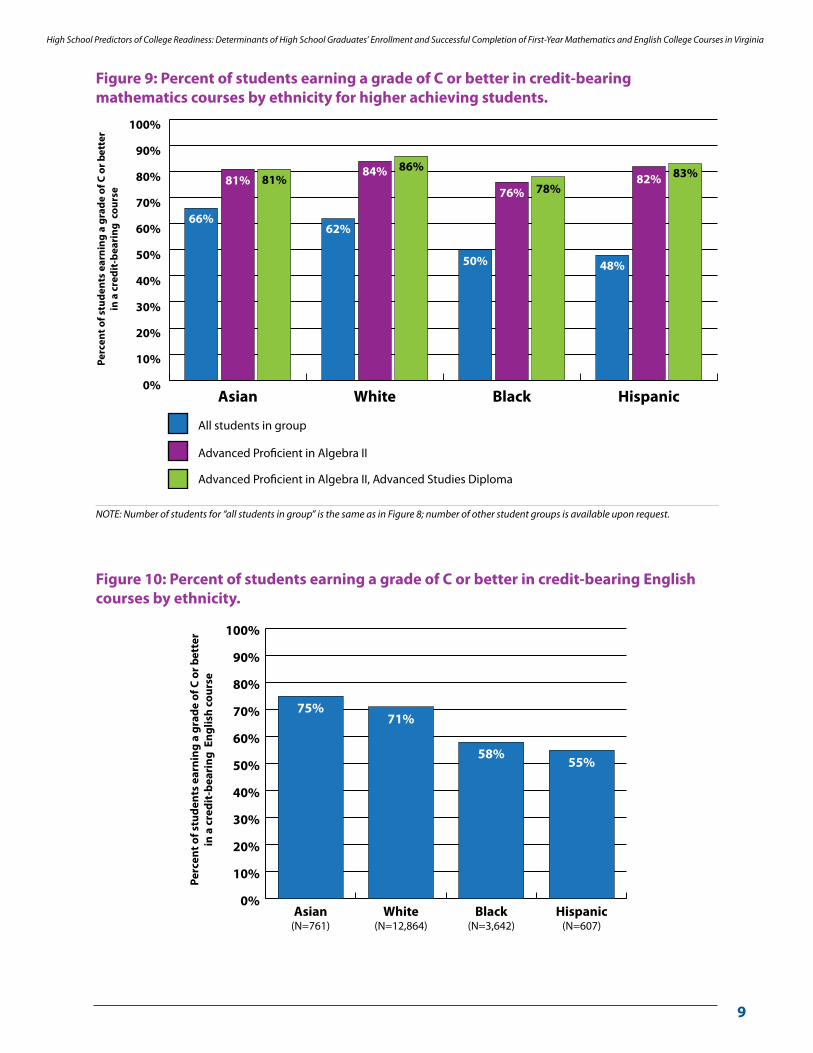
The same statistics in Figure 8 are shown in the left-hand set of bars in Figure 9. However, when students earn an advanced proficient score in Algebra II, success rates for all groups are higher and the gaps between groups are smaller (middle set of bars in Figure 9). Adding
Figure 8: Percent of students earning a grade of C or better in credit-bearing mathematics courses by ethnicity .
the additional condition that these students who earned advanced proficient test scores also earned Advanced Studies diplomas makes only a slight additional change to student success rates (right-hand set of bars in Figure 9), mainly because nearly all students who earned advanced proficient scores on the Algebra II also earned Advanced Studies diplomas.
Writing and Demographic Gaps in Higher Education English Success
As is the case for mathematics, substantial gaps in performance in higher education English courses exist across student demographic groups. For example, looking at the first English course students took in their freshman year, Figure 10 shows a 20-percentage-point gap in the percentage of Asian and Hispanic students taking a credit-bearing English course and earning a C or better in that course.
Similar statistics to those shown in Figure 10 are shown in the left-hand set of bars in Figure 11. However, when students earned advanced proficient scores on the Writing SOL, success rates for all groups were higher and the gaps between groups were smaller (middle set of bars
0%
10%
20%
30%
40%
50%
60%
70%
80%
90%
100%
Hispanic(N=592)
Black(N=3,178)
White(N=12,731)
Asian(N=1,014)
66%62%
50% 48%
Perc
ent o
f stu
dent
s ea
rnin
g a
grad
e of
C o
r bet
ter
in a
cre
dit-
bear
ing
mat
hem
atic
s c
ours
e
5 A similar analysis can be done by student income groups based on students’ economically disadvantaged status in Virginia.
9
High School Predictors of College Readiness: Determinants of High School Graduates’ Enrollment and Successful Completion of First-Year Mathematics and English College Courses in Virginia
Figure 9: Percent of students earning a grade of C or better in credit-bearing mathematics courses by ethnicity for higher achieving students .
NOTE: Number of students for “all students in group” is the same as in Figure 8; number of other student groups is available upon request.
HispanicBlackWhiteAsian
Perc
ent o
f stu
dent
s ea
rnin
g a
grad
e of
C o
r bet
ter
in a
cre
dit-
bear
ing
cou
rse
66%
81% 81%
62%
84% 86%
50%
76% 78%
48%
82% 83%
Advanced Pro�cient in Algebra II, Advanced Studies Diploma
Advanced Pro�cient in Algebra II
All students in group
0%
10%
20%
30%
40%
50%
60%
70%
80%
90%
100%
Figure 10: Percent of students earning a grade of C or better in credit-bearing English courses by ethnicity .
0%
10%
20%
30%
40%
50%
60%
70%
80%
90%
100%
Hispanic(N=607)
Black(N=3,642)
White(N=12,864)
Asian(N=761)
Perc
ent o
f stu
dent
s ea
rnin
g a
grad
e of
C o
r bet
ter
in a
cre
dit-
bear
ing
Eng
lish
cour
se
75%71%
58%55%

10
High School Predictors of College Readiness: Determinants of High School Graduates’ Enrollment and Successful Completion of First-Year Mathematics and English College Courses in Virginia
Figure 11: Percent of students earning a grade of C or better in credit-bearing English courses by ethnicity for higher achieving students .
NOTE: Number of students for “all students in group” is the same as in Figure 10; number of other student groups is available upon request.
in Figure 11). Adding the additional condition that the students who earned advanced proficient scores also earned Advanced Studies diplomas improved success rates for all student groups (right-hand set of bars in Figure 11), but
0%
10%
20%
30%
40%
50%
60%
70%
80%
90%
100%
Advanced Pro�cient in Writing, Advanced Studies Diploma
Advanced Pro�cient in Writing
All students in group
HispanicBlackWhiteAsian
Perc
ent o
f stu
dent
s ea
rnin
g a
grad
e of
C o
r bet
ter
in a
cre
dit-
bear
ing
Eng
lish
cour
se
75%
88% 90%
71%
85%89%
58%
76%83%
55%
78% 80%
the improvement is small because the majority of students who scored advanced proficient on the Writing SOL also earned Advanced Studies diplomas.
11
High School Predictors of College Readiness: Determinants of High School Graduates’ Enrollment and Successful Completion of First-Year Mathematics and English College Courses in Virginia
ConclusionVirginia’s policymakers have been interested
in understanding the factors associated with students’ preparation for college and careers. Since 2007, when the Board of Education requested studies focused on college readiness, the Virginia Department of Education has been conducting a research program to support policymakers’ and educators’ understanding of the courses and achievement levels needed on statewide indicators. The study described in this report adds to the Department’s body of knowledge by identifying factors associated with enrollment directly into credit-bearing courses and passing those courses with a grade of C or better. The results provide further validation for previous work (Garland, et al., 2011; Lichtenberger, Dietrich, Kamulladeen, & O’Reilly, 2010; Virginia Department of Education, 2010) that has identified Virginia’s Advanced Studies diploma—and the courses required in that diploma—as a key indicator of students’ preparation for entry level credit-bearing courses in college. As well, earning advanced proficient scores on Virginia’s end-of-course Algebra II and Writing tests were shown to be associated with enrollment and success in credit-bearing mathematics and English courses in college. Regardless of student ethnicity, students with both of these indicators generally had more than an 80 percent success rate in enrolling directly into credit-bearing courses and earning a grade of C or better.
Key Findings From This Report
This report focused on Virginia’s high school graduates’ enrollment and outcomes in entry level college courses during the first year of postsecondary education. Key findings showed that:
w Students who earned Advanced Studies diplomas had a greater chance of enrolling directly into and passing directly into credit-bearing mathematics and English courses than students who earned Standard diplomas.
w Students who earned advanced proficient scores on the Algebra II and Writing tests also had a greater chance of being successful in their first year English and mathematics courses in college. This was particularly true when coupled with Advanced Studies diplomas (see also Garland, et al., 2011).
w Students from traditionally lower achieving groups, such as those from racial/ethnic minorities in Virginia were less likely than other students to be successful in their first year of college. The research from this project showed unequivocally that when such students reach higher levels of achievement in high school, their chances of success in college are much closer to those other students who have the same level of achievement (see also Garland, et al., 2011). Although not shown here, the data result in similar conclusions when analyses are focused on students from economically disadvantaged families.
VDOE’s research on college and career readiness began in 2007. This report is the latest in a series of analyses and studies that were aimed at understanding the Virginia-specific indicators that indicate whether students are academically prepared for college when they leave high school. The findings from this research complement other studies Virginia has conducted as part of this research program, including:
w Virginia’s SOL test scores in reading and mathematics are correlated with SAT© scores (Jonas, 2010; unpublished data).
w The vast majority of students who earn Advanced Studies diplomas enroll in four-year colleges within and beyond Virginia (Lichtenberger, et al., 2010) and nearly 90 percent of these students persist into their second year at a four-year college. These students also have a high probability of enrolling directly into credit-bearing courses regardless of the college they attend (Garland, et al., 2011).

12
High School Predictors of College Readiness: Determinants of High School Graduates’ Enrollment and Successful Completion of First-Year Mathematics and English College Courses in Virginia
w Students who earn advanced proficient scores on Virginia’s high school reading, writing, and mathematics assessments have a high probability of enrolling and persisting in four-year colleges (Lichtenberger, et al. 2010; Garland et al., 2011) and enrolling in credit-bearing courses upon enrollment in any Virginia IHE (Garland et al., 2011).
w Students who participate in high school chemistry or in college-level courses in high school such as Advanced Placement and dual enrollment courses have added benefit when enrolling in college. Such courses increase students’ chances of success in the first year (Lichtenberg, et al., 2010; Garland, et al., 2011).
This research also mirrors conclusions in other research nationally that both student assessment scores and credit in rigorous high school courses are indicators that students are academically ready to succeed in college. While ensuring that students engage in appropriate coursework is clearly important for improving students’ preparation for college, evidence is
also clear that policy changes mandating college preparatory curriculum are only one piece of the puzzle needed to improve students’ preparation for postsecondary success. Without providing high schools direct support for building capacity to improve instruction, particularly to meet the educational needs of lower achieving students who will take more advanced courses, policies that mandate curriculum changes have not been successful (see Allensworth, Nomi, Montgomery, Lee, & Mazzeo, 2010; Dougherty & Mellor, 2009). Rather, in addition to policy changes, it is also critical to build high schools’ capacity to engage lower performing students in more rigorous curriculum using different instructional approaches and to build school systems’ capacity to prepare students better in the earlier years, K through 8 (Dougherty & Mellor, 2009). These conclusions should encourage state policymakers to focus on higher standards for course completion and achievement on associated assessments as indicators that students are well prepared for success in postsecondary education, while at the same time ensuring that educators can provide the support needed for students to reach these higher standards.
13
High School Predictors of College Readiness: Determinants of High School Graduates’ Enrollment and Successful Completion of First-Year Mathematics and English College Courses in Virginia
Works CitedAllensworth, E., Nomi, T., Montgomery, N., Lee, V., & Mazzeo, C. (2010). College prep for all? What we’ve
learned from Chicago’s efforts. Retrieved March 15, 2012, from http://ccsr.uchicago.edu/publications/College%20Prep%207x10-10-%20final%20082610.pdf
Dougherty, C., & Mellor, L. (2009). Preparation Matters. Retrieved March 15, 2012, from National Center for Educational Achievement:
http://www.nc4ea.org/linkservid/3D2C049D-CFCF-1F49-B20F714152BD9E25/showMeta/0/
Garland, M., LaTurner, J., Herrera, A. W., Ware, A., Jonas, D., & Dougherty, C. (2011, December). High School Predictors of College Readiness: Determinants of Developmental Course Enrollment and Second-Year Postsecondary Persistence in Virginia. Retrieved January 2012, from Virginia Department of Education:
http://www.doe.virginia.gov/instruction/college_career_readiness/research/high_school_predictors_of_cr_in_va_2011.pdf
Jonas, D. (2010, April 29). Virginia Board of Education. Retrieved January 2012, from Highlights of Progress and Activities Towards Meeting Board of Education Objectives:
http://www.doe.virginia.gov/boe/meetings/2009/04_apr/agenda_items/item_b.pdf
Lichtenberger, E., Dietrich, C., Kamulladeen, R., & O’Reilly, P. A. (2010). Postsecondary Enrollment: Summary of Phase I. Retrieved January 2012, from Virginia Department of Education:
http://www.doe.virginia.gov/instruction/college_career_readiness/research/ps_enrollment_phase1_summary_.pdf
Virginia Department of Education. (2010, September). Virginia’s College and Career Readiness Initiative. Retrieved January 2012, from Virginia Department of Education:
http://www.doe.virginia.gov/instruction/college_career_readiness/resources/introductory_briefing.pdf