high speed rail services to hastings, bexhill and eastbourne
TRANSCRIPT
Strategic Economic Case – Key findings, 2017 study
High Speed Rail Services to Hastings, Bexhill and Eastbourne
Stephen Cox, Head of Economic & Social Development, Mott MacDonald

Contents:
• Introduction
• Strategic context
• Economic impact
• Key channels
• Core analysis
• Summary

05/10/2017 Mott MacDonald | HSR Presentation 3
• Strategic economic case for High
Speed Rail (HSR) services to Hastings, Bexhill and Eastbourne
• 2015 study – conclusive that the
scheme would support economic growth
• South Eastern Franchise renewal /
Kent Route Study
• 2017 Rail Summit
• Key scheme assumptions (different to 2015):
• Extension to Eastbourne and
additional stops • HSR services delivered by
2024.
• Line speed and infrastructure improvements go ahead.
Proposed high speed rail service
Source: Mott MacDonald
Study purpose and rationale Introduction

05/10/2017 Mott MacDonald | HSR Presentation 4
Methodology
Cro
sso
ve
r
Economic
benefits – East
Sussex level
Welfare benefits
– UK level
Source: DfT, adapted from presentation on new WebTAG Framework
WebTAG: Framework to assess economic benefits: Key change from previous
study – more consideration
of UK impacts
Introduction

05/10/2017 Mott MacDonald | HSR Presentation 5
• London set to dominate economic
growth in the UK. • Need to address overheating
pressures – increased labour supply and ability for suppliers/businesses to grow outside of capital [or new ones locate in East Sussex]
• Re-balancing the national economy -
central to UK policy • Focus on infrastructure investment to
deepen labour markets / improve connectivity
• Huge growth opportunities within wider area – Thames Gateway, Stratford International and Ashford.
London and the South East: as % of UK population, GVA and employment
Source: Population Estimates 1997-2016, Regional Accounts 1997-2015 and Workforce Jobs
1997-2017, all Office of National Statistics (ONS).
Connectivity to London remains critical Strategic context
05/10/2017 Mott MacDonald | HSR Presentation 6
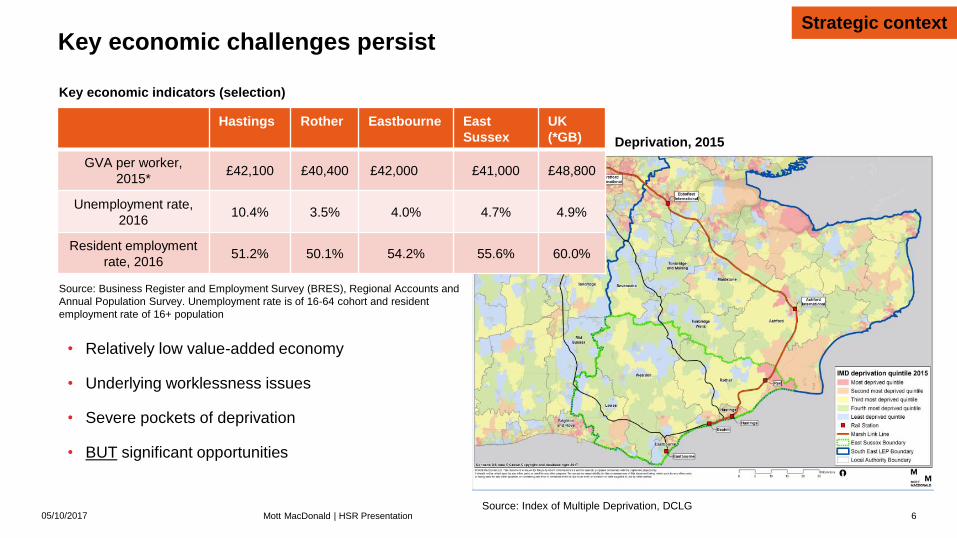
• Relatively low value-added economy
• Underlying worklessness issues
• Severe pockets of deprivation
• BUT significant opportunities
Key economic indicators (selection)
Key economic challenges persist
Hastings Rother Eastbourne East
Sussex
UK
(*GB)
GVA per worker,
2015* £42,100 £40,400 £42,000 £41,000 £48,800
Unemployment rate,
2016 10.4% 3.5% 4.0% 4.7% 4.9%
Resident employment
rate, 2016 51.2% 50.1% 54.2% 55.6% 60.0%
Source: Business Register and Employment Survey (BRES), Regional Accounts and
Annual Population Survey. Unemployment rate is of 16-64 cohort and resident
employment rate of 16+ population
Deprivation, 2015
Source: Index of Multiple Deprivation, DCLG
Strategic context

05/10/2017 Mott MacDonald | HSR Presentation 7
• Importance to East Sussex
growth - three LAs collectively account for 43% of housing and 66% of floorspace targets.
• Regeneration – cornerstone of economic development policy.
• Strong portfolio of development
sites now being targeted. • Significant housing growth also
planned in South Wealden.
• Connectivity –final and weakest policy area to address
Key developments in and around Hastings, Bexhill and Eastbourne
Regeneration response Strategic context

05/10/2017 8
How will the scheme support economic growth? (1)
Core channels: • Supporting business investment and growth • Provision of new commuting opportunities and thereby stimulating housing growth • Visitor economy and growth • In turn number of knock on impacts:
• Promoting inclusive growth • Land utilisation impacts (employment and housing sites) • Supporting town centre renaissance
Source: Businesses’ Perceptions, Catherine Williams Research Ltd, for Hastings Borough Council, 2016
How important is image and perception?
Mott MacDonald | HSR Presentation
Economic impact:
Key channels
05/10/2017 Mott MacDonald | HSR Presentation 9
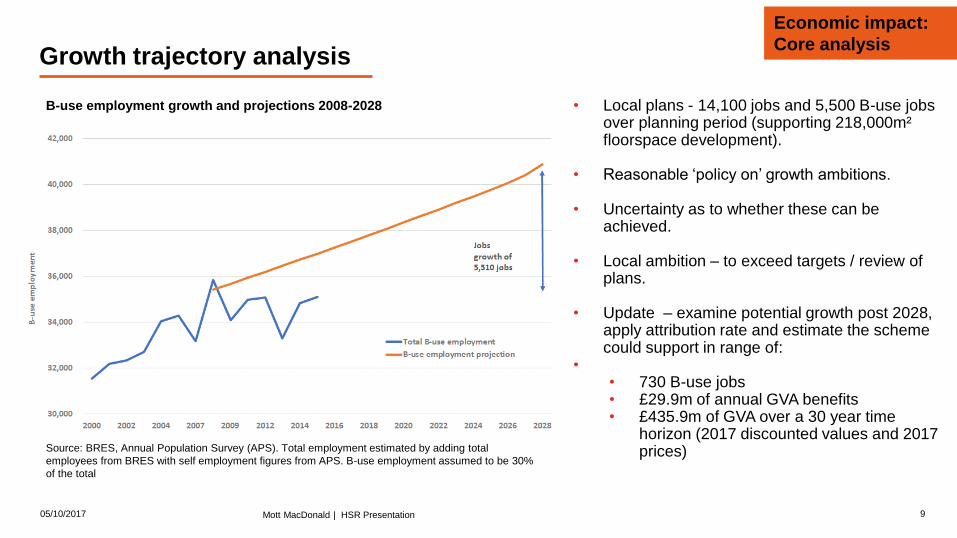
Growth trajectory analysis
B-use employment growth and projections 2008-2028
Source: BRES, Annual Population Survey (APS). Total employment estimated by adding total
employees from BRES with self employment figures from APS. B-use employment assumed to be 30%
of the total
• Local plans - 14,100 jobs and 5,500 B-use jobs
over planning period (supporting 218,000m² floorspace development).
• Reasonable ‘policy on’ growth ambitions. • Uncertainty as to whether these can be
achieved. • Local ambition – to exceed targets / review of
plans. • Update – examine potential growth post 2028,
apply attribution rate and estimate the scheme could support in range of:
• • 730 B-use jobs • £29.9m of annual GVA benefits • £435.9m of GVA over a 30 year time
horizon (2017 discounted values and 2017 prices)
Economic impact:
Core analysis
05/10/2017 Mott MacDonald | HSR Presentation 10
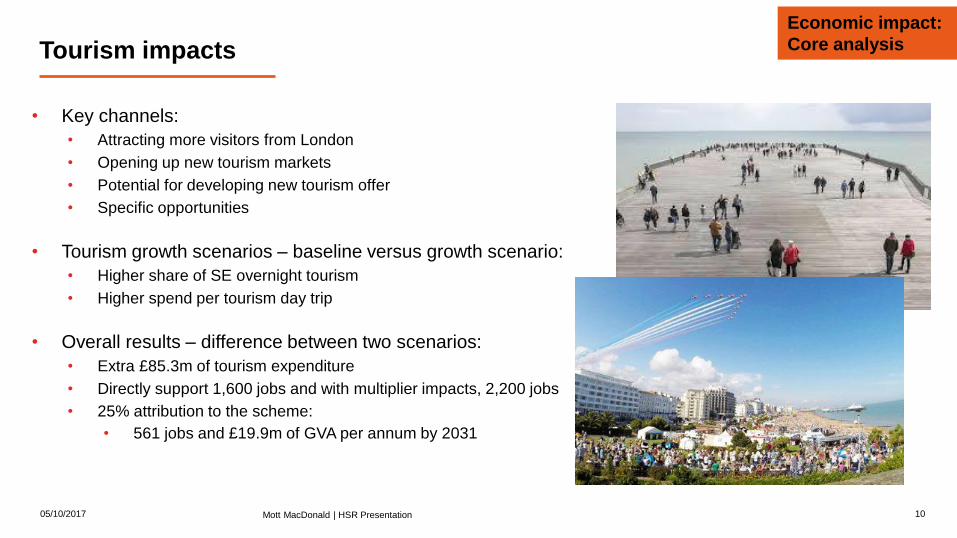
Tourism impacts
• Key channels:
• Attracting more visitors from London
• Opening up new tourism markets
• Potential for developing new tourism offer
• Specific opportunities
• Tourism growth scenarios – baseline versus growth scenario:
• Higher share of SE overnight tourism
• Higher spend per tourism day trip
• Overall results – difference between two scenarios:
• Extra £85.3m of tourism expenditure
• Directly support 1,600 jobs and with multiplier impacts, 2,200 jobs
• 25% attribution to the scheme:
• 561 jobs and £19.9m of GVA per annum by 2031
Economic impact:
Core analysis

05/10/2017 Mott MacDonald | HSR Presentation
11
Significant potential benefits
Present value of benefits (£M)
East Sussex (30 years,
2017 discounted
values and 2017
prices)
UK (60 years, 2010
discounted values and
2010 prices)
Unit
A: Growth trajectory analysis £435.9m GVA
B: Labour supply analysis £16.3m GVA and GDP
C: Agglomeration benefits £230.7m GDP
D: Visitor economy benefits £275.3m GVA
E: Reduction in spatial inequalities £6.9m Welfare benefits
F: Reduction in structural unemployment £31.7m Welfare benefits
EAST SUSSEX - TOTAL IMPACT (A+D+E+F) £711.2m
UK – TOTAL IMPACT (B+C+E+F) £285.6m
• Full results
Economic impact:
Summary

05/10/2017 Mott MacDonald | HSR Presentation 12
Summary – comparison to 2015 study
Present value of benefits (£M) / jobs per annum
2015 2017 – update
EAST SUSSEX - TOTAL IMPACT (A+D+E+F; excluding
agglomeration [B]) £354.3m £711.2m
UK – TOTAL IMPACT (B+C+E+F) £123.7m £285.6m
• Draft results
• Substantial increases at East Sussex and UK levels driven by:
• Scheme changes (opening date and stops)
• Changes in methodology – more consideration of UK level impacts.
• Stronger UK macroeconomic context
• Momentum that has built up already around HSR
Economic impact:
Summary

Thank you