high speed vs. high resolution analyses in hplc: a ... · high speed vs. high resolution analyses...
TRANSCRIPT

High Speed vs. High Resolution Analyses in HPLC: A Critical Performance Comparison of Column OptionsUsing Poppe and Kinetic Plots
Jason C. Link, William E. Barber, William Long, Anne MackAgilent Technologies
PittCon 2010

ApproachSpecialized Instrument Required
Key Advantages Major Limitations
Sub-2 μm Particle Yes Very high plate counts in short analysis times
Extra-column broadening, frictional
heating
Superficially Porous Particle No
High plate counts at relatively lower
pressureLimited commercial
phases
High Temperature Yes (above 100°C)
High efficiency maintained at high
mobile phase velocity
Solutes degradation, Limited number of stable
stationary phases
Monolith No High column permeability
Batch to batch reproducibility, Limited
column dimensions
Improvements to HPLC

Poroshell 120 for Small Molecules
High efficiency of Poroshell 120 particles similar to sub-2um totally porous particles
Gains due to shorter mass transfer and narrower particle size distribution
Low back pressure (40-60% of sub-2um totally porous particles)

Efficiency improvement with superficially porous particles
νν ⋅++= CBAh /

Poroshell 120 pore and particles size distribution
Poroshell 1201.8um totally porous3.5um totally porous5.0um totally porous

Poroshell 120 particles size distribution

Backpressure comparison of 2.7µm Poroshell 120 with 1.8µm totally porous particles

Which Yields Better Performance
• Which one performs better under optimized conditions• Relative performance as a function of separation goal
• Fast separation (low efficiency with short column)• Slow separation (high efficiency with long column)
Sub 2-µm1000 bar
2.7 µm550 bar

Theoretical Poppe plot
1s
10s100s 1000s
t0 = 1 secL = 3.41 cmF = 4.36 mL/minN = 1,000
t0 = 1000 secL = 108 cmF = 0.138 mL/minN = 141960
t0 = 30 secL = 18.7 cmF = 0.796 mL/minN = 19248
Pmax = 400 bar, T = 40 oC van Deemter equation
A = 1.0, B = 5.0, C = 0.05Dm = 1 × 10⁻⁵ cm2/secη = 6.6 × 10⁻⁴ Pa/sec
φ= 500, εe = 0.38, ε i = 0.30
3.5µm
Higher Efficiency
Faster Separation
http://homepages.gac.edu/~dstoll/calculators/optimize.html
Efficiency (N) – Higher N means higher resolving power
Separation speed (t0/N) – Lower t0/N equates to faster separation
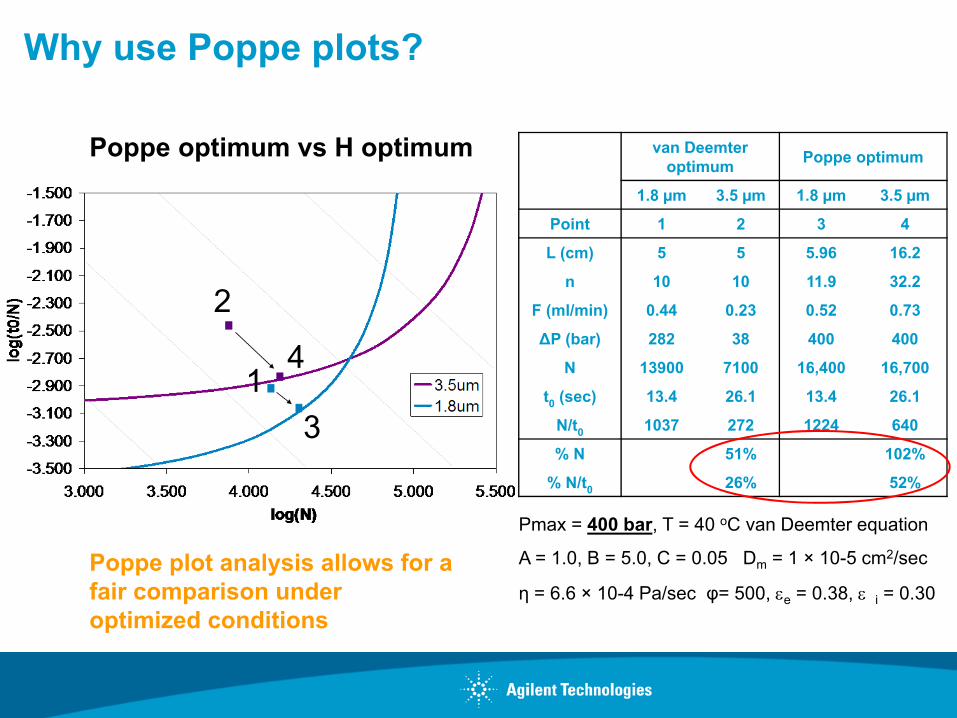
van Deemter optimum Poppe optimum
1.8 µm 3.5 µm 1.8 µm 3.5 µm
Point 1 2 3 4
L (cm) 5 5 5.96 16.2
n 10 10 11.9 32.2
F (ml/min) 0.44 0.23 0.52 0.73
ΔP (bar) 282 38 400 400
N 13900 7100 16,400 16,700
t0 (sec) 13.4 26.1 13.4 26.1
N/t0 1037 272 1224 640
% N 51% 102%
% N/t0 26% 52%
Poppe optimum vs H optimum
Poppe plot analysis allows for a fair comparison under optimized conditions
Why use Poppe plots?
2
41
3
Pmax = 400 bar, T = 40 oC van Deemter equation
A = 1.0, B = 5.0, C = 0.05 Dm = 1 × 10⁻⁵ cm2/sec
η = 6.6 × 10⁻⁴ Pa/sec φ= 500, εe = 0.38, ε i = 0.30

1. Perform flow study on each column type with alkylphenones
2. Transform van Deemter analysis into Poppe Plot
3. Test accuracy of method experimentally with columns connected in series to mimic a variety of column lengths
νν ⋅++= CBAh /
Practically meaningful metrics:
Plate count (N)
Plate count per unit time (N/t0)
van Deemter metrics:
Plate height (h)
Mobile phase velocity (ν)
Sub-2 µm fully porous particleZORBAX Rapid Resolution High Definition (RRHD) Eclipse Plus C18
2.7 µm superficially porous particlePoroshell 120 EC-C18vs
Experimental Design

In the reduced van Deemter plot:
Lower C term on the Poroshell 120 column (better mass transfer)
Lower hmin on the Poroshell 120 Column
Reduced van Deemter analysis
Poroshell RRHDA .70 0.81B 5.6 4.7C 0.06 0.13
hmin 1.90 2.38
Agilent 1290 Infinity LC System2.1mm x 50mm columns Analyte: HexanophenoneTemp: 40 °C%ACN adjusted to achieve k’=6 for each column

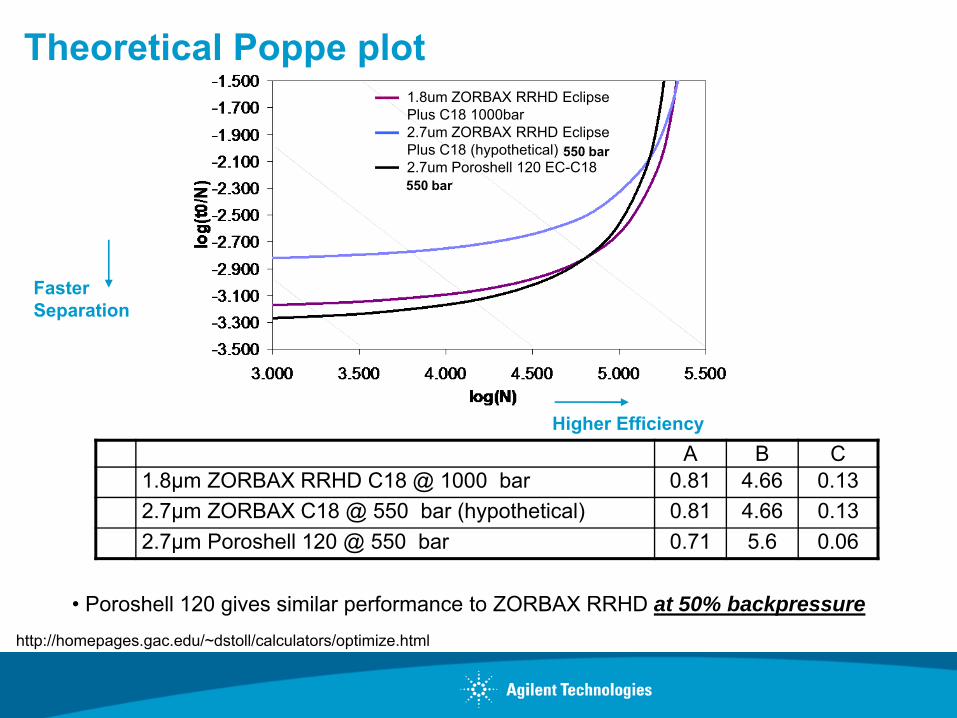
Theoretical Poppe plot
http://homepages.gac.edu/~dstoll/calculators/optimize.html
A B C1.8µm ZORBAX RRHD C18 @ 1000 bar 0.81 4.66 0.131.8µm ZORBAX RRHD C18 @ 550 bar 0.81 4.66 0.13
Higher Efficiency
Faster Separation
Higher pressures result in more efficient separations in longer analyses
1.8um ZORBAX RRHD EclipsePlus C18 1000bar1.8um ZORBAX RRHD EclipsePlus C18 500bar550 bar
Theoretical Poppe plot
http://homepages.gac.edu/~dstoll/calculators/optimize.html
A B C1.8µm ZORBAX RRHD C18 @ 1000 bar 0.81 4.66 0.132.7µm ZORBAX C18 @ 550 bar (hypothetical) 0.81 4.66 0.132.7µm Poroshell 120 @ 550 bar 0.71 5.6 0.06
Higher Efficiency
Faster Separation
• Poroshell 120 gives similar performance to ZORBAX RRHD at 50% backpressure
1.8um ZORBAX RRHD EclipsePlus C18 1000bar2.7um ZORBAX RRHD EclipsePlus C18 (hypothetical) 500bar2.7um Poroshell 120 EC-C18500bar550 bar
550 bar

min0 0.2 0.4 0.6 0.8
mAU
50
100
150
200
250
min0 0.2 0.4 0.6 0.8
mAU
0
50
100
150
200
Fast Analysis (5cm)
2.7um Poroshell 120EC-C182.1x5 cmF = 1.94 mL/min, 40°C56% ACN, 44% Water549 bar
tr= 0.407 minN = 5,514Log(t0/N)=-3.20
t0= 0.058 min
t0= 0.060 mintr= 0.474 minN = 6,194Log(t0/N)=-3.23
1.8um ZORBAX RRHDEclipse Plus C182.1x5cmF = 1.82 mL/min, 40°C59% ACN, 41% Water1003 bar

min0 20 40 60
mAU
0
50
100
150
200
250
min0 20 40 60
mAU
0
50
100
150
200
Long Analysis (55cm)
1.8um ZORBAX RRHDEclipse Plus C182.1x55cm (3x15cm, 10cm)F = 0.23 mL/min, 40°C59% ACN, 41% Water1001 bar
t0= 5.245 min
tr= 41.453 minN = 105189Log(t0/N)=-2.56
tr= 40.185 minN = 97,363Log(t0/N)=-2.49
2.7um Poroshell 120EC-C182.1x55cm (3x15cm, 10cm)F = 0.202 mL/min, 40°C56% ACN, 44% Water547 bar
t0= 4.729 min

Theoretical Poppe plot
Higher Efficiency
Faster Separation

Conclusions
Comparison under optimized conditions
1. Similar performance between Poroshell 120 at 550 bar and 1.8um ZORBAX RRHD at 1000 bar pressures
2. Increasing temperature tends to shift analysis toward slightly higher efficiencies, with a greater impact observed with Poroshell 120
3. More experimentation with other solvents, such as methanol, need to be evaluated to verify performance in a more viscous mobile phase environment
Sub-2 µm fully porous particleZORBAX RRHD Eclipse Plus C18
2.7 µm superficially porous particlePoroshell 120 EC-C18vs

Conclusions
For an HPLC (<600 bar), consider Poroshell 120
• Unless the chromatography requires scale-up in particle sizes
For a UHPLC, both choices are possible
• Consider the analysis goals: scalability, selectivity, loadability
• Sub 2µm will be an excellent choice for the highest pressure UHPLC systems
Which column option should be chosen?Sub 2µm totally porous or 2.7µm Poroshell 120

Acknowledgements
•Jia Liu1
•Hongli Wang1
•Sami Chaana1
•Charles Lofton1
•Xiaoli Wang2
1 Agilent Technologies2 AstraZeneca Pharmaceuticals