high temperature coarsening of cr2nb precipitates in · pdf filehigh temperature coarsening of...
TRANSCRIPT
NASA Contractor Report 198492
//
High Temperature Coarsening of Cr2NbPrecipitates in Cu-8 Cr-4 Nb Alloy
Kenneth Reed Anderson
University of California at Davis
Davis, California
June 1996
Prepared forLewis Research Center
Under Contract C-77166-B
Nalional Aeronautics and
Space Administration
https://ntrs.nasa.gov/search.jsp?R=19960028089 2018-05-19T06:28:19+00:00Z

Trade nmn_ or numufacturcrs' names arc used in _s rClx)rtfor idcntifica_ononly. This usagc dora not cor_titute an official _xlo_cmcnt. cithcr expressedor implied, by the National Aeronautics and Space Administration.
High Temperature Coarsening of Cr2Nb Precipitates in Cu-8 Cr-4 Nb Alloy
BY
Kenneth Reed Anderson
B. S. (University of California, Davis) 1992
THESIS
Submitted in partial satisfaction of the requirements for the degree of
MASTER OF SCIENCE
in
Engineering
in the
OFFICE OF GRADUATE STUDIES
of the
UNIVERSITY OF CALIFORNIA
Davis
Copyright by
KENNETH REED ANDERSON
1995

ACKNOWLEDGEMENTS
I would like to thank my parents, Darrell and Karen Anderson, for their support
and encouragement throughout my undergraduate and graduate career. I would like to
gratefully acknowledge the NASA/OAI Collaborative Student Summer Internship at the
NASA Lewis Research Center, Cleveland, Ohio, for its vital support and providing the
research opportunity which was paramount for the completion of this thesis. I would also
like to extend my deepest gratitude to David L. Ellis for supplying the material, Anita
Garg for her extensive help with TEM, David Hull, and Pat and Rob Dickerson, all at
NASA LeRC.
I would also like to give special thanks to Professors Jeff C. Gibeling and Subhash
Risbud for kindly taking part in my Thesis committee. Finally, I would like to give the
greatest thanks possible to my advisor, Joanna Groza for all of her continuous guidance,
support and patience of me and confidence in me.
-iii-
TABLE OF CONTENTS
ACKNOWLEDGEMENTS .................................................................................................................. iii
ABSTRACT ........................................................................................................................................... vi
1. INTRODUCTION .............................................................................................................................. 1
2. PARTICLE COARSENING .............................................................................................................. 5
2.1 THERMODYNAMICS OF PARTICLE COARSENING ...................................................................................... 5
2.1.1 Gibbs-Thomson Effect ................................................................................................................ 7
2.1.2 Induced Atom Fluxes (Concentration Gradients) ........................................................................ 8
2.2 COARSENING KINETICS MODELS -LSW-THEORY ................................................................................ I I
2.2.1 Volume Diffusion Controlled .................................................................................................... 11
2.2.2 Grain-Boundary Diffusion Controlled ...................................................................................... 13
2.2.3 Interface Reaction Controlled .................................................................................................. 15
2.3 MODIFICATIONS TO LSW THEORY ..................................................................... -................................ 17
3. AGING/COARSENING BEHAVIOR OF Cu-8 Cr-4 Nb ALLOY ................................................ 21
3.1 EXPEPdMENTAL PROCEDURE ............................................................................................................ 21
3.1.1 Materials ................................................................................................................................... 21
3.1.2 Specimen Preparation and Analytical Techniques .................................................................... 22
3.2 RESULTS AND OBSERVATIONS ........................................................................................................ 22
3.2.1 Precipitate Identification, Structure and Morphology ............................................................... 22
3.2.2 Cr2Nb Precipitate Coarsening ................................................................................................ 28
3.2.3 Matrix Grain Structure ............................................................................................................. 33
3.2.4 Oxygen Contamination ............................................................................................................. 36
3.3 DISCUSSION .................................................................................................................................... 37
-iV-
4.
3.3.1 Cr2Nb Precipitate Structure ..................................................................................................... 37
3.3.2 High Temperature Cr2Nb Stability/Coarsening Behavior ........................................................... 40
3.3.3 Cr-Rich and Nb-Rich Particle Precipitation�Formation ............................................................ 44
3.3.4 Grain-Boundary Pinning ........................................................................................................... 46
SUMMARY AND CONCLUSIONS ................................................................................................. 47
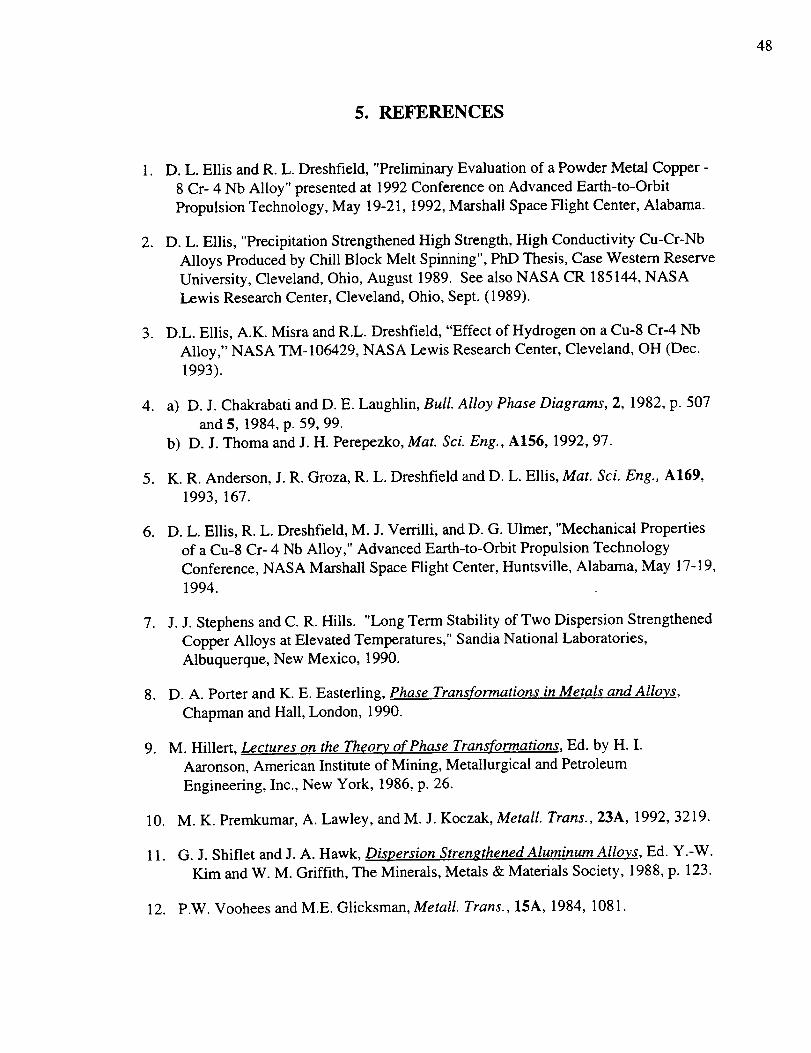
5. REFERENCES ................................................................................................................................. 48
APPENDIX 1 ......................................................................................................................................... 51
APPENDIX 2A ...................................................................................................................................... 52
APPENDIX 2B ...................................................................................................................................... 56
-v-
ABSTRACT
A new high-temperature-strength, high-conductivity Cu-Cr-Nb alloy with a Cr:Nb
ratio of 2:1 was developed to achieve improved performance and durability. The Cu-8 Cr-
4 Nb alloy studied has demonstrated remarkable thermal and microstructural stability after
long exposures at temperatures up to 0.98 T m. This stability was mainly attributed to the
slow coarsening kinetics of the Cr2Nb precipitates present in the alloy. At all
temperatures, the microstructure consists of a bimodal and sometimes trimodal
distribution of strengthening Cr2Nb precipitates, depending on precipitation condition, i.e.
from liquid or solid solution, and cooling rates. These precipitates remain in the same size
range, i. e. large precipitates of approximately 1 _tm, and small precipitates less than 300
nm, and effectively pin the grain boundaries thus retaining a free grain size of 2.7 I.tm after
100 h at 1323 K. (A relatively small number of Cr-rich and Nb-rich particles were also
present.) This grain boundary pinning and sluggish coarsening of Cr2Nb particles explain
the retention of good mechanical properties after prolonged holding at very high
temperatures, e. g., 75% of the original hardness after aging for 100 h at 1273 K.
Application of LSW-based coarsening models indicated that the coarsening kinetics of the
large precipitates are most likely governed by grain boundary diffusion and, to a lesser
extent, volume diffusion mechanisms.
-vi-
1. INTRODUCTION
In the past five to ten years, Cu-Cr-Nb alloys with the Cr:Nb ratio of 2" 1 developed
by NASA have received special attention as the next generation of high-temperature
strength high conductivity dispersion strengthened (DS) alloys [1,2]. Their retained high
thermal conductivity and inherent/characteristic high temperature strength make these
particular alloys prime candidates for a variety of actively cooled structures, including
plasma interactive components in fusion power systems, combustion chamber liners,
rocket nozzles, and heat exchangers. The strengthening is provided by the precipitation of
the hard Cr2Nb intermetallic compound, which is stable up to its congruent melting point
of 2006 K and is not soluble in solid copper. The Cr:Nb ratio of 2" 1 is selected such that
virtually all Cr and Nb combine to form the Cr2Nb compound to preserve the high thermal
conductivity of the pure copper matrix. Fully reacting the Nb with the Cr also avoids the
formation of Nb precipitates that are susceptible to hydrogen embrittlement. For this
purpose, an excess amount of chromium is sometimes preferred. By using a Cr-rich
CrENb precipitate, the activity of the Nb can be significantly lowered and the pressure
necessary for forming niobium hydrides greatly increased [3]. Also, as evidenced by the
Cu-Cr and Cu-Nb phase diagrams (see Figs. la and lb), chromium and niobium have
negligible solubility in Cu from 298 K up to 1200 K, which preserves the valuable thermal
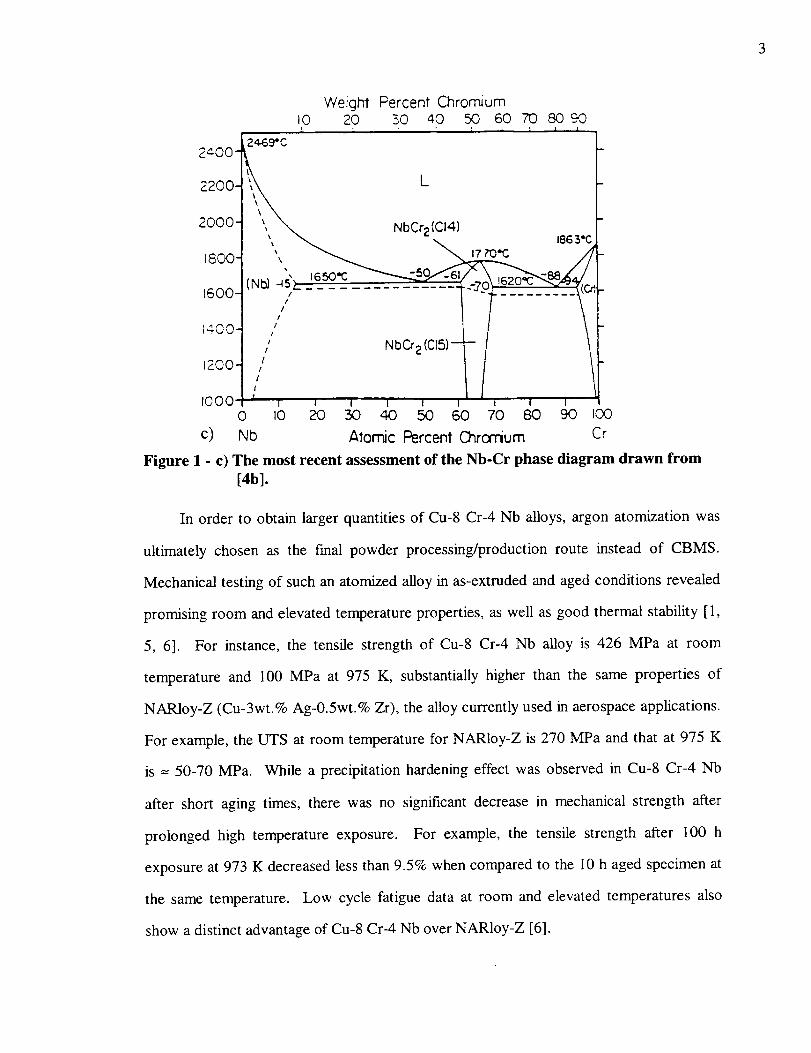
conductivity of copper. According to the Cr-Nb phase diagram, the Cr2Nb compound is
formed in a composition range from 62.78 to 68.08 at.% Cr (Fig. lc), thus allowing for
some compositional deviations from the Cr:Nb ratio of 2" 1.
Comparison of Cu-Cr-Nb alloys with different Cr and Nb content at the same 2" 1
Cr:Nb ratio indicated best overall combination of properties (e.g., conductivity, high
temperature behavior, etc.) for 8 at%Cr and 4 at%Nb (Cu-8 Cr-4 Nb) composition [2].
This comparison was carried out on the initial chill block melt spun (CBMS) Cu-Cr-Nb
_loys.

L;o
o
Weight Percent Chromium
i0 20 30 40 _0 60 70 eo 90 I00....., i , ' . _ I....._ [ r....i "'l I.... _ _ _ ' .. , ]
L
I07_C
1600-
1400 -
l_84.rPC /" *
iOl_.
--(Cu)
a) Cu
ses" r
s"
.i
LiI_°C
3O 40 ,50 f_ 7r0
Atomic Percent Chromium
(Cr)-'5_t
..a-
_ t_
Cr
_J
026OO
24-0O
Z2oo
zOO0
tsoo!
1400
1200-
t000-
800
b)
weight Percent Niobiumloo
L
_-(Cu)
....... L
1o ao
Cu
L
(Nb)-
" _o...._ _0 .... _'oAtomic Percent Niobium Nb
Figure 1 - a) The most recent assessment of the Cu-Cr phase diagram from [4a].
b) The most recent assessment of the Cu-Nb phase diagram from [4a].
Weight Percent ChromiumiO 20 30 40 50 60 70 80l
24.69. C "
2400-2200- L
2000- \\k NbCr2
1600- IN_ 45?_ ........... <70/z
1400- ,/
// NbO 2 (C15)-12_00-
I
ICO0 r I _ I i t0 I0 20 50 44D 50 60 70 80 90 I00
C) Nb Atomic Percent Chrorrium Cr
Figure 1 - c) The most recent assessment of the Nb-Cr phase diagram drawn from
[4b].
In order to obtain larger quantities of Cu-8 Cr-4 Nb alloys, argon atomization was
ultimately chosen as the final powder processing/production route instead of CBMS.
Mechanical testing of such an atomized alloy in as-extruded and aged conditions revealed
promising room and elevated temperature properties, as well as good thermal stability [ 1,
5, 6]. For instance, the tensile strength of Cu-8 Cr-4 Nb alloy is 426 MPa at room
temperature and 100 MPa at 975 K, substantially higher than the same properties of
NARloy-Z (Cu-3wt.% Ag-0.5wt.% Zr), the alloy currently used in aerospace applications.
For example, the UTS at room temperature for NARloy-Z is 270 MPa and that at 975 K
is = 50-70 MPa. While a precipitation hardening effect was observed in Cu-8 Cr-4 Nb
after short aging times, there was no significant decrease in mechanical strength after
prolonged high temperature exposure. For example, the tensile strength after 100 h
exposure at 973 K decreased less than 9.5% when compared to the 10 h aged specimen at
the same temperature. Low cycle fatigue data at room and elevated temperatures also
show a distinct advantage of Cu-8 Cr-4 Nb over NARloy-Z [6].
4
Details of microstructure-property relationships which substantiate the observed
good thermal stability up to 973 K have been reported [5]. Further mechanical testing
was performed at temperatures higher than 973 K, indicating unusually good thermal
stability up to temperatures approaching the melting point, e.g.. 1325 K, or 0.98 Tin.
These results are remarkable by comparison with other Cu-based DS alloys in which
particle coarsening or dissolution occurs causing excessive grain growth that compromises
the mechanical properties above 0.8 T m [7]. The objective of the present work is to assess
and gain understanding of this unusual high temperature behavior/stability via an
examination of the particle coarsening behavior of Cr2Nb in Cu-8 Cr-4 Nb alloy. This
examination involves particle size measurements and analyses, as well as studies of
microstructural features, of material aged at various conditions of temperature and time.
Particle coarsening/dissolution, or Ostwald ripening, is the primary focus since the
rate at which dispersed particles increase in average size can ultimately govern the rate of
degradation of superior material properties of such a DS alloy at elevated temperatures
(e.g., > 0.5Tin). In other words, study of the coarsening rate of a dispersed-particle phase
is essential since the Ostwald-ripening of the dispersed phase, along with any associated
grain growth, is a major factor in determining a DS alloy's resistance to degradation of its
enhanced thermo-mechanical properties. Such studies of the microstructural stability of
DS alloys is crucial, especially when considering prolonged high temperature exposure
(e.g. high service/testing temperatures involving creep deformation). The driving force for
the present particle coarsening study of a DS Cu alloy has now been established. But
before presenting results and analyses of this study, a background review of particle
coarsening is first in order.
2. PARTICLE COARSENING
2.1 THERMODYNAMICS OF PARTICLE COARSENING
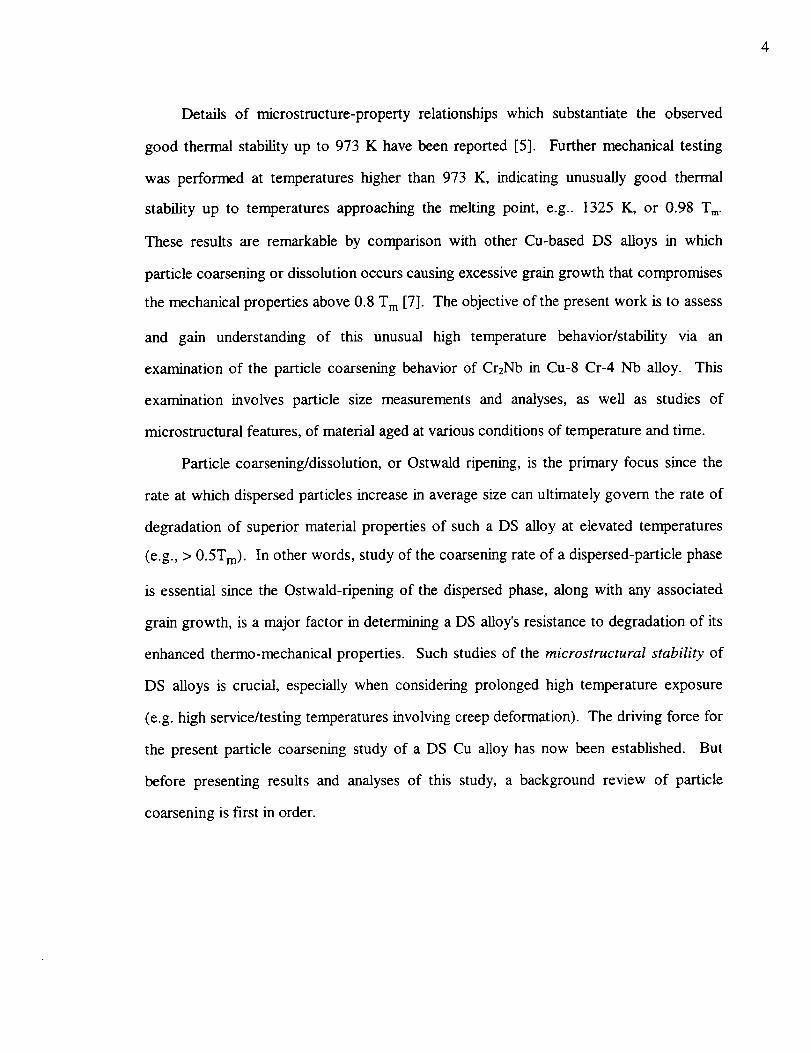
Coarsening considered here is particle growth after precipitation has taken place.
The driving force for this decomposition (precipitation) is the reduction in system free
energy associated with a metastable supersaturated solid solution transforming into a
stable two-phase mixture, as Fig. 2 shows. After this decomposition all B atoms in
°GCZ _¢x, _ B
0 °x;/,Figure 2 - Demonstration of the driving force at the start of a precipitation reaction
(taken from [9]).
supersaturated or-phase have transformed by nucleation and growth into second (13) phase,
leaving overall or-matrix with equilibrium concentration(s), C e, etc., as depicted in Fig. 3.
The thermodynamic driving force for virtually all particle coarsening is the decrease/
minimization of the total free energy, G, via the evolution of a lower overall specific
particle/matrix interfacial area due to the coarser precipitates. In other words, irrespective
of the mechanism which controls Ostwald ripening, it is reduction in total (surface) energy
in the system which drives the reaction. That is, the system is driven by the minimization
of ZTA, where y and A are the interfacial energy and area of the respective particles.
Furthermore, it has been shown by differential scanning calorimetry traces [ 10] that the
6
C
C
Ce
(Q)
CB
C
Ce
(b)
i-_-ii iI
i I
I I
I I
-I" ----I'--
i I
Distonce
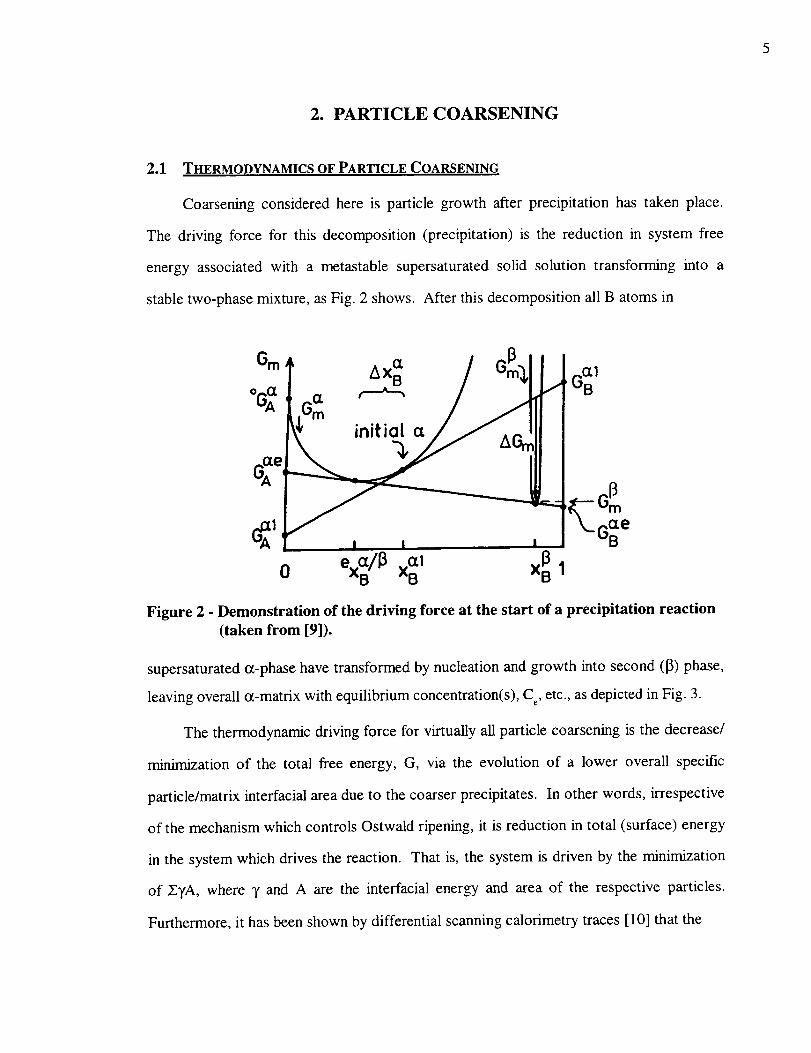
Figure 3 - a) Interference of growing precipitates due to overlapping diffusion fields
at later stage of growth;
b) Precipitate growth has stopped (taken from [8]).
free energy reduction associated with decreasing total surface area (energy) is manifested
by heat evolution; in other words, coarsening is an exothermic reaction.
As alluded to earlier, the microstructure of a two-phase alloy is necessarily out of
equilibrium if the total interfacial free energy is not minimized. In other words a system
with particles of different sizes is thermodynamically unstable due to large surface energy
effects. Larger particles having lower overall surface (interfacial) area tend to grow at the
expense of smaller precipitates, which tend to dissolve and shrink, thus giving an overall
lower system free energy. Therefore a high density of small precipitates will tend to
coarsen into a relatively lower density of larger particles. The thermal stability of
microstructure and, of coarse, the retention of strength at elevated temperatures, are
obviously enhanced by slowing this coarsening process.
7
2.1.1 Gibbs-Thomson Effect
As mentioned by Porter and Easterling [8, p.315], in any precipitation hardened
material there will be a range of particle sizes due to differences in the nucleation time and
growth rates. Due to a capillarity effect or the Gibbs-Thomson effect, the solute (B)
concentration in the matrix adjacent to a particle will increase as the radius of curvature
decreases. This follows from the fact that solute solubility depends exponentially on a
free energy difference, AG. This Gibbs free energy difference is increased by the factor
27/r -- which is due to associated interfacial energies and radii of particles -- which
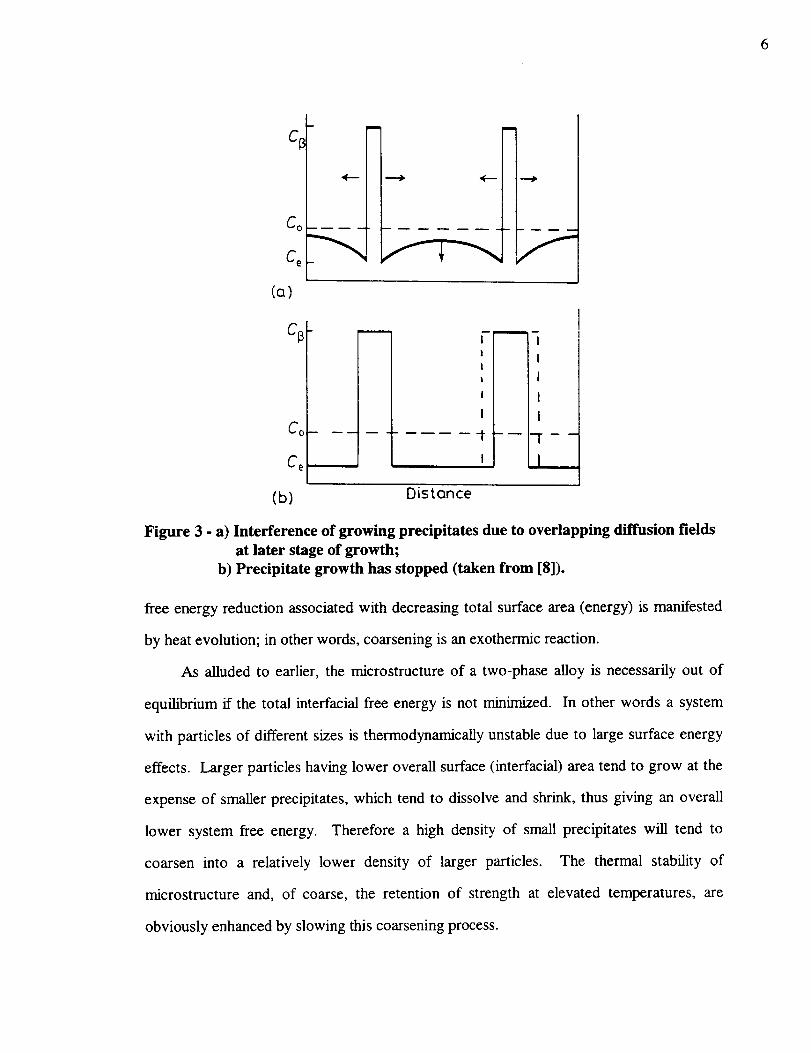
subsequently increases the solute solubility [8]. Figure 4 below shows two adjacent
spherical particles with different diameters. The smaller particle will experience a greater
Co(l+ 2oV,./rtRT] II
L=Y'Co(I + 2_V,./rRTJ /
Figure 4 - Two [3 particles (radii r_ and rz) in an _ matrix. Local equilibrium is
assumed to exist at the respective particle-matrix interfaces so that C(rl)>
C(r) > C(r2). This leads to transfer of 13atoms to the matrix from the
smaller particle and its subsequent dissolution. The opposite process
occurs in the region of the matrix/large particle interface. The
characteristic diffusion distance is proportional to the particle radius
(taken from [11]).
increase in free energy (larger capillarity effect, 2T/r) than the larger particle - compared to
a particle of infinite radius - causing the enhanced solute concentration in the matrix at the
smaller particle. This effect of 27/r on solubility is depicted graphically in Figs. 5 and 6
below and given in the following equation form:

C,=C_ (1 + 2)'Vm_"-L rRT )
where C r = the equilibrium solubility of a particle of radius r (m);
Ce, _ = the equilibrium solubility of infinite radius;
y = the dispersoid/matrix interracial energy in Jim2;
V m = the molar volume of the particle in m3/mole;
R = 8.314 J/mol.K; and
T = absolute temperature in degrees Kelvin (K).
(1)
2.1.2 Induced Atom Fluxes (Concentration Gradients )
Coarsening occurs as a result of the concentration gradient that develops between
particles of different sizes (Gibbs-Thomson effect, Fig. 4). As Fig. 5 shows, smaller
particles do indeed increase the free energy relative to the larger particles, thus affecting
(o)
G
(b_
fg_
(_.x_ x2.(_
/"1 /'2
' G_(r2)X Ix i
Ga / ""
',._.
I 1)(1 X 2 Xa
Figure 5 I a) and b) The origin of particle coarsening. [3 with a small radius of
curvature (r2) has a higher molar free energy than [3 with a large radius
of curvature (r0. The concentration of solute is therefore highest outside
the smallest particles (taken from [8]).
9
local composition differently which, of course, induces interparticle diffusion flow due to
effective concentration gradient. For example, the flux of B atoms can be expressed as:
where DB = the diffusivity of B in o_ in cm2/s;
AC = a change in concentration in atoms/cm3; and
Ax = a change in distance (or interval) in cm.
DB can be further expressed in the following expanded Arrhenius form:
(2)
DB = Do.s exp(-R_ ) cmZ/s, (3)
where Do = pre-exponential material constant in cmZ/s;
Q = the activation energy for diffusion in J/mol; and
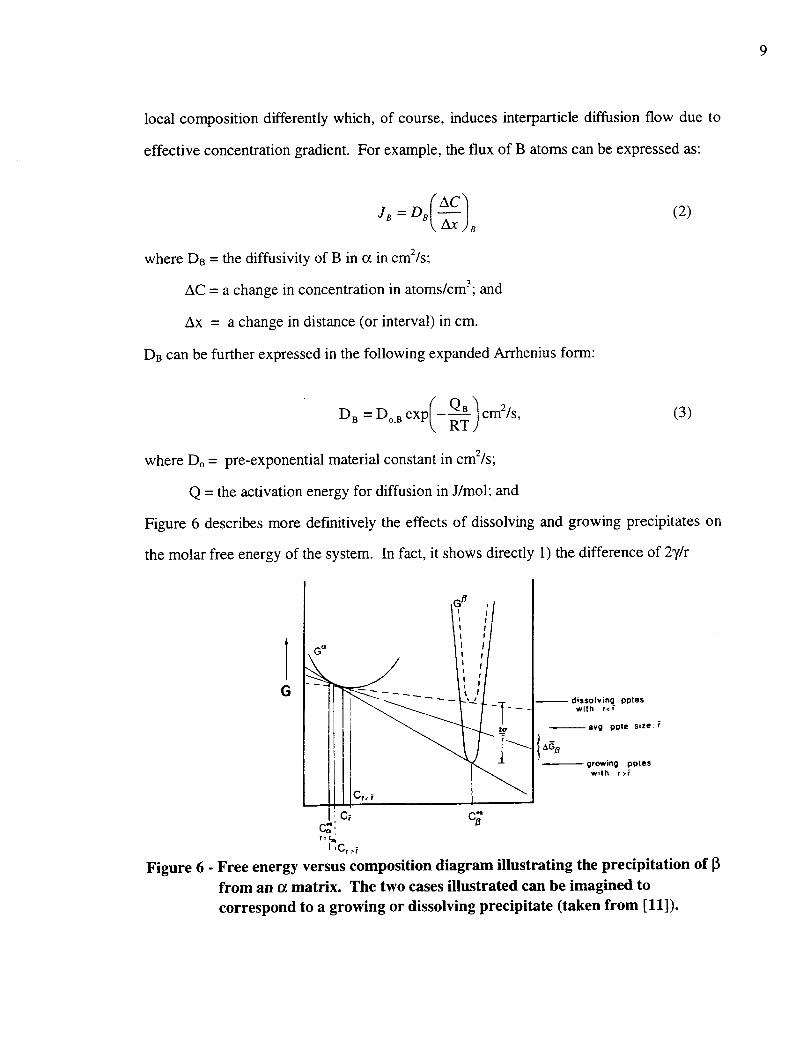
Figure 6 describes more definitively the effects of dissolving and growing precipitates on
the molar free energy of the system. In fact, it shows directly 1) the difference of 2T/r
Gk° - /J\i :/
fll"=_Cr_._
dissolving 1oples
with r</"
--svg ppte size: F
_ growing pDtes
with r>r
Figure 6 - Free energy versus composition diagram illustrating the precipitation of [_
from an _ matrix. The two cases illustrated can be imagined to
correspond to a growing or dissolving precipitate (taken from [11]).
10
between the free energy of particles having smaller and larger radii than the average; and
2) how the respective interfacial solute concentrations relate to those for r = _ and r = g.
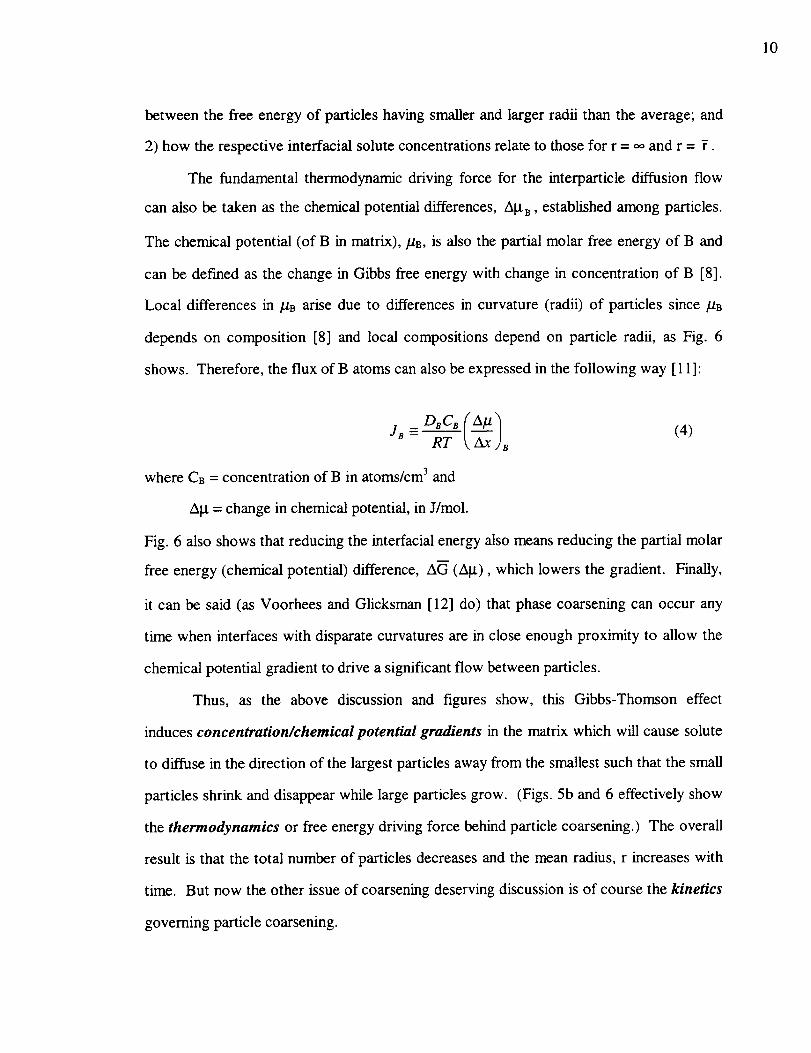
The fundamental thermodynamic driving force for the interparticle diffusion flow
can also be taken as the chemical potential differences, AgB, established among particles.
The chemical potential (of B in matrix),/.tB, is also the partial molar free energy of B and
can be defined as the change in Gibbs free energy with change in concentration of B [8].
Local differences in #B arise due to differences in curvature (radii) of particles since/.tB
depends on composition [8] and local compositions depend on particle radii, as Fig. 6
shows. Therefore, the flux of B atoms can also be expressed in the following way [ 11 ]:
DBCBJ8 =
RT
where CB = concentration of B in atoms/cm 3 and
Akt = change in chemical potential, in J/mol.
Fig. 6 also shows that reducing the interfacial energy also means reducing the partial molar
free energy (chemical potential) difference, AG (A_), which lowers the gradient. Finally,
it can be said (as Voorhees and Glicksman [12] do) that phase coarsening can occur any
time when interfaces with disparate curvatures are in close enough proximity to allow the
chemical potential gradient to drive a significant flow between particles.
Thus, as the above discussion and figures show, this Gibbs-Thomson effect
induces concentration�chemical potential gradients in the matrix which will cause solute
to diffuse in the direction of the largest particles away from the smallest such that the small
particles shrink and disappear while large particles grow. (Figs. 5b and 6 effectively show
the thermodynamics or free energy driving force behind particle coarsening.) The overall
result is that the total number of particles decreases and the mean radius, r increases with
time. But now the other issue of coarsening deserving discussion is of course the kinetics
governing particle coarsening.

11
2.2 COARSENING KINETICS MODELS -LSW-THEORY
The first real efforts to theoretically and quantitatively describe the coarsening
behavior of a dispersed second phase in a parent matrix were made by Lifshitz and
Slyozov [13] and Wagner [14]. Although the LSW theory was developed to model the
kinetics of precipitate growth from supersaturated solid solutions after the completion of
nucleation, it may also apply to other methods of particle incorporation (e.g. mechanical
alloying and internal oxidation) as well as to coarsening of grains in liquid-phase sintering
[15-18] and to the coarsening of pores in solid state sintering [19,20]. It was also based
on a zero volume percent of coarsening phase approximation. One important prediction
of the LSW theory is the existence and specific shape of an asymptotic particle size
distribution (PSD), or histogram. In fact, LSW theory 'predicts' this interesting
phenomenon of a "quasi steady state" particle-size distribution evolving no matter what
the initial distribution (later shown in Fig. 11).
2.2.1 Volume Diffusion Controlled
Another important prediction of the LSW theory involves coarsening which is
volume diffusion controlled (VDC). The coarsening rate of incoherent particles will be
effectively VDC since the interface mobility of such particle/matrix interfaces is very high
[8]. LSW predicts that the average particle radius is proportional to t 1/3 ( or T3 o_ t) with
the constant of proportionality, i.e. the rate constant, dependent only on material
parameters [12]. The exact form of this relationship as derived for spherical particles
usually takes the following form [21]:
r,-r o- ' t=Kt (5)9RT
where 7, = average particle radius at time t;
7o = average particle radius at the onset of coarsening;
12
D = diffusivity of ratecontrollingsolutein thematrix; and
Ce,_= equilibriumsolubility of therate-controllingsolutein thematrix.
The numericalfactor of 8/9 in Eqn. (5) comesaboutsincethisLSW equationfor the rate
of changeof meanradiusof thedispersionwith timerequiresthat the PSDhasassumeda
specificform which is characteristicof thecoarseningof precipitatesat thetime t = 0 and
that the supersaturationof the matrix hasdecreasedto a levelwhereequilibriumexistsat
the matrix/particleinterface[22]. As anaside,VoorheesandGlicksmanhaveexpressed
amazementat the ideathat particlesoriginallydistributedrandomlythroughouta matrix
will spontaneouslycoarsen such that their sizes collectively tend toward a fixed
(asymptotic)sizedistribution(relativeto theaverageandaftera sufficientlylongtime) and
displayanaveragewhichgrowsasthecuberootof time [12].
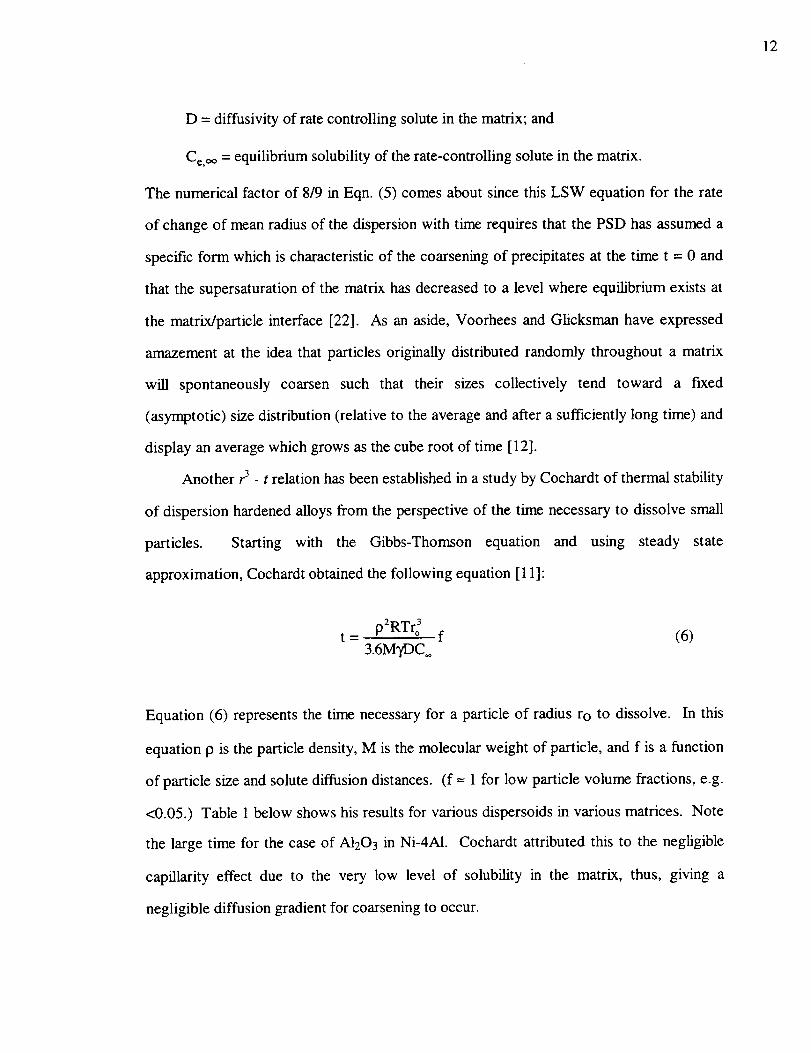
Anotherr3 - t relation has been established in a study by Cochardt of thermal stability
of dispersion hardened alloys from the perspective of the time necessary to dissolve small
particles. Starting with the Gibbs-Thomson equation and using steady state
approximation, Cochardt obtained the following equation [11 ]:
t= pERTr°3 f (6)3.6M_DC.
Equation (6) represents the time necessary for a particle of radius ro to dissolve. In this
equation p is the particle density, M is the molecular weight of particle, and f is a function
of particle size and solute diffusion distances. (f = 1 for low particle volume fractions, e.g.
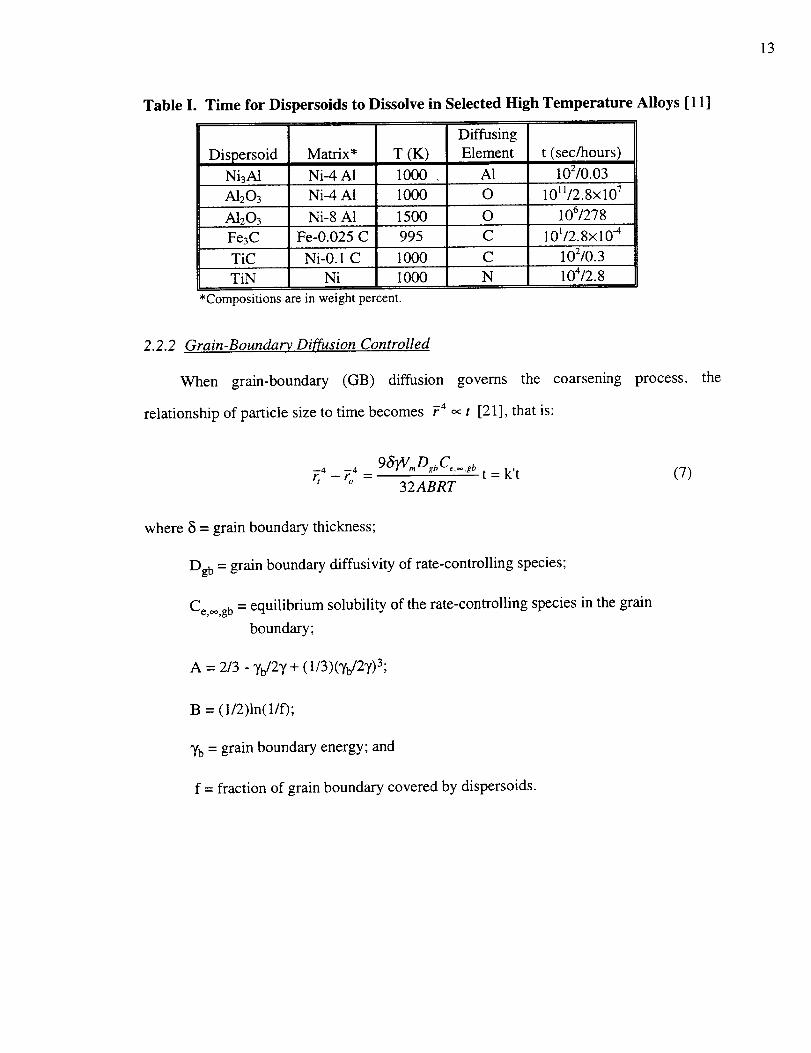
<0.05.) Table 1 below shows his results for various dispersoids in various matrices. Note
the large time for the case of A1203 in Ni-4AI. Cochardt attributed this to the negligible
capillarity effect due to the very low level of solubility in the matrix, thus, giving a
negligible diffusion gradient for coarsening to occur.
13
Table I. Time for Dispersoids to Dissolve in Selected High Temperature Alloys [ 11 ]
Diffusing
Dispersoid
NisA1
A1203
A1203
Matrix*
Ni-4 A1
Ni-4 AI
Ni-8 At
T (K)
1000 ,
1000
1500
Element
AI
O
O
C
t (sec/hours)
102/0.03
1011/2.8x107
106/278
Fe3C Fe-0.025 C 995
TiC Ni-0.1 C 1000 C 102/0.3
TiN Ni 1000 N 104/2.8
*Compositions are in weight percent.
101/2.8x10 _
2.2.2 Grain-Boundary Diffusion Controlled
When grain-boundary (GB) diffusion governs the coarsening
relationship of particle size to time becomes _4 ¢< t [21], that is:
process, the
95_V,, D gbC_ _ _b_4 _'¢: '' t=k't
32ABRT(7)
where 5 = grain boundary thickness;
Dg b = grain boundary diffusivity of rate-controlling species;
Ce,,,o,gb = equilibrium solubility of the rate-controlling species in the grain
boundary;
A = 2/3 - 7b/2Y + ( 1/3)(Yb/27)3;
B = (1/2)In(I/f);
Yb = grain boundary energy; and
f = fraction of grain boundary covered by dispersoids.
14
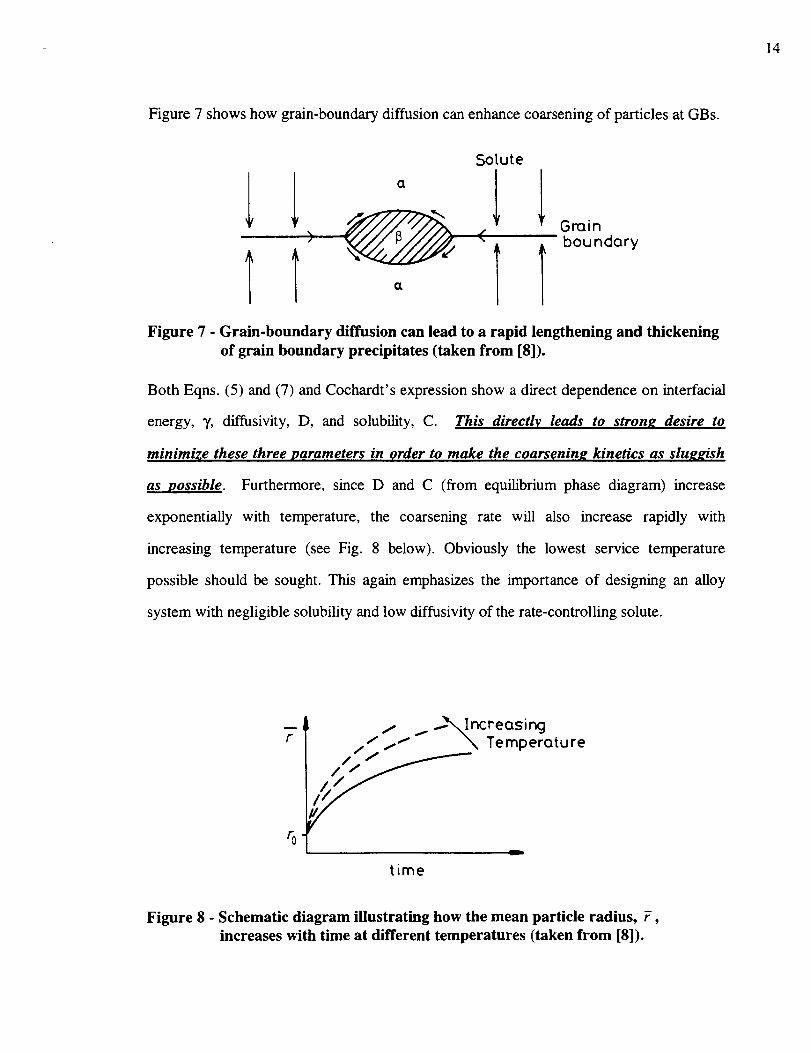
Figure 7 shows how grain-boundary diffusion can enhance coarsening of particles at GBs.
Sol.ute
' ' /_'//////'///>, Groin
) _ < boundary
Figure 7 - Grain-boundary diffusion can lead to a rapid lengthening and thickening
of grain boundary precipitates (taken from [8]).
Both Eqns. (5) and (7) and Cochardt's expression show a direct dependence on interfacial
energy, T, diffusivity, D, and solubility, C. This directly leads to strong desire to
minimi_e these three parameters in order to make the coarsening kinetics as sluggish
as possible. Furthermore, since D and C (from equilibrium phase diagram) increase
exponentially with temperature, the coarsening rate will also increase rapidly with
increasing temperature (see Fig. 8 below). Obviously the lowest service temperature
possible should be sought. This again emphasizes the importance of designing an alloy
system with negligible solubility and low diffusivity of the rate-controlling solute.
/-_ _x.Increosing
//_Ir _ Temperature
time
Figure 8 - Schematic diagram illustrating how the mean particle radius, F,
increases with time at different temperatures (taken from [8]).

15
2.2.3 Interface Reaction Controlled
Finally, a third version of the LSW formula is for the situation when coarsening is
governed by an interface reaction controlled (IRC) process. This is the condition when
the rate limiting step is atomic attachment or detachment at the particle/matrix interface,
i.e. the growth process is the transfer (flux) of the dispersoid species across the particle-
matrix interface. The coarsening rate of coherent and semicoherent particles will be
effectively IRC since the interface mobility of such particle/matrix interfaces is very low
[8]. For this case a linear relationship between the average radius squared and the
coarsening rate was shown by Wagner [14] to be described as:
_: _ ?02= 647VmCe.- k t = K't (8)81RT
where k is the interphase boundary reaction constant. Coarsening of coherent or partially
coherent particles is usually modeled as a ledge migration mechanism, which has been
described by Shiflet and Hawk [11]. They point out that in most solid-solid systems
precipitates develop specific crystallographic orientation relationships with the parent
matrix due to constraints imposed by nucleation. These orientation relationships often
result in the formation of low energy fully or partially coherent interfaces. The growth
kinetics (or dissolution) of such an interface is accomplished through the lateral migration
of stepped terraces, or ledges (Figures 9 & 10). The growth kinetics of these interfaces
depend on ledge nucleation kinetics, ledge height, volume diffusion to the interface, and
the complicated diffusion and elastic fields near the ledge.
16
-- coherent patch
I__disordered
"_"" X ___--__riser
motion of
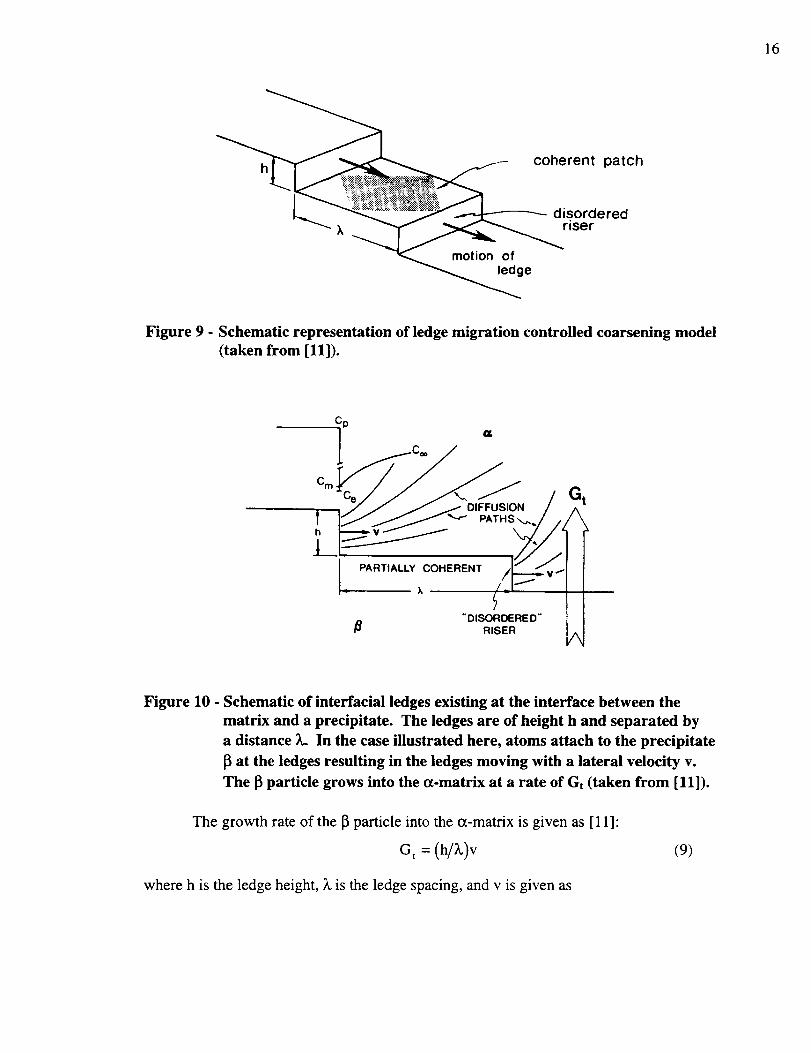
Figure 9 - Schematic representation of ledge migration controlled coarsening model
(taken from [11]).
Cp
C= /
O[
"OlSOROERED"
,_ RISER /_
Figure 10 - Schematic of interfacial ledges existing at the interface between the
matrix and a precipitate. The ledges are of height h and separated by
a distance X. In the case illustrated here, atoms attach to the precipitate
at the ledges resulting in the ledges moving with a lateral velocity v.
The [3particle grows into the o_-matrix at a rate of Gt (taken from [11]).
The growth rate of the _ particle into the o_-matrix is given as [11]:
G t = (h/_,)v (9)
where h is the ledge height, _, is the ledge spacing, and v is given as
17
D C-Cov = - (10)
cth Cp - C e
where o_ is an effective diffusion distance. The growth rate expression assumes that the
average value of the step spacing, X, is large enough so that the step velocity is not altered
due to the presence of neighboring steps. The main ledge sources (nucleation sites) result
from (1) two-dimensional nucleation; (2) dislocations, either interphase or intruder type;
and (3) boundary dislocations [11]. In general, ledge heights and spacings are
unpredictable. As Shiflet and Hawk state, from a practical point of view, it would be
useful to understand the mechanistics of ledge nucleation, for without ledges the
coarsening of partially coherent precipitates would be effectively halted.
Finally, it can be noted here that if diffusion and interface controlled processes occur
simultaneously then none of the above formulas will give a complete (or accurate)
description of the coarsening kinetic behavior, which could help explain disagreement
between experimental results and theoretical (LSW) prediction(s). As discussed next, the
origin of the LSW expression(s) leads to other likely reasons for such disagreements.
2.3 MODIFICATIONS TO LSW THEORY
Originally, the LSW coarsening prediction was developed for infinitely dilute liquid
phase systems. This could also definitely help explain deviations or apparent
disagreements usually found between experimental results and the LSW prediction.
Possible explanations for such disagreements necessarily include, among others, the LSW
theory neglecting a finite particle volume fraction and much of the difficulty of having
crystalline precipitates in a solid matrix, such as induced strain fields that are not present in
liquid phases. Voorhees and Glicksman [12] state that "volume fraction dependence arises
form particle-particle interactions which, intuitively, should permit faster diffusional
transfer among particles by virtue of their finite separation." Various modifications to the
LSW theory incorporating finite (increasing) volume fraction effects have been proposed
18
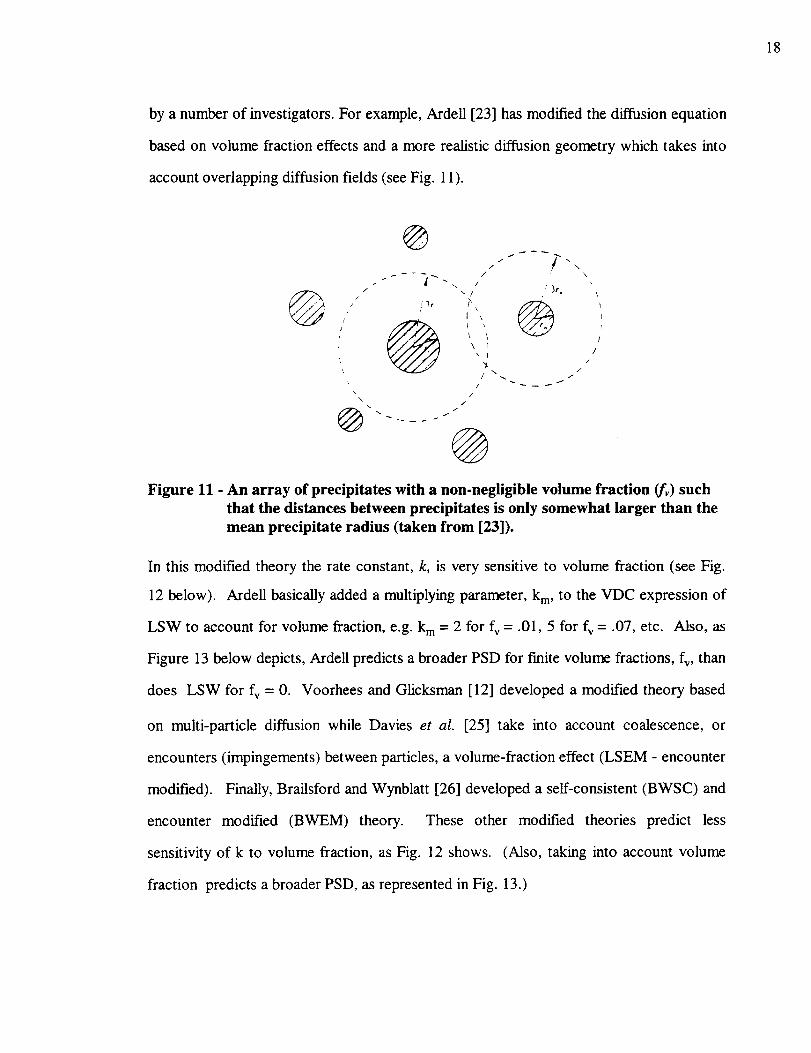
by a number of investigators. For example, Ardell [23] has modified the diffusion equation
based on volume fraction effects and a more realistic diffusion geometry which takes into
account overlapping diffusion fields (see Fig. 11).
//
©/ /
/
@
I
\
\
\
/ \
-, / ,!3r.
\ I
3t // \ /
/
/\ /
@Figure 11 - An array of precipitates with a non-negligible volume fraction (fv) such
that the distances between precipitates is only somewhat larger than the
mean precipitate radius (taken from [23]).
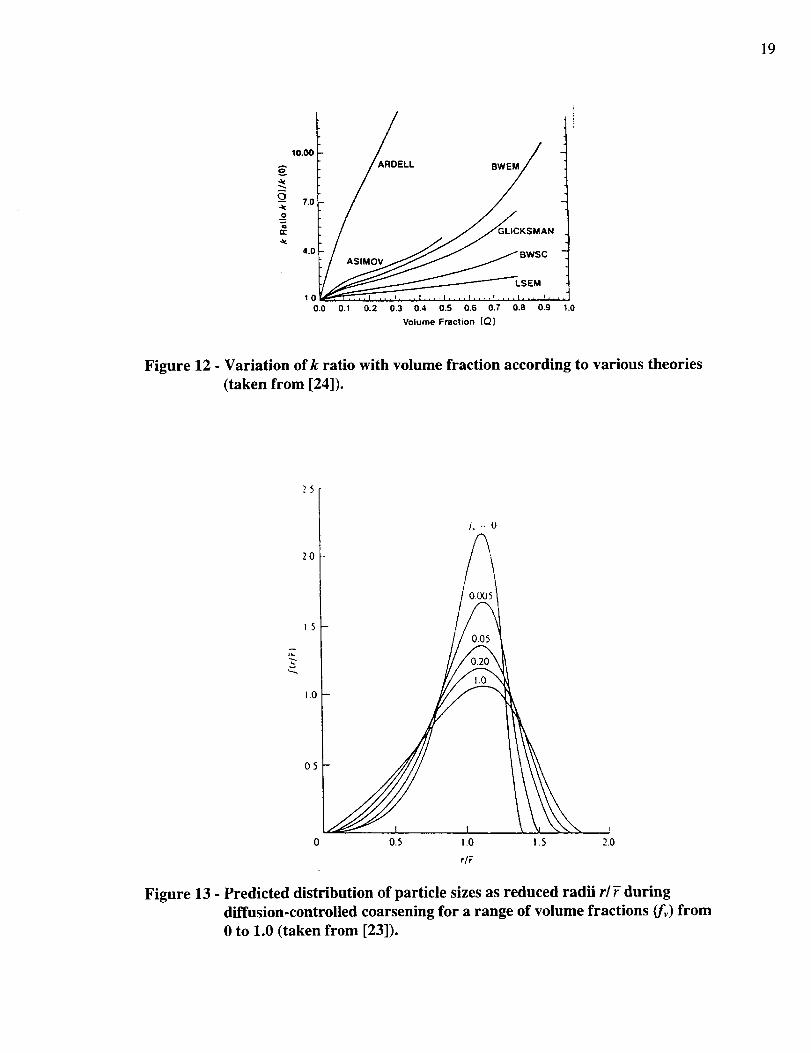
In this modified theory the rate constant, k, is very sensitive to volume fraction (see Fig.
12 below). Ardell basically added a multiplying parameter, km, to the VDC expression of
LSW to account for volume fraction, e.g. k m = 2 for fv = .01, 5 for fv = .07, etc. Also, as
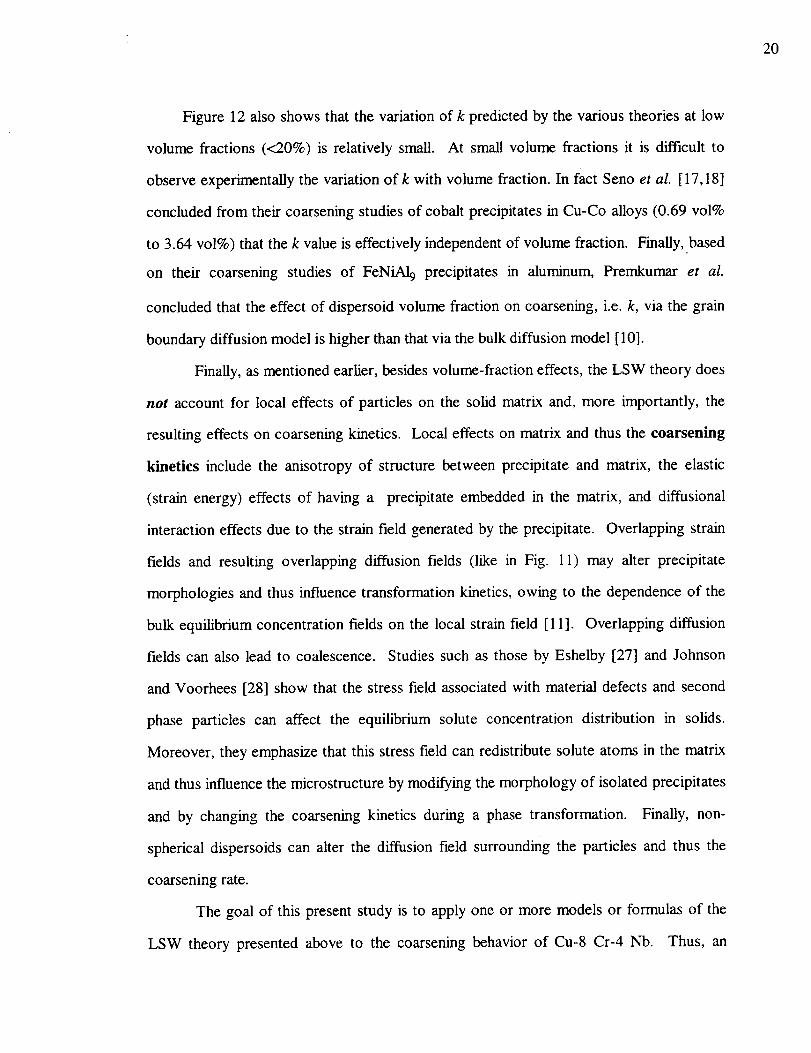
Figure 13 below depicts, Ardell predicts a broader PSD for finite volume fractions, fv, than
does LSW for fv = 0. Voorhees and Glicksman [12] developed a modified theory based
on multi-particle diffusion while Davies et al. [25] take into account coalescence, or
encounters (impingements) between particles, a volume-fraction effect (LSEM - encounter
modified). Finally, Brailsford and Wynblatt [26] developed a self-consistent (BWSC) and
encounter modified (BWEM) theory. These other modified theories predict less
sensitivity of k to volume fraction, as Fig. 12 shows. (Also, taking into account volume
fraction predicts a broader PSD, as represented in Fig. 13.)
19
o
(3a¢
.9
10.00
7.0
4.0
1.00.0
ARDELL BWEM
GLICKSMAN ,
BWS I -
0.1 0.2 0.3 0.4 O.S 0.6 0.7 0.8 0.9 1.0
Volume Fraction (Q}
Figure 12 - Variation ofk ratio with volume fraction according to various theories
(taken from [24]).
v
20
l0
0 0.5 1.0 I .S 20
r/F
Figure 13 - Predicted distribution of particle sizes as reduced radii rl 7 during
diffusion-controlled coarsening for a range of volume fractions (fv) from
0 to 1.0 (taken from [23]).
20
Figure 12 also shows that the variation of k predicted by the various theories at low
volume fractions (<20%) is relatively small. At small volume fractions it is difficult to
observe experimentally the variation of k with volume fraction. In fact Seno et al. [17,18]
concluded from their coarsening studies of cobalt precipitates in Cu-Co alloys (0.69 vol%
to 3.64 vol%) that the k value is effectively independent of volume fraction. Finally, based
on their coarsening studies of FeNiAI 9 precipitates in aluminum, Premkumar et al.
concluded that the effect of dispersoid volume fraction on coarsening, i.e. k, via the grain
boundary diffusion model is higher than that via the bulk diffusion model [10].
Finally, as mentioned earlier, besides volume-fraction effects, the LSW theory does
not account for local effects of particles on the solid matrix and, more importantly, the
resulting effects on coarsening kinetics. Local effects on matrix and thus the coarsening
kinetics include the anisotropy of structure between precipitate and matrix, the elastic
(strain energy) effects of having a precipitate embedded in the matrix, and diffusional
interaction effects due to the strain field generated by the precipitate. Overlapping strata
fields and resulting overlapping diffusion fields (like in Fig. 11) may alter precipitate
morphologies and thus influence transformation kinetics, owing to the dependence of the
bulk equilibrium concentration fields on the local strain field [ 11 ]. Overlapping diffusion
fields can also lead to coalescence. Studies such as those by Eshelby [27] and Johnson
and Voorhees [28] show that the stress field associated with material defects and second
phase particles can affect the equilibrium solute concentration distribution in solids.
Moreover, they emphasize that this stress field can redistribute solute atoms in the matrix
and thus influence the microstructure by modifying the morphology of isolated precipitates
and by changing the coarsening kinetics during a phase transformation. Finally, non-
spherical dispersoids can alter the diffusion field surrounding the particles and thus the
coarsening rate.
The goal of this present study is to apply one or more models or formulas of the
LSW theory presented above to the coarsening behavior of Cu-8 Cr-4 Nb. Thus, an
21
attempt is madeto determinesuchparametersas K, k', and K', which have not been
calculatedor empiricallydeterminedfor thissystemasof yet. Gaininganunderstandingof
whatmechanismsgoverntheparticle/microstructuralstabilityof thispromisingCu-8 Cr-4
Nb alloy is keyfor its ultimatepotentialfor vital applicationsin aerospace/energysystems.
3. AGING/COARSENING BEHAVIOR OF Cu-8 Cr-4 Nb ALLOY
3.1 EXPERIMENTAL PROCEDURE
3.1.1 Materials
The samples used in the present investigation were from Cu-8 Cr-4 Nb bars
produced by extruding cans of the powder. The chemical composition of the atomized
powder supplied by Special Metals, Inc. was 6.5 wt% (7.97 at.%) Cr and 5.5 wt% (3.77
at.%) Nb with 260 ppm oxygen. All samples were made from Cu-8 Cr-4 Nb powder less
than 106 !am in diameter which was canned in 5.08 cm diameter mild steel cans. The cans
were extruded at 1133 K using a round die with 16:1 reduction in area. The final diameter
of the extruded can was approximately 12.7 mm with a Cu-8 Cr-4 Nb core approximately
9.5 mm in diameter.
The extruded specimens were heat treated for 1, 10, 50 and 100 hours at 1073,
1173, 1273 and 1323 K. Air cooling at about 4 K/s was used for all specimens except for
the 1323 K heat treatment. In the latter case, furnace cooling at about 1 K/s was used.
The copper materials remained in the steel cans during the entire heating cycle. Diffusion
of Fe into the alloy resulted in the formation of a Cr-Fe rich diffusion zone near the
can/alloy interface [6]. The diffusion zone appeared to be limited to a few hundred
nanometers at most. During machining the diffusion zone was completely removed.
Microscopic examinations of the aged samples were undertaken in regions close to the
center of the samples to avoid any effects of the diffusion zone.
22
3.1.2 Specimen Preparation and Analytical Techniques
As-atomized powders, as-extruded, and extruded and heat treated specimens were
mounted and prepared by standard metallographic techniques for optical microscopy. A
solution of 20 ml 3% hydrogen peroxide, 25 ml ammonium hydroxide, 25 ml distilled
water, and four pellets of sodium hydroxide at room temperature was used for etching [2].
Samples for transmission electron microscopy (TEM) were cut perpendicular to the
extrusion direction. The samples were mechanically thinned to -125 ktm using a Gatan
lapping fLxture. The final electrolytic thinning was performed using a methanol-20 %
nitric acid bath at a temperature below 220 K and applying 10-15 V to the samples. Most
thin foils revealed oxide and/or debris formation and redeposition during electrolytic
thinning. These foils were further cleaned in a Gatan ion mill using 5 keV argon ions and
a current of 0.5 mA.
For TEM analysis, a Phih'ps EM400T electron microscope operated at 120 kV was
used. The precipitates were characterized using convergent beam analysis, SAD patterns
and XEDS spectra. Particle identification and counting was performed using TEM for
small particles and SEM for large particles. At least 200 particles per specimen were
counted. Particle measurements of TEM and SEM images were done using a Leica
Quantimet 500 Image Analysis System. In addition, Vickers microhardness (HV)
measurements, with 100g load and 10 second dwell time have been made for 100 h
treatments between 973 and 1323 K.
3.2 RESULTS AND OBSERVATIONS
3.2.1 Precipitate Identification, Structure and Morphology
The predominant second phase identified was stoichiometrically desired Cr2Nb
precipitates. Electron diffraction (Appendix 1) revealed that the Cr2Nb precipitates in this
Cu-8 Cr-4Nb alloy are predominantly the lower temperature C15 Laves fcc phase -- with
23
unit cell. As an aside description of this precipitate phase, the Laves phases (C14, C15,
C36) are the most common structural types amongst the intermetalLics. Metallic
compounds tend to form with close packing of atoms, high atomic symmetry, and metallic
nature of bonding [29]. Laves phases satisfy these conditions more efficiently than other
intermetallic structure types. The highest configurational and symmetrical arrangement of
atoms in the AB 2 Laves phases requires rA/r B = 1.1 - 1.6 [29]. In the present case, rNb/rcr
= 1.43nm/1.25nm = 1.144. This positioning of atoms results in four layer stacking
sequences in the close packed directions, i.e. XYZ .... where X, Y, and Z represent closed-
packed layers, similar to an fcc structure; however each layer is composed of four
interpenetrating atomic layers [30].
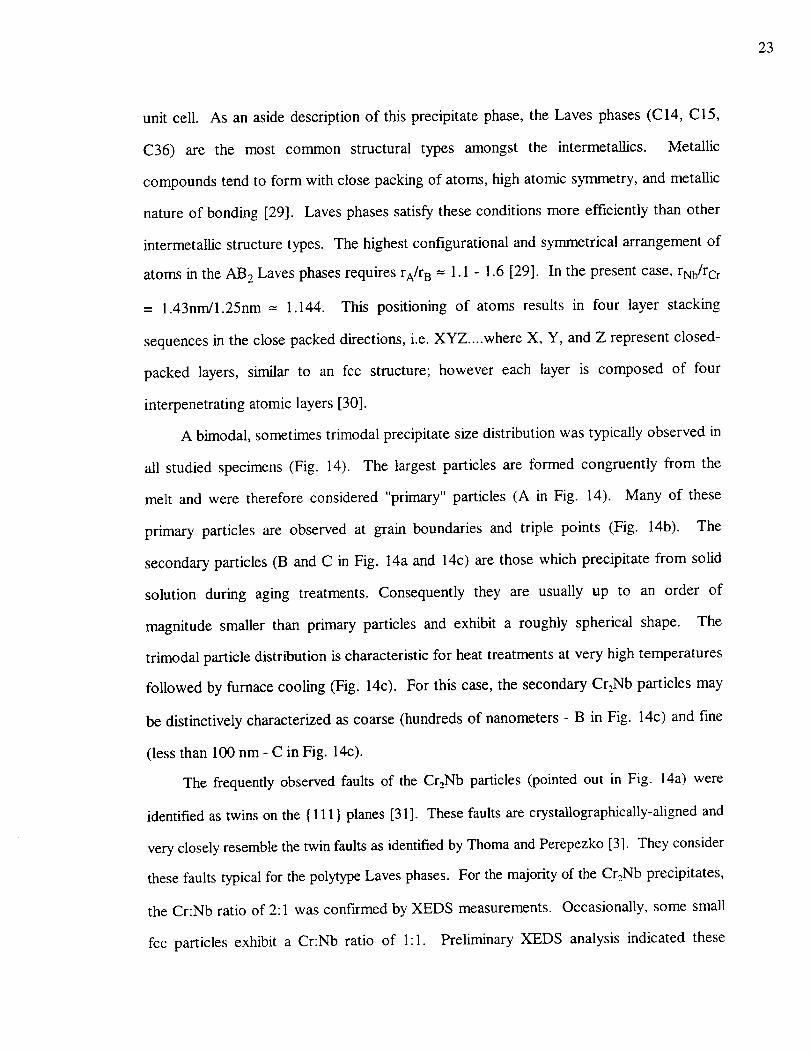
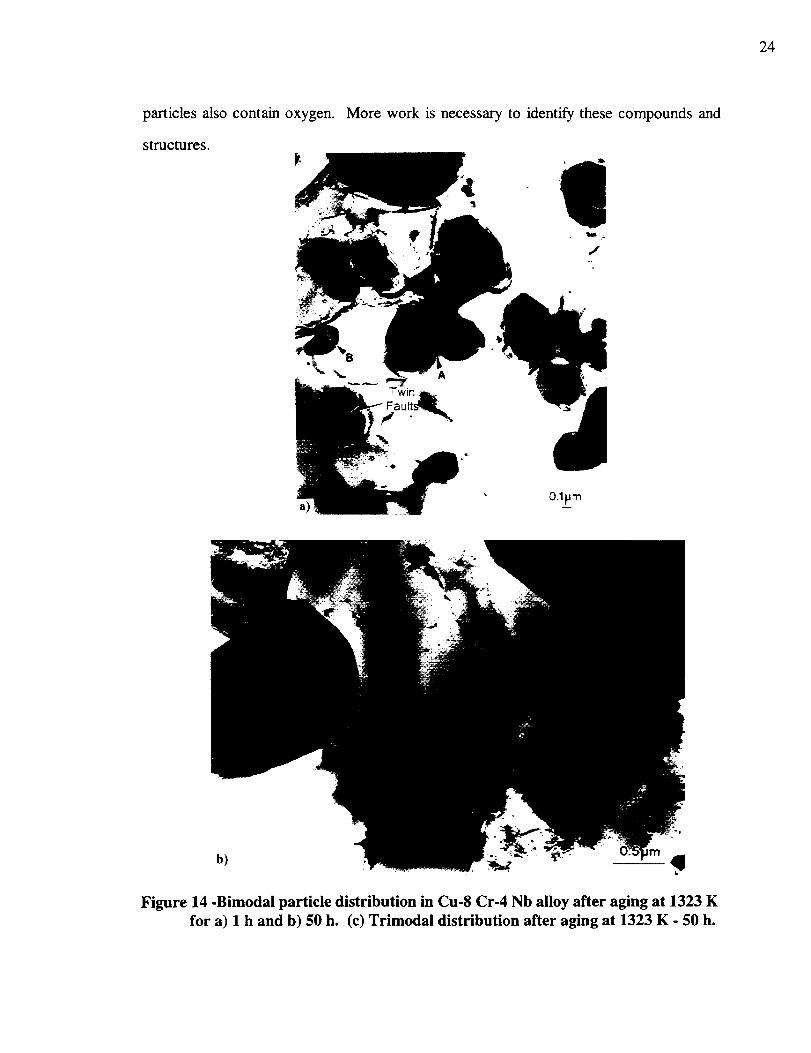
A bimodal, sometimes trimodal precipitate size distribution was typically observed in
all studied specimens (Fig. 14). The largest particles are formed congruently from the
melt and were therefore considered "primary" particles (A in Fig. 14). Many of these
primary particles are observed at grain boundaries and triple points (Fig. 14b). The
secondary particles (B and C in Fig. 14a and 14c) are those which precipitate from solid
solution during aging treatments. Consequently they are usually up to an order of
magnitude smaller than primary particles and exhibit a roughly spherical shape. The
trimodal particle distribution is characteristic for heat treatments at very high temperatures
followed by furnace cooling (Fig. 14c). For this case, the secondary Cr2Nb particles may
be distinctively characterized as coarse (hundreds of nanometers - B in Fig. 14c) and f'me
(less than 100 nm- C in Fig. 14c).
The frequently observed faults of the Cr2Nb particles (pointed out in Fig. 14a) were
identified as twins on the { 111 } planes [31]. These faults are crystallographically-aligned and
very closely resemble the twin faults as identified by Thoma and Perepezko [3]. They consider
these faults typical for the polytype Laves phases. For the majority of the Cr,_Nb precipitates,
the Cr:Nb ratio of 2:1 was confirmed by XEDS measurements. Occasionally, some small
fcc particles exhibit a Cr:Nb ratio of 1:1. Preliminary XEDS analysis indicated these
24
particlesalsocontainoxygen.
structures.
More work is necessaryto identify thesecompoundsand
b)
Figure 14 -Bimodal particle distribution in Cu-8 Cr-4 Nb alloy after aging at 1323 K
for a) 1 h and b) 50 h. (c) Trimodal distribution after aging at 1323 K - 50 h.
25
Figure 14 -Bimodal particle distribution in Cu-8 Cr-4 Nb alloy after aging at 1323 K
for a) 1 h and b) 50 h. (c) Trimodal distribution after aging at 1323 K - 50 h.
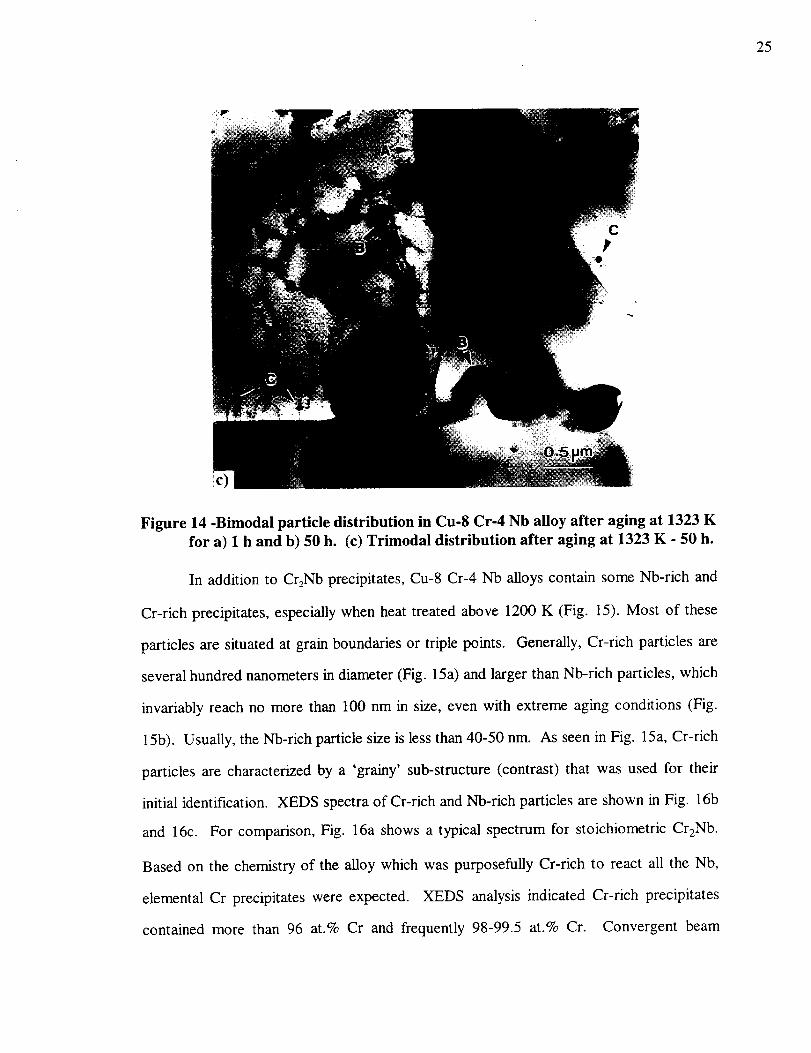
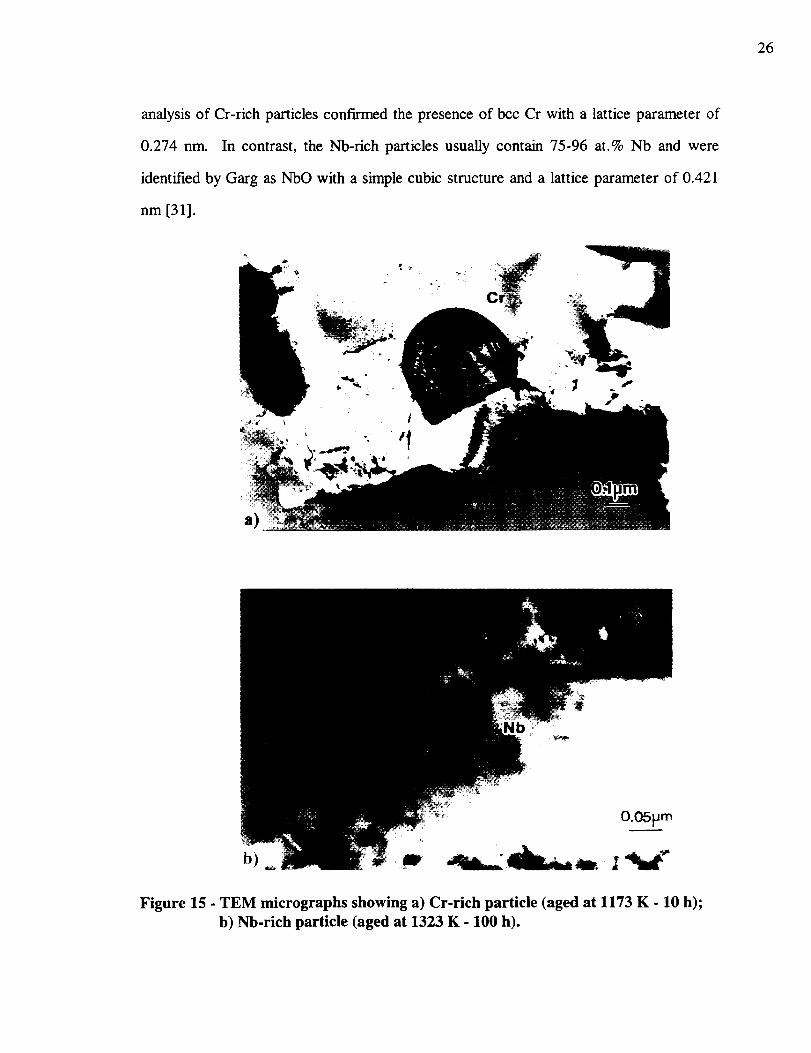
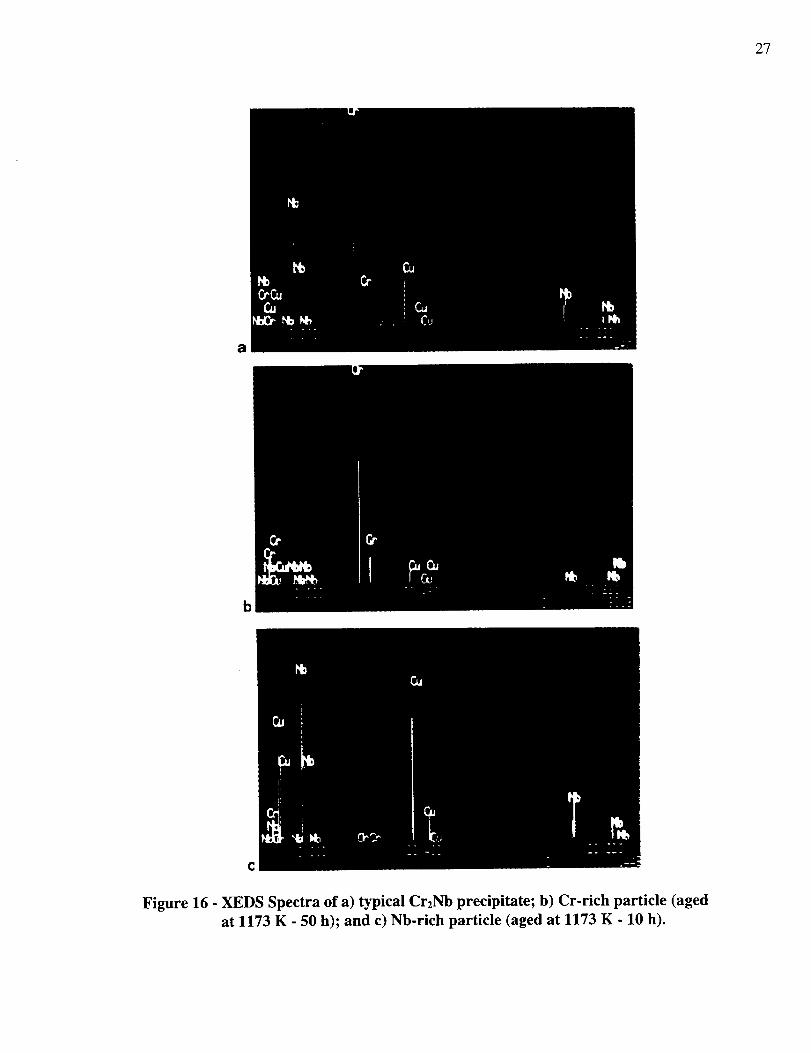
In addition to Cr2Nb precipitates, Cu-8 Cr-4 Nb alloys contain some Nb-rich and
Cr-rich precipitates, especially when heat treated above 1200 K (Fig. 15). Most of these
particles are situated at grain boundaries or triple points. Generally, Cr-rich particles are
several hundred nanometers in diameter (Fig. 15a) and larger than Nb-rich particles, which
invariably reach no more than 100 nm in size, even with extreme aging conditions (Fig.
15b). Usually, the Nb-rich particle size is less than 40-50 nm. As seen in Fig. 15a, Cr-rich
particles are characterized by a 'grainy' sub-structure (contrast) that was used for their
initial identification. XEDS spectra of Cr-rich and Nb-rich particles are shown in Fig. 16b
and 16c. For comparison, Fig. 16a shows a typical spectrum for stoichiometric Cr2Nb.
Based on the chemistry of the alloy which was purposefully Cr-rich to react all the Nb,
elemental Cr precipitates were expected. XEDS analysis indicated Cr-rich precipitates
contained more than 96 at.% Cr and frequently 98-99.5 at.% Cr. Convergent beam
26
analysisof Cr-rich particlesconfirmedthe presenceof bcc Cr with a latticeparameterof
0.274 rim. In contrast,the Nb-rich particlesusuallycontain 75-96 at.% Nb and were
identifiedby GargasNbO with a simplecubicstructureanda latticeparameterof 0.421
nm [31].
a)
Figure 15 - TEM micrographs showing a) Cr-rich particle (aged at 1173 K - 10 h);
b) Nb-rich particle (aged at 1323 K - 100 h).
27
a
b
¢
Figure 16 - XEDS Spectra of a) typical CrzNb precipitate; b) Cr-rich particle (aged
at 1173 K - 50 h); and c) Nb-rich particle (aged at 1173 K - 10 h).
28
Preliminary semi-quantitative measurements indicated an increase of the number of
Nb-rich particles with increasing temperature and longer annealing times. For example,
the majority of the finest particles were NbO at 1323 K, while only about 30% of the
freest particles were Nb-rich at 1173 K. This percent was even smaller (around 20%) at
lower temperatures (973 K). The number of Cr-rich particles amounted to a small fraction
(<5 %) of total particles and varied little with temperature based on general TEM
observations rather than particle counting. Further work is required to gain a more
quantitative assessment of Cr-rich and Nb-rich particles.
3.2.2 CrrNb Precipitate Coarsening
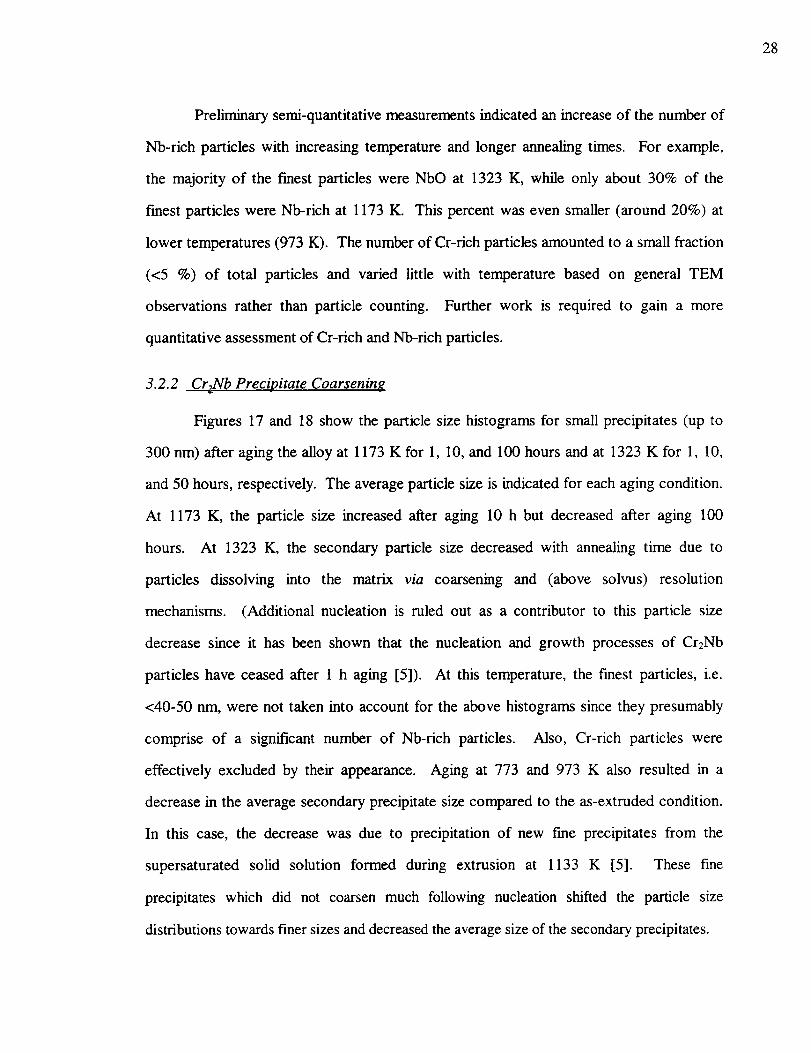
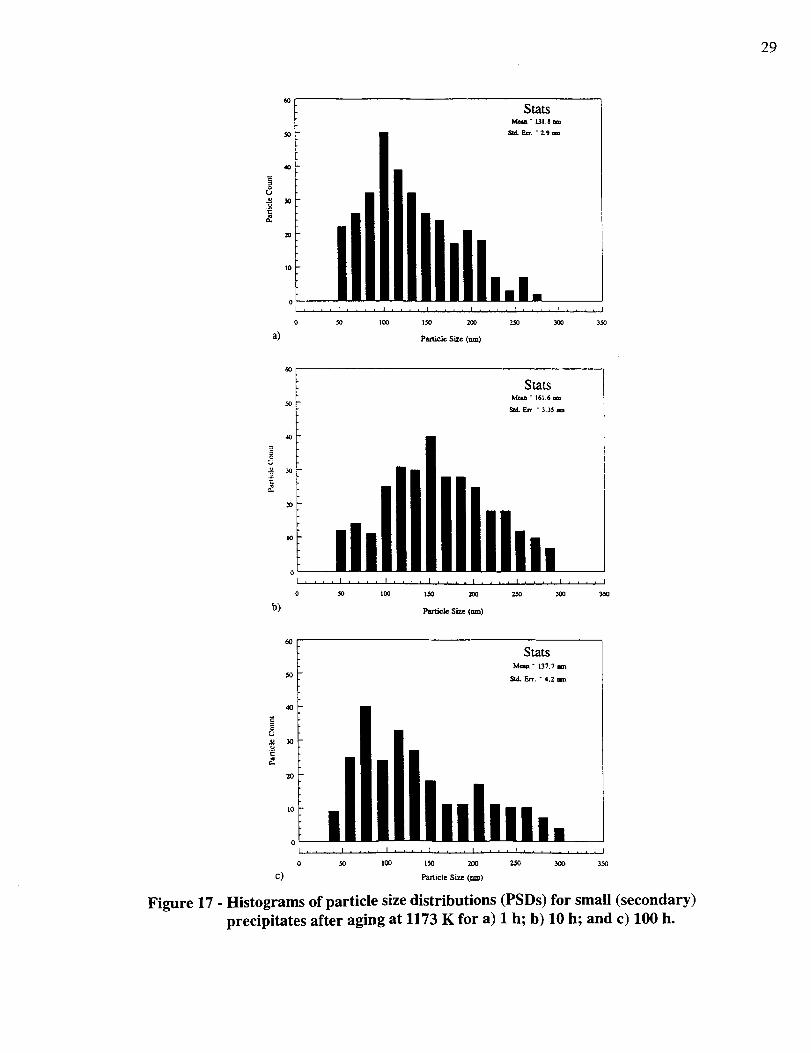
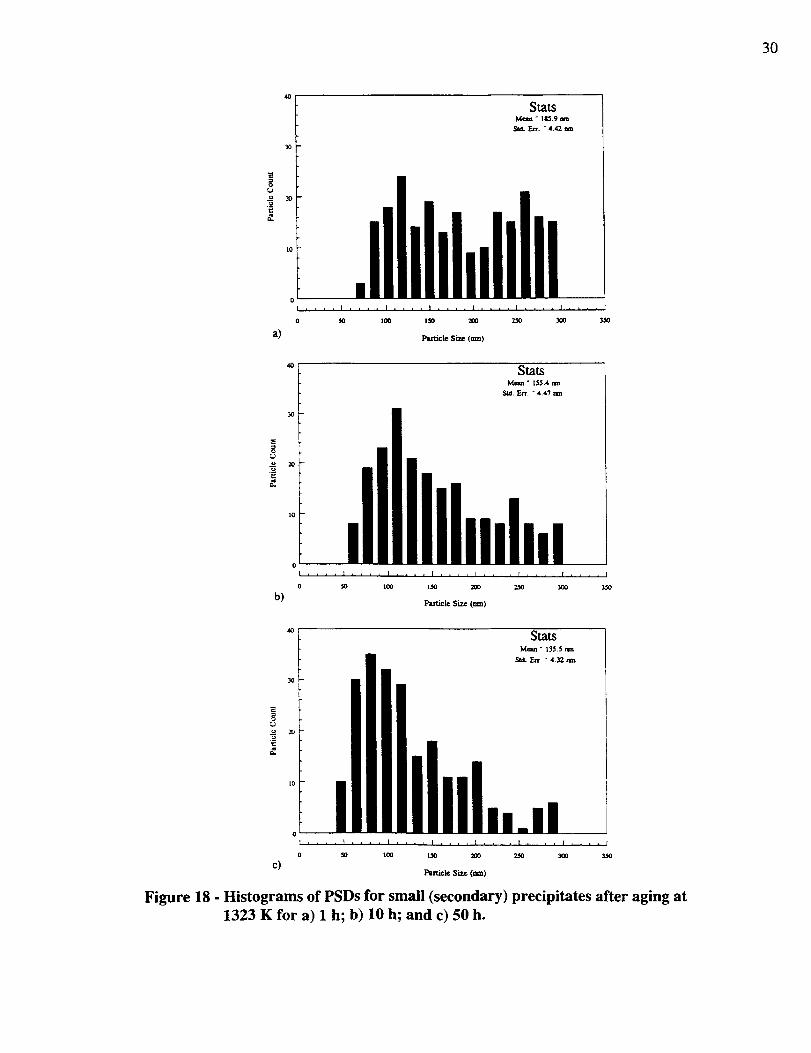
Figures 17 and 18 show the particle size histograms for small precipitates (up to
300 nm) after aging the alloy at 1173 K for 1, 10, and 100 hours and at 1323 K for 1, 10,
and 50 hours, respectively. The average particle size is indicated for each aging condition.
At 1173 K, the particle size increased after aging 10 h but decreased after aging 100
hours. At 1323 K, the secondary particle size decreased with annealing time due to
particles dissolving into the matrix via coarsening and (above solvus) resolution
mechanisms. (Additional nucleation is ruled out as a contributor to this particle size
decrease since it has been shown that the nucleation and growth processes of Cr2Nb
particles have ceased after 1 h aging [5]). At this temperature, the freest particles, i.e.
<40-50 nm, were not taken into account for the above histograms since they presumably
comprise of a significant number of Nb-rich particles. Also, Cr-rich particles were
effectively excluded by their appearance. Aging at 773 and 973 K also resulted in a
decrease in the average secondary precipitate size compared to the as-extruded condition.
In this case, the decrease was due to precipitation of new fine precipitates from the
supersaturated solid solution formed during extrusion at 1133 K [5]. These fine
precipitates which did not coarsen much following nucleation shifted the particle size
distributions towards finer sizes and decreased the average size of the secondary precipitates.
29
a)
b)
t20
-'_ r'-
Parucle Size (_)
StatsMe_n " t6L6 um
SIL_ " 3.33_m
14) 1_) 1._0 2O0 210 JO0 314)
Pazx_gle Size (ran)
StatsMc_ " 137.7 am
_d, Fa'r." 4,2 nm
t_
2O
0
0 50 lOC 130 200 2.50 _0 350
e) _nicle Size (rim)
Figure 17 - Histograms of particle size distributions (PSDs) for small (secondary)
precipitates after aging at 1173 K for a) 1 h; b) 10 h; and c) 100 h.
3O
StatsM_ " I_.9 nra
a)
I .... I .... [ .... I .... I .... I .... I .... f
0 _ IO0 ISO _ 250 300 350
Pa_cle Size (rim)
b)
40
3O
StatsMmn " 155.4 am
Sld. Err. " 4.4"7
.... I .... I . , , , I , , , , I .... I .... I ....
_0 tO0 1_) 2O0 _ _ 350
Particle Size (am)
Stats
Mean " 135.5 nm
L_
o
, t . _ .... I , , , , I .... I .... I .... I ....
o 50 lco 1_lo 2_0 230 300 350
c)Panicle Size (am)
Figure 18 - Histograms of PSDs for small (secondary) precipitates after aging at
1323 K for a) 1 h; b) 10 h; and c) 50 h.

31
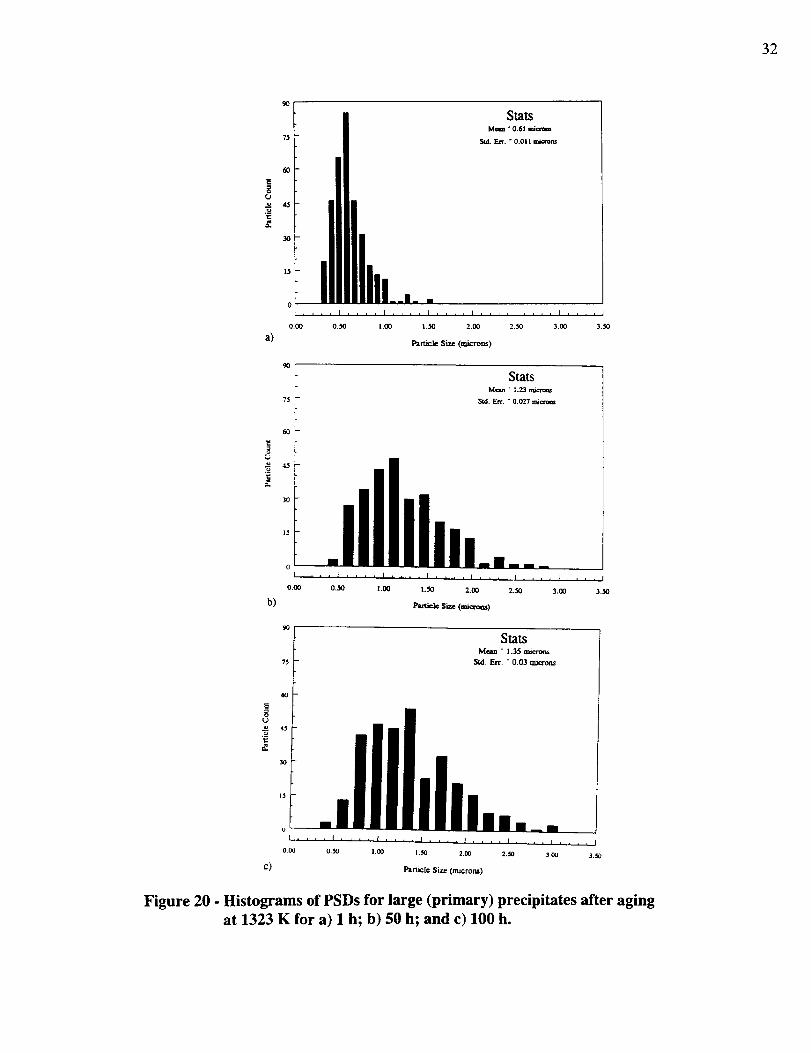
The particle-size histograms for large particles in the as-received powder and as-
extruded bars are shown in Figure 19. The histograms of the primary particle size after
annealing at 1323 K for 1 to 100 hours are shown in Figure 20, and the mean particle sizes
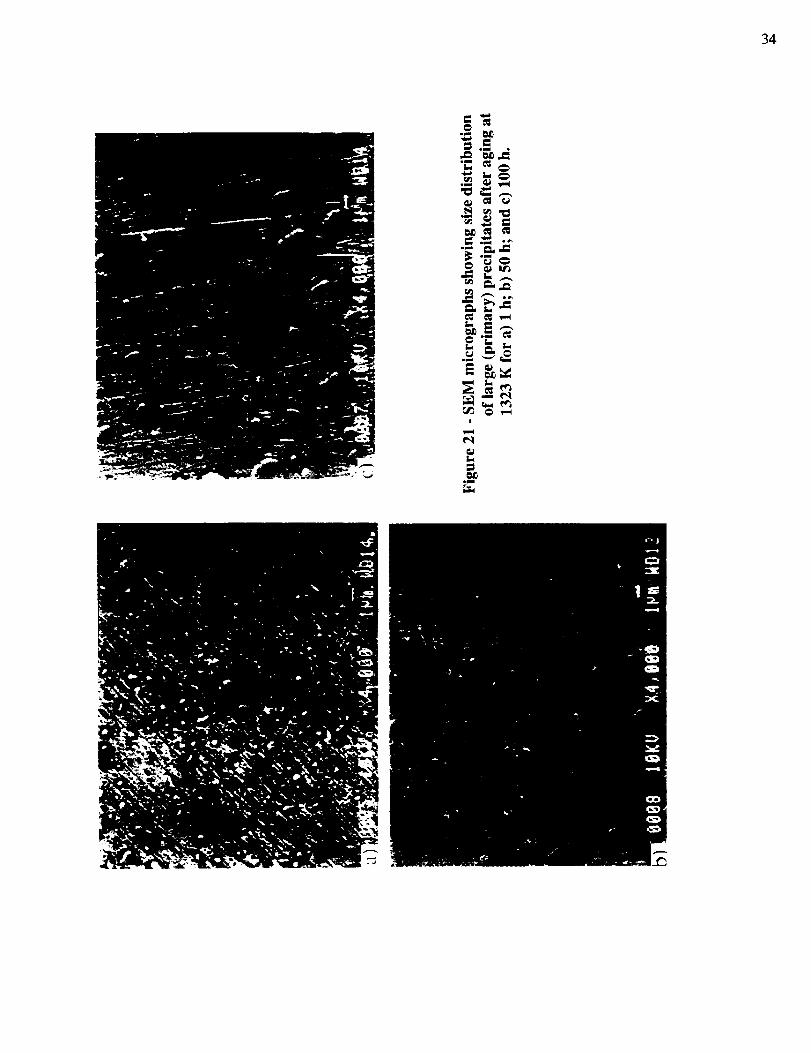
are presented in Table II. Typical SEM micrographs showing relative particles sizes of
primary particles aged at 1323 K are shown in Figure 21. The mean primary particle size
gradually increases with annealing time as shown in Table II. Results from aging at 973 K
presented in Table I show that in this temperature range the coarsening was not
significantly affected by temperature.
a)
70
Stats
Std, E_, "0,027 a_ceom
0
I .... I , _ , • I , , , , I .... I .... I , , . i I L i i i I
0.00 0.50 1.00 1.51:1 2.00 2.50 3.00 3.$0
b) Particle Size (miemm)
Figure 19 - Histograms of PSDs for large (primary) particles for a) As-atomized
powders and b) As-extruded condition.
32
9O
Stats
75 -
-
15 -
0
.... t .... I .... [ .... I .... I .... I .... I
0._ 0._ t._ I._ 2._ 2._ 3._ 3._
6O
0
a)
b)
Pae.iclc Size (microm)
9o
75 -
6o -
StatsMean " L23 mJcro_
S_. Err. " 0.027 mic_as
45
15o311 i0.00 0.$0 I.O0 1.$0 2.00 2._0 3.00 3.$0
Particle Size (microm.)
90
StatsMeam - 1.35 microns
_d. Err. " 0.03 m,mrons
c)Paniclc Size (microt_)
Figure 20 - Histograms of PSDs for large (primary) precipitates after aging
at 1323 K for a) 1 h; b) 50 h; and c) 100 h.
33
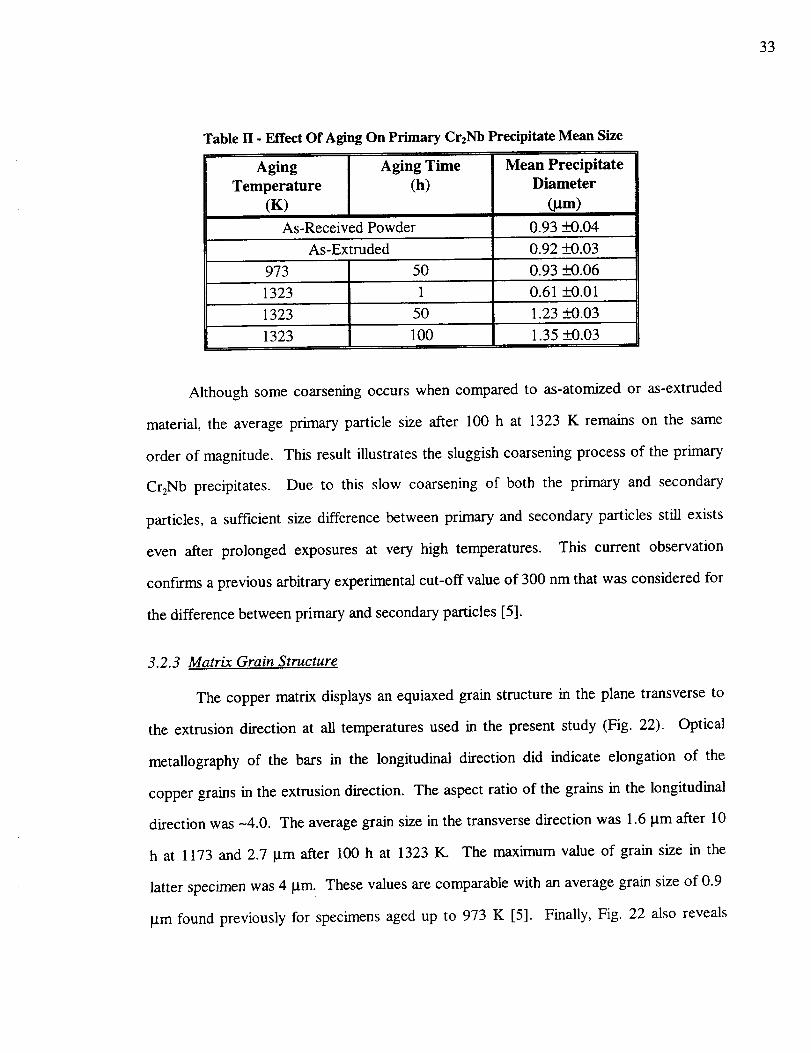
Table H - Effect Of Aging On Primary Cr2Nb Precipitate Mean Size
Aging
Temperature
(K)As-Received
Aging Time
(h)
Powder
As-Extruded 0.92 _+0.03
973 50 0.93 _+0.06
1323 1
1323 50
1323 100
Mean Precipitate
Diameter
(gm)
0.93 _+0.04
0.61 _+0.01
1.23 _+0.03
1.35 _+0.03
Although some coarsening occurs when compared to as-atomized or as-extruded
material, the average primary particle size after 100 h at 1323 K remains on the same
order of magnitude. This result illustrates the sluggish coarsening process of the primary
Cr2Nb precipitates. Due to this slow coarsening of both the primary and secondary
particles, a sufficient size difference between primary and secondary particles still exists
even after prolonged exposures at very high temperatures. This current observation
confirms a previous arbitrary experimental cut-off value of 300 nm that was considered for
the difference between primary and secondary particles [5].
3.2.3 Matrix Grain Structure
The copper matrix displays an equiaxed grain structure in the plane transverse to
the extrusion direction at all temperatures used in the present study (Fig. 22). Optical
metallography of the bars in the longitudinal direction did indicate elongation of the
copper grains in the extrusion direction. The aspect ratio of the grains in the longitudinal
direction was -4.0. The average grain size in the transverse direction was 1.6 lam after 10
h at 1173 and 2.7 gm after 100 h at 1323 IC The maximum value of grain size in the
latter specimen was 4 gin. These values are comparable with an average grain size of 0.9
gm found previously for specimens aged up to 973 K [5]. Finally, Fig. 22 also reveals
34
0oil1 I_D
_o_
|
wnq
c_In1
_m

35
primary and less frequently secondary particles residing at grain boundaries and triple
points. These precipitates appear to provide effective grain-boundary pinning.
Figure 22 - Matrix grain structure in Cu-8 Cr-4 Nb alloy after aging at 1323 K - 100 h.
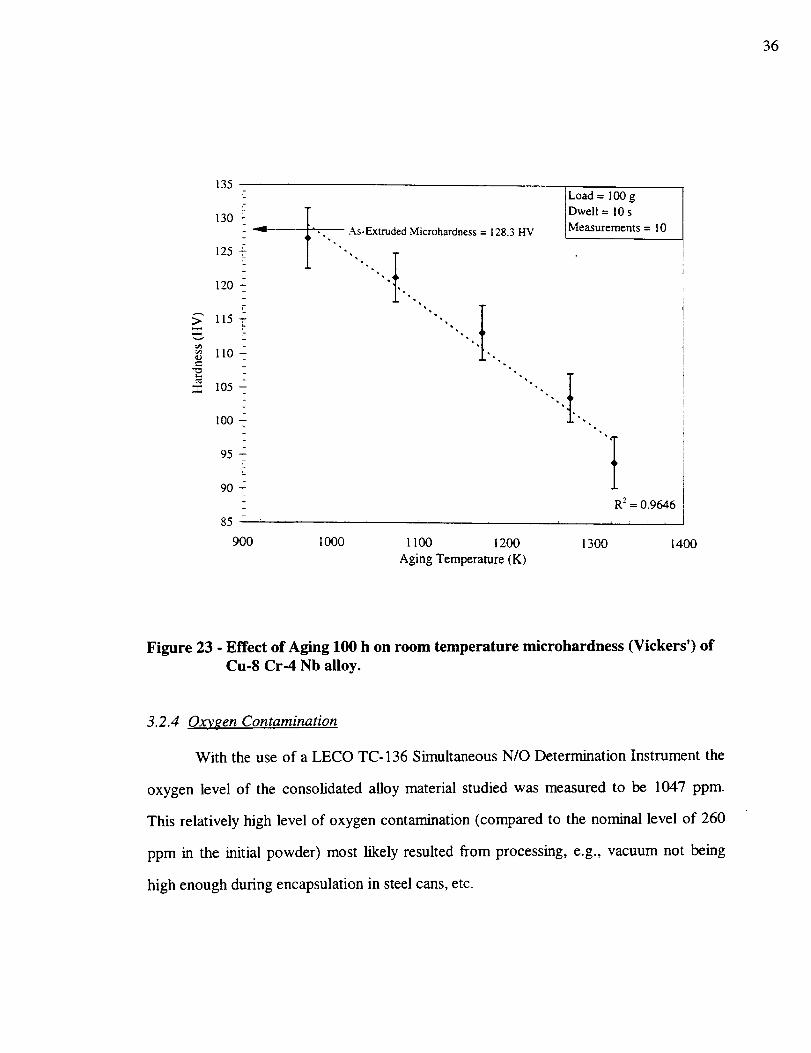
Finally, Fig. 23 shows the microhardness (HV) variation as a function of
temperature for 100 hour anneal. Even after extensive high temperature exposure, e.g.,
after 100 h at 1323 K, the hardness reduces by only 38 HV from the as-extruded value of
128 HV. All these results indicate the good thermal stability of this alloy. Despite the
decrease with aging temperature, the retained mechanical property values are notably
superior to traditional alloys such as NARloy-Z.
36
>
,._.,
e_e--
135
130 -
125 -
120 -
r
115
Y
I10 -
105 -
100-
95-
90-
85
I.
As-Extruded Microhardness = 128.3 HV
Load = 100 g
Dwell = 10 s
Measurements = I0
R z = 0.9646
900 1000 1100 1200 1300 1400
Aging Temperature (K)
Figure 23 - Effect of Aging 100 h on room temperature microhardness (Vickers') of
Cu-8 Cr-4 Nb alloy.
3.2.4 Oxygen Contamination
With the use of a LECO TC-136 Simultaneous N/O Determination Instrument the
oxygen level of the consolidated alloy material studied was measured to be 1047 ppm.
This relatively high level of oxygen contamination (compared to the nominal level of 260
ppm in the initial powder) most likely resulted from processing, e.g., vacuum not being
high enough during encapsulation in steel cans, etc.
37
3.3 DISCUSSION
3.3.1 C_.C__rNbPrecipitate Structure
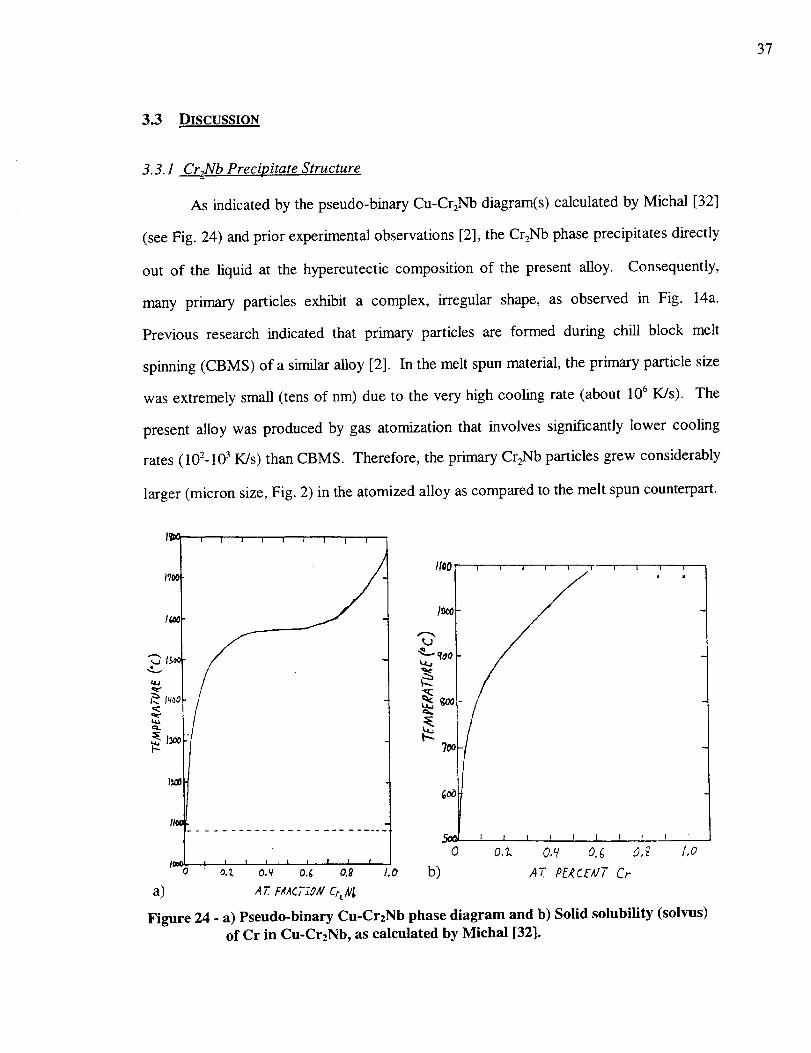
As indicated by the pseudo-binary Cu-Cr2Nb diagram(s) calculated by Michal [32]
(see Fig. 24) and prior experimental observations [2], the Cr2Nb phase precipitates directly
out of the liquid at the hypereutectic composition of the present alloy. Consequently,
many primary particles exhibit a complex, irregular shape, as observed in Fig. 14a.
Previous research indicated that primary particles are formed during chill block melt
spinning (CBMS) of a similar alloy [2]. In the melt spun material, the primary particle size
was extremely small (tens of nm) due to the very high cooling rate (about 10 6 K/S). The
present alloy was produced by gas atomization that involves significantly lower cooling
rates (102-103 K/s) than CBMS. Therefore, the primary Cr2Nb particles grew considerably
larger (micron size, Fig. 2) in the atomized alloy as compared to the melt spun counterpart.
I I I I I ( I I I
/I00 , , , , ,/7OC • .
/_ Iooo
k.J
_ 13oo
g_
I10!........................
I r I I r I I _ i I0 OA. 0._ O.g 0,_ 1,0
, I I I l I I I |
teo o._ o.v o._ o.f I.o b) AT. PE_CE_/T Cr
a) ,_r. FXACTZ_,¢Cr_/¢_
Figure 24 - a) Pseudo-binary Cu-Cr2Nb phase diagram and b) Solid solubility (solvus)of Cr in Cu-CrzNb, as calculated by Michal [32].
38
In contrast,the smallersecondaryprecipitatesform from the supersaturatedcopper
solidsolutionduringcoolingbelow thesolvustemperature.Thesizesof secondaryCr2Nb
precipitateswerecalculatedconsideringanundercoolingof about100K below thesolidus
and 773 K asthe lower temperaturebound for significantdiffusion [33]. Briefly, this
calculationwasbasedon theavailableflux of atomsinsidea sphereof radiusQ-_ (D is
diffusivity of the slowestmovingspeciesandt - coolingtimebetweensolidusand773 K)
that move to the centerto form the Cr2Nbprecipitateshavinga particular (fcc) crystal
structure [2]. Nb wasconsideredto be rate limiting (controlling)speciesinceit hasa
lower diffusivity in Cu thandoesCr, asexpressionsbelowdirectlyindicate[34]:
195,016 J / mol_ cm 2 / S and (1 la, b)Dcr = 0.337exp RT J
251,291 J / mol)D_ = 2.04exp _,_ cm 2 / S.
For example, at 1323 K Do > 20Din, i.e. 6.73x10 -9 cm2/s for Cr vs. 2.44x10 -1° cm2/s for
Nb.
Particle size calculations for cooling rates of 102-103 K/s, i.e. inert gas atomization,
were performed for Cr, Nb and Cr2Nb particles based on time-averaged diffusivities of Cr
and Nb in Cu. Such average diffusivities were determined by methods put forth by Crank
[35]. The following equation is a rendition of Crank's Eqn. (7.3) for time-incorporated
diffusivity:
T B = _DB(t')dt' = Do.B-exp R.[To_-c.t,]j-o 0
where To = initial temperature (K) at onset of cooling (solidification);
c = cooling rate in K/s;
t = total time duration considered for cooling (s); and
(12)
t' = time interval (s).
39
The average diffusivity is given by dividing the above integral by the total time, i.e.
D_ = TB cm 2/s. (13)t
The combination of Eqns. (12) and (13) can be represented in the following summation
form [2]:
DB(t')At'
DB - _,--o (14)I1
Z At'At=0
Actual calculations of Dcr and DNb, using Eqns. (11) and (14), and calculations of
particle sizes based on these diffusivities are presented in Appendix 2. The results indicate
that the size of the secondary Cr2Nb particles formed from supersaturated solid solution
upon solidification and subsequent cooling ranges between 16 and 50 nm. The calculated
secondary particle size values seem in reasonable agreement with the previous assumption
(based solely on microstructural features) that particles on the order of tens of nanometers
are secondary particles. From the above calculation, it is also clear that the large particles
around 1 I.tm could not form by precipitation from solid solution and therefore are primary
particles. The combination of solidification and solid state precipitation processes gives
the rapidly solidified powders an initial bimodal Cr2Nb particle distribution with larger
primary and smaller secondary particles, as can be seen in Fig. 14a.
The extrusion was performed at sufficiently high temperature (1133 K) to allow the
small precipitates to dissolve back into copper solid solution. According to the Cu-Cr2Nb
phase diagram, these alloying elements show substantial solubility at temperatures above
1100 K [32]. The cooling rate after extrusion was also sufficiently fast to maintain a
supersaturated copper solid solution. In fact, a subsequent precipitation of particles from
this supersaturated solid solution has been demonstrated [5]. For example, aging at
temperatures below the solvus (773 and 973 K) gives rise to a normal precipitation

4O
behavior with nucleationand growth of new secondaryparticles giving subsequent
strengtheningaftershortholdingtimes(e.g., 1hr at 773 K, whichgivesanaveragesizeof
-30nm). As alreadymentioned,this precipitationprocessexplainsthe typical bimodal
particlemicrostructureobservedin agedmaterials.
At temperatures comparable to or higher than the extrusion temperature, processes
more complex than precipitate nucleation and growth take place. While still limited at
very high temperatures, such as 1323 K, Ostwald ripening of larger secondary particles
leads to their growth (in the order of hundreds of nanometers, but with most remaining in
the secondary size category) at the expense of smaller ones, which dissolve. At the same
time, since 1323 K is well above the solvus line, these smaller precipitates also shrink due
to going back into solution. Upon furnace cooling from 1323 K, a new generation of very
fine secondary Cr2Nb particles (in the range of tens of nanometers) precipitate out of this
supersaturated solid solution, resulting in a trimodal particle distribution as seen in Fig.
14c.
Some of the newly precipitated particles were identified as NbO. The NbO probably
forms as Cr rapidly diffuses away from the dissolving Cr2Nb precipitates leaving a Nb rich
region. Oxygen from the matrix, likely introduced during powder handling, can then
readily react at these temperatures to form the NbO. This mechanism becomes more
prevalent at higher temperatures with NbO accounting for as much as 30% of the fine
precipitates at 1173 K.
3.3.2 High Temperature Cr2_Nb Stability�Coarsening Behavior
The coarsening data for primary particles at 1323 K were analyzed to determine the
governing process assuming no real change in volume fraction occurs. Since primary
particles form from liquid and only limited dissolution has been observed, the assumption
that the volume fraction remains roughly constant seems reasonable. Previous
measurements of large particle volume fractions after aging at 973 K seemed to confLrm
41
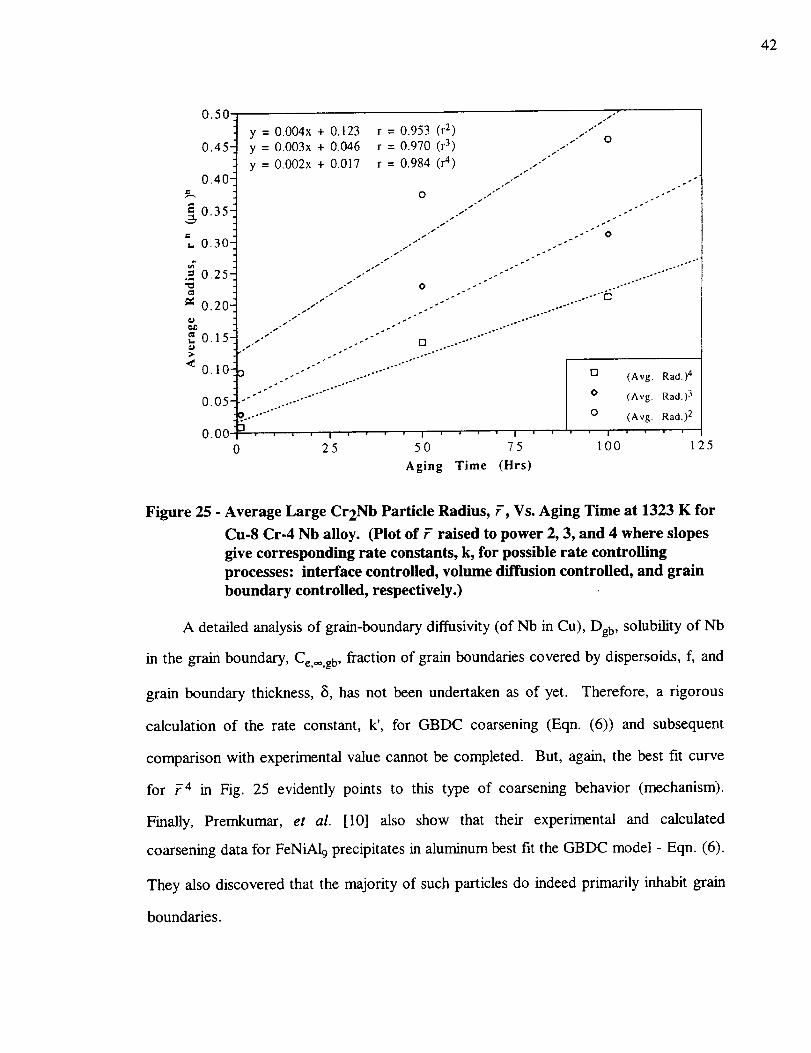
thisassumption[5]. Figure25showsaplot of 7 2, 7 3, and 7 4 versus time, where 7 is the
average radius of the precipitates. A linear relationship was assumed, and a straight line
was fit to the data using a least squares linear regression. The data fit both volume and
grain-boundary diffusion controlled (VDC and GBDC) coarsening kinetics. The grain
boundary ripening is in accordance with the preferred distribution of the large precipitates
at grain boundaries and/or triple points (e.g., Fig. 14b and Fig. 22). A comparison of the
experimental value of the coarsening rate constant (k=5.6 x 10 -31 m4/s) with a calculated
value for GBDC, i.e. evaluation of Eqn. (7) is not possible since no grain boundary
diffusion data are available for the present system.
The plot of Fig. 25 was further analyzed for the slopes of the 7 3 and 7 4 fitted lines.
The slope of the 7 3 line, i.e. the VDC LSW rate constant, k, was calculated to be roughly
-7.78x10⁻²⁵ m3/s while that for the GBDC case was -5.6x10 -31 m4/s. These are
reasonable values compared to those determined for other DS systems, e.g., ref [10]. A k
value of the VDC case of unmodified LSW was also calculated based purely on material
parameters for comparison with the experimentally determined k. Nb was considered the
rate-controlling species since it has lower diffusivity in Cu than Cr, as pointed out earlier.
Using Eqn. (5), considering a temperature of 1323 K, at which Dy b - 2.44x10 -14 m 2/s
and CNb = 0.001 [4a], and taking V m -- 2.58x10 5 m3/mol and _ = 0.5 J/m 2, typical for
incoherent precipitates, gave k = 2.54x10 -26 m3/s, which is reasonably close to
experimental value (by about an order of magnitude). These relatively low values of
diffusivity and solubility of Nb in Cu help explain the apparent sluggish coarsening of the
large precipitates, as mentioned earlier.
42
1,4
_g
o_
<
0.50
0.45-
0.40"
0.35-
0.30-
0.25-
O.20-
0.15-
0.I0-
0.05-
0.00
0
y = 0.004x + 0.123 r = 0.953 (r z)
iI
oy = 0.003x + 0.046 r = 0.970 (r 3) /,/"
y = 0.002x + 0.017 r = 0.984 (r 4) /-'"/
1" _- O
t" _- o.I" ." ..o'*
1" ._" °ooO°°
i" O .''" ..°°°'°
,s f°_° "''_ .oO.O.._2_
1" . - ooO°°t" ." .oO°°
I" .. ...°._.o . o.o°
I o . .o_-°_* .- _ ooO°"
i . .o.-
) .-'" . .......... El (Avg. Rad.) 4
.''" .-'"" .... -""" [ O (Avg. Rad.) 3
?. ........ [ 0 (Avg. Rad.) 2
"l I ' ' ' I .... I ' ' 1' I ' ' ' '
25 50 75 100 125
Aging Time (Hrs)
Figure 25 - Average Large Cr2Nb Particle Radius, ?-, Vs. Aging Time at 1323 K for
Cu-8 Cr-4 Nb alloy. (Plot of ?- raised to power 2, 3, and 4 where slopes
give corresponding rate constants, k, for possible rate controlling
processes: interface controlled, volume diffusion controlled, and grain
boundary controlled, respectively.)
A detailed analysis of grain-boundary diffusivity (of Nb in Cu), Dg b, solubility of Nb
in the grain boundary, Ce,_,g b, fraction of grain boundaries covered by dispersoids, f, and
grain boundary thickness, 8, has not been undertaken as of yet. Therefore, a rigorous
calculation of the rate constant, k', for GBDC coarsening (Eqn. (6)) and subsequent
comparison with experimental value cannot be completed. But, again, the best fit curve
for 7 4 in Fig. 25 evidently points to this type of coarsening behavior (mechanism).
Finally, Premkumar, et al. [10] also show that their experimental and calculated
coarsening data for FeNiA19 precipitates in aluminum best fit the GBDC model - Eqn. (6).
They also discovered that the majority of such particles do indeed primarily inhabit grain
boundaries.
43
Modifications of the coarsening kinetics given by LSW theory for such effects as
non-steady state processes and finite volume fractions give kinetics factor variations of 1
to -5, depending on particular modification (e.g., refer to Fig. 12). For instance, an
increase in particle volume fraction from 0.19 to 0.32 caused only doubling of the
coarsening rate constant [10]. The one order of magnitude difference points to a real
increase in the coarsening kinetics that is likely caused by faster grain boundary diffusion.
It appears most probable that Ostwald ripening with both bulk and grain boundary
diffusion is the mechanism operating to coarsen the Cr2Nb precipitates. This is supported
to some extent by the fact that some primary precipitates do exist within grains (e.g., Fig.
14a), although a majority are at grain boundaries. In addition, secondary particles, found
mostly inside grains (e.g., Fig. 14c and Fig. 22), may also contribute to primary particle
coarsening. But GBDC coarsening mechanism most likely dominates (at least for primary
precipitates), which, again, is supported by the large precipitate morphology (primarily at
grain boundaries) revealed in Figs. 14b and 22.
In contrast to aging below 1200 K, the secondary particles show a continuous
decrease in average size during aging at 1323 K as shown in Fig. 18. As alluded to earlier,
this is most likely due to the additional dissolution of particles back into the matrix when
the aging temperature puts the alloy above the solvus line of the pseudo-blnary Cu-Cr2Nb
phase diagram [32]. The experimental observation of a solvus line between 1200 and
1323 K is in agreement with the solvus line calculation by Michal. Thus, the smallest
secondary precipitates not only dissolve due to larger ones coarsening, but also shrink by
being thermodynamically driven back into solution. Finally, since these particles actually
exhibit a decrease in average size they, of course, cannot follow or be modeled by an
LSW-type growth-rate theory.
Despite this evident dissolution of smaller secondary precipitates, they remain in
sufficient number even at these extremely high aging temperatures to provide significant
room temperature strengthening. At 1323 K, new secondary precipitates form during

44
subsequentcooling asshownin Figure 14c. In addition, Cr-andNb-rich particlesalso
form and have sizescomparableto the secondaryparticles. Comparedto secondary
precipitates,largerprimaryparticlesarelessthermodynamicallyaffected,i.e. morestable,
due to much lower capillarity effectsor reducedoverall specificsurfacearea (energy).
Therefore,primary precipitatesexhibit slow net coarsening(coarseningexceedingany
resolution)thatbecomesevidentat temperaturesabove1000K.
Finally, the experimentallyobservedstabilityof mechanicalstrengthof Cu-8 Cr-
4 Nb alloysevenafter beingexposedto temperaturesvery closeto their meltingpoint is
revealedin Fig. 23. This is clearlyrelatedto andevidenceof the sluggishcoarseningof
thedispersedCr2Nbphaseand,ultimately,thegrains,whichwill betouchedonfurthershortly.
3.3.3 Cr-Rich and Nb-Rich Particle Precipitation�Formation
Cr2Nb was not the only particle to precipitate out (form) during high-temperature
exposure. Niobium-rich (NbO) and Cr-rich particles were also detected (via TEM
observation and confirmed by EDS and electron microdiffraction [31]). As already
described, resolution of the Cr2Nb precipitates presumably occurs simultaneously with
coarsening/dissolving at temperatures greater than 1100 K. First, large precipitates grow
at the expense of the small(est) dissolving particles, which obviously necessitates diffusion
of solutes. Second, small precipitates are driven back into solid solution above the solvus
line. This conventional coarsening picture is complicated in Cu-Cr-Nb alloys by the
presence of two solutes. Moreover, the diffusivities of the two components are
significantly different [34, 36]. Cr diffuses over one order of magnitude faster than Cu,
whereas Nb diffuses slower than Cu. When Cr2Nb precipitates dissolve both Cr and Nb
must diffuse through the copper matrix to reach growing larger precipitates. Such a
coarsening process of the Cr2Nb precipitates was experimentally observed in the present
Cu-8 Cr-4 Nb alloys. Finally, the coarsening behavior is complicated by the presence of
such Nb-rich and Cr-rich precipitates.
45
A simplistic explanation based on the Gibbs phase rule indicates this ternary alloy
should feature a maximum of three phases at non-critical temperatures (when the
temperature may be one of the independent variables). The present alloy contains four
phases which again suggests that Cr-rich and Nb-rich phases are out of equilibrium. But if
oxygen (extraneous, or unintentional oxygen introduced during processing) is taken as the
fourth component the total number of equilibrium phases will become four. Phase
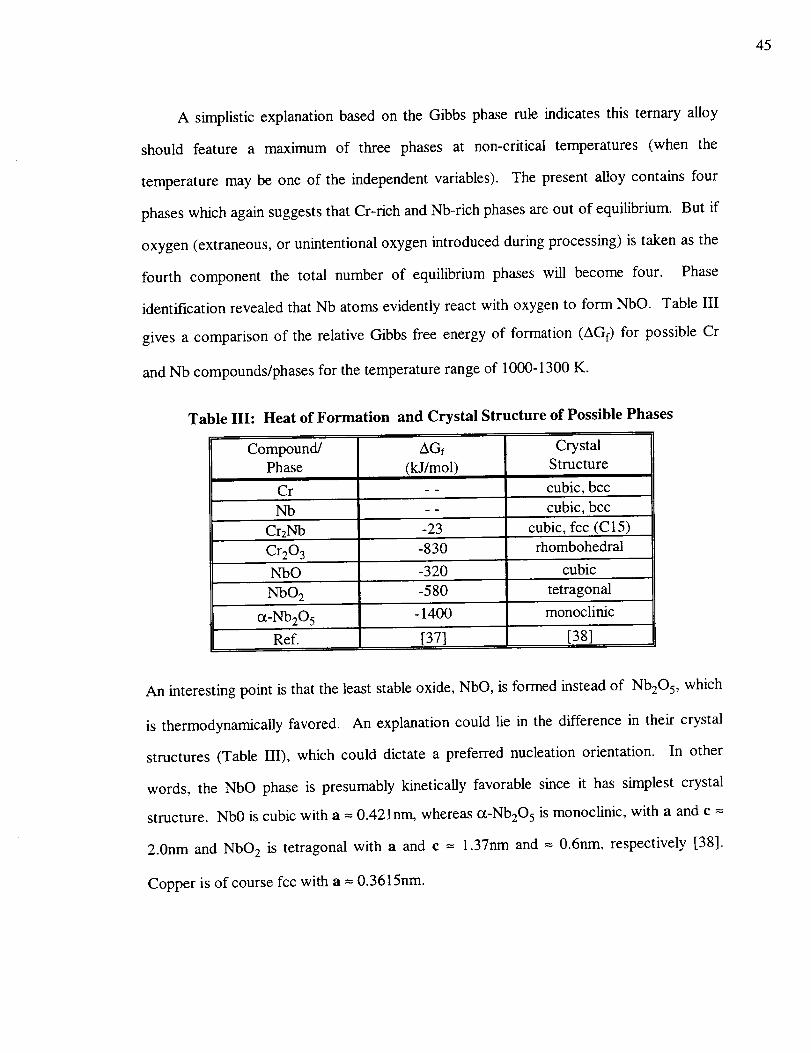
identification revealed that Nb atoms evidently react with oxygen to form NbO. Table III
gives a comparison of the relative Gibbs free energy of formation (AGf) for possible Cr
and Nb compounds/phases for the temperature range of 1000-1300 K.
Table III: Heat of Formation and Crystal Structure of Possible Phases
Compound/Phase
AGf
(kJ/mol)
r - -
Nb --
Cr2Nb -23
Cr203
NbO
NbO 2
_-Nb205
Ref.
Crystal
Structure
cubic, bcc
cubic, bcc
cubic, fcc (C15)
-830 rhombohedral
-320 cubic
-580 tetragonal
- 1400 monoclinic
[37] [38]
An interesting point is that the least stable oxide, NbO, is formed instead of Nb205, which
is thermodynamically favored. An explanation could lie in the difference in their crystal
structures (Table III), which could dictate a preferred nucleation orientation. In other
words, the NbO phase is presumably kineticaUy favorable since it has simplest crystal
structure. Nb0 is cubic with a = 0.421nm, whereas ot-Nb205 is monoclinic, with a and e =
2.0nm and NbO 2 is tetragonal with a and c = 1.37nm and = 0.6nm, respectively [38].
Copper is of course fcc with a = 0.3615nm.
46
The above anomalous, unexpected "non-equilibrium" phases require further
investigation into reasons for their existence. The investigation/explanation should
consider the driving force for Cr-rich and NbO phase formation as well as kinetic
considerations based on particle structure, orientation relationships and component
diffusivities.
3.3.4 Grain-Boundary Pinning
Finally, the effect of particle coarsening on grain size is touched on. It has been
shown [39] that comparison of the calculated strengthening effects (i.e. Orowan and grain
boundary) upon aging at 1323 K and 973 K indicates that the predominant contribution in
both cases is due to grain boundary strengthening. This is supported by the essentially
same micrometer grain size range that was experimentally observed even after 100 hr at
1323 K [39]. This clearly demonstrates the pinning effect of the precipitates, which does
not markedly diminish when they grow in the size range encountered in these alloys.
Calculations of the maximum grain size according to the Hillert-Gladman [40, 41]
expression,
4r
dc, lc = -- (15)3f
where r is particle radius and f volume fraction, were made to further distinguish between
the pinning effect of small versus large particles. The calculated grain size of 4.2 !am
considering small particles was in better agreement with the observed values of 4 l.tm than
the calculated value of-8 _tm for the larger (primary) particles. This suggests that
secondary particles are more effective at pinning the grain boundaries than are the primary
particles. This, of course, is contrary to expectation since primary precipitates are almost
entirely found at grain boundaries as opposed to secondary particles. An explanation for
this anomaly may lie in experimental error, e.g., initial volume fraction measurements, and
requires further investigation.

47
4. SUMMARY AND CONCLUSIONS
Cu-8 Cr-4 Nb alloys exhibit a bimodal distribution of Cr2Nb particles, namely, primary
micrometer range particles formed from liquid and secondary particles formed by
precipitation from solid solution. A trimodal particle distribution with additional very
fine secondary particles is observed after slow cooling from temperatures above the
extrusion temperature.
The copper matrix exhibits a fine equiaxed structure with an average grain size of 2.7
gm after exposure at 1323 K after I00 h. No significant grain growth occurs in the
studied temperature range. This is most likely due to effective grain boundary pinning
by Cr2Nb particles.
The coarsening process of Cr2Nb particles is very slow; both primary and secondary
precipitates remain in the same size range after high temperature exposure up to 1323
K for 100 h. This can be attributed to low solubility and diffusivity of Nb in Cu.
Coarsening kinetics of primary precipitates are consistent with either volume or grain
boundary diffusion mechanisms; but most likely mainly grain-boundary diffusion
controlled, since large particles are usually found at grain boundaries.
The LSW theory explains primary Cr2Nb precipitate coarsening behavior.
Neither of the LSW coarsening kinetic equations take into account the case of a
'mixing' or simultaneous occurrence of diffusion controlled and interface reaction
controlled ripening.
Modifications to LSW theory have been formulated to take into account finite volume
fraction and elastic strain effects of particles. This along with the previous statement
could explain deviation of experimental data from LSW theory. The modified theories
usually give better experimental fit.
48
5. REFERENCES
.
.
.
.
.
.
.
.
.
D. L. Ellis and R. L. Dreshfield, "Preliminary Evaluation of a Powder Metal Copper -
8 Cr- 4 Nb Alloy" presented at 1992 Conference on Advanced Earth-to-Orbit
Propulsion Technology, May 19-21, 1992, Marshall Space Flight Center, Alabama.
D. L. Ellis, "Precipitation Strengthened High Strength, High Conductivity Cu-Cr-Nb
Alloys Produced by Chill Block Melt Spinning", PhD Thesis, Case Western Reserve
University, Cleveland, Ohio, August 1989. See also NASA CR 185144, NASA
Lewis Research Center, Cleveland, Ohio, Sept. (1989).
D.L. Ellis, A.K. Misra and R.L. Dreshfield, "Effect of Hydrogen on a Cu-8 Cr-4 Nb
Alloy," NASA TM-106429, NASA Lewis Research Center, Cleveland, OH (Dec.
1993).
a) D. J. Chakrabati and D. E. Laughlin, Bull. Alloy Phase Diagrams, 2, 1982, p. 507
and 5, 1984, p. 59, 99.
b) D. J. Thoma and J. H. Perepezko, Mat. Sci. Eng., A156, 1992, 97.
K. R. Anderson, J. R. Groza, R. L. Dreshfield and D. L. Ellis, Mat. Sci. Eng., A169,
1993, 167.
D. L. Ellis, R. L. Dreshfield, M. J. Verrilli, and D. G. Ulmer, "Mechanical Properties
of a Cu-8 Cr- 4 Nb Alloy," Advanced Earth-to-Orbit Propulsion Technology
Conference, NASA Marshall Space Flight Center, Huntsville, Alabama, May 17-19,
1994.
J° J. Stephens and C. R. Hills. "Long Term Stability of Two Dispersion Strengthened
Copper Alloys at Elevated Temperatures," Sandia National Laboratories,
Albuquerque, New Mexico, 1990.
D. A. Porter and K. E. Easterling, Phase Transformations in Metals and Alloys,
Chapman and Hall, London, 1990.
M. Hillert, Lectures on the Theory of Phase Transformations, Ed. by H. I.
Aaronson, American Institute of Mining, Metallurgical and Petroleum
Engineering, Inc., New York, 1986, p. 26.
10. M.K. Premkumar, A. Lawley, and M. J. Koczak, Metall. Trans., 23A, 1992, 3219.
11. G.J. Shiflet and J. A. Hawk, Dispersion Strengthened Aluminum Alloys, Ed. Y.-W.
Kim and W. M. Griffith, The Minerals, Metals & Materials Society, 1988, p. 123.
12. P.W. Voohees and M.E. Glicksman, Metall. Trans., 15A, 1984, 1081.
49
13. I.M. Lifshitz andV. V. Slyozov,J. Phys. Chem. Solids, 19, 1961, 35.
14. C. Wagner, Z. Electochem., 65, 1961, 581.
15. S. S. Kang and D. N. Yoon, Met. Trans., 13A, 1982, 1405.
16. ldem. ibid., 12A, 1981, 65.
17. Y. Seno, Y. Tomokiyo, K. Oki, and T. Eguchi, Trans. Jpn. Inst. Metals, 24, 1983,
491.
18. T. Eguchi, Y. Tomokiyo, K. Oki, and Y. Seno, Mat. Res. Soc. Symp. Proc., 1984,
475.
19. R. Watanabe and Y. Masuda, Modern Devel. Powder. Metall., 6, 1974, 1.
20. R. Watanabe, K. Tada, and Y. Masuda, Z. MetalIkde, 13, 1976, 619.
21. J.W. Martin and R. D. Doherty, Stabili_ of Microstructure in Metallic Systems,
Cambridge University Press, Cambridge, United Kingdom, 1976, pp. 173-93.
22. P. K. Footner and C. B. Alcock, Metall. Trans., 3A, 1972, 2633.
23. A. J. Ardell, Acta. Metall., 20, 1972, 61.
24. C. S. Jayanth and P. Nash, J. Mat. Sci., 24, 1989, 3041.
25. C. K. L. Davies, P. Nash, and R. N. Stevens, Acta Metall., 28, 1980, 179.
26. A.D. Brailsford and P. Wynblatt, Acta Metall., 27, 1979, 489.
27. J.D. Eshelby, Acta Metall., 14, 1966, 1306.
28. W. C. Johnson and P. W. Voorhees, Metall. Trans., 16A, 1985, 337.
29. D. J. Thoma and J. H. Perepezko, Mat. Res. Soc. Syrup. Proc., 194, 1990, 105.
30. M. Takeyama and C. T. Liu, Mat. Sci. Eng., A132, 1991, 61.
31. A. Garg, NASA Lewis Research Center, Private Communication, October 1993.
32. G. M. Michal, Case Western Reserve University, Private communication, 1993.
33. J. R. Groza, "Microstructural Features of A New Precipitation Strengthened Cu-8Cr-
4Nb Alloy," Mater. Charact., 31, 1993, 133.
50
34. D. B. Butrymowicz,J.R. Manning,andM. E. Read,Diffusion Rate Data and Mass
Transport Phenomena for Copper Systems, Diffusion in Metals Data Center,
Metallurgy Division, Institute for Materials Research, National Bureau of
Standards, Washington, D.C., (July 1977).
35. J. Crank, "'The Mathematics of Diffusion," 2nd Ed., Clarendon Press, Oxford, 1975,
p 104-105.
36. A. Almazouzi, M.-P. Macht, V. Naundorf, G. Neumann and V. Tolle, Defect and
Diffusion Forum, 95-98, 1993,703.
37. I. Barin, Thermochemical Data of Pure Substances, VCH Verlagsgesellschaft mbH,
Weinhein, 1993, p. 431, 1027-1029.
38. H. Nowotny and K. Seifert, Atomic Energy Review, Part III, International Atomic
Energy Agency, Vienna, 1968.
39. K. R. Anderson, J. R. Groza, R. L. Dreshfield and D. L. Ellis, Met. Trans., 26A,
1995, 2197.
M. Hillert, Acta Met. 13, 1965, 227.
T. Gladman, Proc. Roy. Soc., A294, 1966, 298.
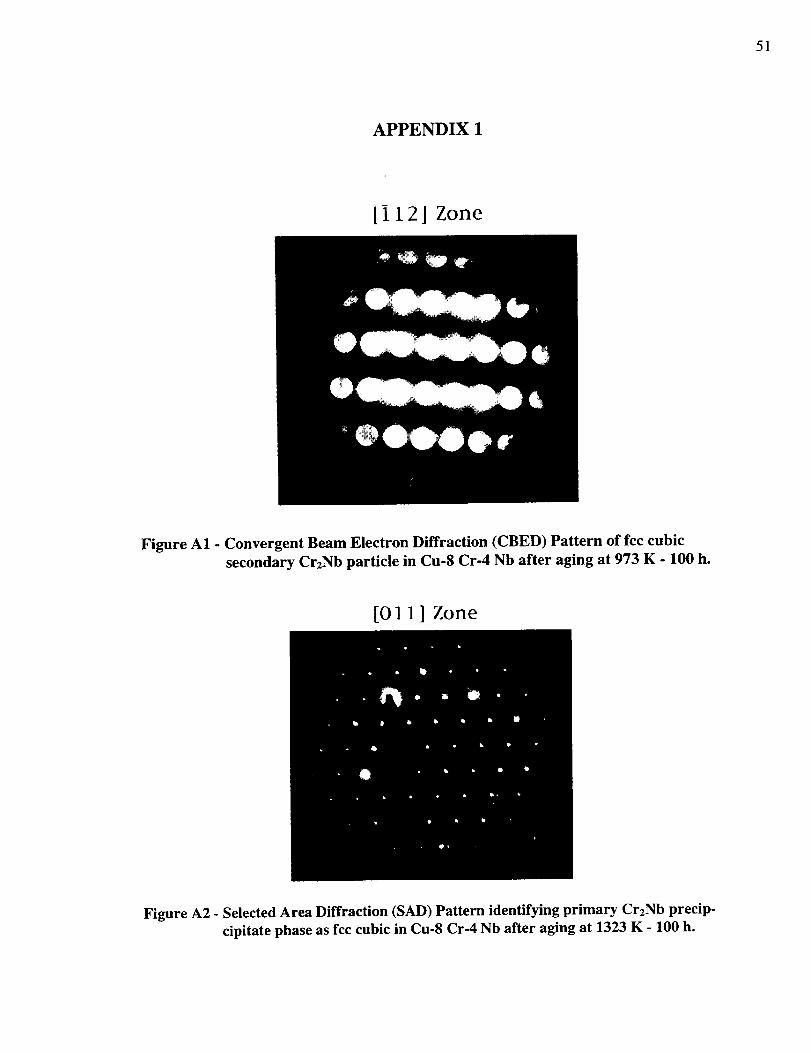
51
APPENDIX 1
[i121 Zone
Figure A1 - Convergent Beam Electron Diffraction (CBED) Pattern of fcc cubic
secondary Cr2Nb particle in Cu-8 Cr-4 Nb after aging at 973 K - 100 h.
[01 l ] Zone
Figure A2 - Selected Area Diffraction (SAD) Pattern identifying primary Cr2Nb precip-
cipitate phase as fcc cubic in Cu-8 Cr-4 Nb after aging at 1323 K - 100 h.
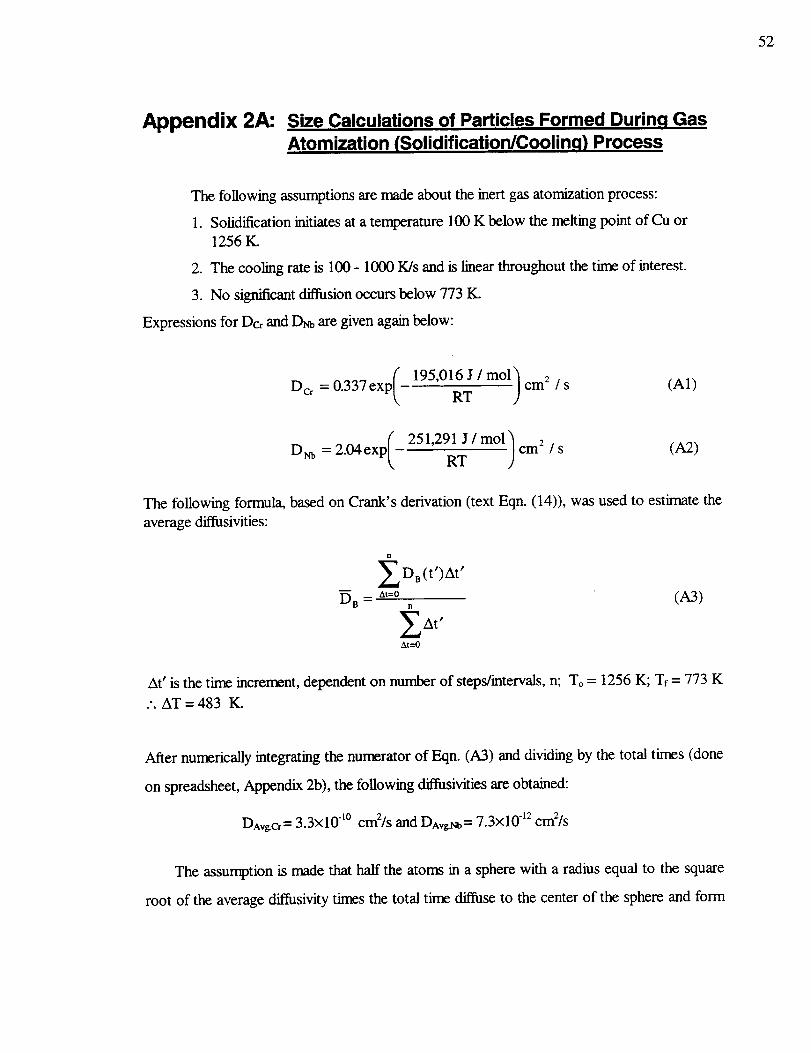
52
Appendix 2A: Size Calculations of Particles Formed During GasAtomization (Solidification/Cooling) Process
The following assumptions are made about the inert gas atomization process:
1. Solidification initiates at a temperature 100 K below the melting point of Cu or
1256 K.
2. The cooling rate is 100 - 1000 K/s and is linear throughout the time of interest.
3. No significant diffusion occurs below 773 K.
Expressions for Dc_ and D_ are given again below:
195,016 J / mol)Dc, = 0.337exp _-,17 cm 2 / s
I 251,291J/mollD_ = 2.04exp _,lZ cm 2 / S
(A1)
(A2)
The following formula, based on Crank's derivation (text Eqn. (14)), was used to estimate the
average diffusivities:
n
DB(t')At'
DB _ At=0n
At'At---0
(A3)
At' is the time increment, dependent on number of steps/intervals, n; To = 1256 K; Tf = 773 K
.'. AT = 483
After numerically integrating the numerator of E,qn. (A3) and dividing by the total times (done
on spreadsheet, Appendix 2b), the following diffusivities are obtained:
DAv_C,= 3.3X10 l° cm2/s and DAv_= 7.3X10 12 cm2/s
The assumption is made that half the atoms in a sphere with a radius equal to the square
root of the average diffusivity times the total time diffuse to the center of the sphere and form

53
the precipitate. It is also assumed that the concentration of Cr and Nb at the precipitate/matrix
interface is zero.
Cooling Rate ofc = lxlO2-1xlO 3 is range for Ar gas atomization. The following calculations
would be the same regardless of cooling rate; a cooling rate ofc = 100 K/s is used for this case:
= _/3.3x10 -1° cm2/s • 4.83 s
= _/7.3x10 "12 cm2/s • 4.83 s
= 4.0x10 .5 cm = 400 nm
= 5.94×10 .6 cm = 59.4 nm.
V_, 4nR3 4= = --n(59.4nm) 3 = 8.77x10⁵nm 33 3
In order to calculate the total flux of atoms to the precipitate, it is necessary to determine the
concentration of atoms per cubic nanometer.
The composition, in atomic percent (a/o), Cu-8 Cr-4 Nb, is considered in estimating atom
fluxes. (It is assumed that a change in the Cu lattice parameter is effectively inconsequential.)
By calculating the number of atoms of Cu per cubic nanometer and applying the respective a/o,
the number of Cr and Nb atoms per cubic nanorneter is determined.
Cu unit cell size calculation:
ao = 0.36153 nm
3 0.047253 nm 3Vcu = a o =
The number of Cr and Nb atoms in the appropriate sphere size just determined are calculated
by calculating the number of Cu unit cells in the sphere volume and by multiplying by 4 Cu
atoms per unit cell and atomic fractions of Cr and Nb, respectively.
Ncr = # Cu unit cells x 4 x 0.08 x 0.5 First, for the number of Cu unit cells and atoms:
= 2.68x10⁸ nm 3Wcr 4 RCr 4= = -- _(400 nm) 33 3
The total volume of the spheres are determined using the above radii:
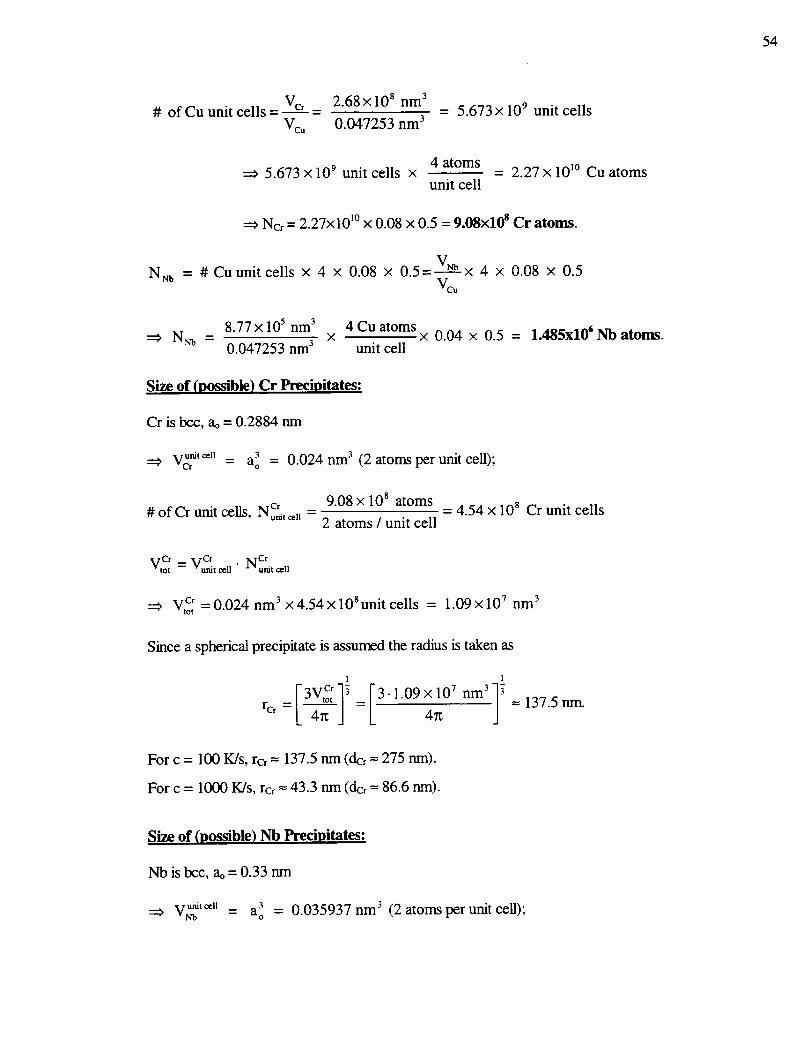
54
# of Cu unit cells = Vc' =
Wcu
2.68× 10⁸ nm 3
0.047253 nm 3= 5.673x l0 9 unit cells
5.673 x 10 9 unit cells x4 atoms
unit cell= 2.27 x 10 l° Cu atoms
Ncr= 2.27x101° x 0.08 × 0.5 = 9.08x10 s Cr atoms.
Nm # Cu unit cells x 4 x 0.08 x 0.5= V_= _× 4 x 0.08 x 0.5Vco
8.77 × 10⁵ nm 3 4 Cu atoms= x ×0.04 x 0.5 =
N_ 0.047253 nm 3 unit cell1.485x106 Nb atoms.
Size of (possible) Cr Precipitates:
Cr is bcc, ao = 0.2884 nm
wunit"Cr cen = ao3 = 0.024 nm 3 (2 atoms per unit cell);
9.08 x 10⁸ atoms= = 4.54 × 10⁸ Cr unit cells
# of Cr unit cells, NuC_tcen 2 atoms / unit cell
VtoCr Cr Cr= Wurtit cell " N unit cell
:=_ V,o° =0.024 nm 3 × 4.54 x108 unit cells = 1.09x10⁷ nm 3
Since a spherical precipitate is assumed the radius is taken as
1 1
= [3vtC_ ] _ = i3"1"09X 107 nm3] "_= 137.5 nm.rc_ L 4r¢ J 4rt
For c = 100 K/s, rc, = 137.5 nm (dc_ = 275 nm).
For c = 1000 K/s, rc_ - 43.3 nm (dc_ = 86.6 nm).
Size of (possible) Nb Precipitates:
Nb is bcc, ao = 0.33 nm
--_vurnto_, = ao3 = 0.035937 nm 3 (2 atoms per unit cell);
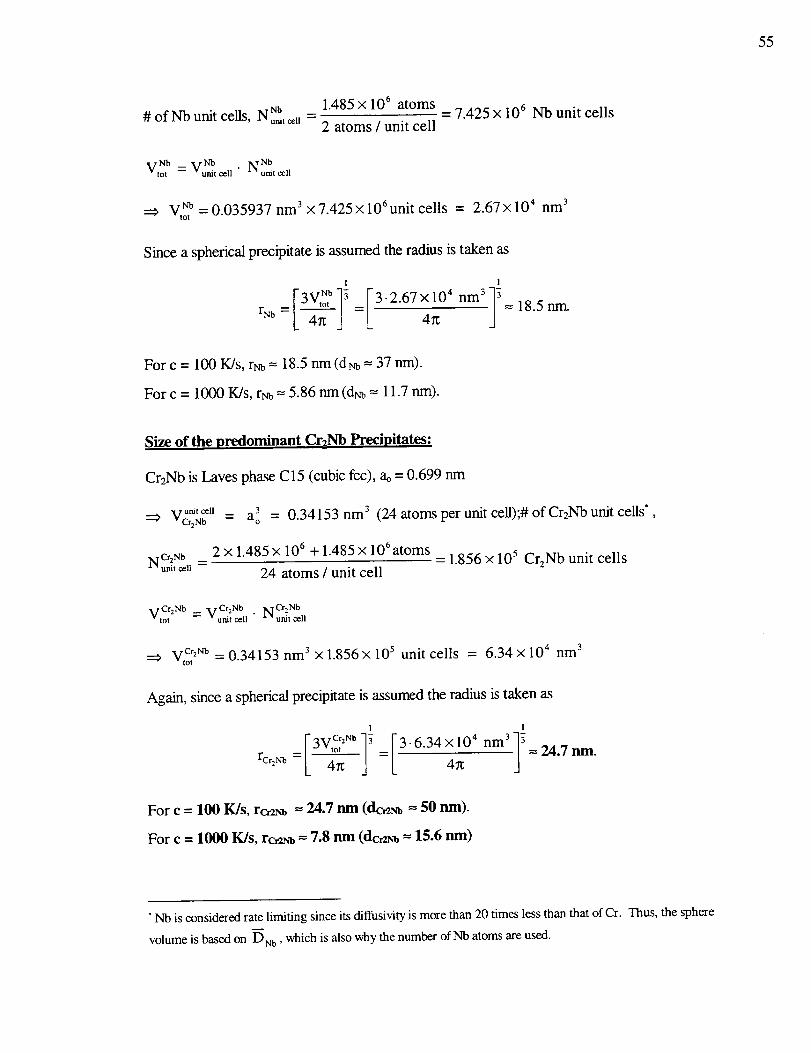
55
1.485× 10⁶ atomsNb _-
# of Nb unit cells, N,ni, celt 2 atoms / unit cell= 7.425 × 10 6 Nb unit cells
VtoNb Nb Nb= Wunit cell " N unit cell
:=> V,o_ = 0.035937 nm 3 × 7.425 × 106 unit cells = 2.67 × 10⁴ nm 3
Since a spherical precipitate is assumed the radius is taken as
1 1
= [3V'_tb 13 = 1.3"2"67 × 104 rim3 13 = 18.5 nm.rNb 1_ 4_ J 4_
For c = 100 K/s, rNb----18.5 nm (dNb = 37 rim).
For c = 1000 K/s, rNb ----5.86 nm (dNu = 11.7 nm).
Size of the predominant CrzNb Precipitates:
Cr2Nb is Laves phase C15 (cubic fcc), at = 0.699 nm
v uni,cell 3 0.34153 nm 3 (24 atoms per unit cell);# of Cr2Nb unit cells"--Cr2N b -_ a o =
NCr2Nb 2 x 1.485 x 106 + 1.485 x 10⁶ atoms = 1.856 X 10⁵ Cr2Nb unit cellsunitcell = 24 atoms / unit cell
vCr2Nb _ V Cr'Nb . ]NICr2 Nbtot --unit cell " " unit cell
vtC_2Nb = 0.34153 nm 3 x 1.856 x l0 s unit cells = 6.34 x 10⁴ nm 3
Again, since a spherical precipitate is assumed the radius is taken as
1 l
VqvCr:_b 13 [3.6.34x104 nm313=/- -,or = 24.7 nm.
rcr:Nb L 4g =l_ 4_t
For c = 100 K/s, rcar_ -- 24.7 nm (dca_ = 50 rim).
For c = 1000 K/s, rca_ -- 7.8 nm (dca_ -- 15.6 rim)
• Nb is considered rate limiting since its diffusivity is more than 20 times less than that of Cr. Thus, the sphere
volume is based on DNb, which is also why the number of Nb atoms are used.
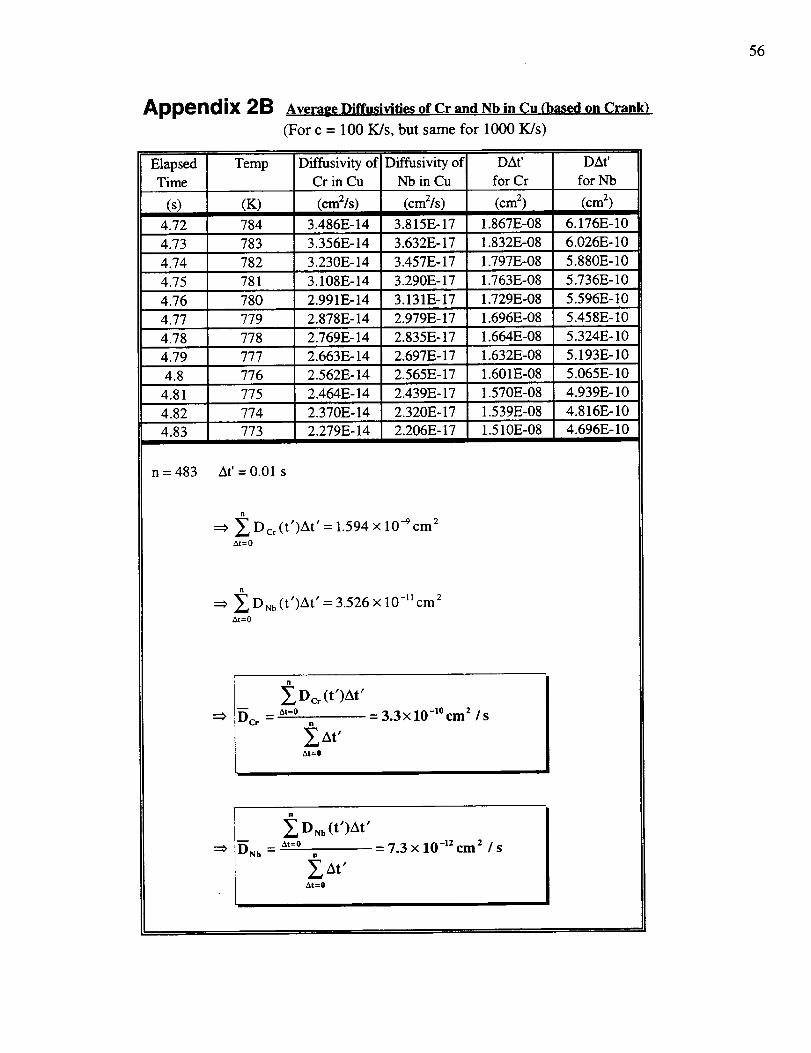
56
Appendix 2B Average Diffusivities of Cr and Nb in Cu (based on Crank)
(For c = 100 K/s, but same for 1000 K/s)
Elapsed
Time
(s)
4.72
4.73
4.74
4.75
4.76
4.77
Temp
(K)
784
783
782
781
780
779
Diffusivity ofCr in Cu
(cm2/s)
3.486E-14
3.356E- 14
3.230E- 14
3.108E-14
2.991E-14
2.878E-14
Diffusivity of
Nb in Cu
(cm2/s)
3.815E-17
3.632E-17
3.457E-17
3.290E-17
3.131E-17
2.979E-17
4.78 778 2.769E-14 2.835E-17
4.79 777 2.663E-14 2.697E-17
4.8 776 2.562E-14 2.565E-17
4.81 775 2.464E-14 2.439E-17
DAt'
for Cr
(cm 2)
1.867E-08
1.832E-08
1.797E-08
1.763E-08
1.729E-08
1.696E-08
DAt'
for Nb
(cm 2)
6.176E-10
6.026E-10
5.880E-10
5.736E- 10
5.596E- 10
5.458E- 10
1.664E-08 5.324E- 10
1.632E-08 5.193E- 10
1.601E-08 5.065E- 10
4.939E-101.570E-08
4.82 774 2.370E-14 2.320E-17 1.539E-08 4.816E-10
4.83 773 2.279E-14 2.206E-17 1.510E-08 4.696E-10
n = 483 At' = 0.01 s
=:_ £ Dc_(t')At' = 1.594 x 10⁻⁹cm 2At=0
£ DNb (t')At' = 3.526 x 10 -11 cm 2At=0
I II
zxt_oDCr (t')At"
n
_ At'At=O
- 3.3X 10⁻¹° cm z Is
ql-- £ DNb(t')At'
DN b = At=o
At'At =0
= 7.3 x 10-_2 cm z / s

Form Approved
REPORT DOCUMENTATION PAGE OMBNo.0704-0188
Of irlfomtlion, ieciudlngsoggeslions tot reducing_ ouroen, to Wil_i_t HeiOqUlUW_ _ervlcm. uncmrmm _ imomlmm, uimmum_ _ _ ,.:_ mmmrw,,Davb Highway, Sultl 1204, Ad_ton, VA 222(]Q-4302, and Io the Ofltoe of Management and Budget. Papimmck RleckctimtProjed (0704-0188), W,m_Otml, DC 2050_.
1. AGENCY USE ONLY {Leave blank) 2. REPORTDATE 3. F_.PORTTYPEANDDAT_SCOVI=_=u
June 1996 Final Contractor Report
4. TITLE AND SUBTITLE
High Temperature Coarsening of Cr2Nb Precipitates in Cu-8 Cr-4 Nb Alloy
6. AUTHOR(S)
Kenneth Reed Anderson
7. PERFORMINGORGANIZATIONNAME(S)ANDADDRESS(ES)
University of California at DavisDavis, Calif(mlia 95616
g. SPONSORING/MONITORINGAGENCYNAME(S)ANDADDRESS(ES)
Nadonal Aeronautics and Space AdministrationLewis Research CenterCleveland, Ohio 44135-3191
5. _NG NUIB_
WU--466-433-4)2C-77166-B
8. PERFORMING ORGANIZATION
REPORT NUMBER
E-10293
10. SPONSOmNGmiONrrOFUNGAGENCY REPORT NUMBER
NASA CR-198492
11. SUPPLEMENTARYNOTESThis report was submitted as a thesis in partial fulfillment of the requirements for the degree Master of Science to theUniversity of California at Davis, California. Project Manager, Robert L. Dreshfield, Materials Division, NASA Lewis
Research Center, organization code 5120, (216) 433-3267.12a. DISTRIBUTION/AVAILABlUTY STATEMENT
Unclassified -Unlimited
Subject Category 26
This publicalion is available from the NASA Center for AeroSpace Information, (301) 621--0390
12b. DISTRIBUTION CODE
13. ABSTRACT (MaJdmum 200 words)
A new high-temperature-strength, high-conductivity Cu-Cr-Nb alloy with a Cr:Nb ratio of 2:1 was developed to achieveimproved perfcxmance and durability. The Cu-8 Cr-4 Nb alloy studied has demonstrated remarkable thermal and micro-structural stability after long exposures at temperatures up to 0.98 Tm. This stability was mainly attributed to the slowcoarsening kinetics of the Cr2Nb precipitates present in the alloy. At all temperatures, the microstructure consists of abimodal and sometimes trimodal distribution of strengthening Cr2Nb precipitates, depending on precipitation condition,i.e. from liquid or solid solution, and cooling rates. Thee precipitates remain in the same size range, Le. large precipitatesof approximately I fun, and small precipitates less than 300 run, and effectively pin the grain boundaries thus retaining afine grain size of 2.7 pJn after 100 h at 1323 IC (A relatively small number of Cr-rich and Nb-rich particles were alsopresent.) This grain boundary pinning and sluggish coarsening of Cr2Nb particles explain the retention of good mechani-cal properties after Ixolonged holding at very high temperatures, e.g., 75% of the original hardness ai_ aging for 100 h at1273 K. Application of LSW-based coarsening models indicated that the coarsening kinetics of the large precipitates aremost likely governed by grain boundary diffusion and, to a lesser extent, volume diffusion mechanisms.
14. SUBJECT TERMS
Alloys; Copper;,High temperature;Thermal conductors
17. SECURITY CLASSIFICATION 18. SECURITY CLASSIFICATIONOF REPORT OF THIS PAGE
Unclassified Unclassified
NSN 7540-01-280-5500
19. SECURITY CLASSIFICATIONOF ABSTRACT
Unclassified
15. NUMBER OF PAGES
16. PRICE CODE
A0420. UMITATION OF AI:;_]-HACT
Standard Form 298 (Rev. 2-89)
Presodbed by ANSI Std. Z39-18298-102


nO--
.. .Q-o
-_ oO_ _._ __ _ _.o
_._ o_-_
Z _
"n
3