high value organic waste treatment via black soldier fly ...868277/fulltext02.pdf · high value...
TRANSCRIPT
i
High Value Organic Waste Treatment
via Black Soldier Fly Bioconversion
(Onsite Pilot Study)
R i c h a r d N a s i l e l e M u t a f e l a
Master of Science Thesis
Stockholm 2015

ii
iii
Richard Nasilele Mutafela
Master of Science Thesis
STOCKHOLM 2015
High Value Organic Waste Treatment Via Black Soldier Fly
Onsite Pilot Study
PRESENTED AT
INDUSTRIAL ECOLOGY ROYAL INSTITUTE OF TECHNOLOGY
Supervisors:
Monika Olsson, Industrial Ecology, KTH
Graham Aid, R&D Professional, Ragn Sells AB
Paul Würtzell, R&D, Ragn Sells AB
Examiner:
Monika Olsson, Industrial Ecology, KTH

iv
TRITA-IM-EX 2015:16
Industrial Ecology, Royal Institute of Technology www.ima.kth.se
i
Abstract The desire for value addition to the organic waste management chain at Högbytorp using the Black Soldier Fly (BSF) process, as well as the problem of the escalating demand for protein in livestock feed motivated this study. Good quality crop land is devoted to growing feed for animals at the expense of human food, and ironically with a full understanding of the associated environmental footprints. Black Soldier Fly Larvae (BSFL) feed on organic waste voraciously while building their body composition of 40% protein and 30% fat. Their protein can be used in animal feedstock and pet food, replacing the more expensive but nutritionally comparable fishmeal, while their fat can be used for biodiesel production. They can also reduce a waste pile significantly, minimizing possible pollution. In this study, the process was tried on various waste streams (fruits, manure and ‘slurry reject’) at Högbytorp. Biomass conversion, larval fat and protein content, compost by-product characteristics and residence time requirements for each stream were assessed. The study involved literature review, chemical analyses and experimental design (rearing BSFL on waste through their lifecycle). The study yielded waste reduction up to 83% and fat and protein contents up to 42% and 41% respectively, depending on the waste stream. The residence time depended on the age at which the larvae started feeding, but ranged between 8-11 days. If applied in organic waste management chain, the process could contribute to greener energy provision (biodiesel) as well as sustainable protein provision to the animal, fish and pet industries. It could further reduce waste amounts significantly and generate income while contributing to the saving of Earth’s limited resources.
Key words: Organic waste, bioconversion, Hermetia illucens.
ii
Acknowledgement Firstly, I thank my God Almighty for granting me the opportunity to study at KTH and providing me with good health (physical, mental and emotional) and strength throughout this two-year period.
Special thanks go to Ragn Sells AB for initiating this exciting project, for granting me the opportunity to work on it, and for providing all the necessary support which ensured successful project execution. I am very grateful to Monika Olsson, my supervisor at KTH, for all the guidance throughout the course of the project, as well as for all the encouragements and interactions during my two-year study at Industrial Ecology, KTH. She surely made the perceivably impossible to become possible. I am also sincerely thankful to Graham Aid, my supervisor at Ragn Sells, for the guidance throughout the project and more so for his physical input when setting up the pilot facility, and for the guidance and support during every step of the project.
I am grateful to Paul Wurtzell and Kerstin Clefalk, staff at Högbytorp Laboratory, for their support and assistance in various ways. I feel greatly indebted to Paul for the dedicated assistance and guidance, personal sacrifices, and for all the logistical support. The friendly staff at the company also made the work easier with their different contributions, and for this I say thanks.
Special thanks go to my family in Zambia, more especially my mother, Sharon Mutale, for all the encouragements and the motherly love that made me feel the connection to home even when I was far away. Another person I feel very indebted to is my fiancée, Racheal Bwika, for her dedicated support and prayers during the whole period I have been away from home. The encouragements she gave when the going got tough were timely and helpful.
The network of friends I made here in Sweden is also worth mentioning. They surely had their part in making this place a home away from home. As one African proverb rightly puts it: “It takes a whole village to raise a child”, I should simply mention that many people, both home and in Sweden, contributed in their own special ways to my success. Thank you all.
Last, but not least, my sincere gratitude goes to the Swedish Institute (SI) for providing the scholarship that funded my studies at KTH and my comfortable stay in Sweden, emanating in this master thesis report. The well-organized social events, study tours and seminars all had their part in shaping the well-networked professional in me. You planted in my heart a reason to forever be grateful and connected to Sweden. Thank you SI!
iii
Abbreviations
BCRC Beef Cattle Research Council BR Bioconversion Rate BSF Black Soldier Fly BSFL Black Soldier Fly Larvae CSIRO Commonwealth Scientific and Industrial Research Organization DMR Dry Matter Reduction EC European Commission FAO Food and Agriculture Organisation of the United Nations FCR Feed Conversion Rate GHG Green House Gas IIASA International Institute for Applied Systems Analysis PAP Processed Animal Protein PW Prepupal Weight
iv
Table of Contents Abstract .................................................................................................................................................... i
Acknowledgement .................................................................................................................................. ii
Abbreviations ......................................................................................................................................... iii
1. Introduction .................................................................................................................................... 1
1.1. Aims......................................................................................................................................... 3
1.2. Objectives................................................................................................................................ 3
1.3. System Boundaries .................................................................................................................. 3
1.4. Limitations............................................................................................................................... 3
2. Background ..................................................................................................................................... 4
2.1. Circular Economy Concepts .................................................................................................... 4
2.2. Organic Waste Management at Högbytorp ............................................................................ 4
2.3. BSF Introduction, History and Traits ....................................................................................... 5
2.3.1. Description ...................................................................................................................... 5
2.3.2. Life Cycle and Growth Conditions ................................................................................... 6
2.4. BSF Process Aspects (Social, Economic and Environmental) .................................................. 8
2.5. Drawbacks in the BSF and Insect Sector in General ............................................................. 11
2.6. Husbandry (Breeding Requirements) ................................................................................... 13
3. Methods ........................................................................................................................................ 16
3.1. Literature Review .................................................................................................................. 16
3.2. Experimental Design / Materials ........................................................................................... 16
3.2.1. Equipment and Conditions ............................................................................................ 17
3.2.2. The Life Stages .............................................................................................................. 21
3.3. Sample Preparation for Analyses .......................................................................................... 25
3.4. Chemical Analyses ................................................................................................................. 27
3.4.1. Protein and Fat Contents .............................................................................................. 27
3.4.2. Fat Content ................................................................................................................... 27
3.4.3. Nutrient Contents ......................................................................................................... 27
3.5. Calculation of Results ............................................................................................................ 27
3.5.1. Protein and Fat Contents .............................................................................................. 27
3.5.2. Biomass Conversion ...................................................................................................... 27
3.5.3. Nutrient Contents ......................................................................................................... 28
3.5.4. Residence Time Requirements ..................................................................................... 28
3.6. Other Analyses ...................................................................................................................... 28
v
3.6.1. Economic Analysis of BSF Process ................................................................................. 28
3.6.2. Consideration of Requirements for Livestock Protein Generation in Comparison with
BSF Protein .................................................................................................................................... 30
3.6.3. SWOT Analysis of the BSF Process ................................................................................ 30
4. Results ........................................................................................................................................... 31
4.1. Protein and Fat Contents ...................................................................................................... 31
4.2. Biomass Conversion .............................................................................................................. 31
4.3. Nutrient Contents ................................................................................................................. 39
4.4. Residence Time Requirements ............................................................................................. 39
4.5. Brief Economic Analysis of the BSF Process .......................................................................... 39
4.6. Consideration of Requirements for Livestock Protein Generation in Comparison BSF
Protein ………………………………………………………………………………………………………………………………………..40
4.7. SWOT Analysis of the BSF Process ........................................................................................ 42
5. Discussion ...................................................................................................................................... 43
5.1. The Rearing Process .............................................................................................................. 43
5.2. Comparisons between Batch and Continuous Feeding ........................................................ 43
5.3. Biomass Conversion .............................................................................................................. 44
5.3.1. Bioconversion Rates (BR), Feed Conversion Rates (FCR), Prepupal Weights (PW), Dry
Matter Reductions (DMR) and Residence Time Requirements ........................................................ 44
5.3.2. Fat, Protein and Nutrient Contents................................................................................... 45
5.3.3. Fate of Feed in a Feeding Regime ..................................................................................... 45
5.3.4. Consideration of Requirements for Livestock Protein Generation in Comparison with BSF
Protein ………………………………………………………………………………………………………………………………………..46
6. Conclusion ..................................................................................................................................... 47
7. Recommendations ........................................................................................................................ 48
References ............................................................................................................................................ 49
Appendices ............................................................................................................................................ 54
1
1. Introduction The world has seen, and continues to see a rise in population growth. To meet the needs of this rising population, more and more resources, both renewable and non-renewable, are involved as they get more scarce and endangered. This trend has led to high consumption coupled with high waste generation, as should be expected. The irony of the matter is that while the world population continues to grow along with resource consumption and waste generation, the resources are becoming limited, triggering various responses from different sectors of society. There is, definitely, need for consented efforts from all sectors in solving this paradox, more so to ensure reduced resource use, consumption and waste generation.
In the waste management chain, there have been value addition efforts where wastes have been transformed to other valuable resources, thereby reducing the need for fresh raw materials. One such approach is in the Black Soldier Fly (BSF) bioconversion of organic wastes. Organic wastes such as animal wastes, household wastes, commercial wastes (from stores, shops, markets, hotels, etc.) and institutional wastes (schools, hospitals, etc.) are usually generated in large quantities, and are potential environmental pollutants and human health hazards if not handled well (Li et al., 2011). Not only do we jeopardise our health and that of the environment when we don’t take good care of our waste, we also lose on the economic benefit thereof. Food and other organic wastes are a valuable resource that we shouldn’t waste as it contains a lot of nutrients and energy value that could be beneficial to both humans and the environment if reintegrated into the value chain.
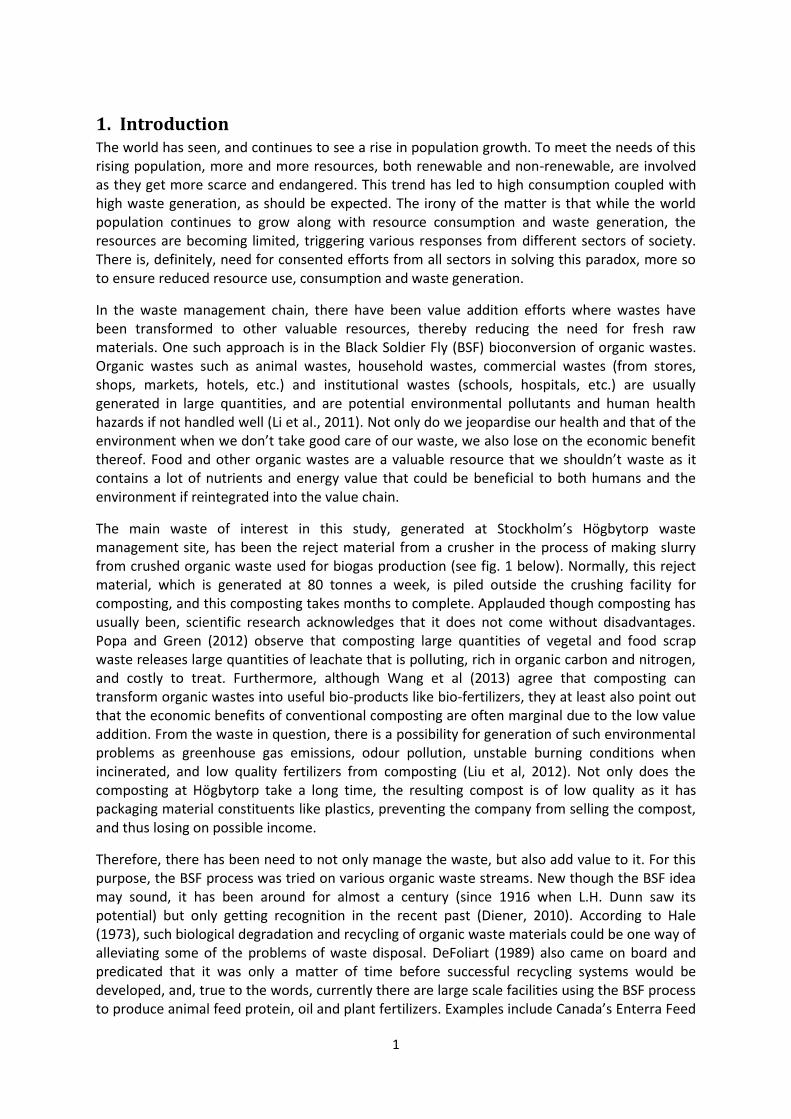
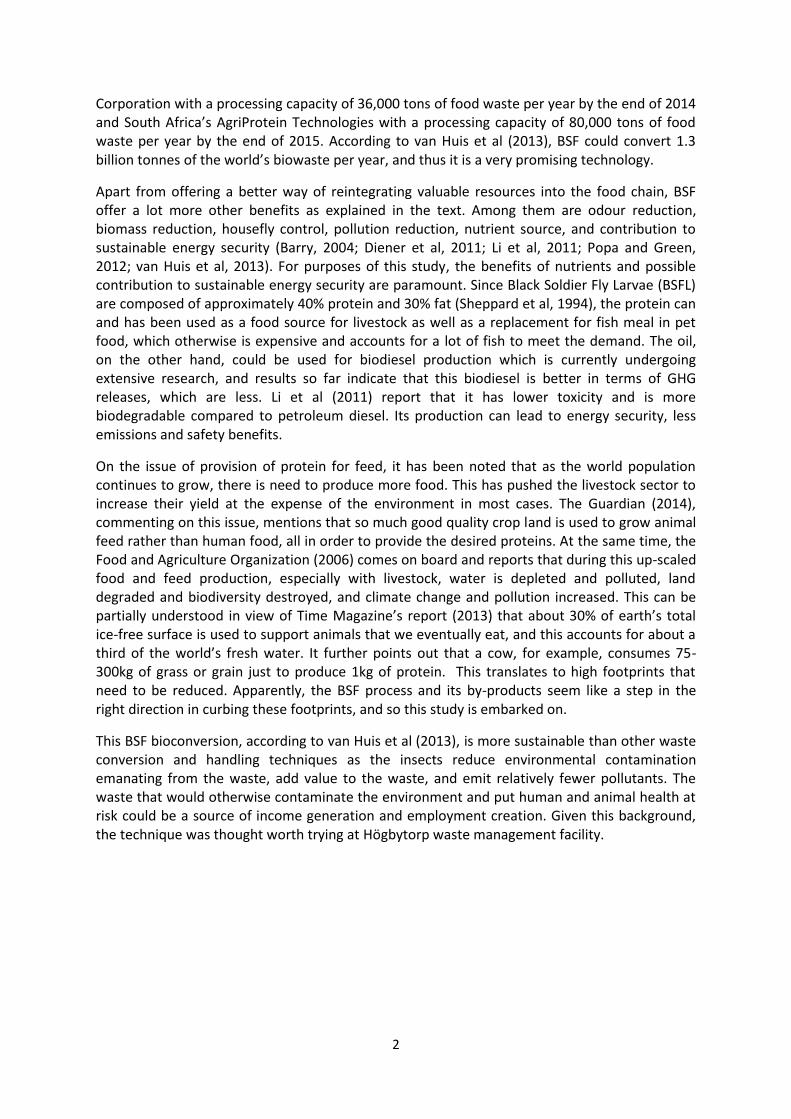
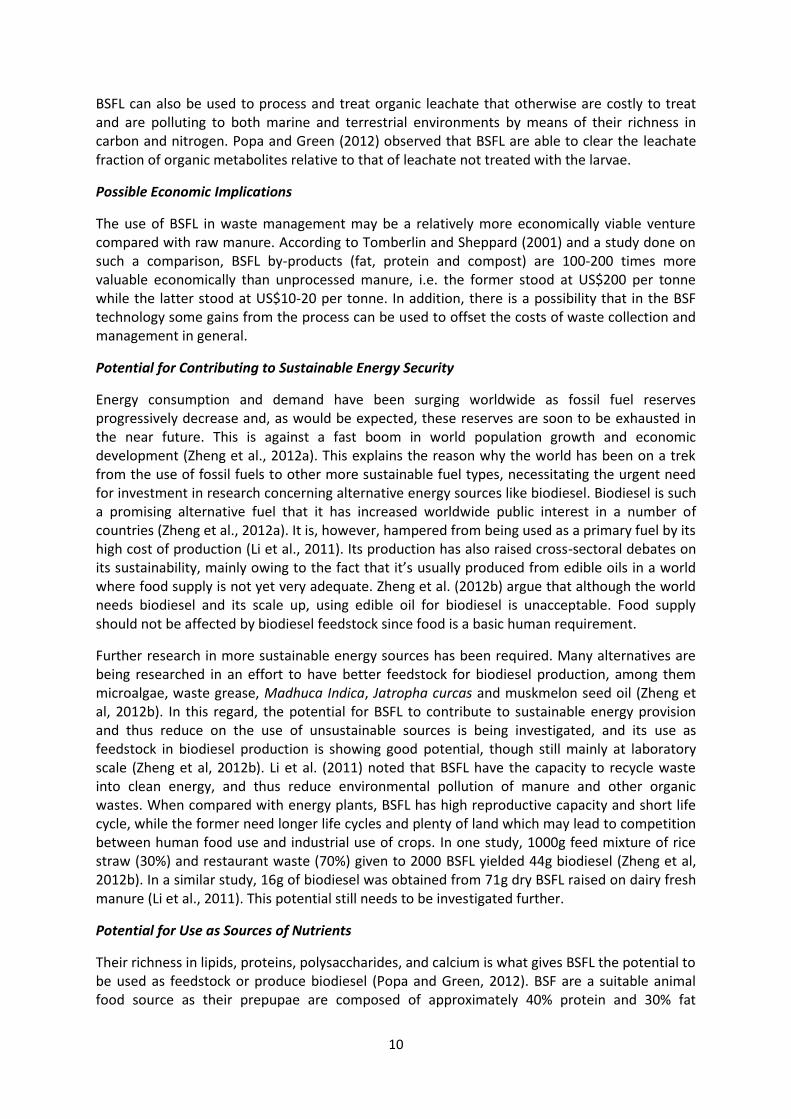
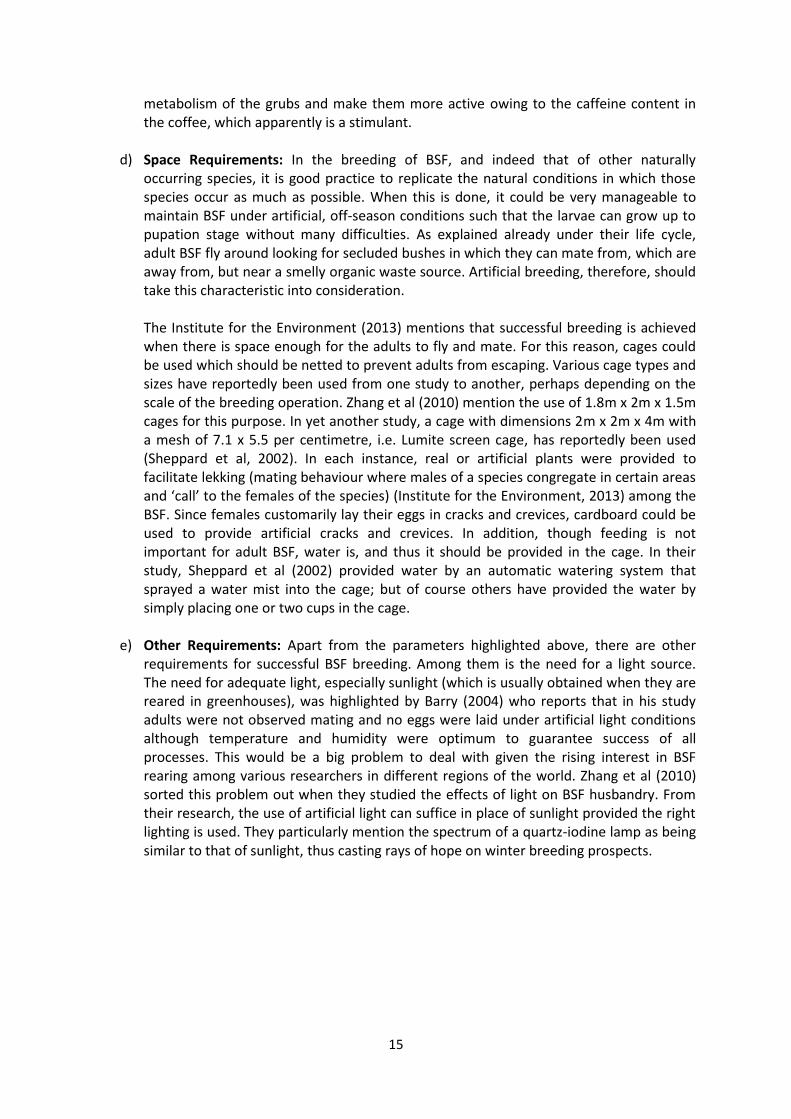
The main waste of interest in this study, generated at Stockholm’s Högbytorp waste management site, has been the reject material from a crusher in the process of making slurry from crushed organic waste used for biogas production (see fig. 1 below). Normally, this reject material, which is generated at 80 tonnes a week, is piled outside the crushing facility for composting, and this composting takes months to complete. Applauded though composting has usually been, scientific research acknowledges that it does not come without disadvantages. Popa and Green (2012) observe that composting large quantities of vegetal and food scrap waste releases large quantities of leachate that is polluting, rich in organic carbon and nitrogen, and costly to treat. Furthermore, although Wang et al (2013) agree that composting can transform organic wastes into useful bio-products like bio-fertilizers, they at least also point out that the economic benefits of conventional composting are often marginal due to the low value addition. From the waste in question, there is a possibility for generation of such environmental problems as greenhouse gas emissions, odour pollution, unstable burning conditions when incinerated, and low quality fertilizers from composting (Liu et al, 2012). Not only does the composting at Högbytorp take a long time, the resulting compost is of low quality as it has packaging material constituents like plastics, preventing the company from selling the compost, and thus losing on possible income.
Therefore, there has been need to not only manage the waste, but also add value to it. For this purpose, the BSF process was tried on various organic waste streams. New though the BSF idea may sound, it has been around for almost a century (since 1916 when L.H. Dunn saw its potential) but only getting recognition in the recent past (Diener, 2010). According to Hale (1973), such biological degradation and recycling of organic waste materials could be one way of alleviating some of the problems of waste disposal. DeFoliart (1989) also came on board and predicated that it was only a matter of time before successful recycling systems would be developed, and, true to the words, currently there are large scale facilities using the BSF process to produce animal feed protein, oil and plant fertilizers. Examples include Canada’s Enterra Feed
2
Corporation with a processing capacity of 36,000 tons of food waste per year by the end of 2014 and South Africa’s AgriProtein Technologies with a processing capacity of 80,000 tons of food waste per year by the end of 2015. According to van Huis et al (2013), BSF could convert 1.3 billion tonnes of the world’s biowaste per year, and thus it is a very promising technology.
Apart from offering a better way of reintegrating valuable resources into the food chain, BSF offer a lot more other benefits as explained in the text. Among them are odour reduction, biomass reduction, housefly control, pollution reduction, nutrient source, and contribution to sustainable energy security (Barry, 2004; Diener et al, 2011; Li et al, 2011; Popa and Green, 2012; van Huis et al, 2013). For purposes of this study, the benefits of nutrients and possible contribution to sustainable energy security are paramount. Since Black Soldier Fly Larvae (BSFL) are composed of approximately 40% protein and 30% fat (Sheppard et al, 1994), the protein can and has been used as a food source for livestock as well as a replacement for fish meal in pet food, which otherwise is expensive and accounts for a lot of fish to meet the demand. The oil, on the other hand, could be used for biodiesel production which is currently undergoing extensive research, and results so far indicate that this biodiesel is better in terms of GHG releases, which are less. Li et al (2011) report that it has lower toxicity and is more biodegradable compared to petroleum diesel. Its production can lead to energy security, less emissions and safety benefits.
On the issue of provision of protein for feed, it has been noted that as the world population continues to grow, there is need to produce more food. This has pushed the livestock sector to increase their yield at the expense of the environment in most cases. The Guardian (2014), commenting on this issue, mentions that so much good quality crop land is used to grow animal feed rather than human food, all in order to provide the desired proteins. At the same time, the Food and Agriculture Organization (2006) comes on board and reports that during this up-scaled food and feed production, especially with livestock, water is depleted and polluted, land degraded and biodiversity destroyed, and climate change and pollution increased. This can be partially understood in view of Time Magazine’s report (2013) that about 30% of earth’s total ice-free surface is used to support animals that we eventually eat, and this accounts for about a third of the world’s fresh water. It further points out that a cow, for example, consumes 75-300kg of grass or grain just to produce 1kg of protein. This translates to high footprints that need to be reduced. Apparently, the BSF process and its by-products seem like a step in the right direction in curbing these footprints, and so this study is embarked on.
This BSF bioconversion, according to van Huis et al (2013), is more sustainable than other waste conversion and handling techniques as the insects reduce environmental contamination emanating from the waste, add value to the waste, and emit relatively fewer pollutants. The waste that would otherwise contaminate the environment and put human and animal health at risk could be a source of income generation and employment creation. Given this background, the technique was thought worth trying at Högbytorp waste management facility.
3
Figure 1: Organic waste crusher and reject material at the Organic Site
1.1. Aims The aim of this study is to test the BSF process on various organic waste streams and thus determine the feasibility of using it as a means for sustainable organic waste treatment i.e. waste reduction and waste transformation into valuable products (animal feed protein, biofuel oil and plant fertilizer).
1.2. Objectives The objectives of the study are to:
a) Establish a small pilot facility for testing of the process on various organic material streams (horse manure, mixed fruits, and reject from the slurry production process).
b) Run pilot tests to determine; i. Biomass conversion
ii. Protein content iii. Oil content iv. Compost by-product characteristics v. Residence time requirements for the various inputs
c) Research and describe how up-scaling could be done efficiently in the Swedish context.
1.3. System Boundaries This study has been based on the wastes generated in the city of Stockholm, and as managed by the company Ragn Sells at their Högbytorp waste management facility. Furthermore, the calculations herein pertaining to waste amounts are based on 2014 figures of waste handling at the site.
1.4. Limitations The study was not without limitations, the main one being time. Time was very limited for such an undertaking. For a project depending on raising exotic creatures for results, time needed to be long enough to better optimize all the necessary conditions. As such, there is a possibility that the outcomes may have been affected to some extent by time constraints. In addition, having assessed the potential of the BSF process, there would be need to consider economic,
Organic Waste
Crusher
Reject
Material
4
environmental and social implications of implementing the process for better decision making, but all this could not be done in the limited timeframe.
2. Background
2.1. Circular Economy Concepts This project, and the BSF process at large, may be viewed as a step towards reorganizing the industrial system which Erkman and Ramaswamy (2003) refer to as eco-restructuring. Just like in natural systems there is almost no waste (some species feed on the waste of other species), industry can mimic such a network and ensure exploitation of unutilized resources, thus reducing the need for new raw materials while maximizing resource utilization. Optimizing resource use, closing material loops and minimising emissions are among the strategies that are suggested as a step towards eco-restructuring, of which the BSF process needs to be investigated whether it can be of help as regards these strategies.
Feeding waste to BSF would not only be mimicking nature, but more than that it could have a plus of actually incorporating nature into industrial processes, and thus getting closer to the natural model. Utilizing the investigated protein and oil potential of BSF for stock feed, biodiesel and other by-products, could supply additional resources that otherwise would have been left unutilized and at the same time minimize the pressure on natural systems for more and fresh raw materials.
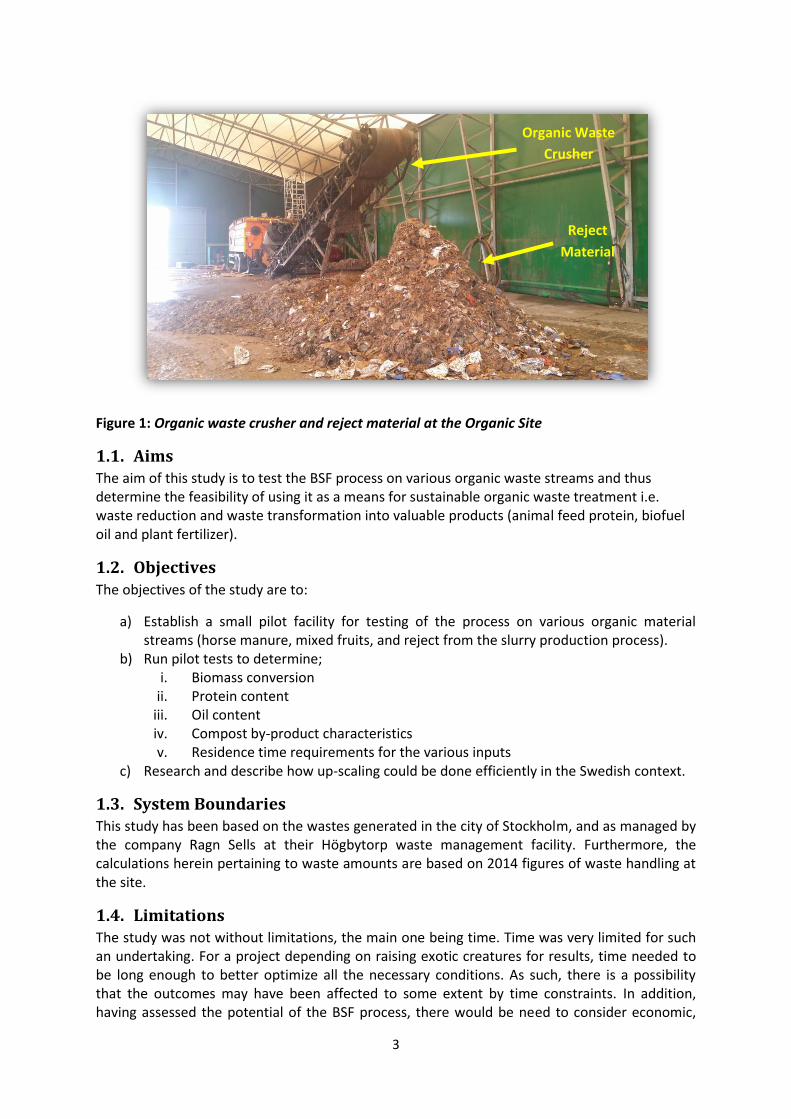
2.2. Organic Waste Management at Högbytorp Organic waste at the facility is handled at ‘Område 3’. Once at the site, waste from households and chain stores is received and bundled outside a shade. Inside the shade is a waste crusher to which the waste in fed while in its packaging material. In the crusher, and while crushing, the required portion of organic waste is separated from packaging material, and then the packaging material comes out with a lot of organic waste residues from the crusher as shown in figure 1. The desired crushed organic material is fed to a slurry tank where water is also added to make organic slurry which is later transported to a biogas facility for digestion. The organic waste-packaging material mixture coming out of the crusher is then taken out of the shade and piled outside for composting. The figure below gives a brief depiction of the process:
Figure 2: Organic Waste Handling at Area 3
Organic Waste
Reception &
Temporal Storage
Waste
Crusher
Slurry
Tank
Crushed
waste
Slurry to
Biogas Plant
Compost Pile
Reject
Material
Water
5
2.3. BSF Introduction, History and Traits Although BSF have recently received and are continuing to receive attention, they are not a new discovery, neither is their potential. Diener (2010) reports that a feel of their potential as ecological engineers was observed as far back as 1916 when L.H. Dunn in Panama (then called Canal Zone) happened to come across a decaying corpse of a young man being voraciously fed on by BSFL in great numbers that covered the whole body. Later researchers and scientists who had encounters with these creatures had various views about them, and so discovery of their potential for use in waste management did not come through a smooth channel. Furman et al (1959) mention that at one point BSFL were used as a means to inhibit house fly from ovipositing in poultry manure, meaning one of their benefits (housefly control) was realised early enough and put to good use. This wasn’t, however, the case with every other scientist. To others, the downside of BSFL overshadowed their benefits to the extent where their only solution was to eradicate them. One such scenario is observed with Axtell and Edwards (1970) where they report that “the actions of the larvae in manure produce an unsightly condition, increase the problem of unpleasant odours, and sometimes cause the manure to spread onto the walkways”. This report was followed by their scouting for “common larviciding chemicals against the larvae”.
The research that has been conducted up until today on BSFL, as presented in this report, can at least prove Axtell and Edwards wrong about their notion of the larvae. It was only three years after their report that another researcher by the name of O.M. Hale was able to see and document the possible benefits that could be obtained from these ‘ecological engineers’ (Diener, 2010). Hale (1973) said “it is plausible to assume that this common soldier fly can be used to convert waste materials into usable, high quality nutrient supplements. Such biological degradation and recycling of organic waste materials could be one way of alleviating some of the problems of waste disposal.” Hope about the possibility to use BSF and insects in general for environmental benefits kept growing, with DeFoliart (1989) joining the list of hope givers by saying “practically every substance of organic origin, including cellulose, is fed upon by one or more species of insects, so it is only a matter of time before successful recycling systems will be developed.” Ever since, various types of research have been done on the flies with various researchers focussing on how BSF can be cultured to get maximum benefits from them, and what other products can be obtained from their culturing.
2.3.1. Description
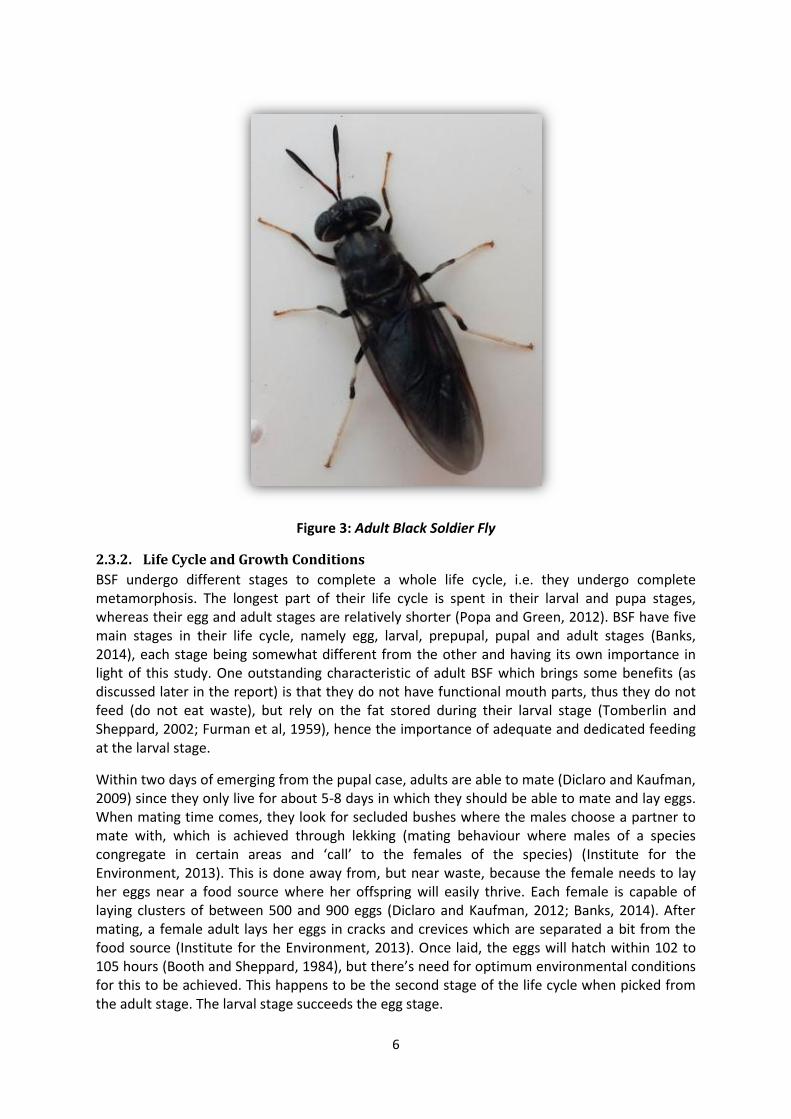
BSF is a fly (Diptera) belonging to a family called Stratiomyidae, and the species Hermetia illucens. It is a large fly ranging in size from 13 to 20mm (see figure 3), and at the same time looks like a wasp such that it would be easy to mistake it for one (Tomberlin et al, 2002). However, an unmistakable difference between the two is that a wasp has four wings whereas BSF has only two wings. Another striking difference is that BSF does not possess a stinger or proboscis, whereas a wasp does (Diclaro and Kaufman, 2009). Though a native of the tropical, subtropical and warm temperate zones of America, as believed (Barry, 2004), BSF is now found in different parts of the world (Banks, 2014), mainly in the tropical and warmer temperate regions. Diener et al. (2011) report that they are now found between 45oN and 40oS, showing the vast range in which they occur. BSF can also tolerate temperature extremes by a wide range throughout their life cycle, except at the point of ovipositing (Barry, 2004).
6
Figure 3: Adult Black Soldier Fly
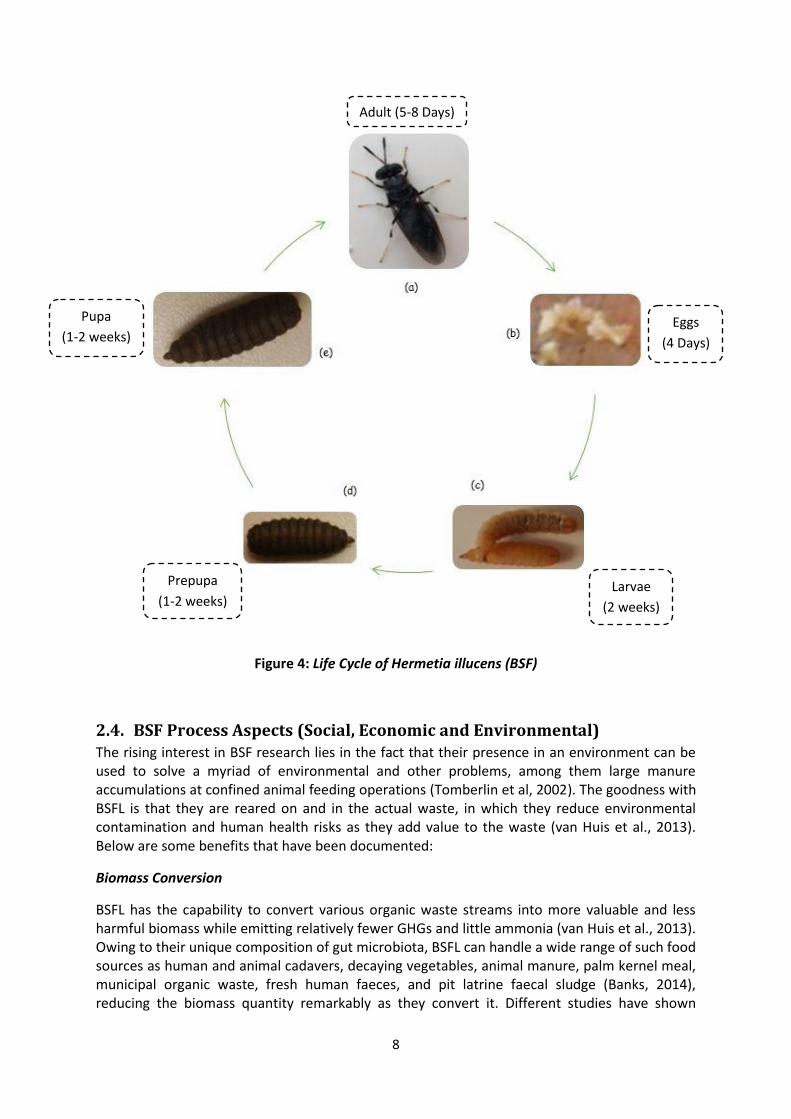
2.3.2. Life Cycle and Growth Conditions
BSF undergo different stages to complete a whole life cycle, i.e. they undergo complete metamorphosis. The longest part of their life cycle is spent in their larval and pupa stages, whereas their egg and adult stages are relatively shorter (Popa and Green, 2012). BSF have five main stages in their life cycle, namely egg, larval, prepupal, pupal and adult stages (Banks, 2014), each stage being somewhat different from the other and having its own importance in light of this study. One outstanding characteristic of adult BSF which brings some benefits (as discussed later in the report) is that they do not have functional mouth parts, thus they do not feed (do not eat waste), but rely on the fat stored during their larval stage (Tomberlin and Sheppard, 2002; Furman et al, 1959), hence the importance of adequate and dedicated feeding at the larval stage.
Within two days of emerging from the pupal case, adults are able to mate (Diclaro and Kaufman, 2009) since they only live for about 5-8 days in which they should be able to mate and lay eggs. When mating time comes, they look for secluded bushes where the males choose a partner to mate with, which is achieved through lekking (mating behaviour where males of a species congregate in certain areas and ‘call’ to the females of the species) (Institute for the Environment, 2013). This is done away from, but near waste, because the female needs to lay her eggs near a food source where her offspring will easily thrive. Each female is capable of laying clusters of between 500 and 900 eggs (Diclaro and Kaufman, 2012; Banks, 2014). After mating, a female adult lays her eggs in cracks and crevices which are separated a bit from the food source (Institute for the Environment, 2013). Once laid, the eggs will hatch within 102 to 105 hours (Booth and Sheppard, 1984), but there’s need for optimum environmental conditions for this to be achieved. This happens to be the second stage of the life cycle when picked from the adult stage. The larval stage succeeds the egg stage.
7
Once hatched from the eggs, larvae craw or fall into the food source (Banks, 2014), showing the importance and need of the female adults to lay their eggs near a food source. In the eyes of Barry (2004), the larvae are particularly beautiful with translucent bodies and a black eye spot. Banks (2014) goes on to mention that the larvae have a unique composition of gut microbiota which enables them to handle a wide range of such food sources as human and animal cadavers, decaying vegetables, animal manure, palm kernel meal, municipal organic waste, fresh human faeces, and pit latrine faecal sludge. The larval stage happens to be the most vital stage of BSF as pertains to waste management as this is the stage at which the waste is fed upon and converted to other desirable products. They have to feed enough to store adequate fat which becomes the food source for adult BSF since they do not feed as already mentioned. The larvae feed for about two weeks before becoming prepupae, which is also subject to the available environmental conditions (Tomberlin et al., 2002). Sheppard et al. (1995) point out that this period could be extended to as long as four months in case of food shortages.
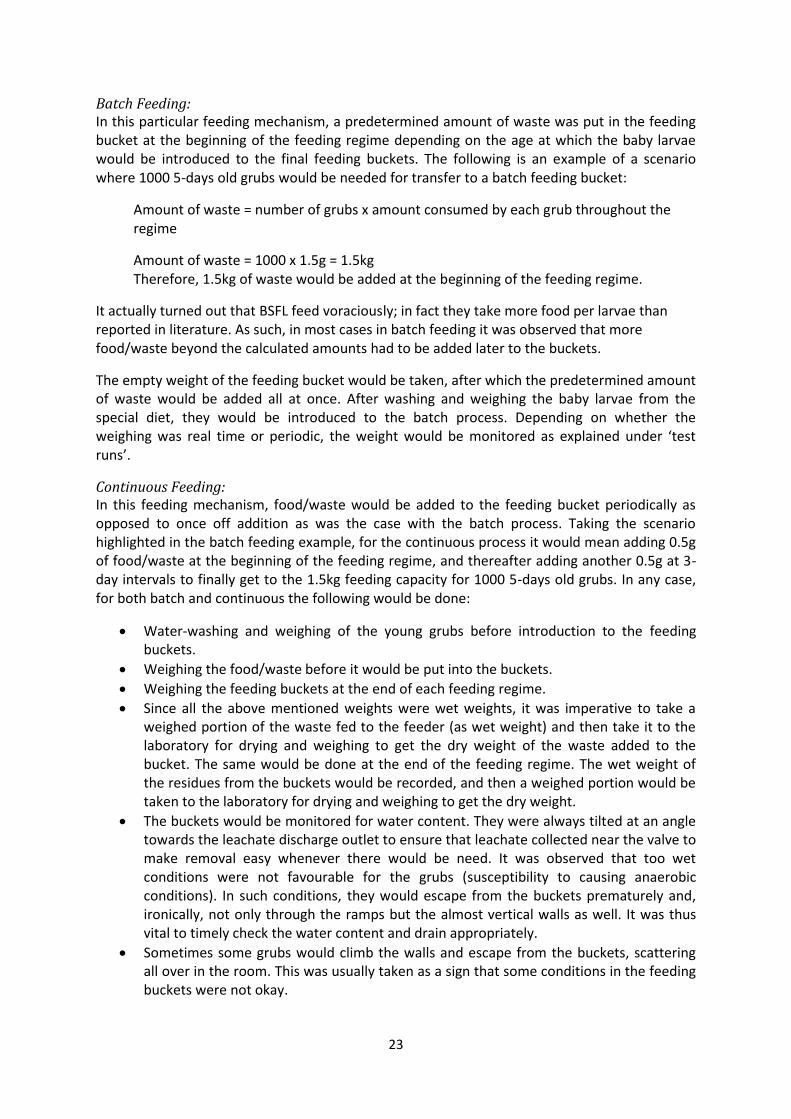
The prepupal stage, which happens to be the last larval stage of BSF, is another main stage of interest as regards waste transformation as waste is still transformed at this stage (Diener et al., 2011). However, all the other stages are equally important, though not linked directly to the biomass conversion. This is because any developmental anomaly at any stage may affect not only that particular stage but other stages as well and thus the food conversion. Prepupae are characterized by their color change from white to dark brown as well as their tendency to migrate from the larval habitat (food source) to some other place where they can pupate from, which should ideally be a dry and dark place (Banks, 2014; Tomberlin and Sheppard, 2002). This migration is very vital as it allows for their capture for either further breeding into adults or for processing into such products as animal feed protein and biofuel oil. Banks (2014) further mentions that these prepupae can climb inclines of about 40o and crawl as far as 100m upwards, all to find a suitable place to pupate from. It is this custom of theirs that is desirable for BSF cultivators, as it makes them easier to collect.
The pupation stage, which is the last stage before the emergence of adult BSF, usually takes about two weeks together with the prepupal stage. This could vary as well depending on the prevailing conditions (Sheppard et al., 1995). In the fullness of time, pupae turn into adult flies, thereby completing their life cycle as shown in figure 4 below (the duration in brackets on each life stage being the average length of the stage):
8
Figure 4: Life Cycle of Hermetia illucens (BSF)
2.4. BSF Process Aspects (Social, Economic and Environmental) The rising interest in BSF research lies in the fact that their presence in an environment can be used to solve a myriad of environmental and other problems, among them large manure accumulations at confined animal feeding operations (Tomberlin et al, 2002). The goodness with BSFL is that they are reared on and in the actual waste, in which they reduce environmental contamination and human health risks as they add value to the waste (van Huis et al., 2013). Below are some benefits that have been documented:
Biomass Conversion
BSFL has the capability to convert various organic waste streams into more valuable and less harmful biomass while emitting relatively fewer GHGs and little ammonia (van Huis et al., 2013). Owing to their unique composition of gut microbiota, BSFL can handle a wide range of such food sources as human and animal cadavers, decaying vegetables, animal manure, palm kernel meal, municipal organic waste, fresh human faeces, and pit latrine faecal sludge (Banks, 2014), reducing the biomass quantity remarkably as they convert it. Different studies have shown
Adult (5-8 Days)
Pupa
(1-2 weeks) Eggs
(4 Days)
Larvae
(2 weeks)
Prepupa
(1-2 weeks)
9
different biomass quantity reduction potentials with Newton et al. (2005) and Barry (2004) reporting 50%, Diener et al. (2011) reporting 65-75%, and recently Li et al. (2011) reporting 78% reduction. These percentage reductions, however, were observed on different waste streams. The fact that with time studies are showing increased efficiencies, there’s hope that reduction efficiencies might even get better with continued research and better optimization of BSF process parameters and conditions.
Odor Reduction
Odor reduction is one of the benefits derived from these creatures. This is achieved by their high densities on waste coupled with their voracious appetite, making the waste material to be processed extremely fast. Furthermore, the larvae aerate and dry organic waste, and suppress bacterial growth (Diener et al., 2011; van Huis et al., 2013). With such a combination of characteristics, odors are not given any chance to thrive.
Housefly Control
The common housefly (Musca domestica) does have feeding parts and so feeds throughout its long life. As such, it searches for food, not only organic waste but any food source including humans’ food, making it interact rather more often with humans. An adult BSF, on the other hand, has a shorter lifespan (5-8 days) and does not bite or engage in any pest-like behavior. Furthermore, it does not seek to enter homes or restaurants but lives its life remote from humans (Barry, 2004). Its lack of attraction to humans, their habitations and food (van Huis et al., 2013) lies in the fact that it does not feed but lives on fat stored in its body from the larval and prepupal stages as explained earlier, making BSF to be far from being a nuisance. Back to the downside of a common housefly, it is a serious vector of diseases. This reinforces the need to have its populations controlled. BSF does just that job. One of the ways by which the control is achieved is that the presence of BSF prevents the housefly from ovipositing, thereby leading to reduced housefly numbers. It has been documented by Sheppard et al. (1994) that in one study BSF colonization of poultry and pig manure had the potential to reduce common housefly population by 94-100%.
Low Pathogenicity
Not only are BSF non-pest flies, they are also essential for their low pathogenicity in organic wastes. It seems they are designed to be a natural means of organic waste management, and so they are equipped with what would enable them to effectively carry out the task. Newton et al. (2008) point out that BSFL contain natural antibiotics which in fact may prevent contamination as opposed to spreading diseases. Other researchers have also reported that BSFL suppress Escherichia coli O157:H7 and Salmonella enterica serovar Enteritidis in contaminated chicken manure (Zhou et al., 2013), and this is achieved by modifying the microflora of manure (van Huis et al., 2013). With the rising pace at which the species is being studied, it is possible that more benefits as regards pathogenicity are yet to be discovered.
Pollution Reduction Potential
BSFL has the capability to reduce pollution potential of manure by 50-60% or more. In one case of pig manure digestion in the US, as van Huis et al. (2013) report, nitrogen was reduced by 71%, phosphorus and potassium by 52% each while aluminium, boron, cadmium, calcium, chromium, copper, iron, lead, magnesium, manganese, molybdenum, nickel, sodium, sulphur and zinc were reduced by 38-93%. In yet another study, Phosphorus reduction by 61-70% and nitrogen reduction by 30-50% in confined bovine facilities have been documented (van Huis et al., 2013).
10
BSFL can also be used to process and treat organic leachate that otherwise are costly to treat and are polluting to both marine and terrestrial environments by means of their richness in carbon and nitrogen. Popa and Green (2012) observed that BSFL are able to clear the leachate fraction of organic metabolites relative to that of leachate not treated with the larvae.
Possible Economic Implications
The use of BSFL in waste management may be a relatively more economically viable venture compared with raw manure. According to Tomberlin and Sheppard (2001) and a study done on such a comparison, BSFL by-products (fat, protein and compost) are 100-200 times more valuable economically than unprocessed manure, i.e. the former stood at US$200 per tonne while the latter stood at US$10-20 per tonne. In addition, there is a possibility that in the BSF technology some gains from the process can be used to offset the costs of waste collection and management in general.
Potential for Contributing to Sustainable Energy Security
Energy consumption and demand have been surging worldwide as fossil fuel reserves progressively decrease and, as would be expected, these reserves are soon to be exhausted in the near future. This is against a fast boom in world population growth and economic development (Zheng et al., 2012a). This explains the reason why the world has been on a trek from the use of fossil fuels to other more sustainable fuel types, necessitating the urgent need for investment in research concerning alternative energy sources like biodiesel. Biodiesel is such a promising alternative fuel that it has increased worldwide public interest in a number of countries (Zheng et al., 2012a). It is, however, hampered from being used as a primary fuel by its high cost of production (Li et al., 2011). Its production has also raised cross-sectoral debates on its sustainability, mainly owing to the fact that it’s usually produced from edible oils in a world where food supply is not yet very adequate. Zheng et al. (2012b) argue that although the world needs biodiesel and its scale up, using edible oil for biodiesel is unacceptable. Food supply should not be affected by biodiesel feedstock since food is a basic human requirement.
Further research in more sustainable energy sources has been required. Many alternatives are being researched in an effort to have better feedstock for biodiesel production, among them microalgae, waste grease, Madhuca Indica, Jatropha curcas and muskmelon seed oil (Zheng et al, 2012b). In this regard, the potential for BSFL to contribute to sustainable energy provision and thus reduce on the use of unsustainable sources is being investigated, and its use as feedstock in biodiesel production is showing good potential, though still mainly at laboratory scale (Zheng et al, 2012b). Li et al. (2011) noted that BSFL have the capacity to recycle waste into clean energy, and thus reduce environmental pollution of manure and other organic wastes. When compared with energy plants, BSFL has high reproductive capacity and short life cycle, while the former need longer life cycles and plenty of land which may lead to competition between human food use and industrial use of crops. In one study, 1000g feed mixture of rice straw (30%) and restaurant waste (70%) given to 2000 BSFL yielded 44g biodiesel (Zheng et al, 2012b). In a similar study, 16g of biodiesel was obtained from 71g dry BSFL raised on dairy fresh manure (Li et al., 2011). This potential still needs to be investigated further.
Potential for Use as Sources of Nutrients
Their richness in lipids, proteins, polysaccharides, and calcium is what gives BSFL the potential to be used as feedstock or produce biodiesel (Popa and Green, 2012). BSF are a suitable animal food source as their prepupae are composed of approximately 40% protein and 30% fat

11
(Sheppard et al., 1994). Their high protein content could be taken advantage of for use in the animal feed, fish and pet industries as a protein source, since their protein is comparable to fishmeal.
2.5. Drawbacks in the BSF and Insect Sector in General For insect producers, operations have not been as smooth as desired. There have been different drawbacks that have been faced which have constantly jeopardized progress. The drawbacks have not been very much on the use of insects in waste management as bio-composters; perhaps owing to the fact that waste is alien to humans, though produced by them, and would want as much as possible to get rid of it; drawbacks instead have mainly been observed on the use of insects as food and feed ingredients for livestock (and worse off for humans), as there are some uncertainties surrounding the use of insects for food. Nevertheless, some efforts have been underway to change the status quo; slow though they may seem to be, the efforts appear to be in the right direction. The following are the categories of drawbacks that are generally faced:
a) Regulations/Legal Framework: With the surging population growth, it has become necessary to provide enough food to meet the increasing demand. As such, various techniques have been employed in the agricultural sector, among them the application of genetic engineering, use of artificial fertilizers, herbicides and pesticides. Most of these accumulate in ecosystems and in organisms, and at higher concentrations may be toxic, hence the need to ascertain food quality. This has ultimately led to the development of regulations regarding the use of organisms (both flora and fauna) as food. The issue of insects as human or pet food has not been an exception; they have been brought into the spotlight, howbeit not sufficiently. Van Huis et al. (2013) point out that at the national and international levels, standards and regulations acknowledging the use of insects as ingredients for food and feed are rare. This might be attributed to the fact that insects are not perceived as a regular food or feed product in many societies. There’s been lack of a legal framework as well as specific legislation on the use of insects as food and feed ingredients (van Huis et al. 2013). There are some regulations that touch on the use of insects but not specifically in this regard, which somehow acts as a hindrance to progress in the insect for food and feed ingredients industry, since investors and other stakeholders lack concrete legislation to base their activities on. Specific to the EU, van Huis et al. (2013) further report a number of factors in line with legislation that equally serve as drawbacks to acceptance and establishment of the insect market. Among the factors are the strict sanitary regulations for setting up of farms, a lack of guidelines on the mass rearing of insects, as well as a lack of clarity on which insect types are to be authorized for the market by the EU Novel Food. Discussing legal drawbacks and lack of clarity in legislation would be incomplete if two regulations of interest and their implications are not mentioned, these being Regulation (EC) No. 999/2001 and Regulation (EC) No. 1069/2009. Regulation (EC) No. 1069/2009 to start with gives some hope by categorizing insect meal as a Processed Animal Protein (PAP) that would be fit and suitable as animal feed provided it is processed according to the standards contained in the regulation, but further mentions that it shouldn’t be intended for human food chains. Regulation (EC) No. 999/2001 on the other hand crashes the little hope by categorically prohibiting the feeding of farm animals with PAPs, of which Commission Regulation (EU) No. 142/2011 alludes to insect-derived
12
proteins as being enveloped under the definition of PAPs (van Huis et al. 2013). This said, it still remains a rule in the EU that insects do not have to enter the human food chain unless in negligible, unavoidable amounts; it only allows the feeding of insect meal to pets as it puts a halt also on the feeding of livestock with the same. Commenting on the issue of regulatory drawbacks, David Drew (an expert in this field and managing director of a large insect feed company in South Africa, AgriProtein) mentions the slaughter house issue as another example of the technical challenges holding back regulation. This is an issue where one is prohibited from slaughtering an animal on the farm where they are raised, and so insects being animals would need a slaughter house to be slaughtered from, an idea Drew describes as a real quandary (Byrne, 2015). It is good to mention, however, that the presence of such regulatory drawbacks especially in the EU have not taken professionals and researchers into sleep mode. They are working out strategies on how best other stakeholders could be brought to the understanding of the potential and thus effect regulatory changes. On a positive note, the EU has not closed itself up to research and dialogue on the matter, as it has for some years been funding PROteINSECT, a research project exploring the feasibility of the use of insect feed in the diets of fish, poultry and pigs. David Drew is on record as commending the EU on its surprising pro-activeness on the matter recently, and basing on this he further expresses hope that the EU market for insect feed should be up and running in about 18 months (Byrne, 2015). With the looming hope, there have been upcoming establishments in the industry around the world, in the EU inclusive, Ynsect in France and Protix Biosystems in Netherlands being EU examples. On the international arena, Enterra Feed Corporation (Canada), AgriProtein (South Africa) and EnviroFlight (US) among others are in the spotlight as having relatively large scale insect feed operations owing to favorable regulations.
b) Little networking among experts and researchers in the field: For a majority of projects, bringing together various talents constitutes or breeds their overall success. For a phenomenon not widely accepted like insect for food and feed, little can be achieved unless the various stakeholders of interest come together for the common success of the phenomenon. According to van Huis et al. (2013), there has been a lack of understanding of the potential of insects as sustainable sources of protein, and this was the case until the EC started funding the PROteINSECT project as explained already. The project brings together collaborators from about 12 research and academic institutions mainly from Africa, Asia and Europe to examine various aspects pertaining to insects for food and feed ingredient phenomenon. The collaboration ranges from such issues as design, development and examination of insect and fly production systems, insect protein processing technologies, and quality and safety analyses among others (PROteINSECT, 2015). In this way, various challenges surrounding the industry’s progress are shared and collectively solved.
c) Perception: Perhaps the other drawbacks in the progression of this technology can be traced back to the aspect of perception. Insects are generally perceived as inherently unsanitary (van Huis et al. 2013), especially when they fall into the category of ‘flies’, conceivably due to the general knowledge that society has about the health risks of house flies, which may have an effect on perception of other harmless flies like BSF. This
13
perception of inherent insanitation becomes even more pronounced when the insects are suggested as food or feed ingredients, especially for human consumption. In as much as this may be true for some insects, the generalization can be attributed to the lack of awareness on the uniqueness and potential of certain insects like BSF, which can further be attributed to the lack of collaboration among experts in the field to explain to the naïve public. Nevertheless, PROteINSECT has identified this as one of its priority areas. Some partners in the project have been focusing on the development of the Pro-Insect Platform, while others on the dissemination of the project’s activities (PROteINSECT, 2015). Continued hard work in this regard might yield positive perception and general acceptance among various stakeholders.
2.6. Husbandry (Breeding Requirements) Although BSF have been lauded in what they are capable of, they may not always give the required outcomes if particular care and attention is not paid to key parameters in the raising of these bio-converters. Various studies have been conducted highlighting the different parameters that would make them as effective as possible. According to Barry (2004), the focus of bioconversion is not solely on rearing H. illucens, but rearing them to efficiently consume food wastes. It is, therefore, incumbent upon persons seeking the expertise of these bio-converters to raise them in the best way possible so as to achieve a ‘win-win’ situation between BSF and humans. This section intends to highlight the different recommendations that various researchers in the field have made toward successful rearing of BSF and thus their successful bioconversion.
As highlighted already under their history and traits, BSF are not indigenous to most regions of the world, neither are they indigenous to Sweden. As such, they have to be imported, and this importation has to be done cautiously considering that a colony’s productivity may be affected by differences in conditions. It is advisable, therefore, that colonies be kept for a few generations once imported (Zhou et al, 2013), as this may allow the BSF to adapt to the prevailing conditions with time. They may adapt to the environment, but their productivity may be affected, hence the need for conditions at the rearing facility to be made as similar as possible to the ideal conditions. The breeding conditions are later summarized in Table 1, and they are as follows:
a) Temperature: The fact that BSF can withstand a wide temperature range does not mean they can still thrive effectively at any temperature; they need optimum conditions for better results. The different life stages and activities may require and favor different temperature ranges. According to the Institute for the Environment (2013), the lowest temperature at which BSFL can thrive is 0oC and this only for four hours, whereas the highest is 45oC. Around these temperatures chances of survival are dramatically reduced, with inactivity induced from 10oC going down, and from 45oC going up. Under freezing conditions they can survive to some extent, except their performance development-wise is affected. UCN (2013) reports that under such conditions they usually limit their metabolism, including such essential processes as mating and reproduction. Zheng et al. (2012a) mention a temperature range of 26-29oC to be good for the rearing process. The Institute for the Environment (2013) further recommends the temperature range of 25-30oC as being optimum for pupation, while 35oC as optimum for BSFL consumption of food. For mating purposes, 27oC has been reported as optimum (Zhang, 2010). In a study by Tomberlin and Sheppard (2002), it was observed
14
that temperatures greater than 26oC coupled with the right humidity resulted in around 80% egg hatch, implying that temperature monitoring during incubation of eggs is also vital. As such, the need to keep the grubs alive and as productive as possible calls for particular attention and effort to be put into off-season breeding.
b) Humidity: This is another factor that needs to be controlled in ensuring proper husbandry and realization of expected results. Generally, humidity has to be in the range of 65-75% (Zheng et al, 2012; Li et al, 2011b) for the process to thrive. It should, however, be mentioned that some stages may require different ranges. The Institute for the Environment (2013) reports that for BSF mating, optimal humidity is 30-90%. It has also been observed that as humidity decreases, the rate of BSFL weight loss increases. The importance of humidity is further stressed by Tomberlin et al (2002) when they mention that adult BSF live longer when provided with a water source although they do not require food to survive. For eggs, around 80% hatching has been observed when the humidity is greater than 60%. In a nutshell, humidity conditions for BSFL need constant monitoring as dry conditions may make the grubs cement into the feed whereas too wet conditions may trigger failure of the grubs to breathe since they breathe through the pores in their exoskeleton (Institute for the Environment, 2013).
c) Diet/Feeding: Feeding in the life cycle of BSL is only observed during the larval stage. Although these creatures are voracious and can thrive on almost anything due to the special microbiota in their gut, the Institute for the Environment (2013) points out that they have a limited ability to process any animal products such as meats and fats. Therefore, care must be taken if increased productivity is to be achieved. At the same time, BSFL are not super creatures that are immune to pollution and toxicity, they are susceptible to toxins which may be found in the feed material. According to Diener et al (2009), not only are favourable climatic conditions essential for successful rearing, but also the avoidance of toxic organic wastes. This implies that the waste should somewhat have some quality assurance. Certain limitations exist, especially regarding the presence of heavy metals in the feed material, which negatively influence life history traits of the fly population and can accumulate in the prepupae (Diener et al, 2011). This means that when other animals are fed on these BSFL, they should be expected to have exacerbated levels of heavy metals due to bioaccumulation. According to a study done by Diener et al (2011b) in Costa Rica, it was established that elevated concentrations of Zinc led to high larval mortality as well as lack of egg fertility, which in turn strongly influenced larval yield and waste reduction capacity. Thus, the need for ‘good quality’ feed material cannot be overemphasized. Notwithstanding that BSFL can thrive on almost anything organic, Myers et al (2008) mention the need to put young larvae (0-4 days old) on a special diet before they can finally be taken to feeding buckets, especially in artificial breeding. In their study, they fed young larvae on a mixture of water and Gainesville diet, a diet made from a mixture of alfalfa meal, wheat bran and corn meal in the ratio of 3:5:2 (Hogsette, 1985). In their study, they added 51ml water to 30g of the Gainesville diet, which they fed to the larvae. For general feeding, it has been recommended that the food layer depth should be around 21cm to 23cm for adequate bioconversion (Institute for the Environment, 2013) otherwise the conversion may be inefficient. To further improve on bioconversion, it has also been noted that a bit of coffee grounds in the feed material could boost the
15
metabolism of the grubs and make them more active owing to the caffeine content in the coffee, which apparently is a stimulant.
d) Space Requirements: In the breeding of BSF, and indeed that of other naturally occurring species, it is good practice to replicate the natural conditions in which those species occur as much as possible. When this is done, it could be very manageable to maintain BSF under artificial, off-season conditions such that the larvae can grow up to pupation stage without many difficulties. As explained already under their life cycle, adult BSF fly around looking for secluded bushes in which they can mate from, which are away from, but near a smelly organic waste source. Artificial breeding, therefore, should take this characteristic into consideration. The Institute for the Environment (2013) mentions that successful breeding is achieved when there is space enough for the adults to fly and mate. For this reason, cages could be used which should be netted to prevent adults from escaping. Various cage types and sizes have reportedly been used from one study to another, perhaps depending on the scale of the breeding operation. Zhang et al (2010) mention the use of 1.8m x 2m x 1.5m cages for this purpose. In yet another study, a cage with dimensions 2m x 2m x 4m with a mesh of 7.1 x 5.5 per centimetre, i.e. Lumite screen cage, has reportedly been used (Sheppard et al, 2002). In each instance, real or artificial plants were provided to facilitate lekking (mating behaviour where males of a species congregate in certain areas and ‘call’ to the females of the species) (Institute for the Environment, 2013) among the BSF. Since females customarily lay their eggs in cracks and crevices, cardboard could be used to provide artificial cracks and crevices. In addition, though feeding is not important for adult BSF, water is, and thus it should be provided in the cage. In their study, Sheppard et al (2002) provided water by an automatic watering system that sprayed a water mist into the cage; but of course others have provided the water by simply placing one or two cups in the cage.
e) Other Requirements: Apart from the parameters highlighted above, there are other requirements for successful BSF breeding. Among them is the need for a light source. The need for adequate light, especially sunlight (which is usually obtained when they are reared in greenhouses), was highlighted by Barry (2004) who reports that in his study adults were not observed mating and no eggs were laid under artificial light conditions although temperature and humidity were optimum to guarantee success of all processes. This would be a big problem to deal with given the rising interest in BSF rearing among various researchers in different regions of the world. Zhang et al (2010) sorted this problem out when they studied the effects of light on BSF husbandry. From their research, the use of artificial light can suffice in place of sunlight provided the right lighting is used. They particularly mention the spectrum of a quartz-iodine lamp as being similar to that of sunlight, thus casting rays of hope on winter breeding prospects.
16
Table 1: BSF Lifecycle Breeding Requirements
Life Cycle Stage / Duration (days)
Requirements / Recommendations
Temperature (oC) Humidity (%) Feeding
Eggs 4 > 26 > 60 None
Larvae (< 4) 0 - 4 26 – 29 65 - 75 Special diet (mixture of corn meal, wheat bran and water)
Larvae (> 4) 4 - 14 26 – 35 65 - 75 Greatest
Prepupae/Pupa 10 - 14 25 – 30 Low None
Adults 5 -8 27 30 - 90 None (only water)
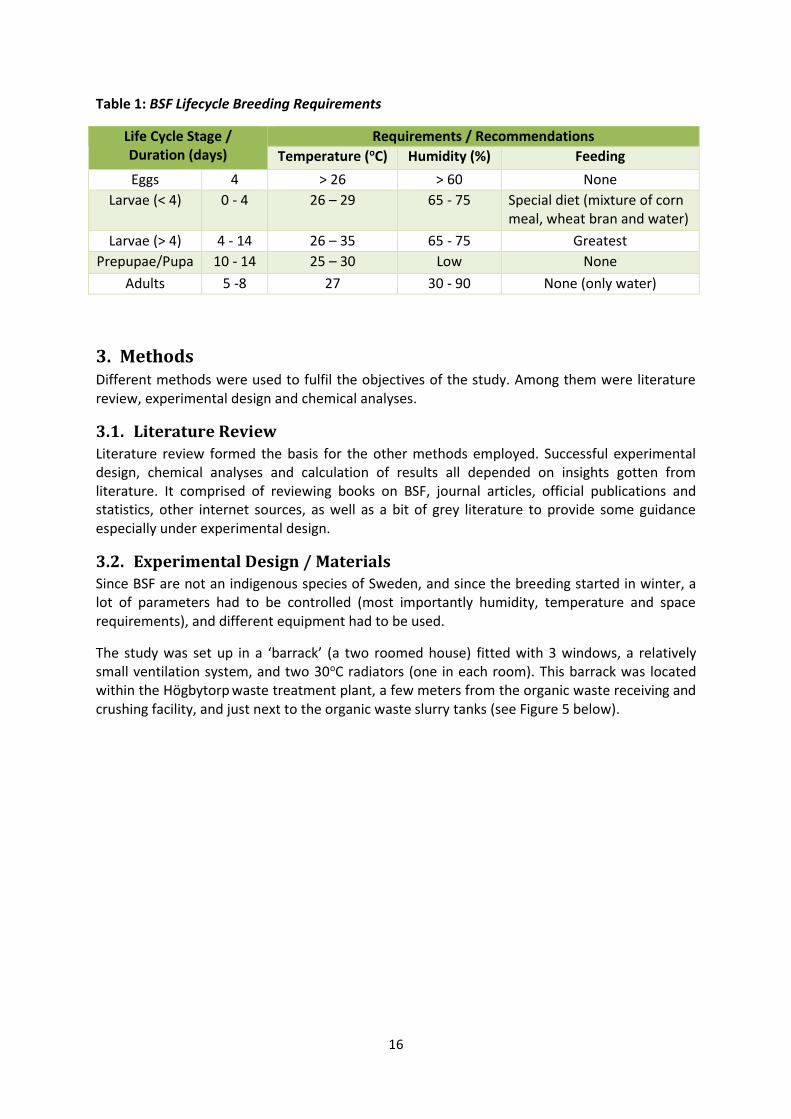
3. Methods Different methods were used to fulfil the objectives of the study. Among them were literature review, experimental design and chemical analyses.
3.1. Literature Review Literature review formed the basis for the other methods employed. Successful experimental design, chemical analyses and calculation of results all depended on insights gotten from literature. It comprised of reviewing books on BSF, journal articles, official publications and statistics, other internet sources, as well as a bit of grey literature to provide some guidance especially under experimental design.
3.2. Experimental Design / Materials Since BSF are not an indigenous species of Sweden, and since the breeding started in winter, a lot of parameters had to be controlled (most importantly humidity, temperature and space requirements), and different equipment had to be used.
The study was set up in a ‘barrack’ (a two roomed house) fitted with 3 windows, a relatively small ventilation system, and two 30oC radiators (one in each room). This barrack was located within the Högbytorp waste treatment plant, a few meters from the organic waste receiving and crushing facility, and just next to the organic waste slurry tanks (see Figure 5 below).
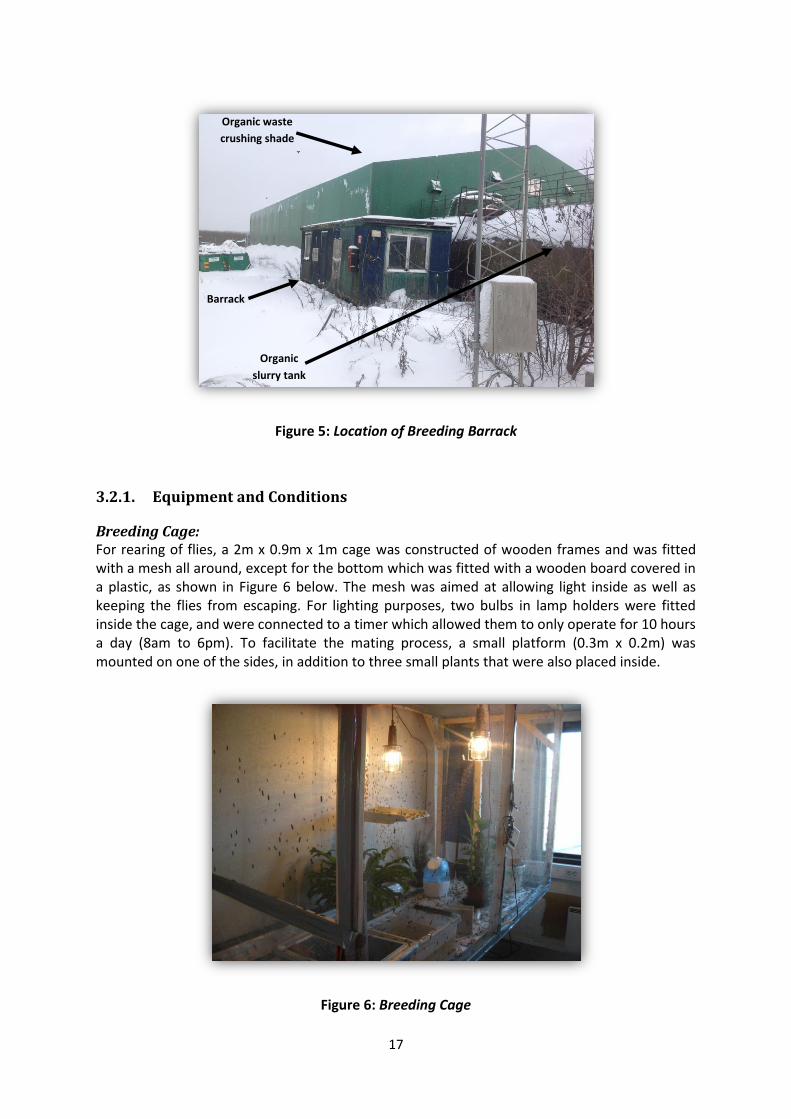
17
Figure 5: Location of Breeding Barrack
3.2.1. Equipment and Conditions
Breeding Cage: For rearing of flies, a 2m x 0.9m x 1m cage was constructed of wooden frames and was fitted with a mesh all around, except for the bottom which was fitted with a wooden board covered in a plastic, as shown in Figure 6 below. The mesh was aimed at allowing light inside as well as keeping the flies from escaping. For lighting purposes, two bulbs in lamp holders were fitted inside the cage, and were connected to a timer which allowed them to only operate for 10 hours a day (8am to 6pm). To facilitate the mating process, a small platform (0.3m x 0.2m) was mounted on one of the sides, in addition to three small plants that were also placed inside.
Figure 6: Breeding Cage
Organic waste
crushing shade
Barrack
Organic
slurry tank
18
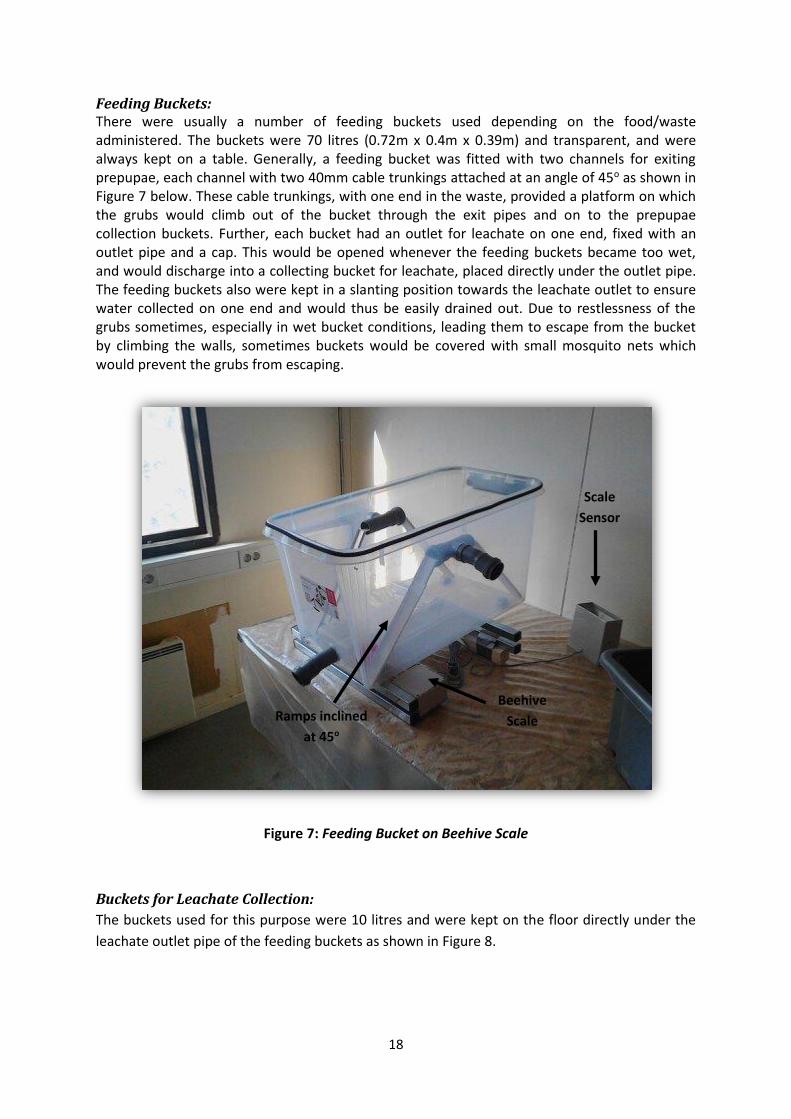
Feeding Buckets: There were usually a number of feeding buckets used depending on the food/waste administered. The buckets were 70 litres (0.72m x 0.4m x 0.39m) and transparent, and were always kept on a table. Generally, a feeding bucket was fitted with two channels for exiting prepupae, each channel with two 40mm cable trunkings attached at an angle of 45o as shown in Figure 7 below. These cable trunkings, with one end in the waste, provided a platform on which the grubs would climb out of the bucket through the exit pipes and on to the prepupae collection buckets. Further, each bucket had an outlet for leachate on one end, fixed with an outlet pipe and a cap. This would be opened whenever the feeding buckets became too wet, and would discharge into a collecting bucket for leachate, placed directly under the outlet pipe. The feeding buckets also were kept in a slanting position towards the leachate outlet to ensure water collected on one end and would thus be easily drained out. Due to restlessness of the grubs sometimes, especially in wet bucket conditions, leading them to escape from the bucket by climbing the walls, sometimes buckets would be covered with small mosquito nets which would prevent the grubs from escaping.
Figure 7: Feeding Bucket on Beehive Scale
Buckets for Leachate Collection:
The buckets used for this purpose were 10 litres and were kept on the floor directly under the
leachate outlet pipe of the feeding buckets as shown in Figure 8.
Beehive
Scale
Scale
Sensor
Ramps inclined
at 45o
19
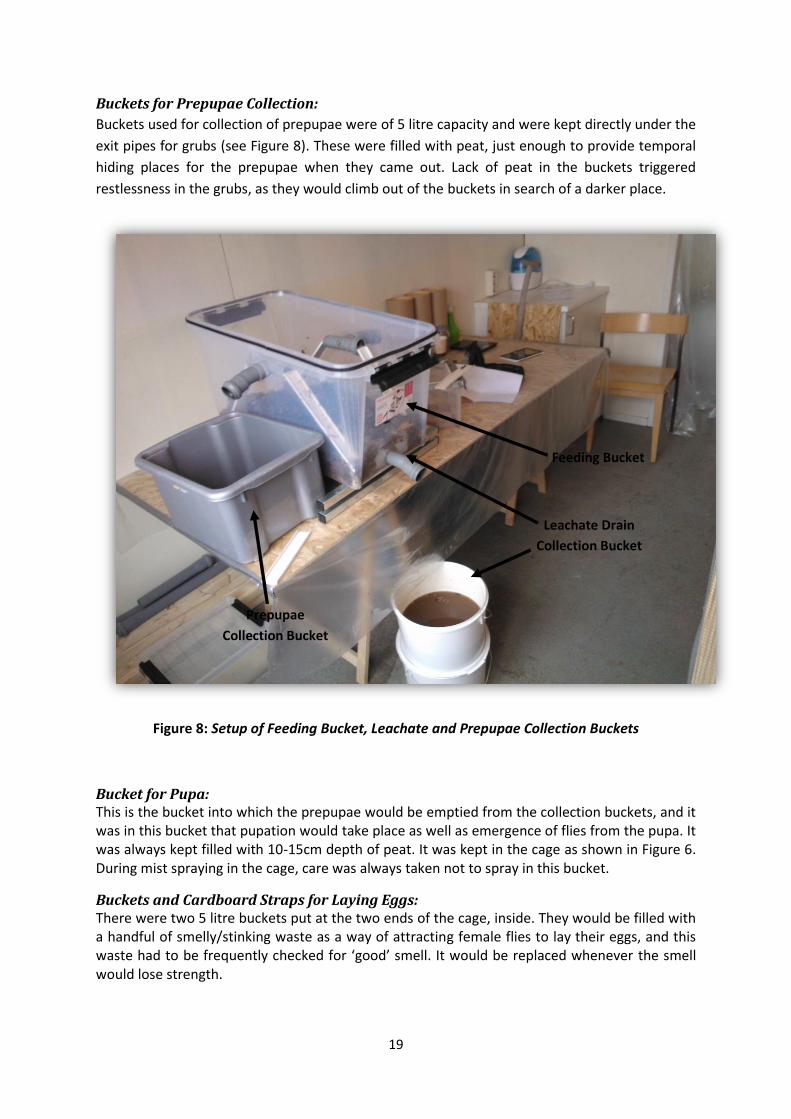
Buckets for Prepupae Collection:
Buckets used for collection of prepupae were of 5 litre capacity and were kept directly under the
exit pipes for grubs (see Figure 8). These were filled with peat, just enough to provide temporal
hiding places for the prepupae when they came out. Lack of peat in the buckets triggered
restlessness in the grubs, as they would climb out of the buckets in search of a darker place.
Figure 8: Setup of Feeding Bucket, Leachate and Prepupae Collection Buckets
Bucket for Pupa: This is the bucket into which the prepupae would be emptied from the collection buckets, and it was in this bucket that pupation would take place as well as emergence of flies from the pupa. It was always kept filled with 10-15cm depth of peat. It was kept in the cage as shown in Figure 6. During mist spraying in the cage, care was always taken not to spray in this bucket.
Buckets and Cardboard Straps for Laying Eggs: There were two 5 litre buckets put at the two ends of the cage, inside. They would be filled with a handful of smelly/stinking waste as a way of attracting female flies to lay their eggs, and this waste had to be frequently checked for ‘good’ smell. It would be replaced whenever the smell would lose strength.
Leachate Drain
Collection Bucket
Feeding Bucket
Prepupae
Collection Bucket
20
Waste Streams: The waste streams of interest in the study were horse manure, fruits and organic waste reject material from the slurry-making process. For fruit waste, a combination of pears, bananas and cucumbers was made in the ratio 5:3:2. This stream was to be used as a kind of control in terms of feeding. It was necessary to gauge the performance of the grubs on slurry reject and horse manure based on comparison with performance on ‘rich’ waste, in this case fruit mixtures. In the slurry making process, household organic waste and an assortment of organic wastes from different retail stores were fed to a crusher in their packaging materials, which resulted in process rejects which were crushed mixtures of organic waste and packaging materials (plastics, cardboards, etc). This was the second waste stream fed to the larvae as a way of separating the organic fractions from the packaging material fractions.
Temperature and Humidity: These two parameters, being vital at all the life stages of BSF, had to be monitored. Basically, temperature and humidity would almost be in the same ranges for the various stages since only one small room was used for all the breeding, and almost every time some life stage was available.
Humidity had to be generally kept above 30%, and this was achieved by using a humidifier (see Figure 6). Every morning it would be replenished with water and tuned to high. In the evening, it would be replenished also and left running. It was only during holidays and weekends that it would be put on the timer to run from 8am to 6pm, while tuned to the lowest mark. This approach was quite effective in keeping the humidity in the room nearly constant. For temperature, the radiator in the room would be used and tuned to the 25oC mark, and this would afford temperatures between 25-30oC almost always.
For measuring these parameters, a Beehive Scale, known as Beewatch Home Scale, was used (see Figure 7). It was able to record temperature, humidity and weight of buckets hourly, and would store the information. This made a good way of providing updates on the conditions in the breeding facility. Once commanded, it would produce graphs showing continuous trends in the monitored conditions, and it stored the data for 16 days in its memory. This equipment made monitoring of conditions manageable unlike a situation where one would only know conditions at a time when he/she is present. The scale sensor was always kept inside the cage.
There was also another digital thermometer, Hanna, with a probe. This one would mainly be used to measure temperature in the feeding buckets by inserting the probe in the substrate. This was in connection with the understanding that temperatures in the room and feeding buckets would be different. Hence it was vital to measure the actual temperatures in the buckets.
Acquisition of BSFL The larvae from which the colony was developed were imported from Netherlands. By the time of their arrival, their actual age was not known, as the information was not provided by the seller. It was, however, a combination of various age groups from neonates (baby larvae) to prepupae, and they were over 14000 in number. It was imperative to do a test run on the acquired BSFL before starting the actual tests. This made a provision to get insight into the necessary growth conditions, optimize them as well as ensure there was adequate and correct information pertaining to the age, weights, feeding history and other characteristics of the BSFL, and thus ensuring that the results were as representative and reliable as possible. The acquired BSFL were thus reared on a mixture of different fresh fruits until flies were obtained, and ultimately eggs. The coming of the eggs from this imported generation marked the beginning of
21
the actual scientific tests, since the former was more of a test run as mentioned earlier. It is also important to mention that there was almost a continuous presence of all life stages in the pilot facility, owing to the fact that when the first generation of BSFL was imported, they were at different ages.
3.2.2. The Life Stages
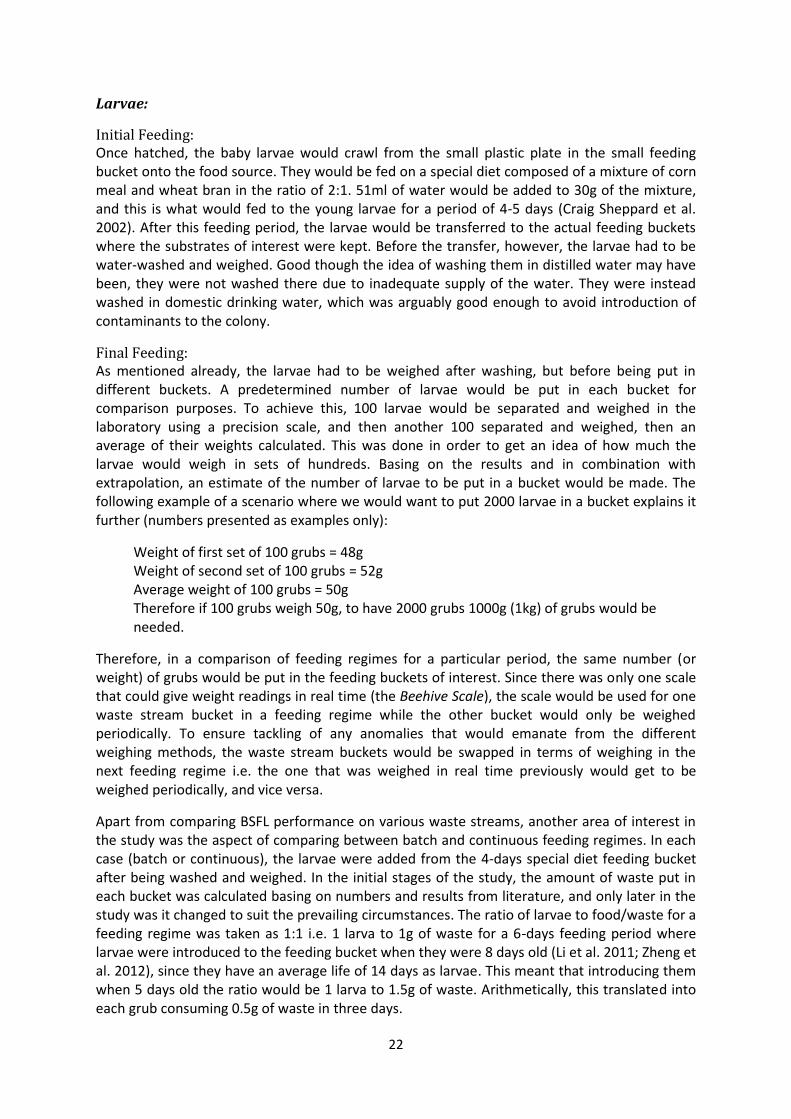
Eggs: For successful laying of eggs, about five pieces of cardboard would be put together using strings to make cardboard straps. The usual spaces in the cardboard served as cracks and crevices in which BSF like laying their eggs. Two buckets would then be placed in the cage, one on each end, and each would be fitted with three cardboard egg straps. The idea behind using two buckets was to make as much provision as possible for laying eggs. The buckets were each filled with small amounts of wet to dry smelly organic waste. The waste had to be handful and damp, not wet, because it was observed that some flies would lay their eggs on the waste. As such, having too much of the waste meant creating a bigger, unintended area for laying eggs. With only a handful of waste, the eggs laid thereon would easily be removed. Further, it was observed that in wet waste the flies would get stuck and would eventually die there.
Knowledge of the age of BSF allowed the projection into when the first set of eggs would be laid, and so the straps would be checked for availability of eggs according to schedule. Once laid, the eggs, while inside the egg straps, would be transferred into small buckets filled with the corn meal-wheat bran mixture, kept at room temperature (26-28oC in this case) up to the point of their hatching (Craig Sheppard et al. 2002). In the 5 litre buckets in which the food for the newly hatched babies was put, small plastic plates/lids would be laid on which the egg straps would be placed as shown in Figure 9 below. This was to ensure that the newly hatched babies would easily crawl to the food source. These buckets would then be covered with a lid, though not air tight. This was also aimed at maintaining higher humidity in the buckets, since as mentioned earlier, eggs require humidity greater than 60% to hatch (Craig Sheppard et al. 2002).
Figure 9: Eggs strap with eggs placed in food source
22
Larvae:
Initial Feeding: Once hatched, the baby larvae would crawl from the small plastic plate in the small feeding bucket onto the food source. They would be fed on a special diet composed of a mixture of corn meal and wheat bran in the ratio of 2:1. 51ml of water would be added to 30g of the mixture, and this is what would fed to the young larvae for a period of 4-5 days (Craig Sheppard et al. 2002). After this feeding period, the larvae would be transferred to the actual feeding buckets where the substrates of interest were kept. Before the transfer, however, the larvae had to be water-washed and weighed. Good though the idea of washing them in distilled water may have been, they were not washed there due to inadequate supply of the water. They were instead washed in domestic drinking water, which was arguably good enough to avoid introduction of contaminants to the colony.
Final Feeding: As mentioned already, the larvae had to be weighed after washing, but before being put in different buckets. A predetermined number of larvae would be put in each bucket for comparison purposes. To achieve this, 100 larvae would be separated and weighed in the laboratory using a precision scale, and then another 100 separated and weighed, then an average of their weights calculated. This was done in order to get an idea of how much the larvae would weigh in sets of hundreds. Basing on the results and in combination with extrapolation, an estimate of the number of larvae to be put in a bucket would be made. The following example of a scenario where we would want to put 2000 larvae in a bucket explains it further (numbers presented as examples only):
Weight of first set of 100 grubs = 48g Weight of second set of 100 grubs = 52g Average weight of 100 grubs = 50g Therefore if 100 grubs weigh 50g, to have 2000 grubs 1000g (1kg) of grubs would be needed.
Therefore, in a comparison of feeding regimes for a particular period, the same number (or weight) of grubs would be put in the feeding buckets of interest. Since there was only one scale that could give weight readings in real time (the Beehive Scale), the scale would be used for one waste stream bucket in a feeding regime while the other bucket would only be weighed periodically. To ensure tackling of any anomalies that would emanate from the different weighing methods, the waste stream buckets would be swapped in terms of weighing in the next feeding regime i.e. the one that was weighed in real time previously would get to be weighed periodically, and vice versa.
Apart from comparing BSFL performance on various waste streams, another area of interest in the study was the aspect of comparing between batch and continuous feeding regimes. In each case (batch or continuous), the larvae were added from the 4-days special diet feeding bucket after being washed and weighed. In the initial stages of the study, the amount of waste put in each bucket was calculated basing on numbers and results from literature, and only later in the study was it changed to suit the prevailing circumstances. The ratio of larvae to food/waste for a feeding regime was taken as 1:1 i.e. 1 larva to 1g of waste for a 6-days feeding period where larvae were introduced to the feeding bucket when they were 8 days old (Li et al. 2011; Zheng et al. 2012), since they have an average life of 14 days as larvae. This meant that introducing them when 5 days old the ratio would be 1 larva to 1.5g of waste. Arithmetically, this translated into each grub consuming 0.5g of waste in three days.
23
Batch Feeding: In this particular feeding mechanism, a predetermined amount of waste was put in the feeding bucket at the beginning of the feeding regime depending on the age at which the baby larvae would be introduced to the final feeding buckets. The following is an example of a scenario where 1000 5-days old grubs would be needed for transfer to a batch feeding bucket:
Amount of waste = number of grubs x amount consumed by each grub throughout the regime
Amount of waste = 1000 x 1.5g = 1.5kg Therefore, 1.5kg of waste would be added at the beginning of the feeding regime.
It actually turned out that BSFL feed voraciously; in fact they take more food per larvae than reported in literature. As such, in most cases in batch feeding it was observed that more food/waste beyond the calculated amounts had to be added later to the buckets.
The empty weight of the feeding bucket would be taken, after which the predetermined amount of waste would be added all at once. After washing and weighing the baby larvae from the special diet, they would be introduced to the batch process. Depending on whether the weighing was real time or periodic, the weight would be monitored as explained under ‘test runs’.
Continuous Feeding: In this feeding mechanism, food/waste would be added to the feeding bucket periodically as opposed to once off addition as was the case with the batch process. Taking the scenario highlighted in the batch feeding example, for the continuous process it would mean adding 0.5g of food/waste at the beginning of the feeding regime, and thereafter adding another 0.5g at 3-day intervals to finally get to the 1.5kg feeding capacity for 1000 5-days old grubs. In any case, for both batch and continuous the following would be done:
Water-washing and weighing of the young grubs before introduction to the feeding buckets.
Weighing the food/waste before it would be put into the buckets.
Weighing the feeding buckets at the end of each feeding regime.
Since all the above mentioned weights were wet weights, it was imperative to take a weighed portion of the waste fed to the feeder (as wet weight) and then take it to the laboratory for drying and weighing to get the dry weight of the waste added to the bucket. The same would be done at the end of the feeding regime. The wet weight of the residues from the buckets would be recorded, and then a weighed portion would be taken to the laboratory for drying and weighing to get the dry weight.
The buckets would be monitored for water content. They were always tilted at an angle towards the leachate discharge outlet to ensure that leachate collected near the valve to make removal easy whenever there would be need. It was observed that too wet conditions were not favourable for the grubs (susceptibility to causing anaerobic conditions). In such conditions, they would escape from the buckets prematurely and, ironically, not only through the ramps but the almost vertical walls as well. It was thus vital to timely check the water content and drain appropriately.
Sometimes some grubs would climb the walls and escape from the buckets, scattering all over in the room. This was usually taken as a sign that some conditions in the feeding buckets were not okay.
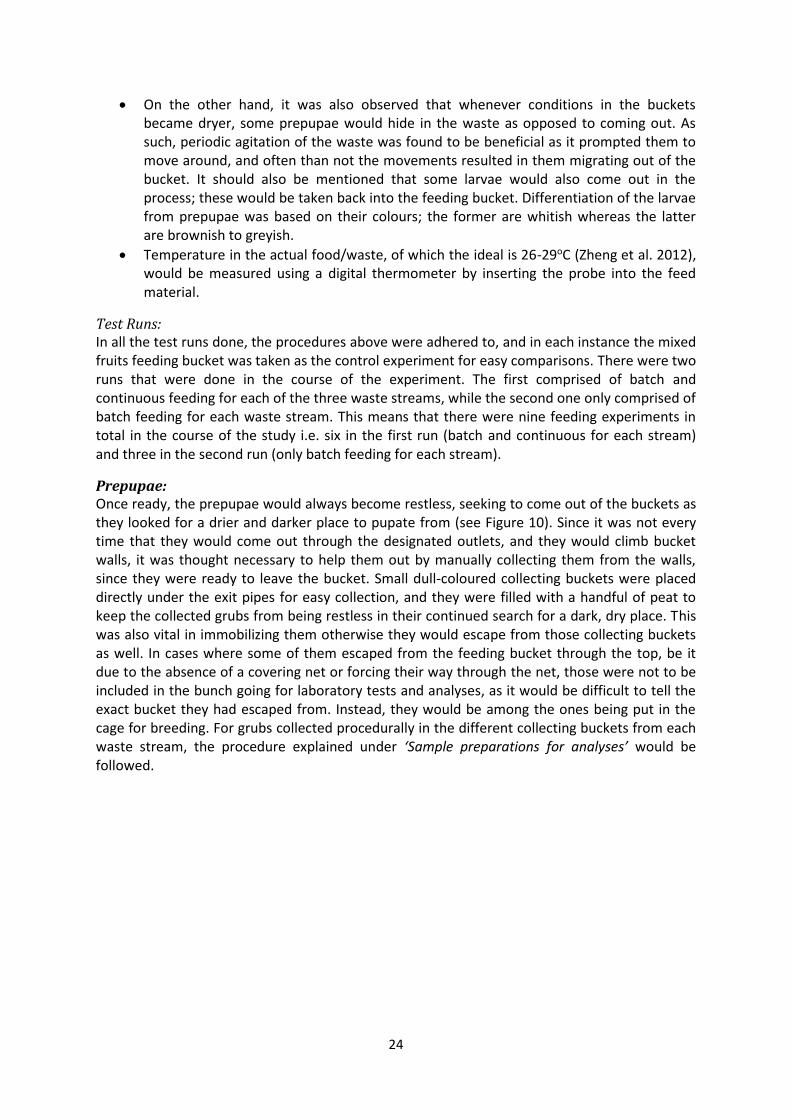
24
On the other hand, it was also observed that whenever conditions in the buckets became dryer, some prepupae would hide in the waste as opposed to coming out. As such, periodic agitation of the waste was found to be beneficial as it prompted them to move around, and often than not the movements resulted in them migrating out of the bucket. It should also be mentioned that some larvae would also come out in the process; these would be taken back into the feeding bucket. Differentiation of the larvae from prepupae was based on their colours; the former are whitish whereas the latter are brownish to greyish.
Temperature in the actual food/waste, of which the ideal is 26-29oC (Zheng et al. 2012), would be measured using a digital thermometer by inserting the probe into the feed material.
Test Runs: In all the test runs done, the procedures above were adhered to, and in each instance the mixed fruits feeding bucket was taken as the control experiment for easy comparisons. There were two runs that were done in the course of the experiment. The first comprised of batch and continuous feeding for each of the three waste streams, while the second one only comprised of batch feeding for each waste stream. This means that there were nine feeding experiments in total in the course of the study i.e. six in the first run (batch and continuous for each stream) and three in the second run (only batch feeding for each stream).
Prepupae: Once ready, the prepupae would always become restless, seeking to come out of the buckets as they looked for a drier and darker place to pupate from (see Figure 10). Since it was not every time that they would come out through the designated outlets, and they would climb bucket walls, it was thought necessary to help them out by manually collecting them from the walls, since they were ready to leave the bucket. Small dull-coloured collecting buckets were placed directly under the exit pipes for easy collection, and they were filled with a handful of peat to keep the collected grubs from being restless in their continued search for a dark, dry place. This was also vital in immobilizing them otherwise they would escape from those collecting buckets as well. In cases where some of them escaped from the feeding bucket through the top, be it due to the absence of a covering net or forcing their way through the net, those were not to be included in the bunch going for laboratory tests and analyses, as it would be difficult to tell the exact bucket they had escaped from. Instead, they would be among the ones being put in the cage for breeding. For grubs collected procedurally in the different collecting buckets from each waste stream, the procedure explained under ‘Sample preparations for analyses’ would be followed.
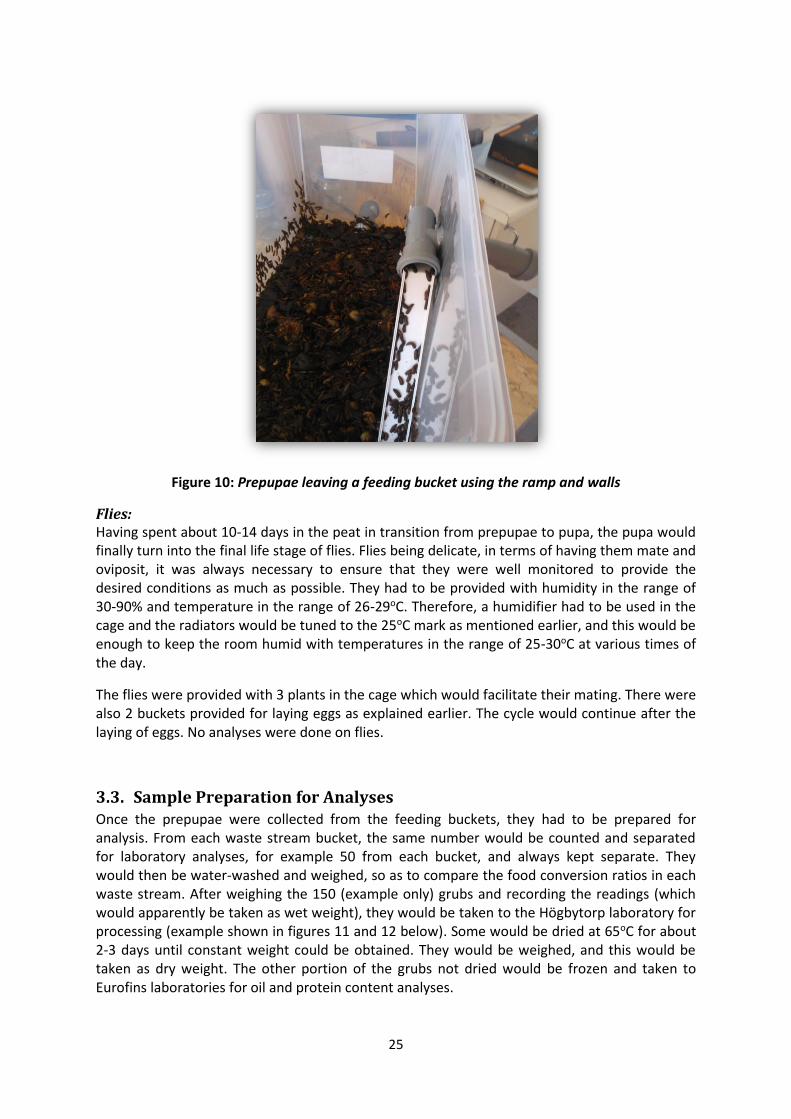
25
Figure 10: Prepupae leaving a feeding bucket using the ramp and walls
Flies: Having spent about 10-14 days in the peat in transition from prepupae to pupa, the pupa would finally turn into the final life stage of flies. Flies being delicate, in terms of having them mate and oviposit, it was always necessary to ensure that they were well monitored to provide the desired conditions as much as possible. They had to be provided with humidity in the range of 30-90% and temperature in the range of 26-29oC. Therefore, a humidifier had to be used in the cage and the radiators would be tuned to the 25oC mark as mentioned earlier, and this would be enough to keep the room humid with temperatures in the range of 25-30oC at various times of the day.
The flies were provided with 3 plants in the cage which would facilitate their mating. There were also 2 buckets provided for laying eggs as explained earlier. The cycle would continue after the laying of eggs. No analyses were done on flies.
3.3. Sample Preparation for Analyses Once the prepupae were collected from the feeding buckets, they had to be prepared for analysis. From each waste stream bucket, the same number would be counted and separated for laboratory analyses, for example 50 from each bucket, and always kept separate. They would then be water-washed and weighed, so as to compare the food conversion ratios in each waste stream. After weighing the 150 (example only) grubs and recording the readings (which would apparently be taken as wet weight), they would be taken to the Högbytorp laboratory for processing (example shown in figures 11 and 12 below). Some would be dried at 65oC for about 2-3 days until constant weight could be obtained. They would be weighed, and this would be taken as dry weight. The other portion of the grubs not dried would be frozen and taken to Eurofins laboratories for oil and protein content analyses.
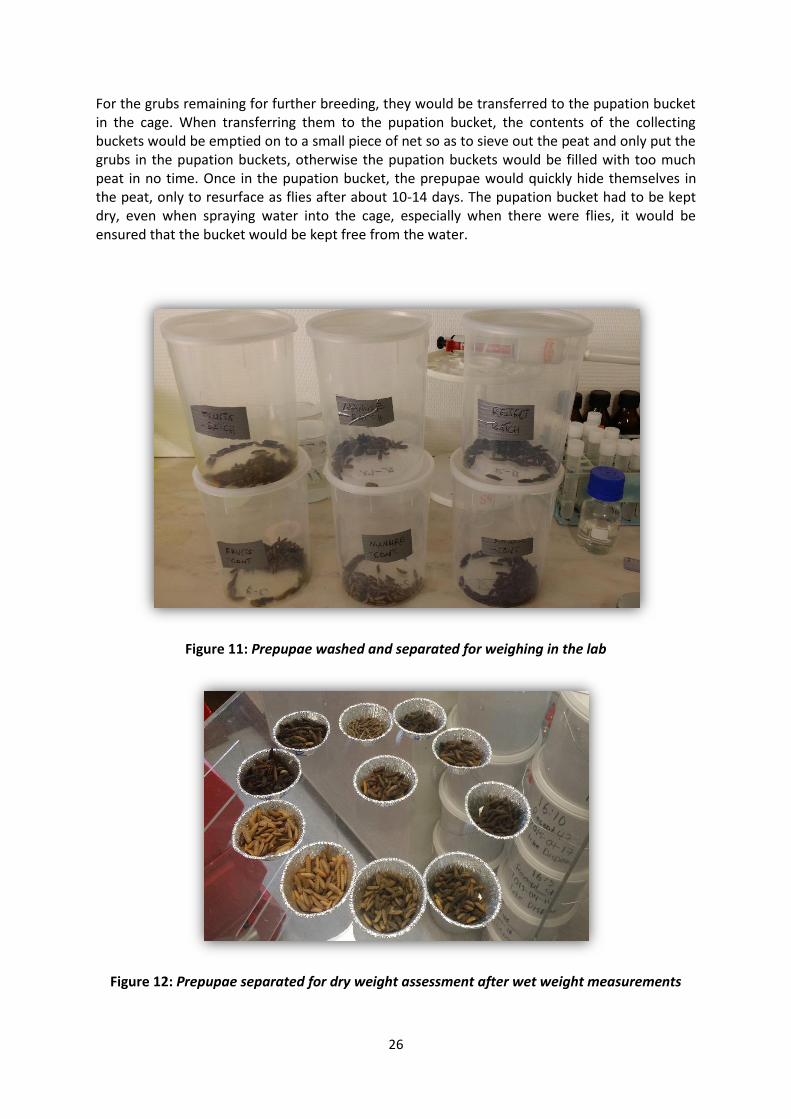
26
For the grubs remaining for further breeding, they would be transferred to the pupation bucket in the cage. When transferring them to the pupation bucket, the contents of the collecting buckets would be emptied on to a small piece of net so as to sieve out the peat and only put the grubs in the pupation buckets, otherwise the pupation buckets would be filled with too much peat in no time. Once in the pupation bucket, the prepupae would quickly hide themselves in the peat, only to resurface as flies after about 10-14 days. The pupation bucket had to be kept dry, even when spraying water into the cage, especially when there were flies, it would be ensured that the bucket would be kept free from the water.
Figure 11: Prepupae washed and separated for weighing in the lab
Figure 12: Prepupae separated for dry weight assessment after wet weight measurements
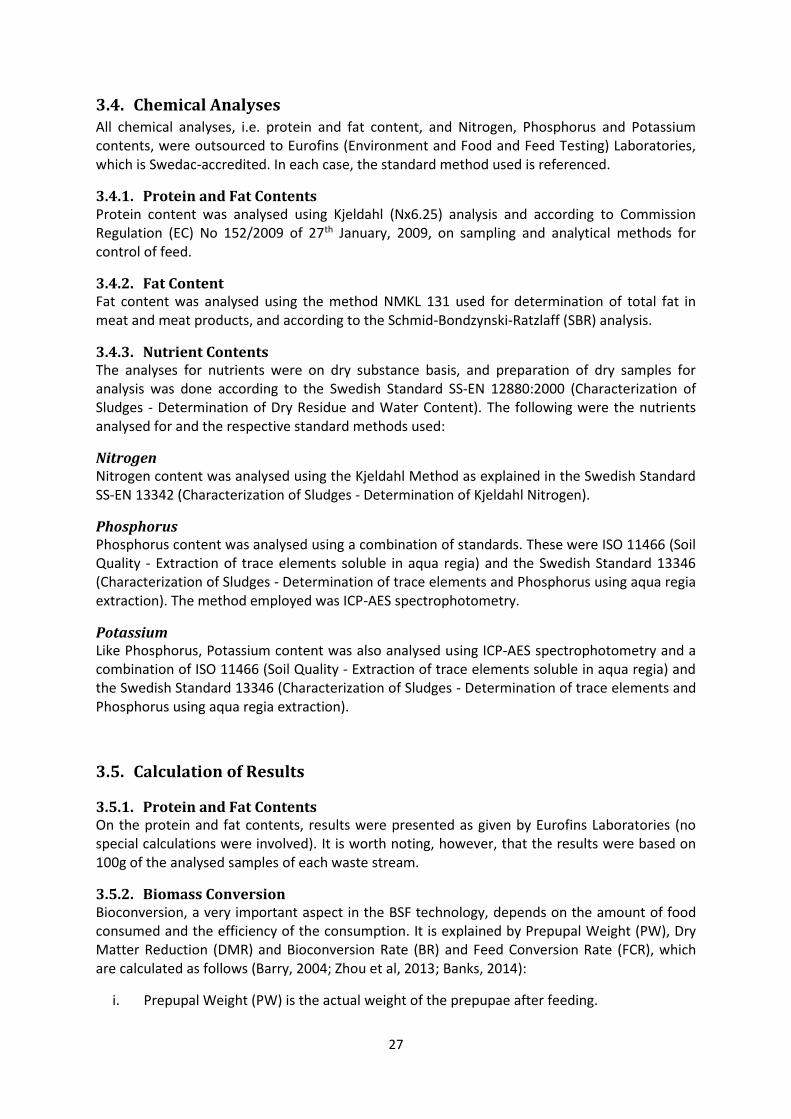
27
3.4. Chemical Analyses All chemical analyses, i.e. protein and fat content, and Nitrogen, Phosphorus and Potassium contents, were outsourced to Eurofins (Environment and Food and Feed Testing) Laboratories, which is Swedac-accredited. In each case, the standard method used is referenced.
3.4.1. Protein and Fat Contents Protein content was analysed using Kjeldahl (Nx6.25) analysis and according to Commission Regulation (EC) No 152/2009 of 27th January, 2009, on sampling and analytical methods for control of feed.
3.4.2. Fat Content Fat content was analysed using the method NMKL 131 used for determination of total fat in meat and meat products, and according to the Schmid-Bondzynski-Ratzlaff (SBR) analysis.
3.4.3. Nutrient Contents The analyses for nutrients were on dry substance basis, and preparation of dry samples for analysis was done according to the Swedish Standard SS-EN 12880:2000 (Characterization of Sludges - Determination of Dry Residue and Water Content). The following were the nutrients analysed for and the respective standard methods used:
Nitrogen Nitrogen content was analysed using the Kjeldahl Method as explained in the Swedish Standard SS-EN 13342 (Characterization of Sludges - Determination of Kjeldahl Nitrogen).
Phosphorus Phosphorus content was analysed using a combination of standards. These were ISO 11466 (Soil Quality - Extraction of trace elements soluble in aqua regia) and the Swedish Standard 13346 (Characterization of Sludges - Determination of trace elements and Phosphorus using aqua regia extraction). The method employed was ICP-AES spectrophotometry.
Potassium Like Phosphorus, Potassium content was also analysed using ICP-AES spectrophotometry and a combination of ISO 11466 (Soil Quality - Extraction of trace elements soluble in aqua regia) and the Swedish Standard 13346 (Characterization of Sludges - Determination of trace elements and Phosphorus using aqua regia extraction).
3.5. Calculation of Results
3.5.1. Protein and Fat Contents On the protein and fat contents, results were presented as given by Eurofins Laboratories (no special calculations were involved). It is worth noting, however, that the results were based on 100g of the analysed samples of each waste stream.
3.5.2. Biomass Conversion Bioconversion, a very important aspect in the BSF technology, depends on the amount of food consumed and the efficiency of the consumption. It is explained by Prepupal Weight (PW), Dry Matter Reduction (DMR) and Bioconversion Rate (BR) and Feed Conversion Rate (FCR), which are calculated as follows (Barry, 2004; Zhou et al, 2013; Banks, 2014):
i. Prepupal Weight (PW) is the actual weight of the prepupae after feeding.
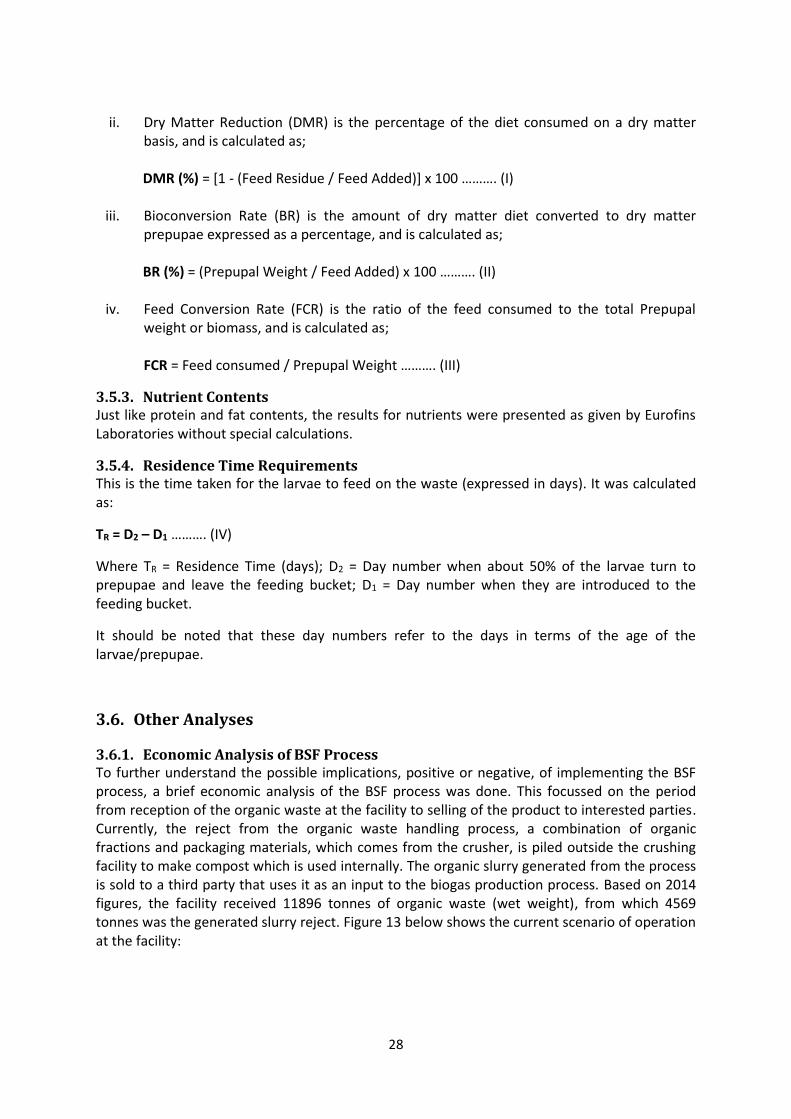
28
ii. Dry Matter Reduction (DMR) is the percentage of the diet consumed on a dry matter
basis, and is calculated as; DMR (%) = [1 - (Feed Residue / Feed Added)] x 100 ………. (I)
iii. Bioconversion Rate (BR) is the amount of dry matter diet converted to dry matter prepupae expressed as a percentage, and is calculated as; BR (%) = (Prepupal Weight / Feed Added) x 100 ………. (II)
iv. Feed Conversion Rate (FCR) is the ratio of the feed consumed to the total Prepupal weight or biomass, and is calculated as; FCR = Feed consumed / Prepupal Weight ………. (III)
3.5.3. Nutrient Contents Just like protein and fat contents, the results for nutrients were presented as given by Eurofins Laboratories without special calculations.
3.5.4. Residence Time Requirements This is the time taken for the larvae to feed on the waste (expressed in days). It was calculated as:
TR = D2 – D1 ………. (IV)
Where TR = Residence Time (days); D2 = Day number when about 50% of the larvae turn to prepupae and leave the feeding bucket; D1 = Day number when they are introduced to the feeding bucket.
It should be noted that these day numbers refer to the days in terms of the age of the larvae/prepupae.
3.6. Other Analyses
3.6.1. Economic Analysis of BSF Process To further understand the possible implications, positive or negative, of implementing the BSF process, a brief economic analysis of the BSF process was done. This focussed on the period from reception of the organic waste at the facility to selling of the product to interested parties. Currently, the reject from the organic waste handling process, a combination of organic fractions and packaging materials, which comes from the crusher, is piled outside the crushing facility to make compost which is used internally. The organic slurry generated from the process is sold to a third party that uses it as an input to the biogas production process. Based on 2014 figures, the facility received 11896 tonnes of organic waste (wet weight), from which 4569 tonnes was the generated slurry reject. Figure 13 below shows the current scenario of operation at the facility:
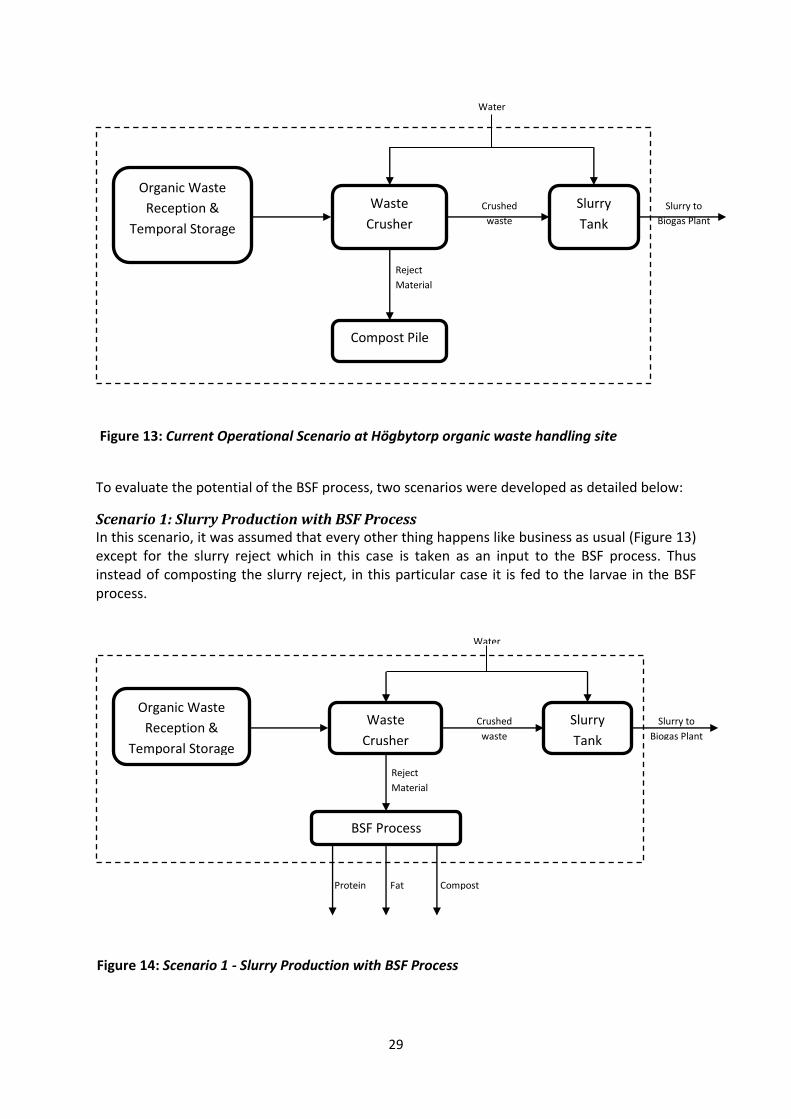
29
To evaluate the potential of the BSF process, two scenarios were developed as detailed below:
Scenario 1: Slurry Production with BSF Process In this scenario, it was assumed that every other thing happens like business as usual (Figure 13) except for the slurry reject which in this case is taken as an input to the BSF process. Thus instead of composting the slurry reject, in this particular case it is fed to the larvae in the BSF process.
Organic Waste
Reception &
Temporal Storage
Waste
Crusher
Slurry
Tank
Crushed
waste
Slurry to
Biogas Plant
Compost Pile
Reject
Material
Water
Organic Waste
Reception &
Temporal Storage
Waste
Crusher
Slurry
Tank
Crushed
waste
Slurry to
Biogas Plant
BSF Process
Reject
Material
Water
Compost Fat Protein
Figure 13: Current Operational Scenario at Högbytorp organic waste handling site
Figure 14: Scenario 1 - Slurry Production with BSF Process
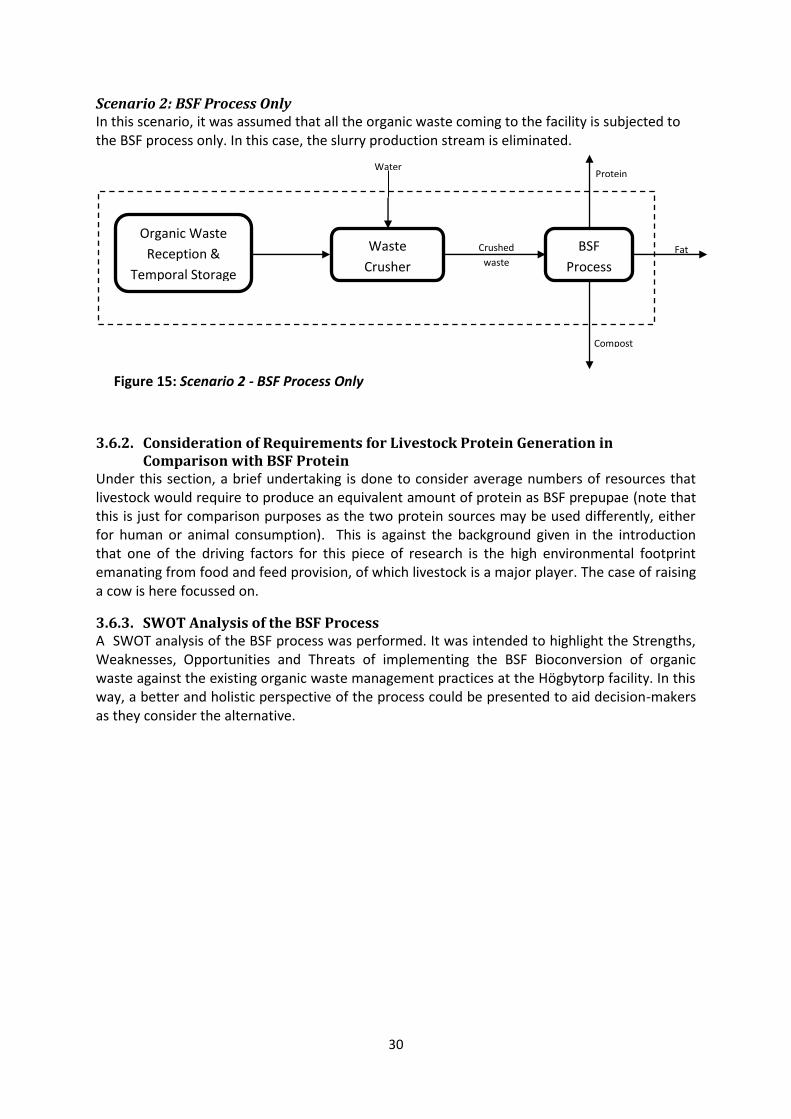
30
Scenario 2: BSF Process Only In this scenario, it was assumed that all the organic waste coming to the facility is subjected to the BSF process only. In this case, the slurry production stream is eliminated.
3.6.2. Consideration of Requirements for Livestock Protein Generation in Comparison with BSF Protein
Under this section, a brief undertaking is done to consider average numbers of resources that livestock would require to produce an equivalent amount of protein as BSF prepupae (note that this is just for comparison purposes as the two protein sources may be used differently, either for human or animal consumption). This is against the background given in the introduction that one of the driving factors for this piece of research is the high environmental footprint emanating from food and feed provision, of which livestock is a major player. The case of raising a cow is here focussed on.
3.6.3. SWOT Analysis of the BSF Process A SWOT analysis of the BSF process was performed. It was intended to highlight the Strengths, Weaknesses, Opportunities and Threats of implementing the BSF Bioconversion of organic waste against the existing organic waste management practices at the Högbytorp facility. In this way, a better and holistic perspective of the process could be presented to aid decision-makers as they consider the alternative.
Organic Waste
Reception &
Temporal Storage
Waste
Crusher
BSF
Process
Crushed
waste
Water
Fat
Protein
Compost
Figure 15: Scenario 2 - BSF Process Only
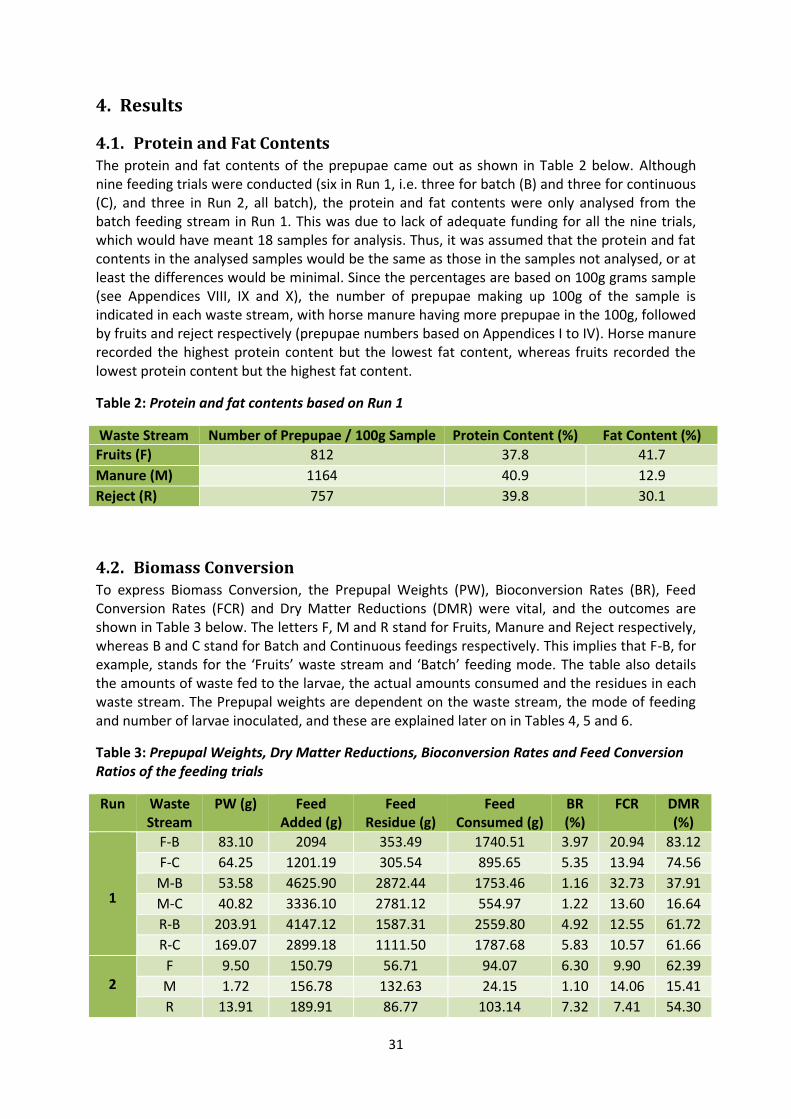
31
4. Results
4.1. Protein and Fat Contents The protein and fat contents of the prepupae came out as shown in Table 2 below. Although nine feeding trials were conducted (six in Run 1, i.e. three for batch (B) and three for continuous (C), and three in Run 2, all batch), the protein and fat contents were only analysed from the batch feeding stream in Run 1. This was due to lack of adequate funding for all the nine trials, which would have meant 18 samples for analysis. Thus, it was assumed that the protein and fat contents in the analysed samples would be the same as those in the samples not analysed, or at least the differences would be minimal. Since the percentages are based on 100g grams sample (see Appendices VIII, IX and X), the number of prepupae making up 100g of the sample is indicated in each waste stream, with horse manure having more prepupae in the 100g, followed by fruits and reject respectively (prepupae numbers based on Appendices I to IV). Horse manure recorded the highest protein content but the lowest fat content, whereas fruits recorded the lowest protein content but the highest fat content.
Table 2: Protein and fat contents based on Run 1
Waste Stream Number of Prepupae / 100g Sample Protein Content (%) Fat Content (%)
Fruits (F) 812 37.8 41.7
Manure (M) 1164 40.9 12.9
Reject (R) 757 39.8 30.1
4.2. Biomass Conversion To express Biomass Conversion, the Prepupal Weights (PW), Bioconversion Rates (BR), Feed Conversion Rates (FCR) and Dry Matter Reductions (DMR) were vital, and the outcomes are shown in Table 3 below. The letters F, M and R stand for Fruits, Manure and Reject respectively, whereas B and C stand for Batch and Continuous feedings respectively. This implies that F-B, for example, stands for the ‘Fruits’ waste stream and ‘Batch’ feeding mode. The table also details the amounts of waste fed to the larvae, the actual amounts consumed and the residues in each waste stream. The Prepupal weights are dependent on the waste stream, the mode of feeding and number of larvae inoculated, and these are explained later on in Tables 4, 5 and 6.
Table 3: Prepupal Weights, Dry Matter Reductions, Bioconversion Rates and Feed Conversion Ratios of the feeding trials
Run Waste Stream
PW (g) Feed Added (g)
Feed Residue (g)
Feed Consumed (g)
BR (%)
FCR DMR (%)
1
F-B 83.10 2094 353.49 1740.51 3.97 20.94 83.12
F-C 64.25 1201.19 305.54 895.65 5.35 13.94 74.56
M-B 53.58 4625.90 2872.44 1753.46 1.16 32.73 37.91
M-C 40.82 3336.10 2781.12 554.97 1.22 13.60 16.64
R-B 203.91 4147.12 1587.31 2559.80 4.92 12.55 61.72
R-C 169.07 2899.18 1111.50 1787.68 5.83 10.57 61.66
2
F 9.50 150.79 56.71 94.07 6.30 9.90 62.39
M 1.72 156.78 132.63 24.15 1.10 14.06 15.41
R 13.91 189.91 86.77 103.14 7.32 7.41 54.30
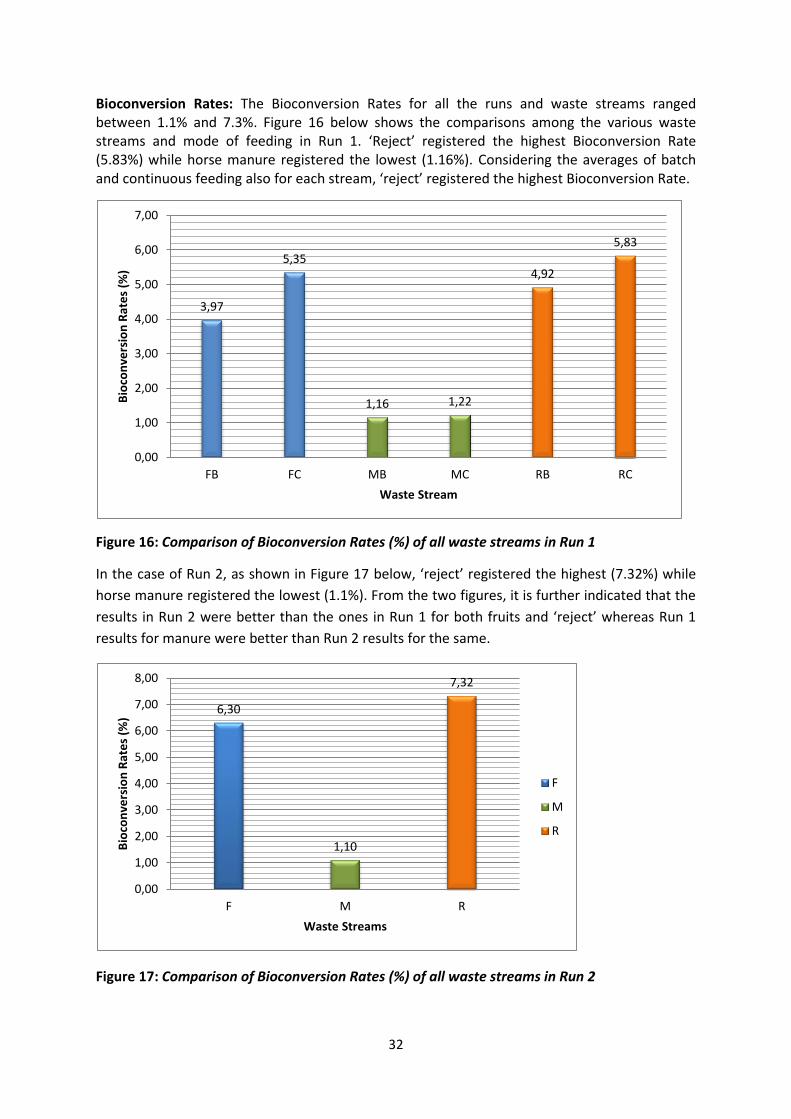
32
Bioconversion Rates: The Bioconversion Rates for all the runs and waste streams ranged between 1.1% and 7.3%. Figure 16 below shows the comparisons among the various waste streams and mode of feeding in Run 1. ‘Reject’ registered the highest Bioconversion Rate (5.83%) while horse manure registered the lowest (1.16%). Considering the averages of batch and continuous feeding also for each stream, ‘reject’ registered the highest Bioconversion Rate.
Figure 16: Comparison of Bioconversion Rates (%) of all waste streams in Run 1
In the case of Run 2, as shown in Figure 17 below, ‘reject’ registered the highest (7.32%) while
horse manure registered the lowest (1.1%). From the two figures, it is further indicated that the
results in Run 2 were better than the ones in Run 1 for both fruits and ‘reject’ whereas Run 1
results for manure were better than Run 2 results for the same.
Figure 17: Comparison of Bioconversion Rates (%) of all waste streams in Run 2
3,97
5,35
1,16 1,22
4,92
5,83
0,00
1,00
2,00
3,00
4,00
5,00
6,00
7,00
FB FC MB MC RB RC
Bio
con
vers
ion
Rat
es
(%)
Waste Stream
6,30
1,10
7,32
0,00
1,00
2,00
3,00
4,00
5,00
6,00
7,00
8,00
F M R
Bio
con
vers
ion
Rat
es
(%)
Waste Streams
F
M
R
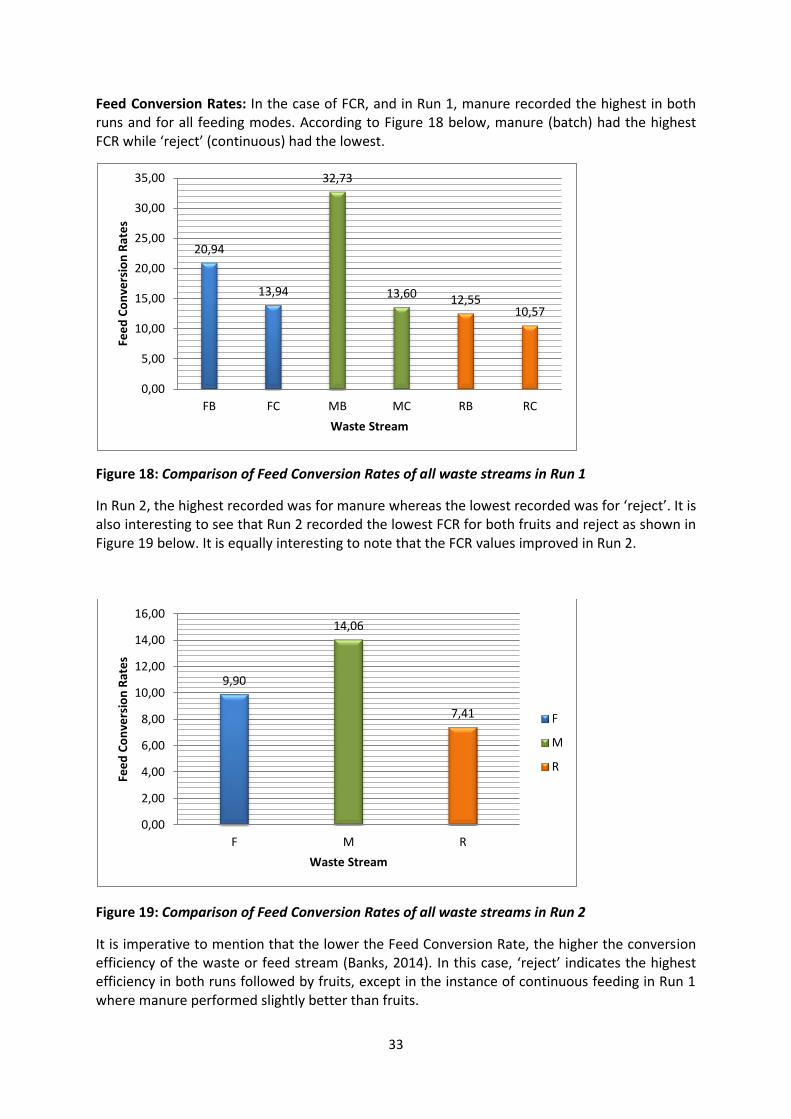
33
Feed Conversion Rates: In the case of FCR, and in Run 1, manure recorded the highest in both runs and for all feeding modes. According to Figure 18 below, manure (batch) had the highest FCR while ‘reject’ (continuous) had the lowest.
Figure 18: Comparison of Feed Conversion Rates of all waste streams in Run 1
In Run 2, the highest recorded was for manure whereas the lowest recorded was for ‘reject’. It is also interesting to see that Run 2 recorded the lowest FCR for both fruits and reject as shown in Figure 19 below. It is equally interesting to note that the FCR values improved in Run 2.
Figure 19: Comparison of Feed Conversion Rates of all waste streams in Run 2
It is imperative to mention that the lower the Feed Conversion Rate, the higher the conversion efficiency of the waste or feed stream (Banks, 2014). In this case, ‘reject’ indicates the highest efficiency in both runs followed by fruits, except in the instance of continuous feeding in Run 1 where manure performed slightly better than fruits.
20,94
13,94
32,73
13,60 12,5510,57
0,00
5,00
10,00
15,00
20,00
25,00
30,00
35,00
FB FC MB MC RB RC
Fee
d C
on
vers
ion
Rat
es
Waste Stream
9,90
14,06
7,41
0,00
2,00
4,00
6,00
8,00
10,00
12,00
14,00
16,00
F M R
Fee
d C
on
vers
ion
Rat
es
Waste Stream
F
M
R
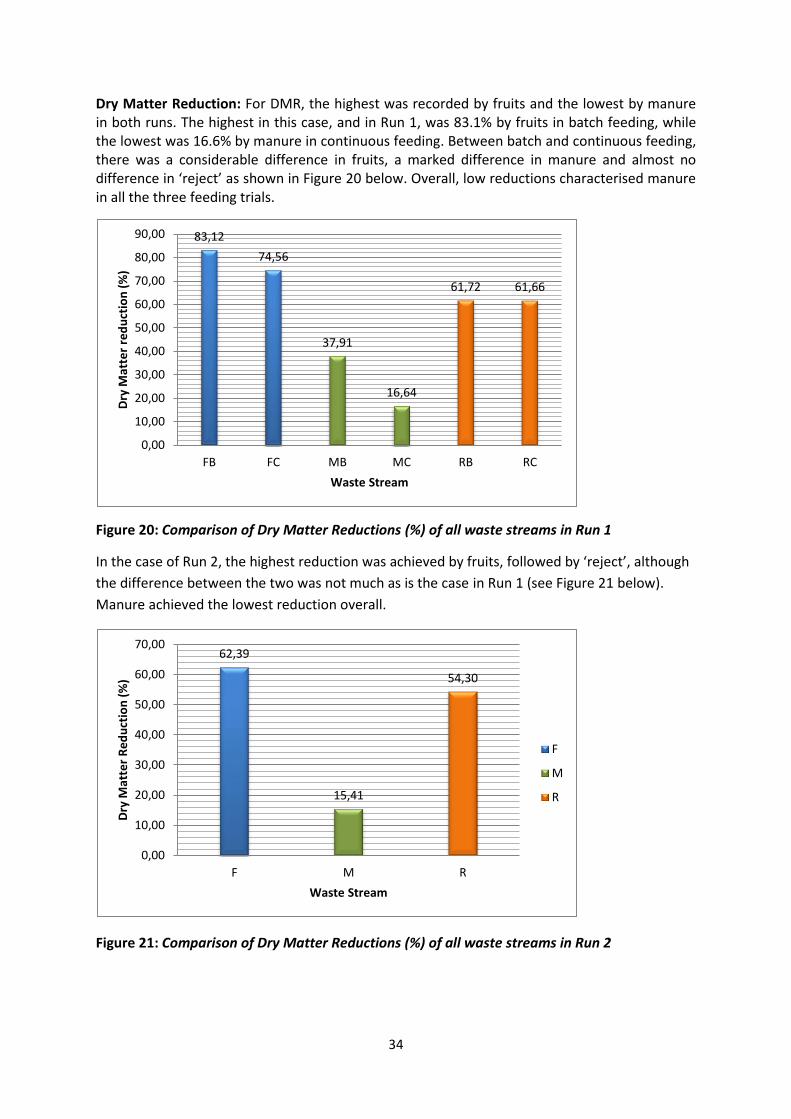
34
Dry Matter Reduction: For DMR, the highest was recorded by fruits and the lowest by manure in both runs. The highest in this case, and in Run 1, was 83.1% by fruits in batch feeding, while the lowest was 16.6% by manure in continuous feeding. Between batch and continuous feeding, there was a considerable difference in fruits, a marked difference in manure and almost no difference in ‘reject’ as shown in Figure 20 below. Overall, low reductions characterised manure in all the three feeding trials.
Figure 20: Comparison of Dry Matter Reductions (%) of all waste streams in Run 1
In the case of Run 2, the highest reduction was achieved by fruits, followed by ‘reject’, although
the difference between the two was not much as is the case in Run 1 (see Figure 21 below).
Manure achieved the lowest reduction overall.
Figure 21: Comparison of Dry Matter Reductions (%) of all waste streams in Run 2
83,12
74,56
37,91
16,64
61,72 61,66
0,00
10,00
20,00
30,00
40,00
50,00
60,00
70,00
80,00
90,00
FB FC MB MC RB RC
Dry
Mat
ter
red
uct
ion
(%
)
Waste Stream
62,39
15,41
54,30
0,00
10,00
20,00
30,00
40,00
50,00
60,00
70,00
F M R
Dry
Mat
ter
Re
du
ctio
n (
%)
Waste Stream
F
M
R
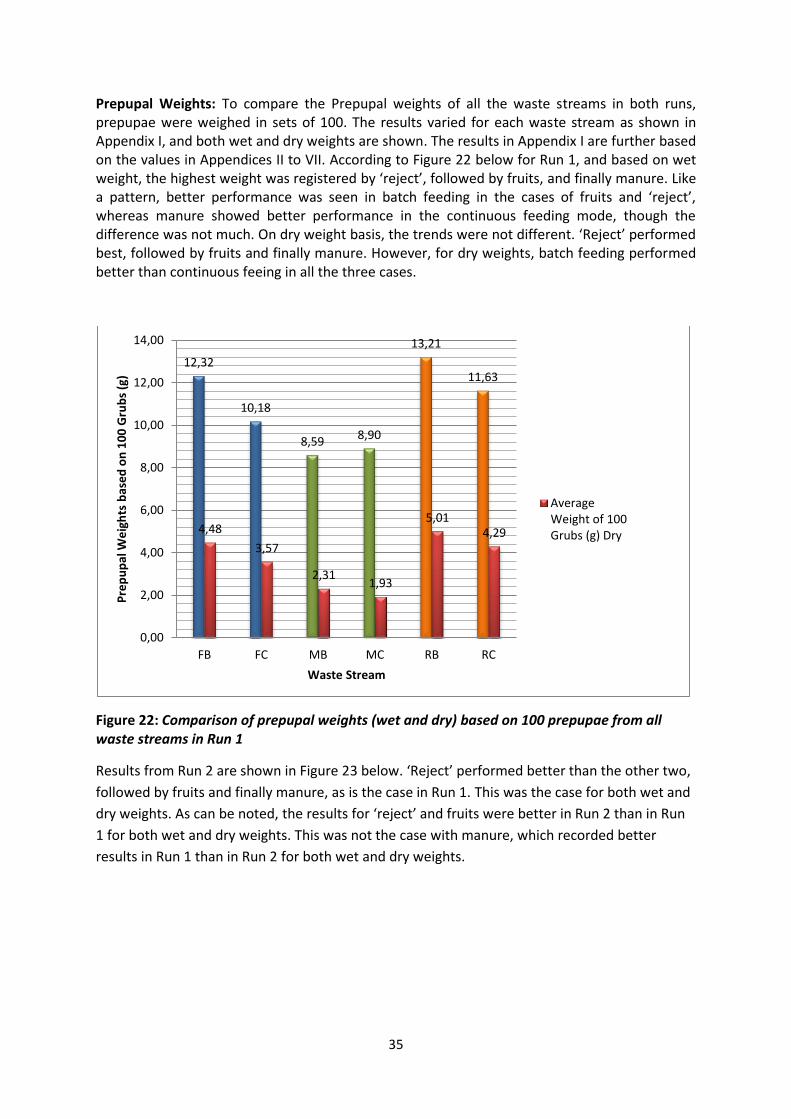
35
Prepupal Weights: To compare the Prepupal weights of all the waste streams in both runs, prepupae were weighed in sets of 100. The results varied for each waste stream as shown in Appendix I, and both wet and dry weights are shown. The results in Appendix I are further based on the values in Appendices II to VII. According to Figure 22 below for Run 1, and based on wet weight, the highest weight was registered by ‘reject’, followed by fruits, and finally manure. Like a pattern, better performance was seen in batch feeding in the cases of fruits and ‘reject’, whereas manure showed better performance in the continuous feeding mode, though the difference was not much. On dry weight basis, the trends were not different. ‘Reject’ performed best, followed by fruits and finally manure. However, for dry weights, batch feeding performed better than continuous feeing in all the three cases.
Figure 22: Comparison of prepupal weights (wet and dry) based on 100 prepupae from all waste streams in Run 1
Results from Run 2 are shown in Figure 23 below. ‘Reject’ performed better than the other two,
followed by fruits and finally manure, as is the case in Run 1. This was the case for both wet and
dry weights. As can be noted, the results for ‘reject’ and fruits were better in Run 2 than in Run
1 for both wet and dry weights. This was not the case with manure, which recorded better
results in Run 1 than in Run 2 for both wet and dry weights.
12,32
10,18
8,598,90
13,21
11,63
4,48
3,57
2,311,93
5,014,29
0,00
2,00
4,00
6,00
8,00
10,00
12,00
14,00
FB FC MB MC RB RC
Pre
pu
pal
We
igh
ts b
ase
d o
n 1
00
Gru
bs
(g)
Waste Stream
AverageWeight of 100Grubs (g) Dry
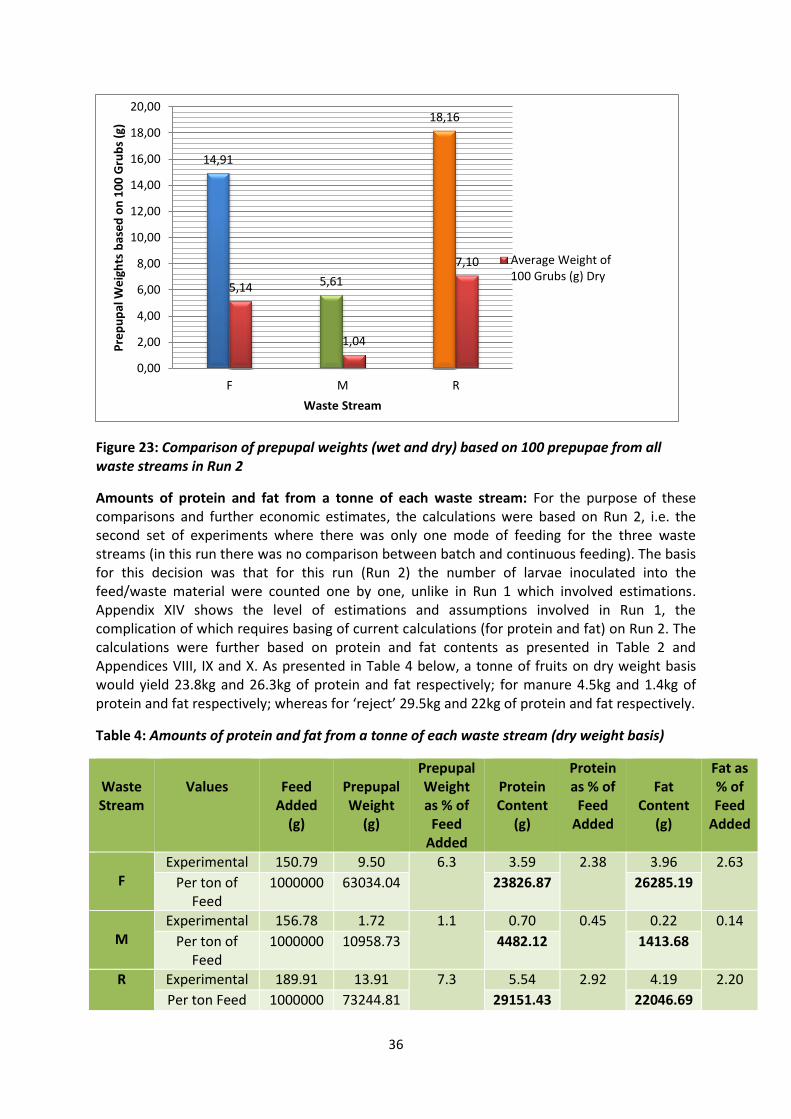
36
Figure 23: Comparison of prepupal weights (wet and dry) based on 100 prepupae from all waste streams in Run 2
Amounts of protein and fat from a tonne of each waste stream: For the purpose of these comparisons and further economic estimates, the calculations were based on Run 2, i.e. the second set of experiments where there was only one mode of feeding for the three waste streams (in this run there was no comparison between batch and continuous feeding). The basis for this decision was that for this run (Run 2) the number of larvae inoculated into the feed/waste material were counted one by one, unlike in Run 1 which involved estimations. Appendix XIV shows the level of estimations and assumptions involved in Run 1, the complication of which requires basing of current calculations (for protein and fat) on Run 2. The calculations were further based on protein and fat contents as presented in Table 2 and Appendices VIII, IX and X. As presented in Table 4 below, a tonne of fruits on dry weight basis would yield 23.8kg and 26.3kg of protein and fat respectively; for manure 4.5kg and 1.4kg of protein and fat respectively; whereas for ‘reject’ 29.5kg and 22kg of protein and fat respectively.
Table 4: Amounts of protein and fat from a tonne of each waste stream (dry weight basis)
Waste Stream
Values
Feed
Added (g)
Prepupal Weight
(g)
Prepupal Weight as % of
Feed Added
Protein Content
(g)
Protein as % of
Feed Added
Fat
Content (g)
Fat as % of Feed
Added
F
Experimental 150.79 9.50 6.3 3.59 2.38 3.96 2.63
Per ton of Feed
1000000 63034.04 23826.87 26285.19
M
Experimental 156.78 1.72 1.1 0.70 0.45 0.22 0.14
Per ton of Feed
1000000 10958.73 4482.12 1413.68
R Experimental 189.91 13.91 7.3 5.54 2.92 4.19 2.20
Per ton Feed 1000000 73244.81 29151.43 22046.69
14,91
5,61
18,16
5,14
1,04
7,10
0,00
2,00
4,00
6,00
8,00
10,00
12,00
14,00
16,00
18,00
20,00
F M R
Pre
pu
pal
We
igh
ts b
ase
d o
n 1
00
Gru
bs
(g)
Waste Stream
Average Weight of100 Grubs (g) Dry
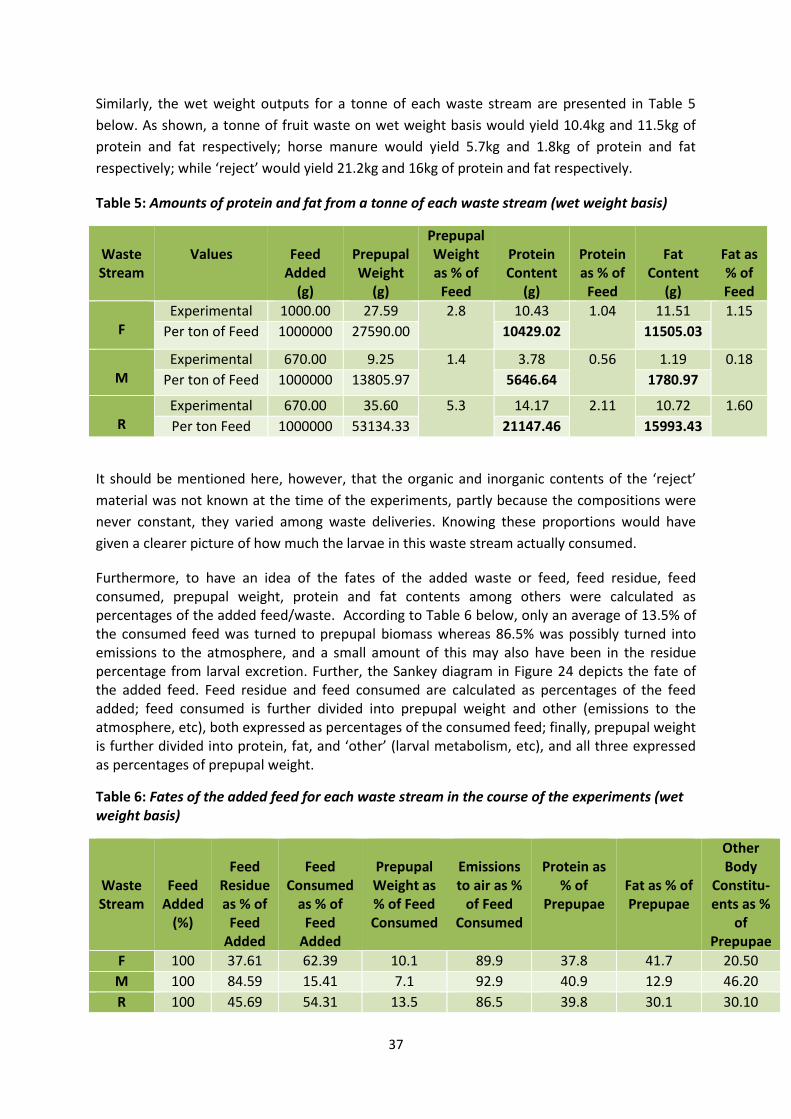
37
Similarly, the wet weight outputs for a tonne of each waste stream are presented in Table 5
below. As shown, a tonne of fruit waste on wet weight basis would yield 10.4kg and 11.5kg of
protein and fat respectively; horse manure would yield 5.7kg and 1.8kg of protein and fat
respectively; while ‘reject’ would yield 21.2kg and 16kg of protein and fat respectively.
Table 5: Amounts of protein and fat from a tonne of each waste stream (wet weight basis)
Waste Stream
Values
Feed
Added (g)
Prepupal Weight
(g)
Prepupal Weight as % of
Feed
Protein Content
(g)
Protein as % of
Feed
Fat
Content (g)
Fat as % of Feed
F
Experimental 1000.00 27.59 2.8 10.43 1.04 11.51 1.15
Per ton of Feed 1000000 27590.00 10429.02 11505.03
M
Experimental 670.00 9.25 1.4 3.78 0.56 1.19 0.18
Per ton of Feed 1000000 13805.97 5646.64 1780.97
R
Experimental 670.00 35.60 5.3 14.17 2.11 10.72 1.60
Per ton Feed 1000000 53134.33 21147.46 15993.43
It should be mentioned here, however, that the organic and inorganic contents of the ‘reject’
material was not known at the time of the experiments, partly because the compositions were
never constant, they varied among waste deliveries. Knowing these proportions would have
given a clearer picture of how much the larvae in this waste stream actually consumed.
Furthermore, to have an idea of the fates of the added waste or feed, feed residue, feed consumed, prepupal weight, protein and fat contents among others were calculated as percentages of the added feed/waste. According to Table 6 below, only an average of 13.5% of the consumed feed was turned to prepupal biomass whereas 86.5% was possibly turned into emissions to the atmosphere, and a small amount of this may also have been in the residue percentage from larval excretion. Further, the Sankey diagram in Figure 24 depicts the fate of the added feed. Feed residue and feed consumed are calculated as percentages of the feed added; feed consumed is further divided into prepupal weight and other (emissions to the atmosphere, etc), both expressed as percentages of the consumed feed; finally, prepupal weight is further divided into protein, fat, and ‘other’ (larval metabolism, etc), and all three expressed as percentages of prepupal weight.
Table 6: Fates of the added feed for each waste stream in the course of the experiments (wet weight basis)
Waste Stream
Feed Added
(%)
Feed
Residue as % of
Feed Added
Feed
Consumed as % of
Feed Added
Prepupal Weight as % of Feed Consumed
Emissions to air as %
of Feed Consumed
Protein as
% of Prepupae
Fat as % of Prepupae
Other Body
Constitu-ents as %
of Prepupae
F 100 37.61 62.39 10.1 89.9 37.8 41.7 20.50
M 100 84.59 15.41 7.1 92.9 40.9 12.9 46.20
R 100 45.69 54.31 13.5 86.5 39.8 30.1 30.10
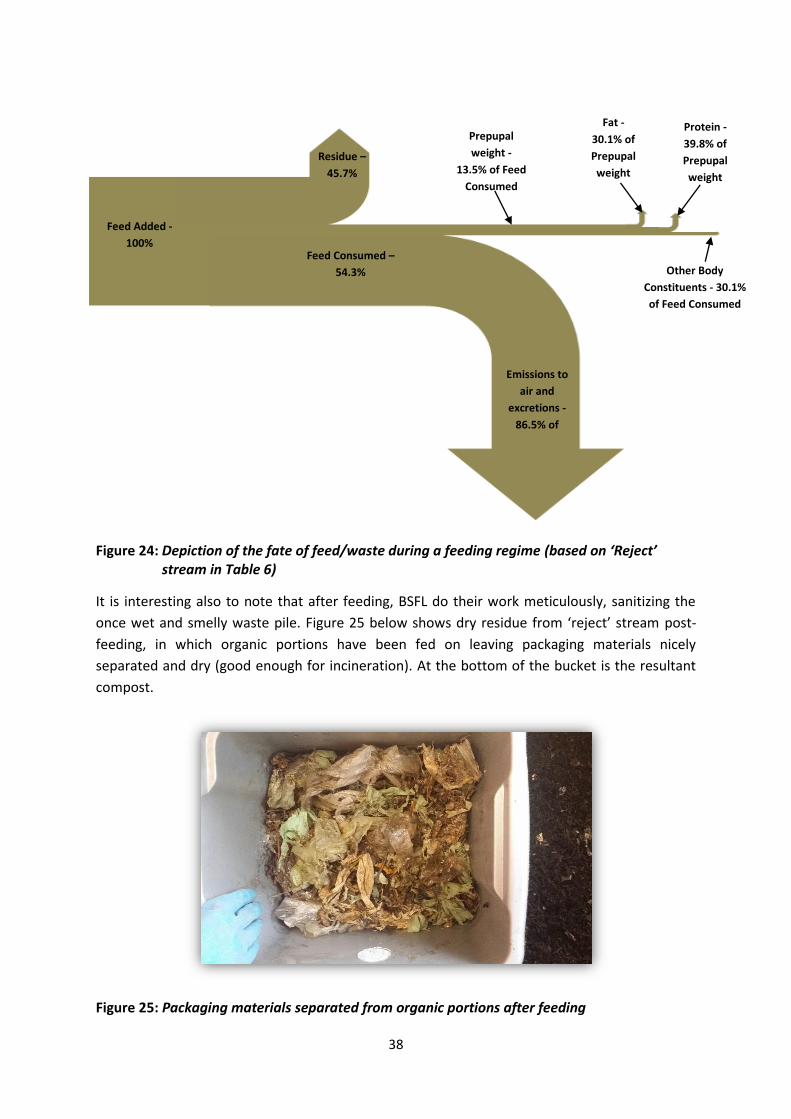
38
Figure 24: Depiction of the fate of feed/waste during a feeding regime (based on ‘Reject’ stream in Table 6)
It is interesting also to note that after feeding, BSFL do their work meticulously, sanitizing the
once wet and smelly waste pile. Figure 25 below shows dry residue from ‘reject’ stream post-
feeding, in which organic portions have been fed on leaving packaging materials nicely
separated and dry (good enough for incineration). At the bottom of the bucket is the resultant
compost.
Figure 25: Packaging materials separated from organic portions after feeding
Feed Added -
100% Feed Consumed –
54.3%
Residue –
45.7%
Emissions to
air and
excretions -
86.5% of
Feed
Consumed
Prepupal
weight -
13.5% of Feed
Consumed
Protein -
39.8% of
Prepupal
weight
Fat -
30.1% of
Prepupal
weight
Other Body
Constituents - 30.1%
of Feed Consumed
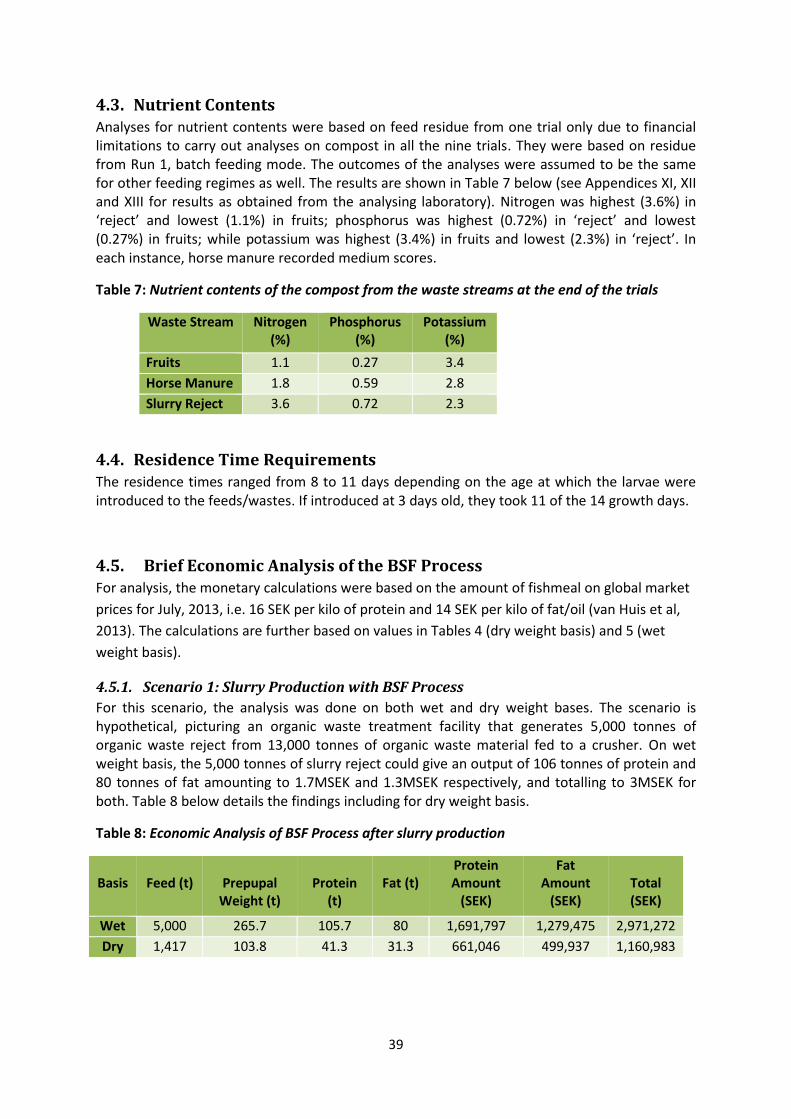
39
4.3. Nutrient Contents Analyses for nutrient contents were based on feed residue from one trial only due to financial limitations to carry out analyses on compost in all the nine trials. They were based on residue from Run 1, batch feeding mode. The outcomes of the analyses were assumed to be the same for other feeding regimes as well. The results are shown in Table 7 below (see Appendices XI, XII and XIII for results as obtained from the analysing laboratory). Nitrogen was highest (3.6%) in ‘reject’ and lowest (1.1%) in fruits; phosphorus was highest (0.72%) in ‘reject’ and lowest (0.27%) in fruits; while potassium was highest (3.4%) in fruits and lowest (2.3%) in ‘reject’. In each instance, horse manure recorded medium scores.
Table 7: Nutrient contents of the compost from the waste streams at the end of the trials
Waste Stream Nitrogen (%)
Phosphorus (%)
Potassium (%)
Fruits 1.1 0.27 3.4
Horse Manure 1.8 0.59 2.8
Slurry Reject 3.6 0.72 2.3
4.4. Residence Time Requirements The residence times ranged from 8 to 11 days depending on the age at which the larvae were introduced to the feeds/wastes. If introduced at 3 days old, they took 11 of the 14 growth days.
4.5. Brief Economic Analysis of the BSF Process For analysis, the monetary calculations were based on the amount of fishmeal on global market
prices for July, 2013, i.e. 16 SEK per kilo of protein and 14 SEK per kilo of fat/oil (van Huis et al,
2013). The calculations are further based on values in Tables 4 (dry weight basis) and 5 (wet
weight basis).
4.5.1. Scenario 1: Slurry Production with BSF Process
For this scenario, the analysis was done on both wet and dry weight bases. The scenario is hypothetical, picturing an organic waste treatment facility that generates 5,000 tonnes of organic waste reject from 13,000 tonnes of organic waste material fed to a crusher. On wet weight basis, the 5,000 tonnes of slurry reject could give an output of 106 tonnes of protein and 80 tonnes of fat amounting to 1.7MSEK and 1.3MSEK respectively, and totalling to 3MSEK for both. Table 8 below details the findings including for dry weight basis.
Table 8: Economic Analysis of BSF Process after slurry production
Basis
Feed (t)
Prepupal
Weight (t)
Protein
(t)
Fat (t)
Protein Amount
(SEK)
Fat Amount
(SEK)
Total (SEK)
Wet 5,000 265.7 105.7 80 1,691,797 1,279,475 2,971,272
Dry 1,417 103.8 41.3 31.3 661,046 499,937 1,160,983
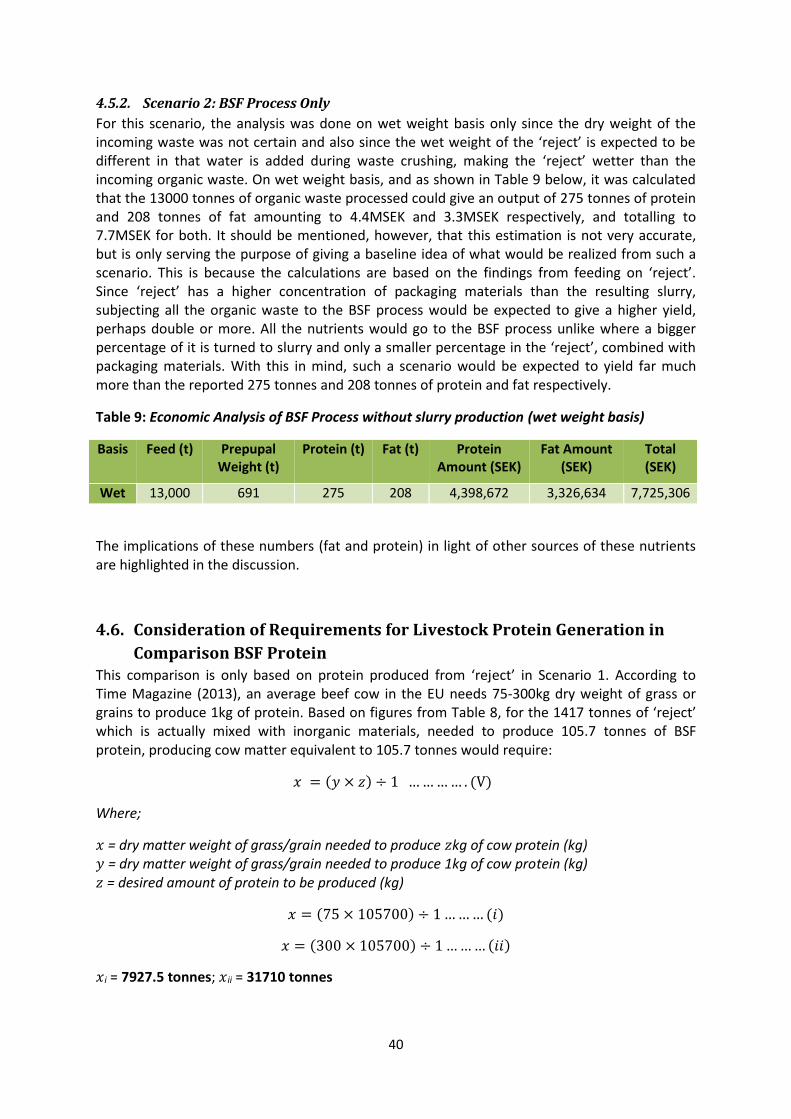
40
4.5.2. Scenario 2: BSF Process Only
For this scenario, the analysis was done on wet weight basis only since the dry weight of the incoming waste was not certain and also since the wet weight of the ‘reject’ is expected to be different in that water is added during waste crushing, making the ‘reject’ wetter than the incoming organic waste. On wet weight basis, and as shown in Table 9 below, it was calculated that the 13000 tonnes of organic waste processed could give an output of 275 tonnes of protein and 208 tonnes of fat amounting to 4.4MSEK and 3.3MSEK respectively, and totalling to 7.7MSEK for both. It should be mentioned, however, that this estimation is not very accurate, but is only serving the purpose of giving a baseline idea of what would be realized from such a scenario. This is because the calculations are based on the findings from feeding on ‘reject’. Since ‘reject’ has a higher concentration of packaging materials than the resulting slurry, subjecting all the organic waste to the BSF process would be expected to give a higher yield, perhaps double or more. All the nutrients would go to the BSF process unlike where a bigger percentage of it is turned to slurry and only a smaller percentage in the ‘reject’, combined with packaging materials. With this in mind, such a scenario would be expected to yield far much more than the reported 275 tonnes and 208 tonnes of protein and fat respectively.
Table 9: Economic Analysis of BSF Process without slurry production (wet weight basis)
Basis Feed (t) Prepupal Weight (t)
Protein (t) Fat (t) Protein Amount (SEK)
Fat Amount (SEK)
Total (SEK)
Wet 13,000 691 275 208 4,398,672 3,326,634 7,725,306
The implications of these numbers (fat and protein) in light of other sources of these nutrients are highlighted in the discussion.
4.6. Consideration of Requirements for Livestock Protein Generation in
Comparison BSF Protein This comparison is only based on protein produced from ‘reject’ in Scenario 1. According to Time Magazine (2013), an average beef cow in the EU needs 75-300kg dry weight of grass or grains to produce 1kg of protein. Based on figures from Table 8, for the 1417 tonnes of ‘reject’ which is actually mixed with inorganic materials, needed to produce 105.7 tonnes of BSF protein, producing cow matter equivalent to 105.7 tonnes would require:
𝑥 = (𝑦 × 𝑧) ÷ 1 … … … … . (V)
Where;
𝑥 = dry matter weight of grass/grain needed to produce 𝑧kg of cow protein (kg) 𝑦 = dry matter weight of grass/grain needed to produce 1kg of cow protein (kg) 𝑧 = desired amount of protein to be produced (kg)
𝑥 = (75 × 105700) ÷ 1 … … … (𝑖)
𝑥 = (300 × 105700) ÷ 1 … … … (𝑖𝑖)
𝑥i = 7927.5 tonnes; 𝑥ii = 31710 tonnes
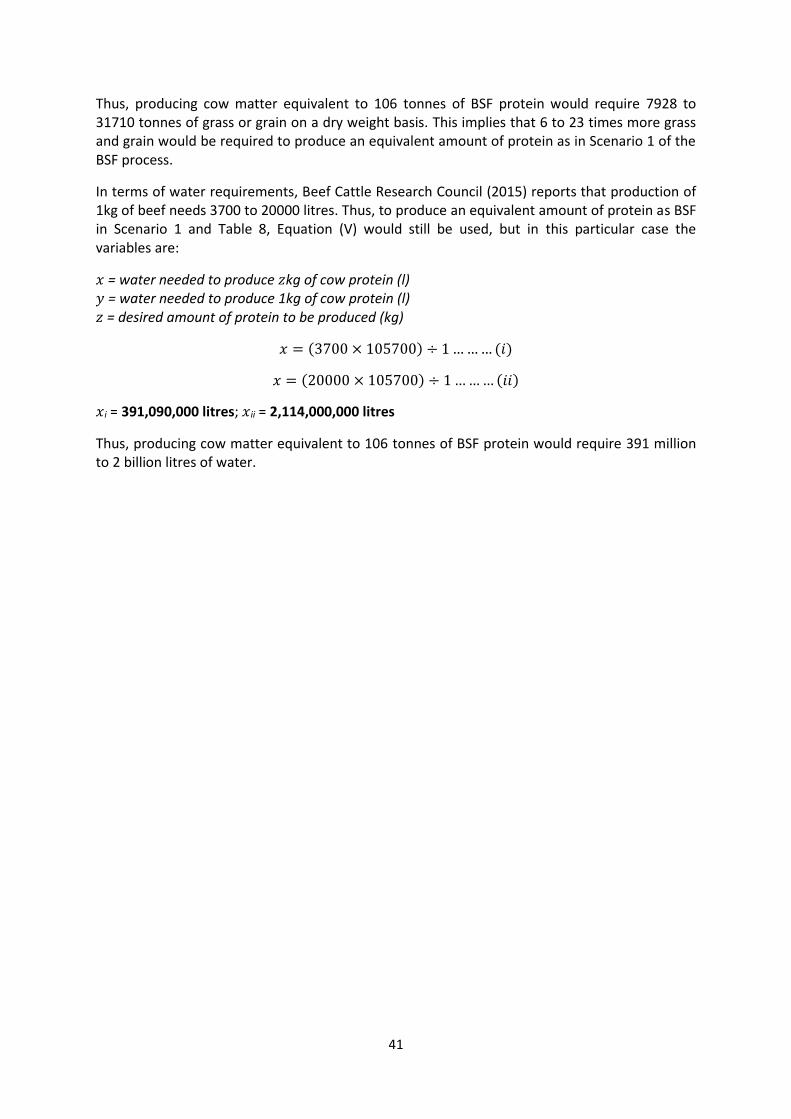
41
Thus, producing cow matter equivalent to 106 tonnes of BSF protein would require 7928 to 31710 tonnes of grass or grain on a dry weight basis. This implies that 6 to 23 times more grass and grain would be required to produce an equivalent amount of protein as in Scenario 1 of the BSF process.
In terms of water requirements, Beef Cattle Research Council (2015) reports that production of 1kg of beef needs 3700 to 20000 litres. Thus, to produce an equivalent amount of protein as BSF in Scenario 1 and Table 8, Equation (V) would still be used, but in this particular case the variables are:
𝑥 = water needed to produce 𝑧kg of cow protein (l) 𝑦 = water needed to produce 1kg of cow protein (l) 𝑧 = desired amount of protein to be produced (kg)
𝑥 = (3700 × 105700) ÷ 1 … … … (𝑖)
𝑥 = (20000 × 105700) ÷ 1 … … … (𝑖𝑖)
𝑥i = 391,090,000 litres; 𝑥ii = 2,114,000,000 litres
Thus, producing cow matter equivalent to 106 tonnes of BSF protein would require 391 million to 2 billion litres of water.
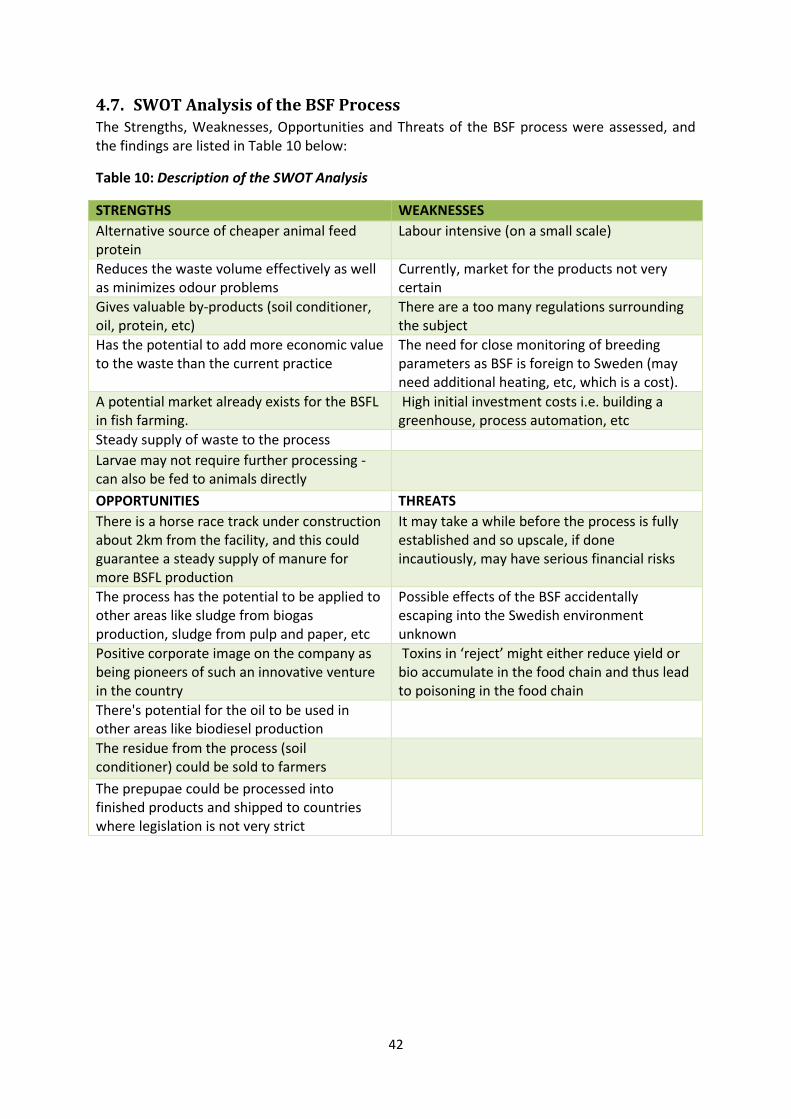
42
4.7. SWOT Analysis of the BSF Process The Strengths, Weaknesses, Opportunities and Threats of the BSF process were assessed, and the findings are listed in Table 10 below:
Table 10: Description of the SWOT Analysis
STRENGTHS WEAKNESSES
Alternative source of cheaper animal feed protein
Labour intensive (on a small scale)
Reduces the waste volume effectively as well as minimizes odour problems
Currently, market for the products not very certain
Gives valuable by-products (soil conditioner, oil, protein, etc)
There are a too many regulations surrounding the subject
Has the potential to add more economic value to the waste than the current practice
The need for close monitoring of breeding parameters as BSF is foreign to Sweden (may need additional heating, etc, which is a cost).
A potential market already exists for the BSFL in fish farming.
High initial investment costs i.e. building a greenhouse, process automation, etc
Steady supply of waste to the process
Larvae may not require further processing - can also be fed to animals directly
OPPORTUNITIES THREATS
There is a horse race track under construction about 2km from the facility, and this could guarantee a steady supply of manure for more BSFL production
It may take a while before the process is fully established and so upscale, if done incautiously, may have serious financial risks
The process has the potential to be applied to other areas like sludge from biogas production, sludge from pulp and paper, etc
Possible effects of the BSF accidentally escaping into the Swedish environment unknown
Positive corporate image on the company as being pioneers of such an innovative venture in the country
Toxins in ‘reject’ might either reduce yield or bio accumulate in the food chain and thus lead to poisoning in the food chain
There's potential for the oil to be used in other areas like biodiesel production
The residue from the process (soil conditioner) could be sold to farmers
The prepupae could be processed into finished products and shipped to countries where legislation is not very strict
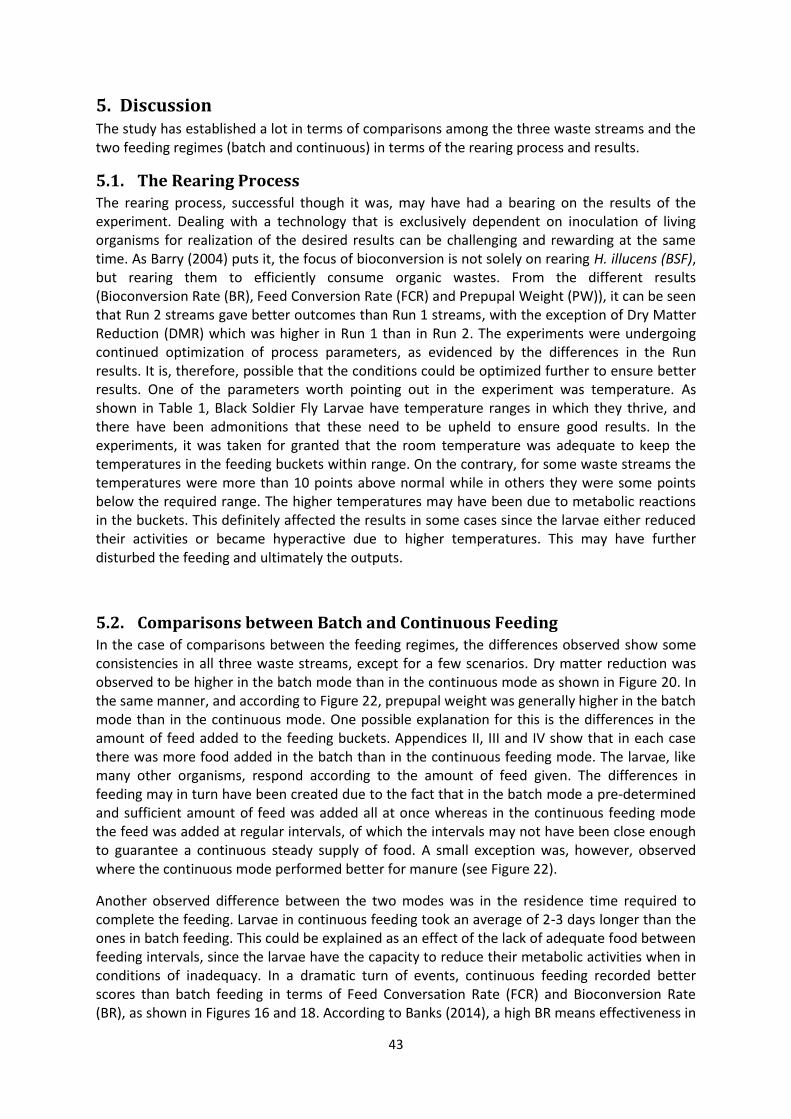
43
5. Discussion The study has established a lot in terms of comparisons among the three waste streams and the two feeding regimes (batch and continuous) in terms of the rearing process and results.
5.1. The Rearing Process The rearing process, successful though it was, may have had a bearing on the results of the experiment. Dealing with a technology that is exclusively dependent on inoculation of living organisms for realization of the desired results can be challenging and rewarding at the same time. As Barry (2004) puts it, the focus of bioconversion is not solely on rearing H. illucens (BSF), but rearing them to efficiently consume organic wastes. From the different results (Bioconversion Rate (BR), Feed Conversion Rate (FCR) and Prepupal Weight (PW)), it can be seen that Run 2 streams gave better outcomes than Run 1 streams, with the exception of Dry Matter Reduction (DMR) which was higher in Run 1 than in Run 2. The experiments were undergoing continued optimization of process parameters, as evidenced by the differences in the Run results. It is, therefore, possible that the conditions could be optimized further to ensure better results. One of the parameters worth pointing out in the experiment was temperature. As shown in Table 1, Black Soldier Fly Larvae have temperature ranges in which they thrive, and there have been admonitions that these need to be upheld to ensure good results. In the experiments, it was taken for granted that the room temperature was adequate to keep the temperatures in the feeding buckets within range. On the contrary, for some waste streams the temperatures were more than 10 points above normal while in others they were some points below the required range. The higher temperatures may have been due to metabolic reactions in the buckets. This definitely affected the results in some cases since the larvae either reduced their activities or became hyperactive due to higher temperatures. This may have further disturbed the feeding and ultimately the outputs.
5.2. Comparisons between Batch and Continuous Feeding In the case of comparisons between the feeding regimes, the differences observed show some consistencies in all three waste streams, except for a few scenarios. Dry matter reduction was observed to be higher in the batch mode than in the continuous mode as shown in Figure 20. In the same manner, and according to Figure 22, prepupal weight was generally higher in the batch mode than in the continuous mode. One possible explanation for this is the differences in the amount of feed added to the feeding buckets. Appendices II, III and IV show that in each case there was more food added in the batch than in the continuous feeding mode. The larvae, like many other organisms, respond according to the amount of feed given. The differences in feeding may in turn have been created due to the fact that in the batch mode a pre-determined and sufficient amount of feed was added all at once whereas in the continuous feeding mode the feed was added at regular intervals, of which the intervals may not have been close enough to guarantee a continuous steady supply of food. A small exception was, however, observed where the continuous mode performed better for manure (see Figure 22).
Another observed difference between the two modes was in the residence time required to complete the feeding. Larvae in continuous feeding took an average of 2-3 days longer than the ones in batch feeding. This could be explained as an effect of the lack of adequate food between feeding intervals, since the larvae have the capacity to reduce their metabolic activities when in conditions of inadequacy. In a dramatic turn of events, continuous feeding recorded better scores than batch feeding in terms of Feed Conversation Rate (FCR) and Bioconversion Rate (BR), as shown in Figures 16 and 18. According to Banks (2014), a high BR means effectiveness in
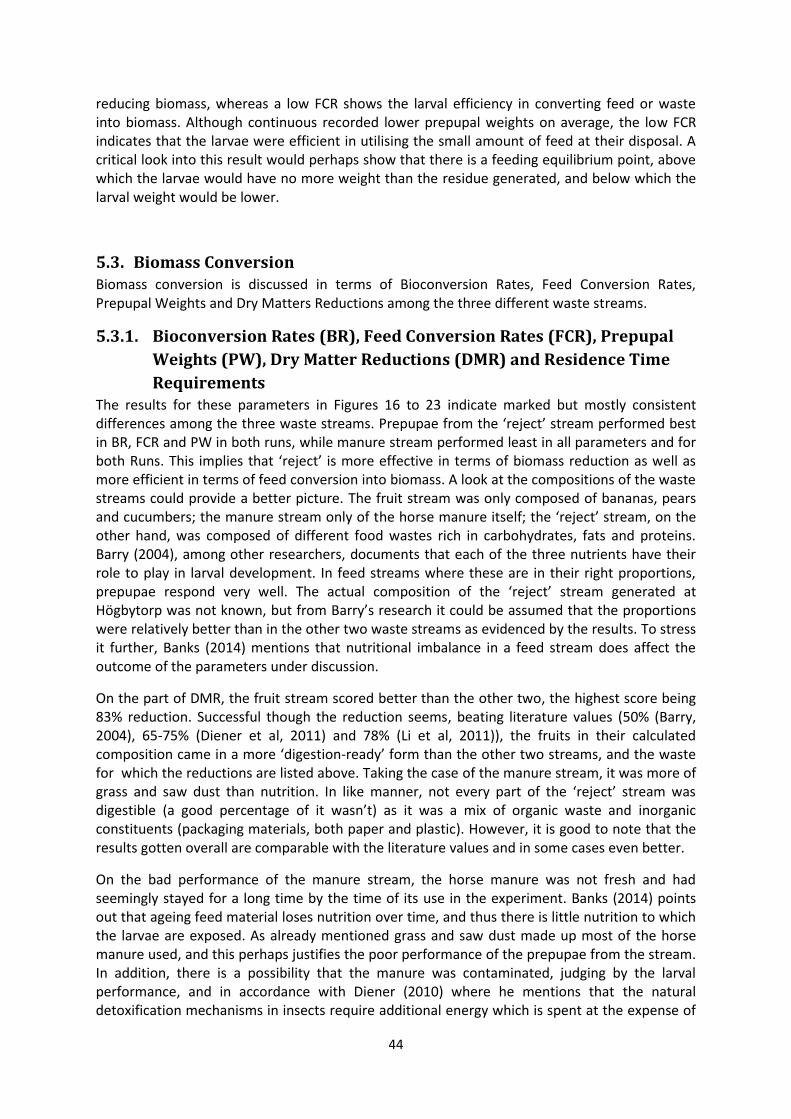
44
reducing biomass, whereas a low FCR shows the larval efficiency in converting feed or waste into biomass. Although continuous recorded lower prepupal weights on average, the low FCR indicates that the larvae were efficient in utilising the small amount of feed at their disposal. A critical look into this result would perhaps show that there is a feeding equilibrium point, above which the larvae would have no more weight than the residue generated, and below which the larval weight would be lower.
5.3. Biomass Conversion Biomass conversion is discussed in terms of Bioconversion Rates, Feed Conversion Rates, Prepupal Weights and Dry Matters Reductions among the three different waste streams.
5.3.1. Bioconversion Rates (BR), Feed Conversion Rates (FCR), Prepupal
Weights (PW), Dry Matter Reductions (DMR) and Residence Time
Requirements The results for these parameters in Figures 16 to 23 indicate marked but mostly consistent differences among the three waste streams. Prepupae from the ‘reject’ stream performed best in BR, FCR and PW in both runs, while manure stream performed least in all parameters and for both Runs. This implies that ‘reject’ is more effective in terms of biomass reduction as well as more efficient in terms of feed conversion into biomass. A look at the compositions of the waste streams could provide a better picture. The fruit stream was only composed of bananas, pears and cucumbers; the manure stream only of the horse manure itself; the ‘reject’ stream, on the other hand, was composed of different food wastes rich in carbohydrates, fats and proteins. Barry (2004), among other researchers, documents that each of the three nutrients have their role to play in larval development. In feed streams where these are in their right proportions, prepupae respond very well. The actual composition of the ‘reject’ stream generated at Högbytorp was not known, but from Barry’s research it could be assumed that the proportions were relatively better than in the other two waste streams as evidenced by the results. To stress it further, Banks (2014) mentions that nutritional imbalance in a feed stream does affect the outcome of the parameters under discussion.
On the part of DMR, the fruit stream scored better than the other two, the highest score being 83% reduction. Successful though the reduction seems, beating literature values (50% (Barry, 2004), 65-75% (Diener et al, 2011) and 78% (Li et al, 2011)), the fruits in their calculated composition came in a more ‘digestion-ready’ form than the other two streams, and the waste for which the reductions are listed above. Taking the case of the manure stream, it was more of grass and saw dust than nutrition. In like manner, not every part of the ‘reject’ stream was digestible (a good percentage of it wasn’t) as it was a mix of organic waste and inorganic constituents (packaging materials, both paper and plastic). However, it is good to note that the results gotten overall are comparable with the literature values and in some cases even better.
On the bad performance of the manure stream, the horse manure was not fresh and had seemingly stayed for a long time by the time of its use in the experiment. Banks (2014) points out that ageing feed material loses nutrition over time, and thus there is little nutrition to which the larvae are exposed. As already mentioned grass and saw dust made up most of the horse manure used, and this perhaps justifies the poor performance of the prepupae from the stream. In addition, there is a possibility that the manure was contaminated, judging by the larval performance, and in accordance with Diener (2010) where he mentions that the natural detoxification mechanisms in insects require additional energy which is spent at the expense of
45
growth and/or health. He further points out that this is usually reflected in alteration of any of such important life history traits as decreased body mass, decreased life span and generally decreased resilience. Since the source of the manure was not known at the time and was required in urgency, such that the points of nutrition and toxicity were not considered, it should have been subjected to some tests before hand to ascertain its suitability.
5.3.2. Fat, Protein and Nutrient Contents For the fat and protein contents, the ‘reject’ stream shows more consistency with the literature values of 40% and 30% of protein and fat respectively. For the fruits stream, it shows a higher fat content than protein, 41% and 38% respectively. This may be a result of the fruit diet which may be more of fat than protein based. This outcome also entails that there is a possibility to alter the contents of the resulting prepupae depending on what percentages of fat and protein are needed. In the wake of such, it would be worthwhile to try the process on different other waste streams and their mixes to determine the combinations that would give the desired nutrient compositions. For the manure stream, with the composition of 41% protein and 13% fat, the protein is within expected limits but for the fat, which may have been a result of nutritional imbalance in the waste stream as explained already.
5.3.3. Fate of Feed in a Feeding Regime Based on the results from the ‘reject’ stream in Run 2, Figure 24 which depicts the fates of the feed/waste during a feeding regime was developed. If more Sankey diagrams were generated for the manure and fruits streams, the outcomes would be pretty much the same. About 45.7% of the feed in this case is given out as residue. While it is known that ‘reject’ stream has a component of packaging waste (inorganic waste), it still stands that there would be need to reduce on the amount of feed going towards residue, especially if prepupal biomass is desired more than the compost material, and this could be achieved by optimizing the amount of feed that a bunch of larvae would need for the desired growth and saving the remaining part of the feed for raising more prepupae, thus increasing prepupal biomass without compromising quality. In the same manner, of the feed consumed, only 13.5% is utilised on prepupal biomass while about 86.5% is given out presumably as atmospheric emissions mainly, and a bit as larval excretions, which end up as part of the residue. This phenomenon of emissions to the atmosphere needs to be investigated to ascertain what is being released from the process and to find out whether those emissions pose any danger or not. Otherwise, the 86.5% needs to be reduced pretty much by way of maximizing the Bioconversion Rate so that more waste is converted into larval biomass.
Increasing the Bioconversion Rate, and thus prepupal biomass, would in turn increase the amount of protein and fat realised from a tonne of waste. It would follow that the calculations done and shown in Table 5 indicating that a tonne of waste on wet weight basis would yield 21kg of protein and 16kg of fat would increase drastically. This would translate into an increase in the monetary value realised from the process. Based on the hypothetical scenario about ‘reject’, subjecting the reject to the BSF process would bring monetary fortune of over 3MSEK per annum as shown in Table 8. In like manner, if the whole organic waste management chain was changed to only focus on the BSF process, a higher fortune of over 7MSEK per annum would be realised. However, these amounts were based on simple calculations of sales, no costs were considered. There is need to still work on the parameters and breeding conditions to increase output and minimize losses from the system.
46
5.3.4. Consideration of Requirements for Livestock Protein Generation in
Comparison with BSF Protein From the obtained results, producing a weight of cattle that is equivalent to only the weight of protein (106 tonnes) produced from 1417 tonnes of slurry reject, it would require 6 to 23 times more grass and grain, with a staggering 391 million to 2 billion litres of water, most of which is accounted for in crop production to feed these animals for protein generation. This implies a very high environmental footprint which is avoidable if this BSF phenomenon is taken with the seriousness and attention it deserves. It should also be mentioned that the comparisons here done are only based on BSF protein, unlike the cattle weight which is not only protein but whole weight including parts that may not be useful. FAO (2006) points out that 18% of all human-caused GHGs can be traced to livestock production, further highlighting other impacts like water depletion and pollution, land degradation and biodiversity loss, and climate change and air pollution.
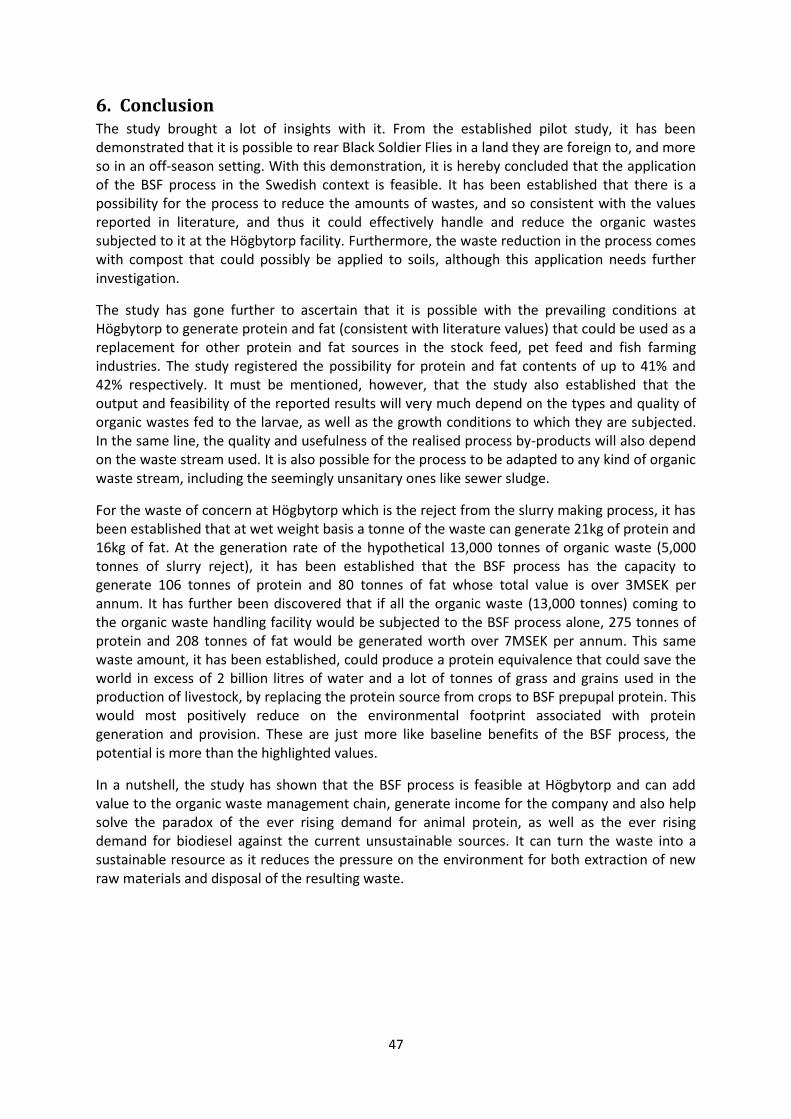
47
6. Conclusion The study brought a lot of insights with it. From the established pilot study, it has been demonstrated that it is possible to rear Black Soldier Flies in a land they are foreign to, and more so in an off-season setting. With this demonstration, it is hereby concluded that the application of the BSF process in the Swedish context is feasible. It has been established that there is a possibility for the process to reduce the amounts of wastes, and so consistent with the values reported in literature, and thus it could effectively handle and reduce the organic wastes subjected to it at the Högbytorp facility. Furthermore, the waste reduction in the process comes with compost that could possibly be applied to soils, although this application needs further investigation.
The study has gone further to ascertain that it is possible with the prevailing conditions at Högbytorp to generate protein and fat (consistent with literature values) that could be used as a replacement for other protein and fat sources in the stock feed, pet feed and fish farming industries. The study registered the possibility for protein and fat contents of up to 41% and 42% respectively. It must be mentioned, however, that the study also established that the output and feasibility of the reported results will very much depend on the types and quality of organic wastes fed to the larvae, as well as the growth conditions to which they are subjected. In the same line, the quality and usefulness of the realised process by-products will also depend on the waste stream used. It is also possible for the process to be adapted to any kind of organic waste stream, including the seemingly unsanitary ones like sewer sludge.
For the waste of concern at Högbytorp which is the reject from the slurry making process, it has been established that at wet weight basis a tonne of the waste can generate 21kg of protein and 16kg of fat. At the generation rate of the hypothetical 13,000 tonnes of organic waste (5,000 tonnes of slurry reject), it has been established that the BSF process has the capacity to generate 106 tonnes of protein and 80 tonnes of fat whose total value is over 3MSEK per annum. It has further been discovered that if all the organic waste (13,000 tonnes) coming to the organic waste handling facility would be subjected to the BSF process alone, 275 tonnes of protein and 208 tonnes of fat would be generated worth over 7MSEK per annum. This same waste amount, it has been established, could produce a protein equivalence that could save the world in excess of 2 billion litres of water and a lot of tonnes of grass and grains used in the production of livestock, by replacing the protein source from crops to BSF prepupal protein. This would most positively reduce on the environmental footprint associated with protein generation and provision. These are just more like baseline benefits of the BSF process, the potential is more than the highlighted values.
In a nutshell, the study has shown that the BSF process is feasible at Högbytorp and can add value to the organic waste management chain, generate income for the company and also help solve the paradox of the ever rising demand for animal protein, as well as the ever rising demand for biodiesel against the current unsustainable sources. It can turn the waste into a sustainable resource as it reduces the pressure on the environment for both extraction of new raw materials and disposal of the resulting waste.
48
7. Recommendations The following are the recommendations for further work on the project:
1. There’s need to do complete energy and material balances for the highlighted scenarios and, especially, for the BSF process in particular so as to get a better impression of expectations from the project.
2. In the progression of the project, there would be need to consider the possibility for genetic modification on the flies, and its possible implications. This is against the threat that the flies might get into the Swedish environment to which they are alien, since there’s some uncertainty on implications of such an occurrence.
3. A more detailed consideration and analysis of the economic, environmental and social aspects of the project before final implementation would be beneficial.
4. There is need for thorough market research for the process by-products before the process can be adopted on a full scale.
5. It would be imperative for Ragn Sells to seek collaboration with other organizations already in this field for knowledge sharing as well as for pushing the insect for food and feed agenda with consented efforts, since the phenomenon is still challenged.
6. It would be interesting to try the process on other waste streams that Ragn Sells has in its sphere of influence, such as sludge from the biogas production process.
7. Apart from the organic waste, perhaps the process could be tried on other leachates as it might be a treatment solution for polluting leachates as well.
8. There is need to investigate the reported potential for biodiesel production from the fat, and just how feasible it can be. Otherwise, market research should include research on what other products could be made from the fat.
9. In all future rearing work, it is vital to follow all stipulated requirements and conditions to ensure desired bioconversion results and by-products.
10. There is need to maximize the Bioconversion Rates in the waste streams so that more waste can be converted to larvae.
49
References
Axtell, R.C., Edwards, T.D. 1970. Hermetia illucens Control in Poultry Manure by Larviciding. Journal of Economic Entomology, 63(6), pp.1786‐1787.
Banks, I., 2014. To assess the impact of Black Soldier Fly (Hermetia illucens) Larvae on faecal reduction in pit latrines. Ph.D. London School of Hygiene & Tropical Medicine. Available at: https://researchonline.lshtm.ac.uk/1917781/1/2014_ITD_PhD_Banks_IJ.pdf [Accessed 16 January 2015] Barry, T., 2004. Evaluation of the Economic, Social, and Biological Feasibility of Bioconverting Food Wastes with the Black Soldier Fly (Hermetia illucens). PhD. University of North Texas. Available at: http://digital.library.unt.edu/ark:/67531/metadc4639/m/ [Accessed 16 January 2015] Beef Cattle Research Council, 2015. Environmental Footprint of Beef Production. [Online] (Updated 16 April 2015). Available at: http://www.beefresearch.ca/research-topic.cfm/environmental-footprint-of-beef-production-6 [Accessed 11 June 2015]
Black, T.H.E. et al., 2004. Evaluation of the Economic, Social, and Biological Feasibility of Bioconverting Food Wastes with the Black Soldier Fly (Hermetia illucens).
Booth, D.C. & Sheppard, D.C., 1984. Oviposition of the black soldier fly, Hermetia illucens (L) (Diptera: Stratiomyidae): Eggs, masses, timing, and site characteristics. Environ. Entomol. 13: 421-423.
Byrne, J., 2015. ‘We will follow friendly legislation around the world’ – Insect feed maker, AgriProtein, says logic will win out in the EU. Feed Navigator, [internet] 20 February 2015. (Updated 23 February 2015) Available at: http://www.feednavigator.com/Regulation/Insect-feed-maker-AgriProtein-says-logic-will-win-out-in-the-EU [Accessed 27 February 2015]
Capstone, E. et al., 2013. The Black Soldier Fly. , pp.1–12.
Carrington, D., 2014. Giving up beef will reduce carbon footprint more than cars. The Guardian, [internet] 21 July. Available at: http://www.theguardian.com/environment/2014/jul/21/giving-up-beef-reduce-carbon-footprint-more-than-cars [Accessed 22 May, 2015].
Craig Sheppard, D. et al., 2002. Rearing Methods for the Black Soldier Fly (Diptera: Stratiomyidae). Journal of Medical Entomology, 39(4), pp.695–698. Available at: http://openurl.ingenta.com/content/xref?genre=article&issn=0022-2585&volume=39&issue=4&spage=695 [Accessed 22 January, 2015].
50
DeFoliart, G.R. 1989. The human use of insects as food and as animal feed. Bulletin of the Entomological Society of America, 35: 22–35.
Diclaro II, Joseph W. & Kaufman, Phillip E., 2009. Black Soldier Fly Hermetia Illucens Linnaeus (Insecta: Diptera: Stratiomyidae). IFAS Extension: University of Florida. Available at: http://edis.ifas.ufl.edu/pdffiles/in/in83000.pdf [Accessed 21 January 2015] Diener, S., 2010. Valorisation of Organic Solid Waste using the Black Soldier Fly, Hermetia illucens, in Low and Middle-Income Countries. Ph.D. Zurich: Swiss Federal Institute of Aquatic Science and Technology (Eawag).
Diener, S. & Zurbrugg, C., 2011. Black Soldier Fly Larvae for Organic Waste Treatment - Prospects and Constraints. In: 2nd International Conference on Solid Waste Management in the Developing Countries. Khulna, Bagladesh 13-15 February 2011. Eawag: Zurich.
Diener, S. et al., 2011. Biological Treatment of Municipal Organic Waste using Black Soldier Fly Larvae. Waste and Biomass Valorization, November, 2(4), pp.357-363. Available at: http://link.springer.com/article/10.1007%2Fs12649-011-9079-1 [Accessed 16 January 2015]
Diener, S. Zurbrugg, C. & Tockner, K., 2009. Conversion of organic material by black soldier fly larvae: establishing optimal feeding rates. Waste Management & Research, 27(2009), pp.603-610. Available at: http://wmr.sagepub.com.focus.lib.kth.se/content/27/6/603.full.pdf+html [Accessed 16 January 2015] Erkman, S. & Ramaswamy, R., 2003. Industrial ecology: an introduction. In: K. Green & S. Randles, eds. 2006. Industrial ecology and space of innovation. Cheltenham: Edward Elgar Publishing Limited. Ch.2. ESR International, 2008. Bio-conversion of putrescent waste. Available at: http://www.esrint.com/pages/bioconversion.html [Accessed 26 January 2015] Food and Agriculture Organization, 2006. Livestock Impacts on the Environment. [Online] November 2006. Available at: http://www.fao.org/ag/magazine/0612sp1.htm [Accessed 11 June 2015] Furman, D.P., Young, R.D., Catts, E.P. 1959. Hermetia illucens (Linnaeus) as a Factor in the Natural Control of Musca domestica Linnaeus. Journal of Economic Entomology, 52(5), 917‐921. Hale, O.M., 1973. Dried Hermetia illucens larvae (Diptera: Stratiomyidae) as a feed additive for poultry. Journal of the Georgia Entomological Society, 8, pp.16‐20. Hogsette, Jerome A., 1985. New diets for production of house flies and stable flies (Diptera: Muscidae) in the laboratory. Journal of Econ. Entomology, 85(6), pp.2291-2294.
51
Huis, van A. et al, 2013. Edible insects - Future prospects for food and feed security. Food and Agriculture Organization (FAO) Forestry Paper 171. Available at:http://www.fao.org/docrep/018/i3253e/i3253e00.htm [Accessed 9 February 2015]
Institute for the Environment, 2013. The Black Soldier Fly – How to Guide. Chapel Hill: University of North Carolina. Available at: http://www.ie.unc.edu/for_students/courses/capstone/13/bsfl_how-to_guide.pdf [Accessed 21 January 2015] Kim, W. et al., 2010. Biochemical characterization of digestive enzymes in the black soldier fly, Hermetia illucens (Diptera: Stratiomyidae). Journal of Asia-Pacific Entomology, 6 November, 14(2011), pp.11-14. Available at: http://www.sciencedirect.com.focus.lib.kth.se/science/article/pii/S1226861510001160 [Accessed 16 January 2015]
Li, Q. et al., 2011. From organic waste to biodiesel: Black soldier fly, Hermetia illucens, makes it feasible. Fuel, 90(4), pp.1545–1548. Available at: http://linkinghub.elsevier.com/retrieve/pii/S0016236110006307 [Accessed 22 January, 2015].
Li, Q. et al., 2011. Bioconversion of dairy manure by black soldier fly (Diptera: Stratiomyidae) for biodiesel and sugar production. Waste Management, 31(2011), pp.1316-1320. Available at: http://www.sciencedirect.com.focus.lib.kth.se/science/article/pii/S0956053X11000158 [Accessed 16 January 2015] Liu, Q. et al., 2012. Short-term effect of biochar and compost on soil fertility and water status of a Cambisol in NE Germany under field conditions. Journal of Plant Nutrition and Soil Science, [Online]. 2012 (000), pp.1-10. Available at: http://www.researchgate.net/profile/Bruno_Glaser2/publication/264316816_Short-term_effect_of_biochar_and_compost_on_soil_fertility_and_water_status_of_a_Dystric_Cambisol_in_NE_Germany_under_field_conditions/links/53fce09d0cf2dca8ffffbfde.pdf [Accessed 16 January 2015] Myers, H.M. et al., 2008. Development of Black Soldier Fly (Diptera: Stratiomyidae) Larvae Fed Dairy Manure Available at: http://ee.oxfordjournals.org/content/37/1/11 [Accessed 9 February 2015] Newton, G.L., Sheppard, D.C. & Burtle, G. 2008. Black soldier fly prepupae: a compelling alternative to fish meal and fish oil. A public comment prepared in response to a request by the National Marine Fisheries Service to gather information for the NOAA-USDA Alternative Feeds Initiative. Public comment on alternative feeds for aquaculture received by NOAA 15 November 2007 through 29 February 2008.
52
Newton et al, 2005. Using the black soldier fly, Hermetia illucens, as a value-added tool for the management of swine manure. Report for Mike Williams, Director of the Animal and Poultry Waste Management Center, North Carolina State University. Available at: http://www.cals.ncsu.edu/waste_mgt/smithfield_projects/phase2report05/phase2report.htm [Accessed 10 February 2015]
Popa, R. & Green, Terrence R., 2012. Using Black Soldier Fly Larvae for Processing Organic Leachates. Journal of Medical Entomology, 105(2), pp.374-378. Available at: http://jee.oxfordjournals.org/content/jee/105/2/374.full.pdf [Accessed 16 January 2015]
PROteINSECT, 2015. Insects as sustainable sources of protein. [internet]. Available at: http://www.proteinsect.eu/index.php?id=33 [Accessed 22 May 2015].
Sheppard C, Newton GL, Thompson SA, Savage S. 1994. A value added manure management system using the black soldier fly. Bioresource Technology, 50, pp.275-279. Tomberlin, J.K. & Sheppard, D.C., 2001. Lekking behavior of the black soldier fly (Diptera: Stratiomyidae). Florida Entomol. 84: 729-730. Tomberlin, Jeffery K. Sheppard, Craig D. & Joyce, John A., 2002. Selected Life-History Traits of Black Soldier Flies (Diptera: Stratiomydae) Reared on Three Artificial Diets. Entomology Society of America, 95(3), pp.379-386. Available at: http://forensicentomology.tamu.edu/pdf/Tomberlinetalannentsoc2002.pdf [Accessed 21 January 2015] Walsh, B., 2013. The triple whopper environmental impact of global meat production. Time, [internet] 16 December. Available at: http://science.time.com/2013/12/16/the-triple-whopper-environmental-impact-of-global-meat-production/ [Accessed 11 June 2015]
Wang, H. et al., 2013. A full-scale house fly (Diptera: Muscidae) larvae bioconversion system for value-added swine manure reduction. Waste Management & Research, 31(2), pp.223-231. Available at: http://wmr.sagepub.com.focus.lib.kth.se/content/31/2/223.full.pdf+html [Accessed 16 January 2015]
Zhang, J. et al., 2010. An artificial light source influences mating and oviposition ofblack soldier flies, Hermetia illucens. Journal of Insect Science, 16 July, 10(202). Available at: http://jinsectscience.oxfordjournals.org/content/10/1/202 [Accessed 21 January 2015]
Zheng, L. et al., 2012. Double the biodiesel yield: Rearing black soldier fly larvae, Hermetia illucens, on solid residual fraction of restaurant waste after grease extraction for biodiesel production. Renewable Energy, 41, pp.75–79. Available at: http://linkinghub.elsevier.com/retrieve/pii/S0960148111005696 [Accessed 22 January, 2015].
53
Zheng, L. et al., 2012. Biodiesel production from rice straw and restaurant waste employing black soldier fly assisted by microbes. Energy, 1 October, 47(2012), pp.225-229. Available at: http://www.sciencedirect.com.focus.lib.kth.se/science/article/pii/S0360544212006846 [Accessed 16 January 2015]
Zhou, F. et al., 2013. Developmental and Waste Reduction Plasticity of Three Black Soldier Fly Strains (Diptera: Stratiomyidae) Raised on Different Livestock Manures. Journal of Medical Entomology, 50(6), pp.1224-1230. Available at: http://jme.oxfordjournals.org/content/jmedent/50/6/1224.full.pdf [Accessed 16 January 2015]
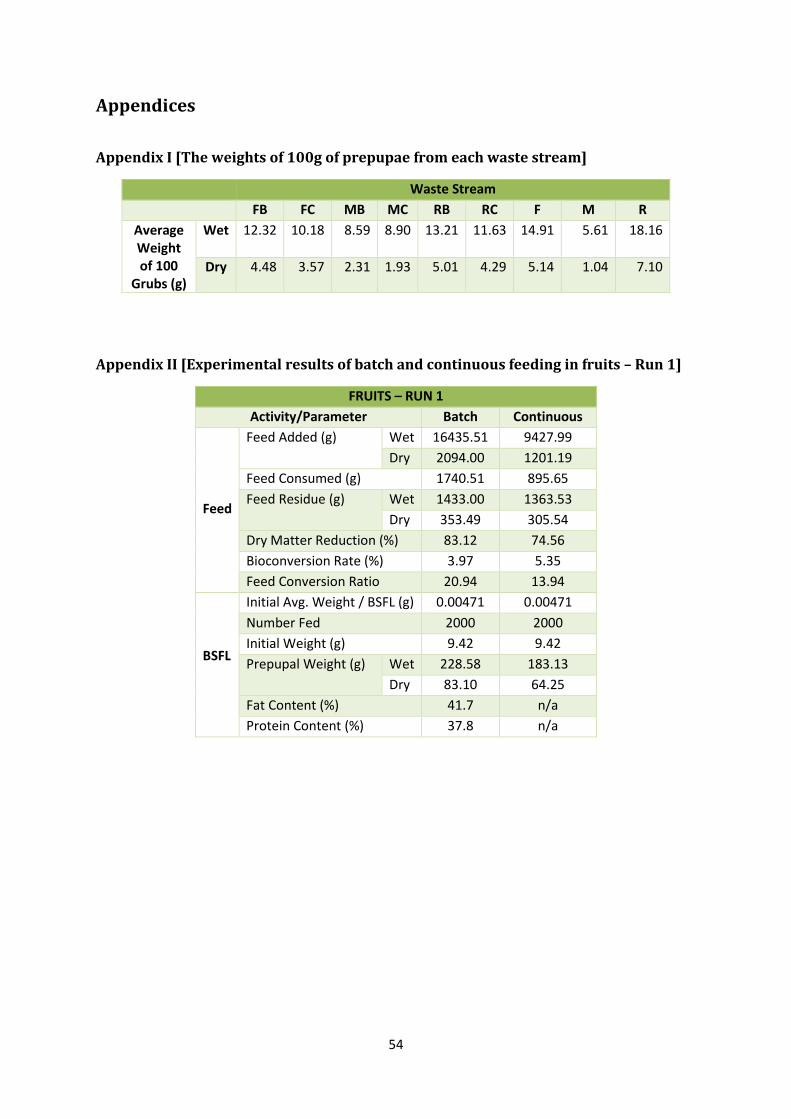
54
Appendices
Appendix I [The weights of 100g of prepupae from each waste stream]
Waste Stream
FB FC MB MC RB RC F M R
Average Weight of 100
Grubs (g)
Wet 12.32 10.18 8.59 8.90 13.21 11.63 14.91 5.61 18.16
Dry 4.48 3.57 2.31 1.93 5.01 4.29 5.14 1.04 7.10
Appendix II [Experimental results of batch and continuous feeding in fruits – Run 1]
FRUITS – RUN 1
Activity/Parameter Batch Continuous
Feed
Feed Added (g) Wet 16435.51 9427.99
Dry 2094.00 1201.19
Feed Consumed (g) 1740.51 895.65
Feed Residue (g) Wet 1433.00 1363.53
Dry 353.49 305.54
Dry Matter Reduction (%) 83.12 74.56
Bioconversion Rate (%) 3.97 5.35
Feed Conversion Ratio 20.94 13.94
BSFL
Initial Avg. Weight / BSFL (g) 0.00471 0.00471
Number Fed 2000 2000
Initial Weight (g) 9.42 9.42
Prepupal Weight (g) Wet 228.58 183.13
Dry 83.10 64.25
Fat Content (%) 41.7 n/a
Protein Content (%) 37.8 n/a
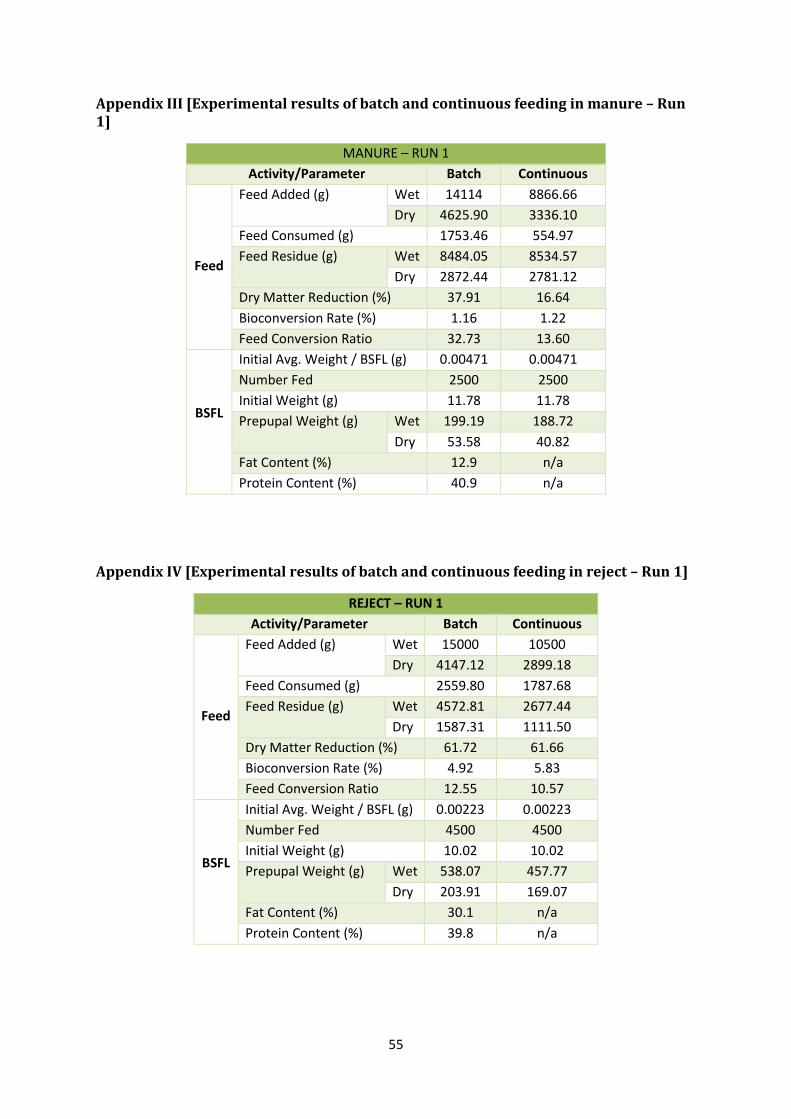
55
Appendix III [Experimental results of batch and continuous feeding in manure – Run 1]
MANURE – RUN 1
Activity/Parameter Batch Continuous
Feed
Feed Added (g) Wet 14114 8866.66
Dry 4625.90 3336.10
Feed Consumed (g) 1753.46 554.97
Feed Residue (g) Wet 8484.05 8534.57
Dry 2872.44 2781.12
Dry Matter Reduction (%) 37.91 16.64
Bioconversion Rate (%) 1.16 1.22
Feed Conversion Ratio 32.73 13.60
BSFL
Initial Avg. Weight / BSFL (g) 0.00471 0.00471
Number Fed 2500 2500
Initial Weight (g) 11.78 11.78
Prepupal Weight (g) Wet 199.19 188.72
Dry 53.58 40.82
Fat Content (%) 12.9 n/a
Protein Content (%) 40.9 n/a
Appendix IV [Experimental results of batch and continuous feeding in reject – Run 1]
REJECT – RUN 1
Activity/Parameter Batch Continuous
Feed
Feed Added (g) Wet 15000 10500
Dry 4147.12 2899.18
Feed Consumed (g) 2559.80 1787.68
Feed Residue (g) Wet 4572.81 2677.44
Dry 1587.31 1111.50
Dry Matter Reduction (%) 61.72 61.66
Bioconversion Rate (%) 4.92 5.83
Feed Conversion Ratio 12.55 10.57
BSFL
Initial Avg. Weight / BSFL (g) 0.00223 0.00223
Number Fed 4500 4500
Initial Weight (g) 10.02 10.02
Prepupal Weight (g) Wet 538.07 457.77
Dry 203.91 169.07
Fat Content (%) 30.1 n/a
Protein Content (%) 39.8 n/a
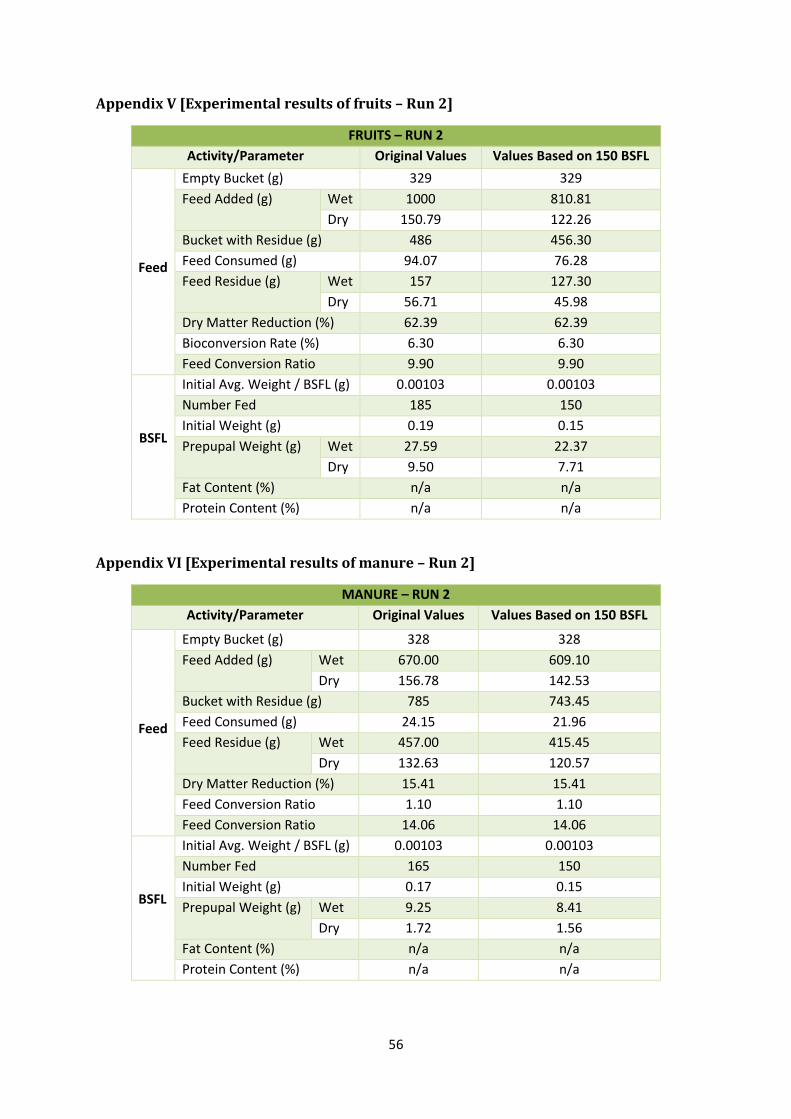
56
Appendix V [Experimental results of fruits – Run 2]
FRUITS – RUN 2
Activity/Parameter Original Values Values Based on 150 BSFL
Feed
Empty Bucket (g) 329 329
Feed Added (g) Wet 1000 810.81
Dry 150.79 122.26
Bucket with Residue (g) 486 456.30
Feed Consumed (g) 94.07 76.28
Feed Residue (g) Wet 157 127.30
Dry 56.71 45.98
Dry Matter Reduction (%) 62.39 62.39
Bioconversion Rate (%) 6.30 6.30
Feed Conversion Ratio 9.90 9.90
BSFL
Initial Avg. Weight / BSFL (g) 0.00103 0.00103
Number Fed 185 150
Initial Weight (g) 0.19 0.15
Prepupal Weight (g) Wet 27.59 22.37
Dry 9.50 7.71
Fat Content (%) n/a n/a
Protein Content (%) n/a n/a
Appendix VI [Experimental results of manure – Run 2]
MANURE – RUN 2
Activity/Parameter Original Values Values Based on 150 BSFL
Feed
Empty Bucket (g) 328 328
Feed Added (g) Wet 670.00 609.10
Dry 156.78 142.53
Bucket with Residue (g) 785 743.45
Feed Consumed (g) 24.15 21.96
Feed Residue (g) Wet 457.00 415.45
Dry 132.63 120.57
Dry Matter Reduction (%) 15.41 15.41
Feed Conversion Ratio 1.10 1.10
Feed Conversion Ratio 14.06 14.06
BSFL
Initial Avg. Weight / BSFL (g) 0.00103 0.00103
Number Fed 165 150
Initial Weight (g) 0.17 0.15
Prepupal Weight (g) Wet 9.25 8.41
Dry 1.72 1.56
Fat Content (%) n/a n/a
Protein Content (%) n/a n/a
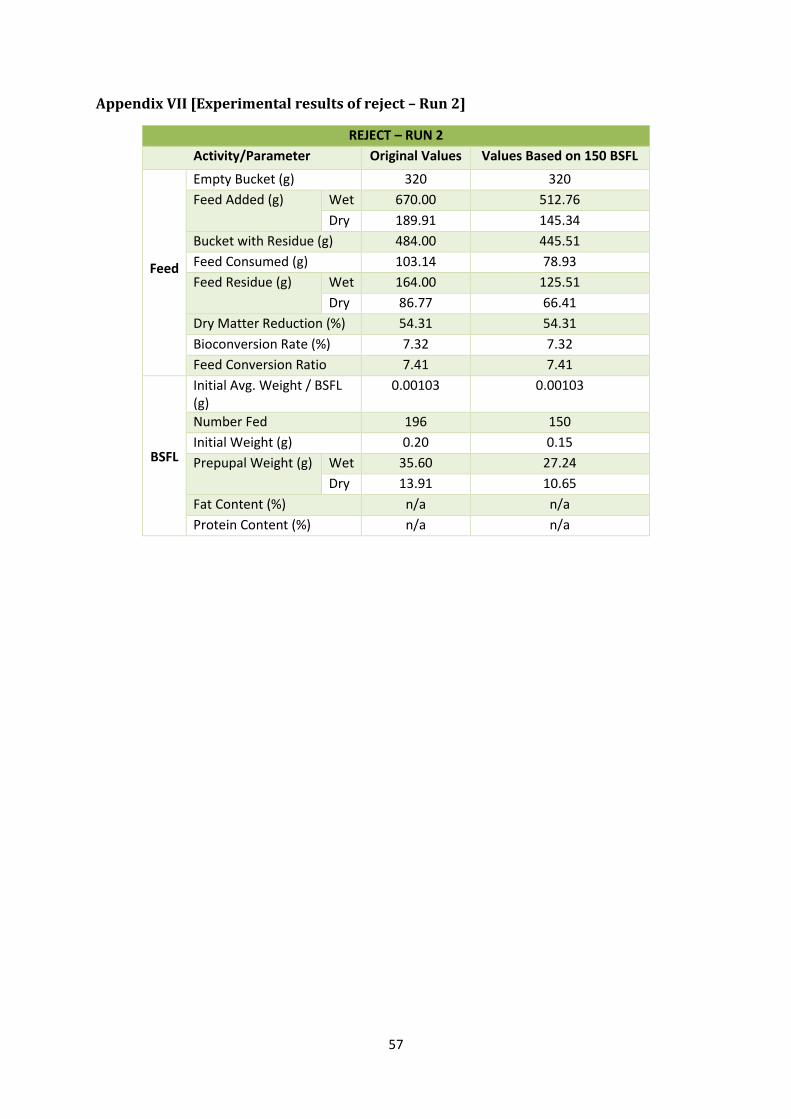
57
Appendix VII [Experimental results of reject – Run 2]
REJECT – RUN 2
Activity/Parameter Original Values Values Based on 150 BSFL
Feed
Empty Bucket (g) 320 320
Feed Added (g) Wet 670.00 512.76
Dry 189.91 145.34
Bucket with Residue (g) 484.00 445.51
Feed Consumed (g) 103.14 78.93
Feed Residue (g) Wet 164.00 125.51
Dry 86.77 66.41
Dry Matter Reduction (%) 54.31 54.31
Bioconversion Rate (%) 7.32 7.32
Feed Conversion Ratio 7.41 7.41
BSFL
Initial Avg. Weight / BSFL (g)
0.00103 0.00103
Number Fed 196 150
Initial Weight (g) 0.20 0.15
Prepupal Weight (g) Wet 35.60 27.24
Dry 13.91 10.65
Fat Content (%) n/a n/a
Protein Content (%) n/a n/a
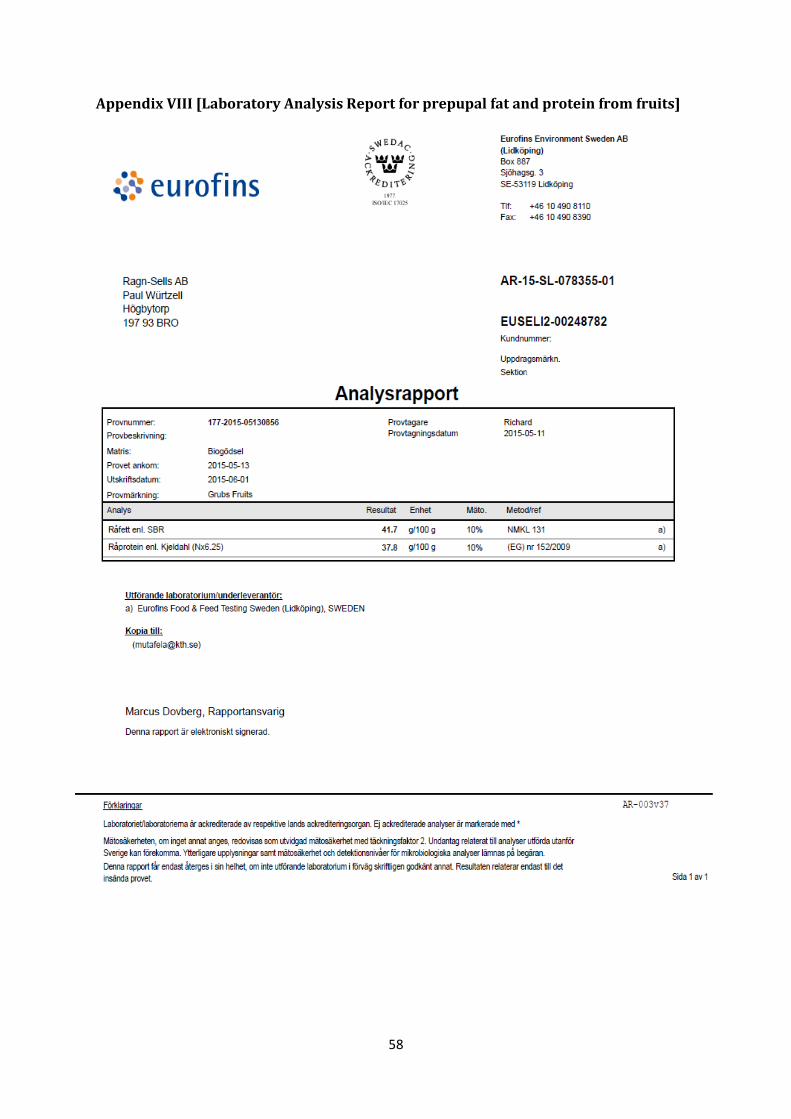
58
Appendix VIII [Laboratory Analysis Report for prepupal fat and protein from fruits]
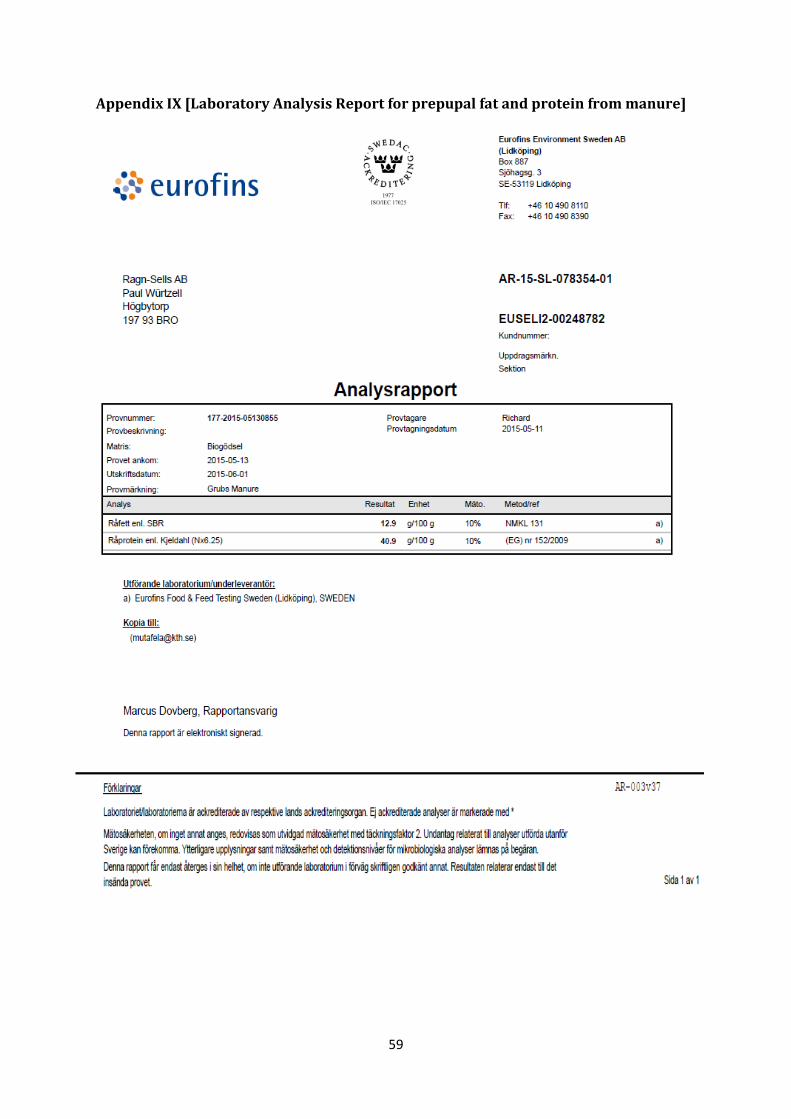
59
Appendix IX [Laboratory Analysis Report for prepupal fat and protein from manure]
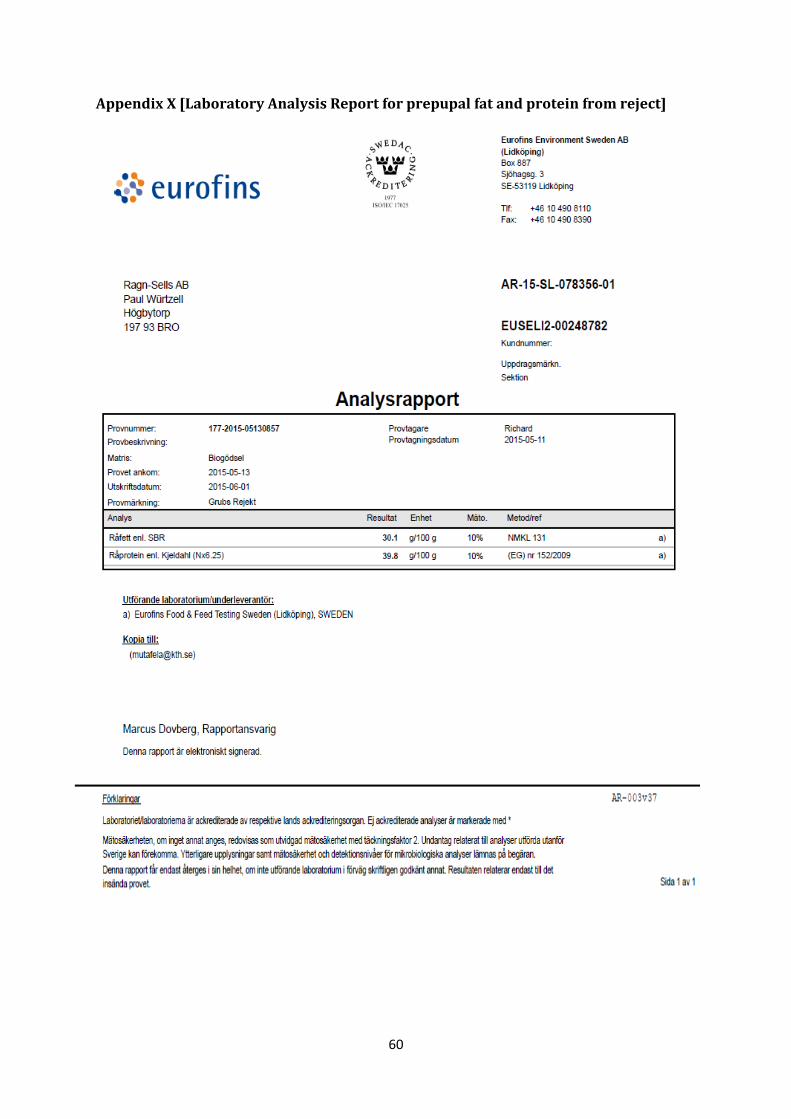
60
Appendix X [Laboratory Analysis Report for prepupal fat and protein from reject]
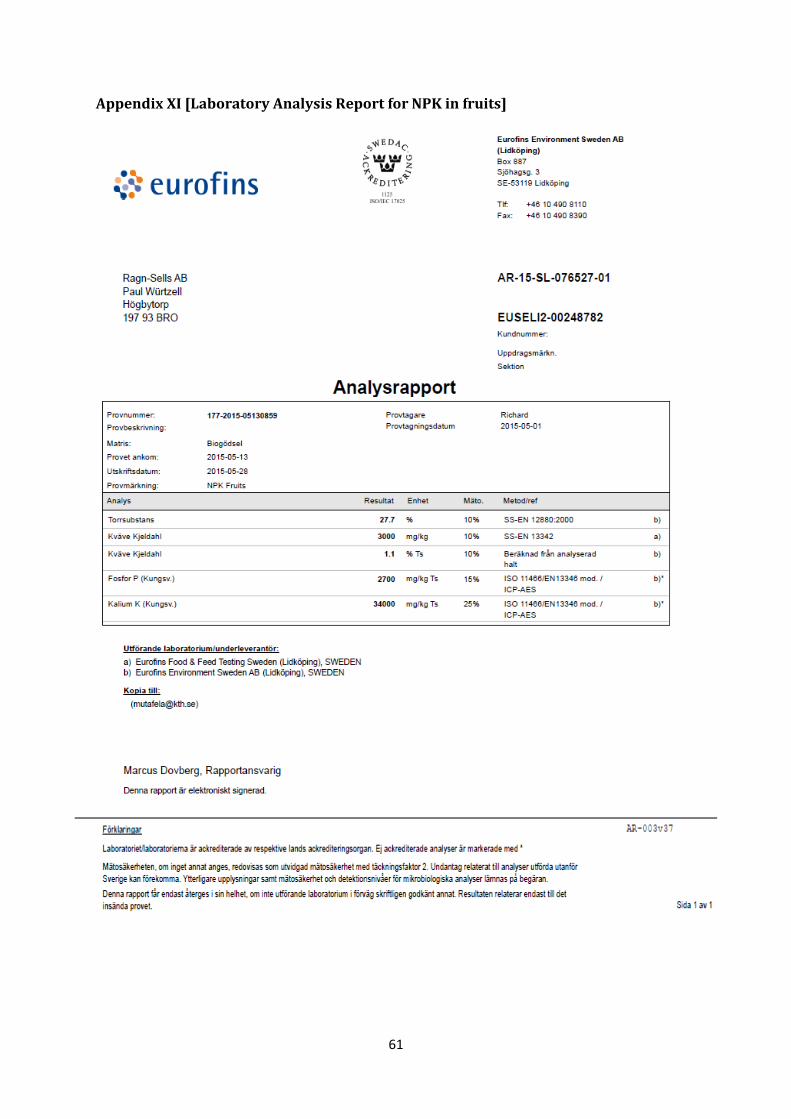
61
Appendix XI [Laboratory Analysis Report for NPK in fruits]
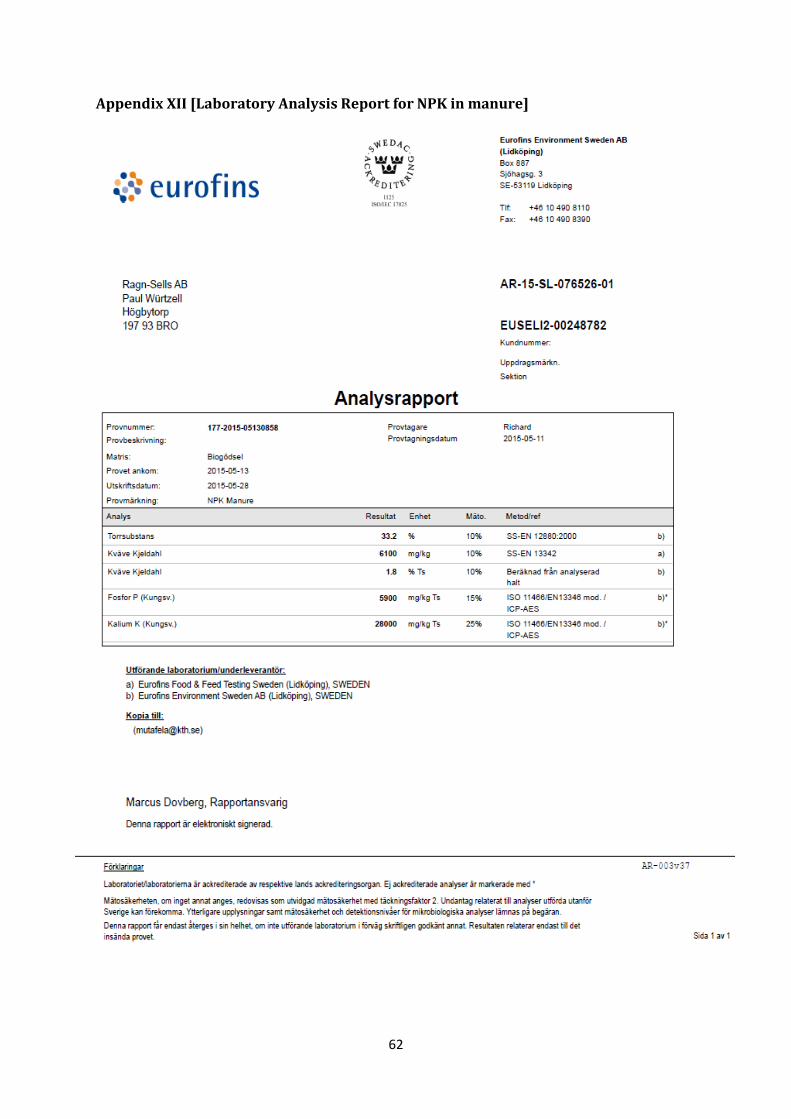
62
Appendix XII [Laboratory Analysis Report for NPK in manure]
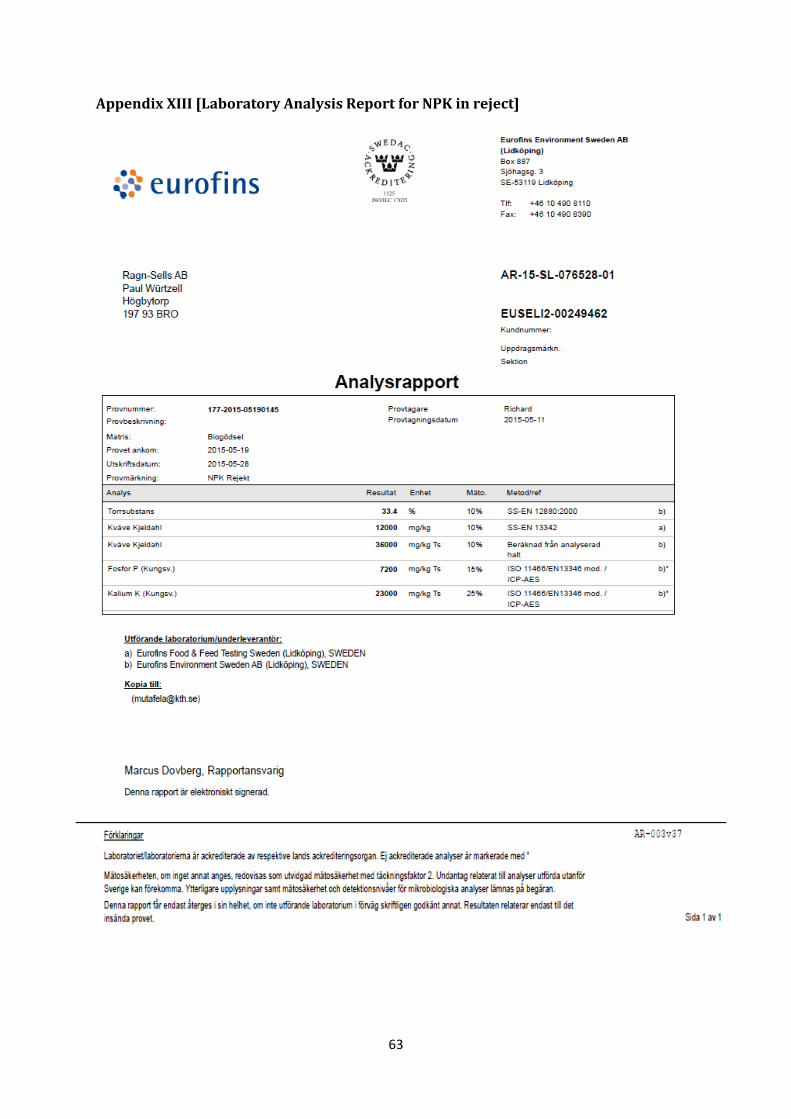
63
Appendix XIII [Laboratory Analysis Report for NPK in reject]
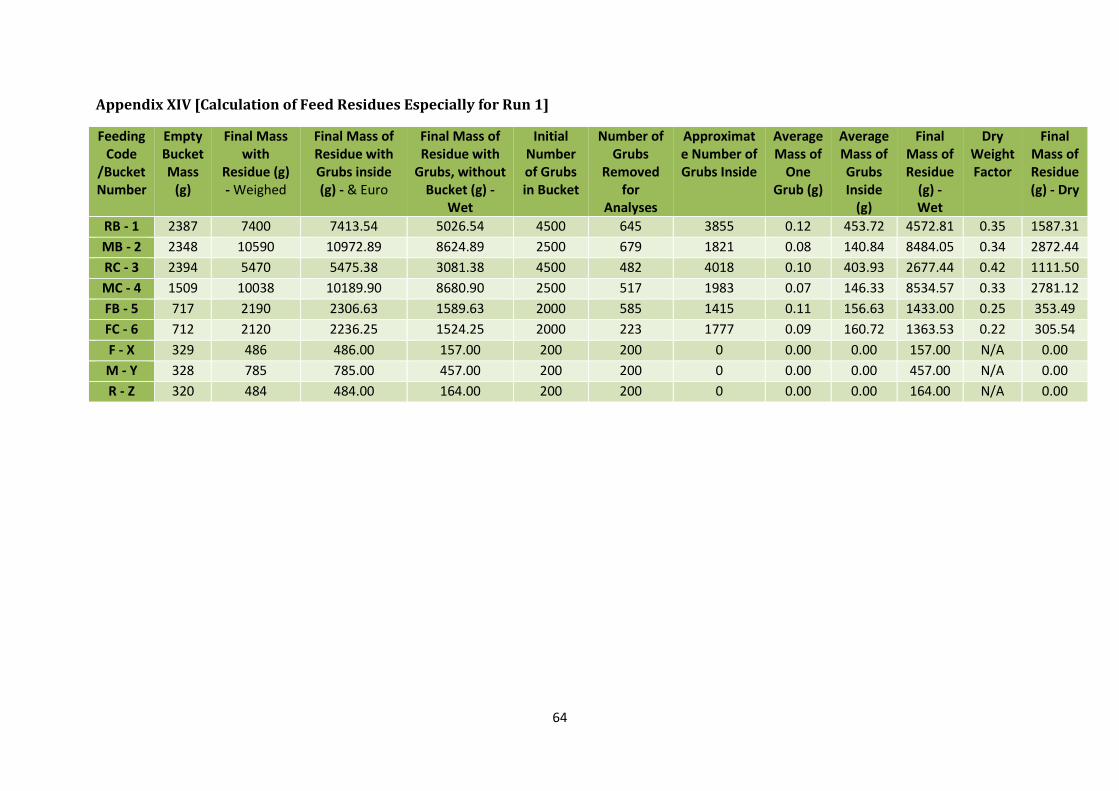
64
Appendix XIV [Calculation of Feed Residues Especially for Run 1]
Feeding Code
/Bucket Number
Empty Bucket Mass
(g)
Final Mass with
Residue (g) - Weighed
Final Mass of Residue with Grubs inside (g) - & Euro
Final Mass of Residue with
Grubs, without Bucket (g) -
Wet
Initial Number of Grubs in Bucket
Number of Grubs
Removed for
Analyses
Approximate Number of Grubs Inside
Average Mass of
One Grub (g)
Average Mass of Grubs Inside
(g)
Final Mass of Residue
(g) - Wet
Dry Weight Factor
Final Mass of Residue (g) - Dry
RB - 1 2387 7400 7413.54 5026.54 4500 645 3855 0.12 453.72 4572.81 0.35 1587.31
MB - 2 2348 10590 10972.89 8624.89 2500 679 1821 0.08 140.84 8484.05 0.34 2872.44
RC - 3 2394 5470 5475.38 3081.38 4500 482 4018 0.10 403.93 2677.44 0.42 1111.50
MC - 4 1509 10038 10189.90 8680.90 2500 517 1983 0.07 146.33 8534.57 0.33 2781.12
FB - 5 717 2190 2306.63 1589.63 2000 585 1415 0.11 156.63 1433.00 0.25 353.49
FC - 6 712 2120 2236.25 1524.25 2000 223 1777 0.09 160.72 1363.53 0.22 305.54
F - X 329 486 486.00 157.00 200 200 0 0.00 0.00 157.00 N/A 0.00
M - Y 328 785 785.00 457.00 200 200 0 0.00 0.00 457.00 N/A 0.00
R - Z 320 484 484.00 164.00 200 200 0 0.00 0.00 164.00 N/A 0.00