higher education marketing analytics - educationdynamics
TRANSCRIPT
Analytics & Higher Education
July 21, 2016
Sandesh Sadalge VP, Analytics - EducationDynamics
Contents
• Introduction
• What is Data Analytics?
• Examples & Live Demo
• Case Study
• Pitfalls & Pointers
Introduction
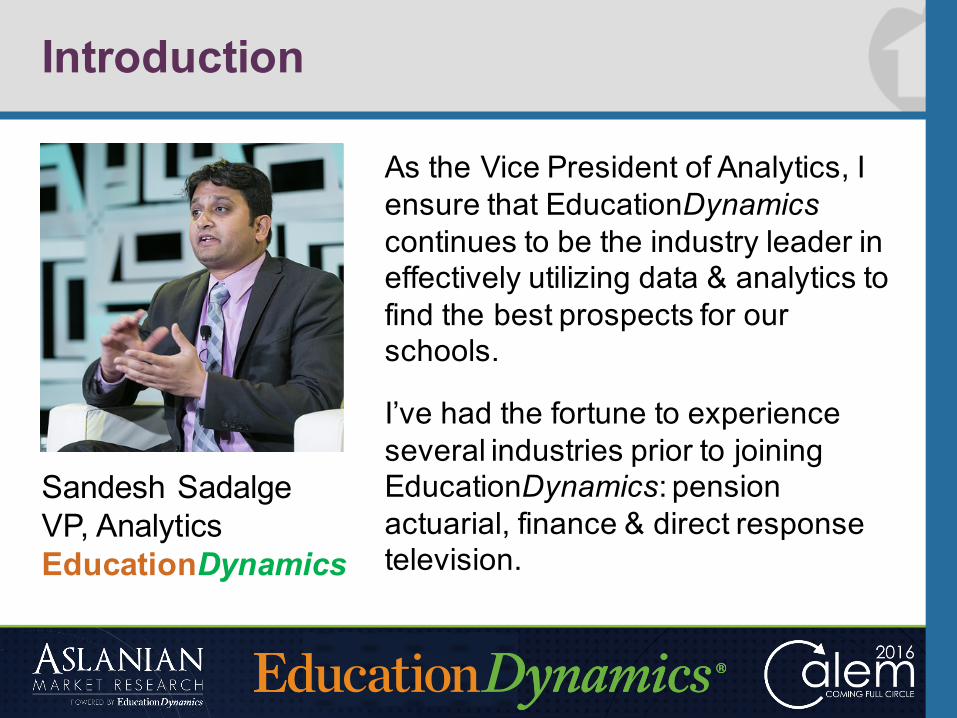
Sandesh SadalgeVP, AnalyticsEducationDynamics
As the Vice President of Analytics, I ensure that EducationDynamicscontinues to be the industry leader in effectively utilizing data & analytics to find the best prospects for our schools.
I’ve had the fortune to experience several industries prior to joining EducationDynamics: pension actuarial, finance & direct response television.
What is Data Analytics?

What is Data Analytics?At the Chief Analytics Officers Forum this year we discussed ‘What is Data Analytics’ in a very lively breakout session:
One of the better definitions offered:
Data Analytics is the practice of utilizing statistical learning methodologies with complex data systems to enhance decision making
Ø When asked if this was what our departments accomplished every day, very few of us raised our hands
What is Data Analytics?
Let me offer some views on ‘Data Analytics’, ‘Data Science’, ‘Business Intelligence’, etc…
1. Data Analytics/Science is not newManufacturing, Medicine, Sports to name a few
2. The seeming ‘novelty’ of Data Analytics is due to the now ubiquitous availability of information!
Ex: Paper applications, unrecorded phone calls were previously lost to history but are now available somewhere electronically
What is Data Analytics?
Data Analytics allows us to connect:• People• Processes• Outcomes
This gives us better understanding of inter-relationships and ultimately let us:
Iteratively Test new tactics & strategies
Challenges in using Data Analytics
What is the biggest challenge in using Data Analytics in higher education (and most other industries)?
Skills, knowledge and ability to access, connect and look at Data!
(Why it’s such a hot market!)
Challenges in using Data Analytics
An inquisitive person with a growth mindset can make huge strides with very little effort!
I hope this describes YOU!
The first step is to just try and GET the data!
You will get hooked!
Examples
Examples
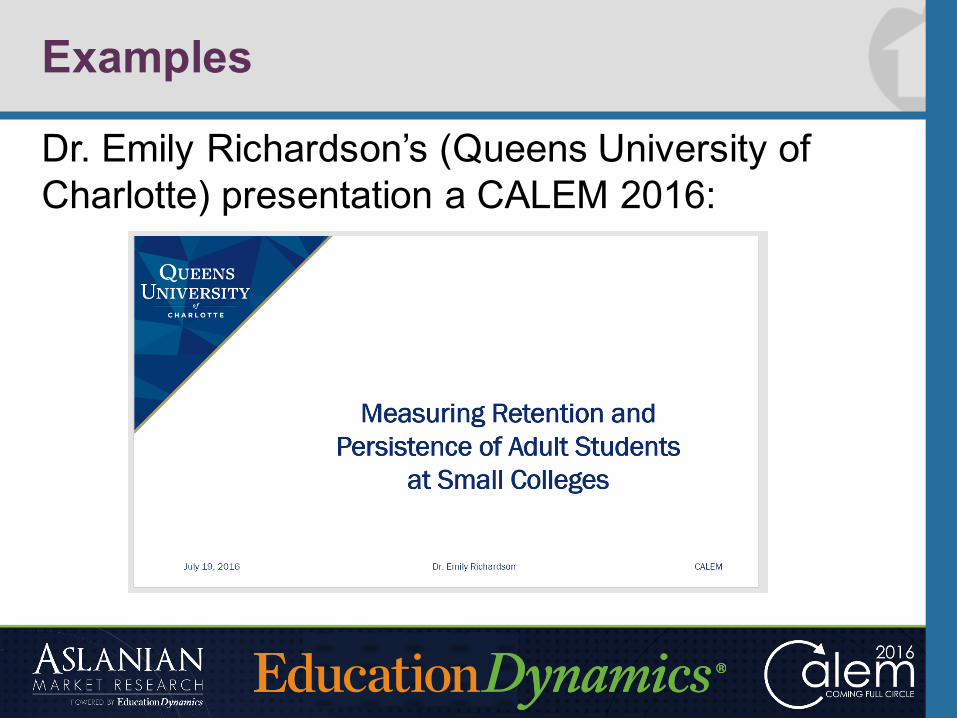
Dr. Emily Richardson’s (Queens University of Charlotte) presentation a CALEM 2016:
Examples
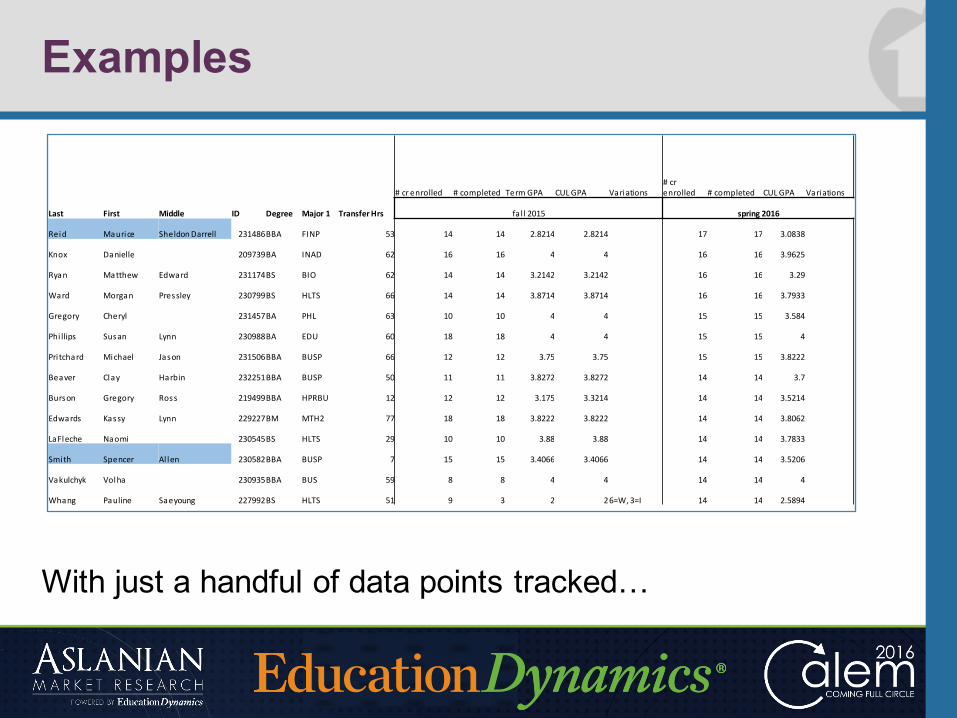
With just a handful of data points tracked…
#crenrolled #completed TermGPA CULGPA Variations#crenrolled #completed CULGPA Variations
Last First Middle ID Degree Major1 TransferHrs fa l l2015 spring2016
Reid Maurice SheldonDarrell 231486BBA FINP 53 14 14 2.8214 2.8214 17 17 3.0838
Knox Danielle 209739BA INAD 62 16 16 4 4 16 16 3.9625
Ryan Matthew Edward 231174BS BIO 62 14 14 3.2142 3.2142 16 16 3.29
Ward Morgan Pressley 230799BS HLTS 66 14 14 3.8714 3.8714 16 16 3.7933
Gregory Cheryl 231457BA PHL 63 10 10 4 4 15 15 3.584
Phi llips Susan Lynn 230988BA EDU 60 18 18 4 4 15 15 4
Pri tchard Michael Jason 231506BBA BUSP 66 12 12 3.75 3.75 15 15 3.8222
Beaver Clay Harbin 232251BBA BUSP 50 11 11 3.8272 3.8272 14 14 3.7
Burson Gregory Ross 219499BBA HPRBU 12 12 12 3.175 3.3214 14 14 3.5214
Edwards Kassy Lynn 229227BM MTH2 77 18 18 3.8222 3.8222 14 14 3.8062
LaFleche Naomi 230545BS HLTS 29 10 10 3.88 3.88 14 14 3.7833
Smith Spencer Al len 230582BBA BUSP 7 15 15 3.4066 3.4066 14 14 3.5206
Vakulchyk Volha 230935BBA BUS 59 8 8 4 4 14 14 4
Whang Pauline Saeyoung 227992BS HLTS 51 9 3 2 26=W,3=I 14 14 2.5894
Examples
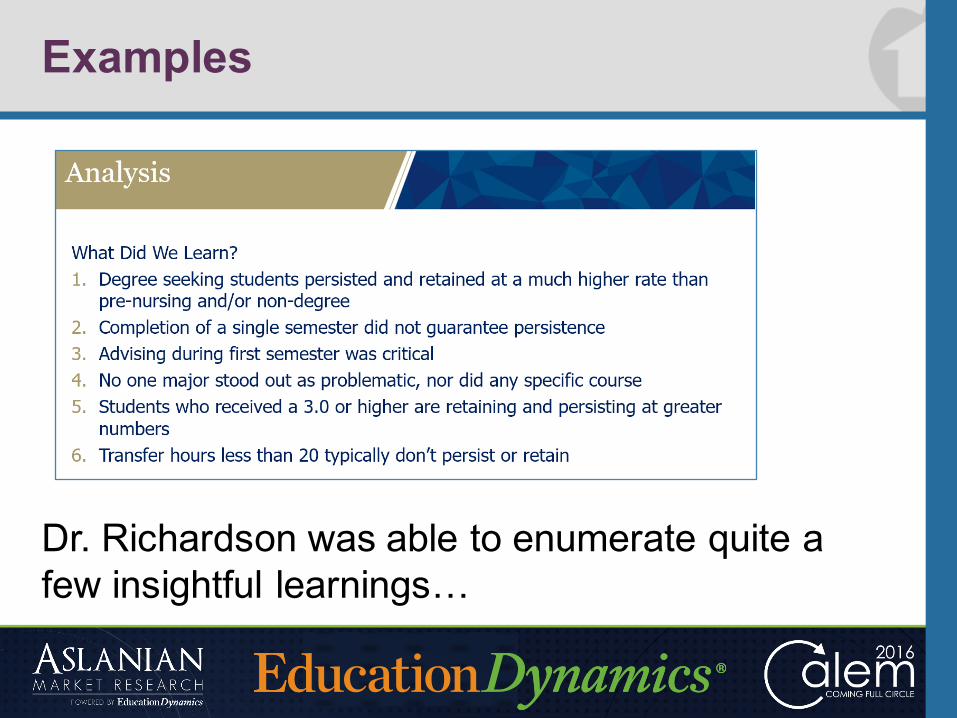
Dr. Richardson was able to enumerate quite a few insightful learnings…
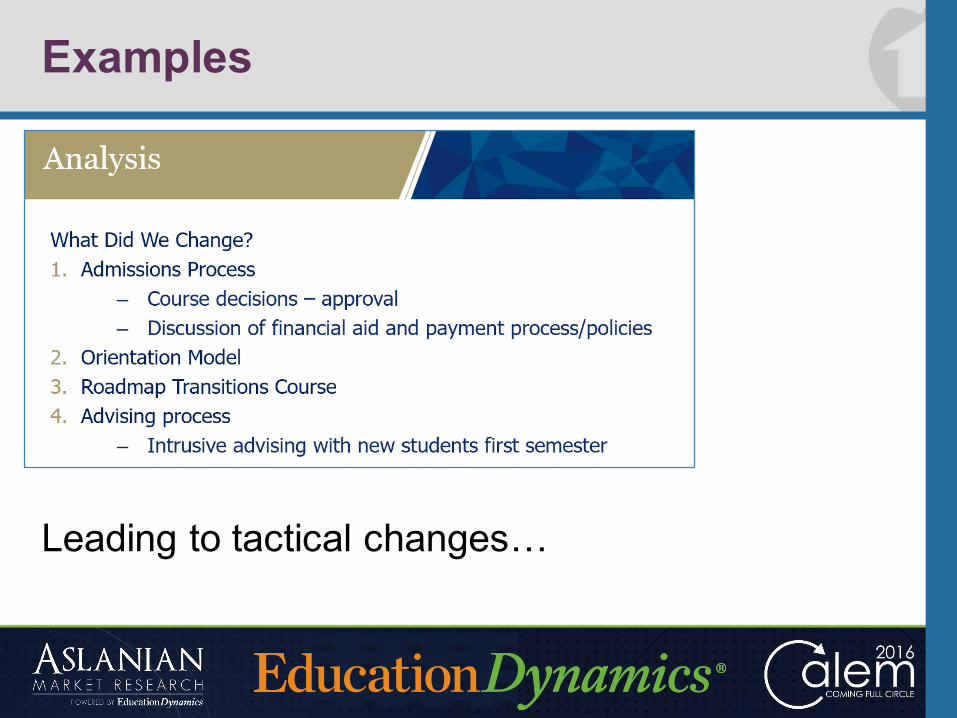
Examples
Leading to tactical changes…
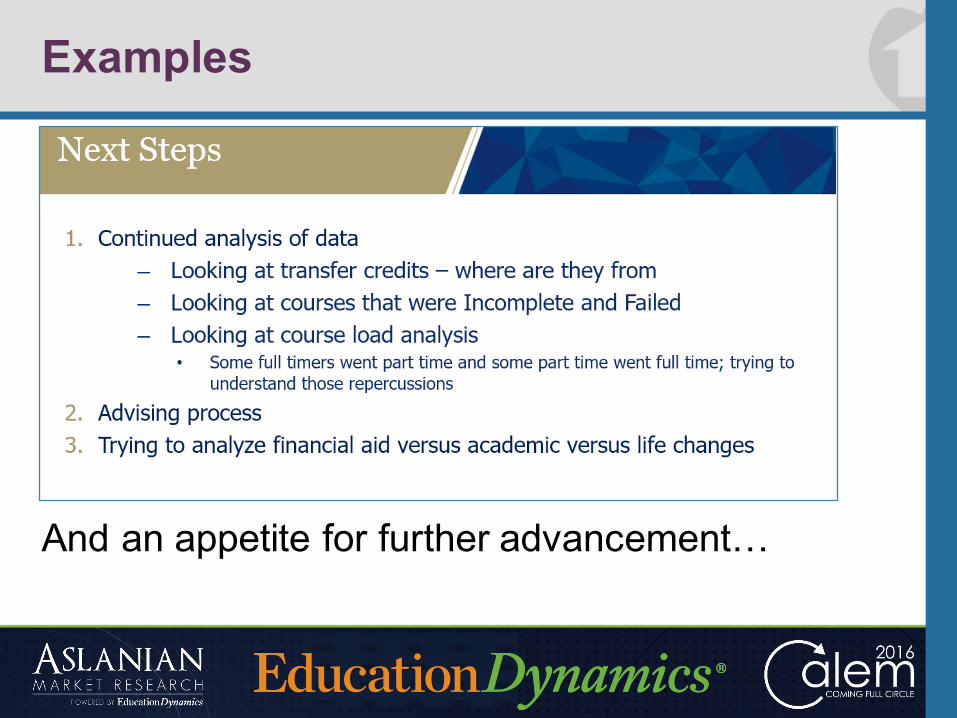
Examples
And an appetite for further advancement…
Examples
Annamarie Black’s (University of Virginia) presentation a CALEM 2016:
Examples
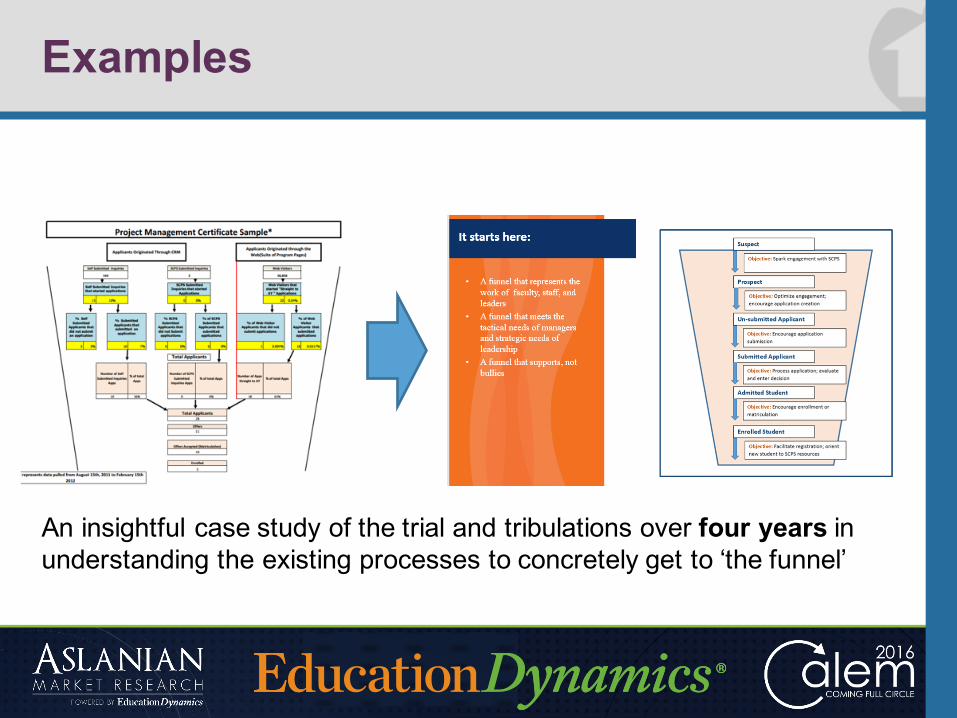
An insightful case study of the trial and tribulations over four years in understanding the existing processes to concretely get to ‘the funnel’
Live Demo
LIVE DEMO
Creating Enrollment Curves(Barring technical difficulties)
Using the #1 data analytics platform:Microsoft Excel
Case Study
Case Study
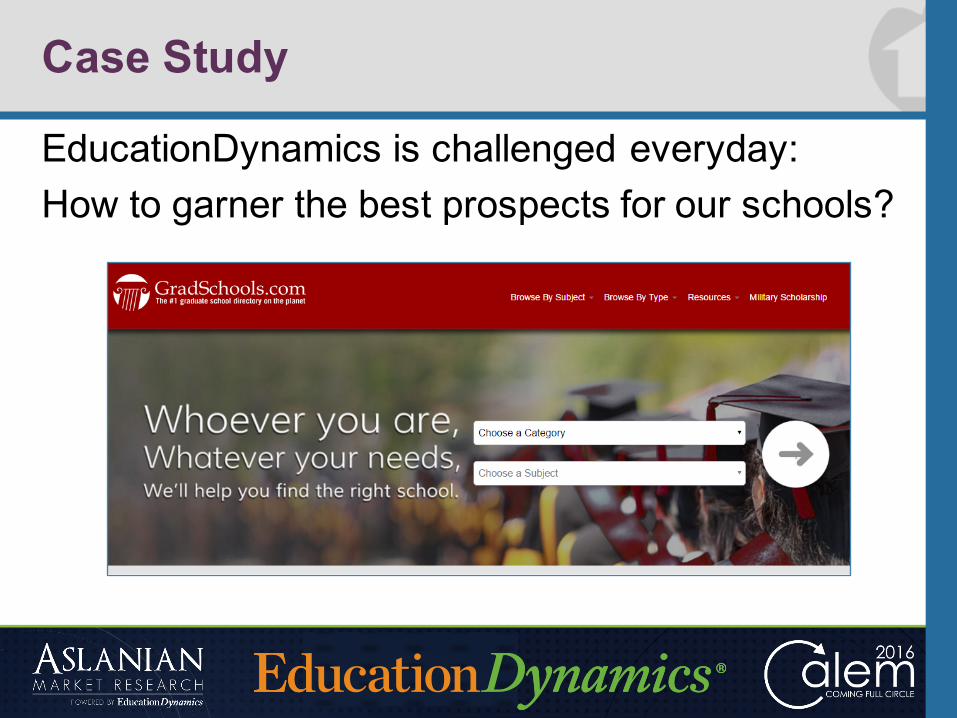
EducationDynamics is challenged everyday:How to garner the best prospects for our schools?
Case Study
We partnered with our schools to collect data on which of the prospects Applied and/or Started
~150 schools Regularly share information on which prospects engaged
This information has allowed us to iteratively test & tweak our marketing tactics to garner more interested students!
Case Study
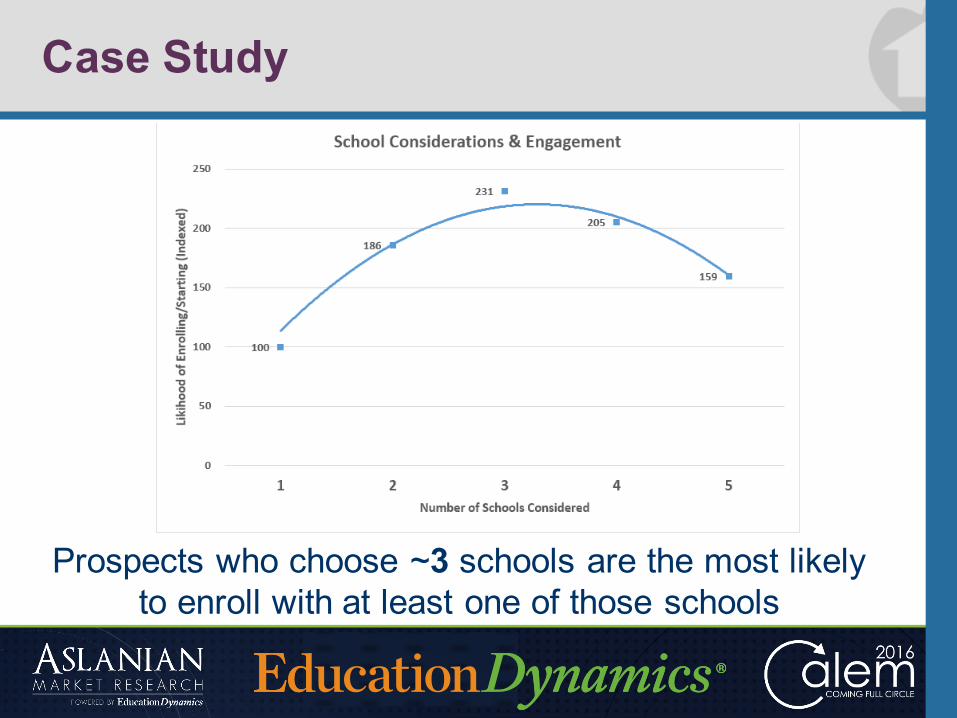
Prospects who choose ~3 schools are the most likely to enroll with at least one of those schools
Case Study
Case Study
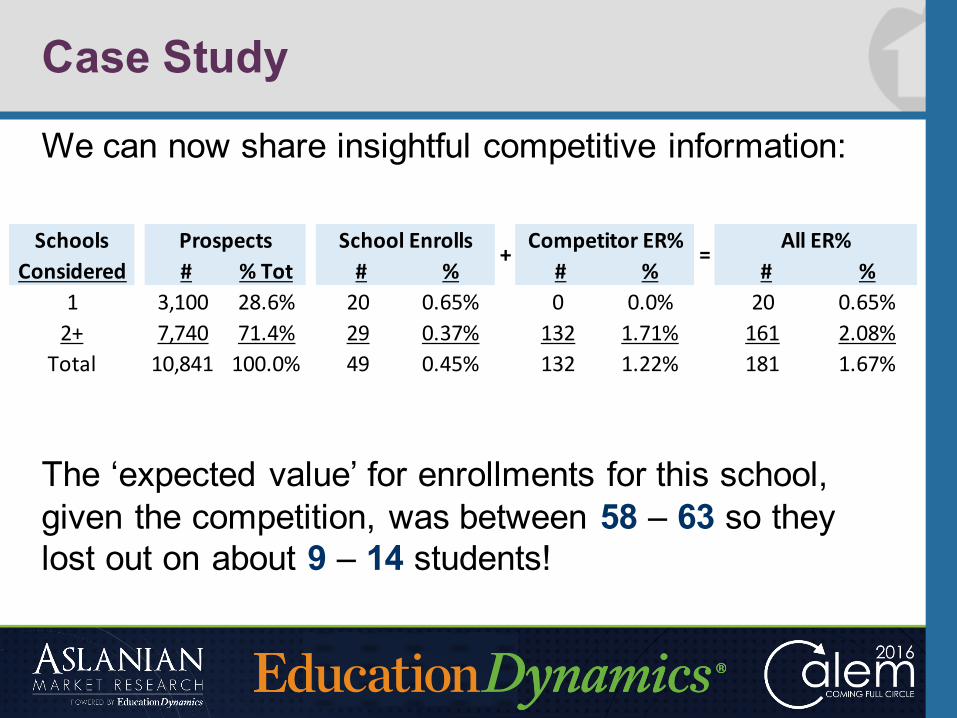
We can now share insightful competitive information:
The ‘expected value’ for enrollments for this school, given the competition, was between 58 – 63 so they lost out on about 9 – 14 students!
SchoolsConsidered # %Tot # % # % # %
1 3,100 28.6% 20 0.65% 0 0.0% 20 0.65%2+ 7,740 71.4% 29 0.37% 132 1.71% 161 2.08%
Total 10,841 100.0% 49 0.45% 132 1.22% 181 1.67%
CompetitorER% = AllER%Prospects SchoolEnrolls +
Case Study
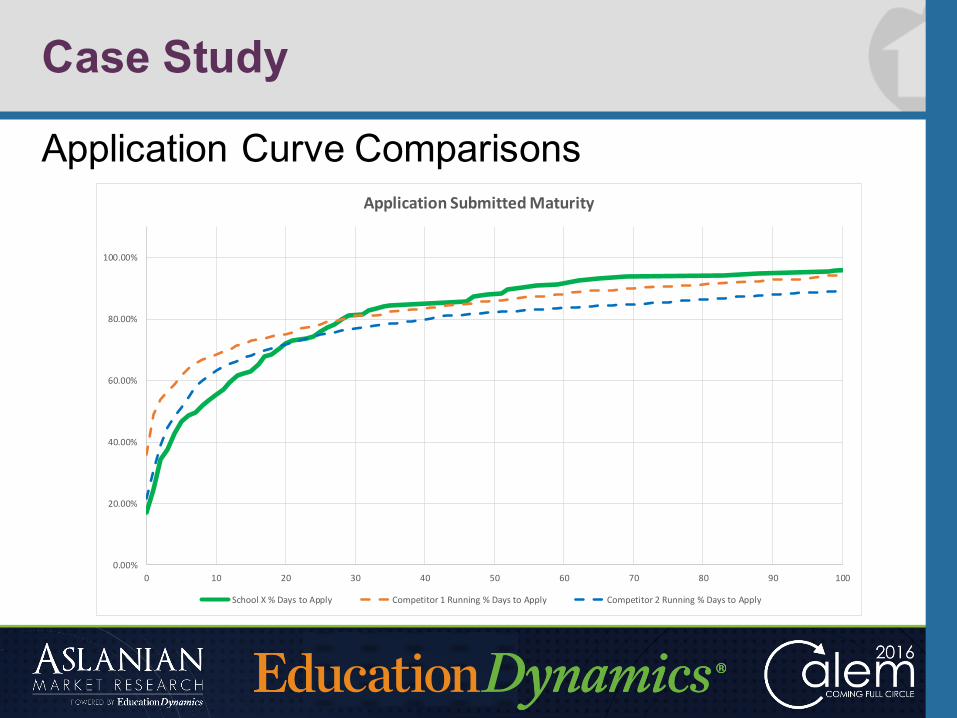
Application Curve Comparisons
0.00%
20.00%
40.00%
60.00%
80.00%
100.00%
0 10 20 30 40 50 60 70 80 90 100
ApplicationSubmittedMaturity
SchoolX%DaystoApply Competitor1Running%DaystoApply Competitor2Running%DaystoApply
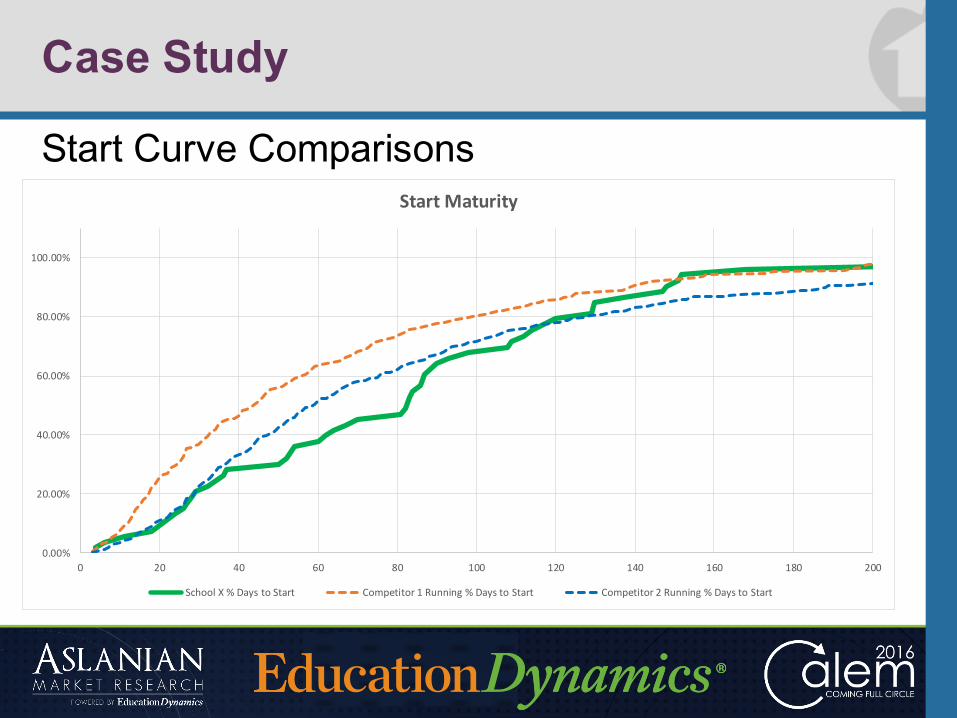
Case Study
Start Curve Comparisons
0.00%
20.00%
40.00%
60.00%
80.00%
100.00%
0 20 40 60 80 100 120 140 160 180 200
StartMaturity
SchoolX%DaystoStart Competitor1Running%DaystoStart Competitor2Running%DaystoStart
Pointers & Pitfalls
Pitfalls
• YOU are NOT the student
• Data analysis, by definition, is retrospective• Reflects how you operated in the past
• Correlation IS NOT Causation• If you suspect a link, it MUST be tested
Pitfalls
• It’s easier to knock something down with a verbal argument based on theoretical possibilities than with facts & figures
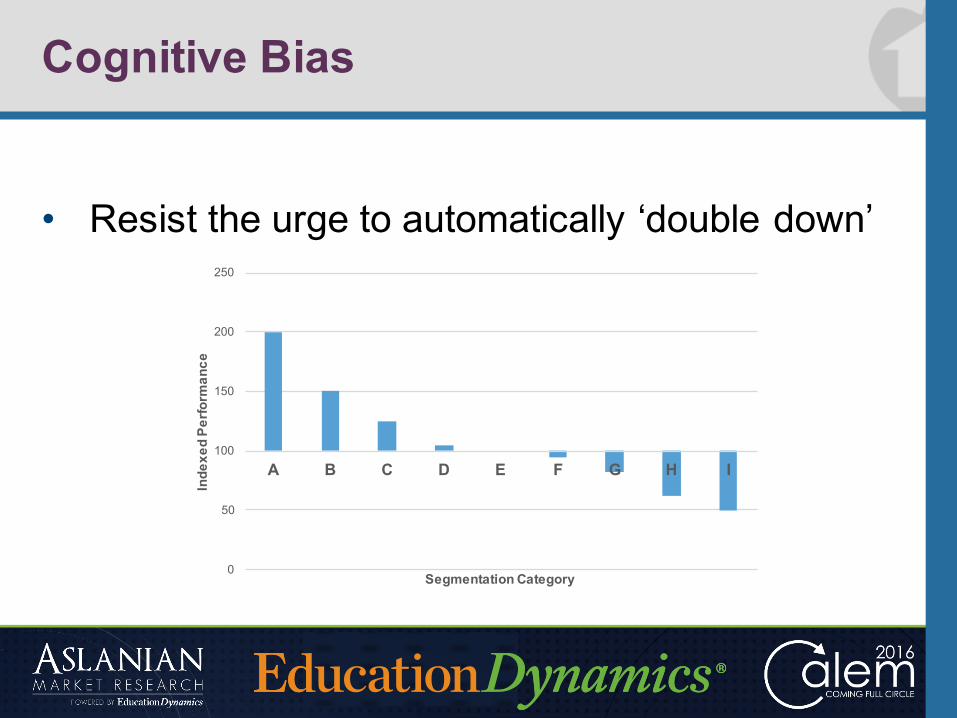
• Watch out for cognitive biases!
• The ‘lifecycle’ of a consumer in higher education makes it ripe for cognitive biases
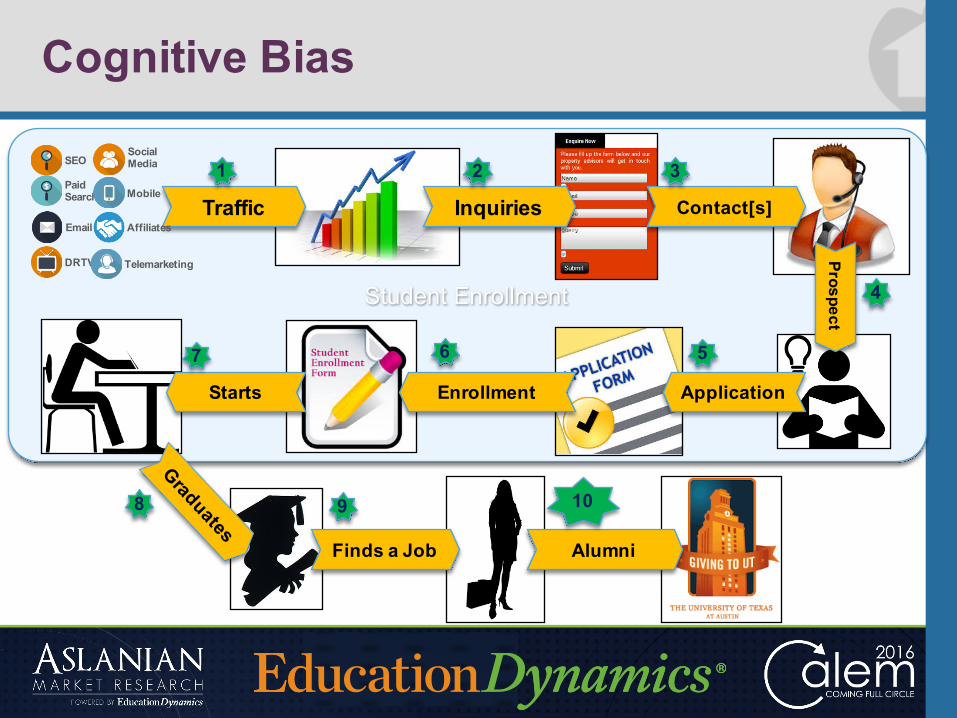
Cognitive Bias
Student Enrollment
Traffic
Prospect
ApplicationEnrollmentStarts
Finds a Job Alumni
Contact[s]Inquiries
1 2 3
4
567
8 9 10
SEO
Paid Search Mobile
Social Media
DRTV Telemarketing
Affiliates
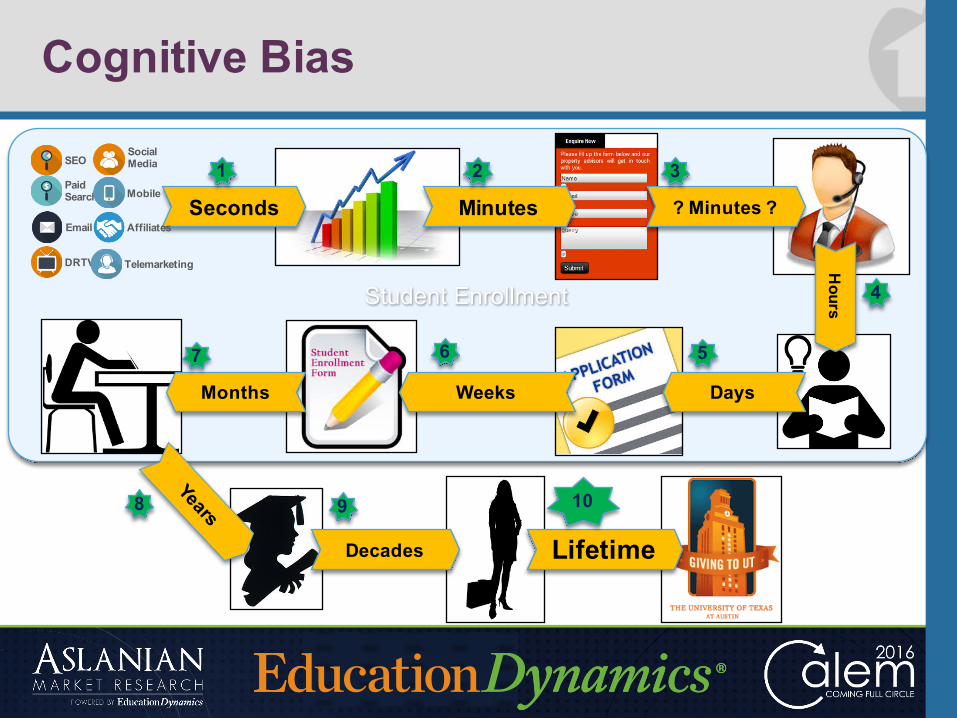
Cognitive Bias
Student Enrollment
Seconds
Hours
DaysWeeksMonths
Decades Lifetime
? Minutes ?Minutes
1 2 3
4
567
8 9 10
SEO
Paid Search Mobile
Social Media
DRTV Telemarketing
Affiliates
Cognitive Bias
• If it takes 3-4 months to fully measure outcomes, it’s easy to ascribe meaning to single examples or base decisions on memory
• Humans have been shown to make a decision first, THEN look for evidence
Cognitive Bias
Cognitive Bias
• Resist the urge to automatically ‘double down’
0
50
100
150
200
250
A B C D E F G H I
Inde
xed
Perfo
rman
ce
Segmentation Category
Pointers
Characteristics to look for in a Data Analyst:
• Intellectually Curious
• Numerically inclined (but not a ‘Quant’)
• Growth mentality
Pointers
Characteristics to look for in a Data Analyst:
• Willing to challenge their own assumptions
• Seeks information from Subject Matter Experts (helps in building coalitions & partnerships)
• Tenacious
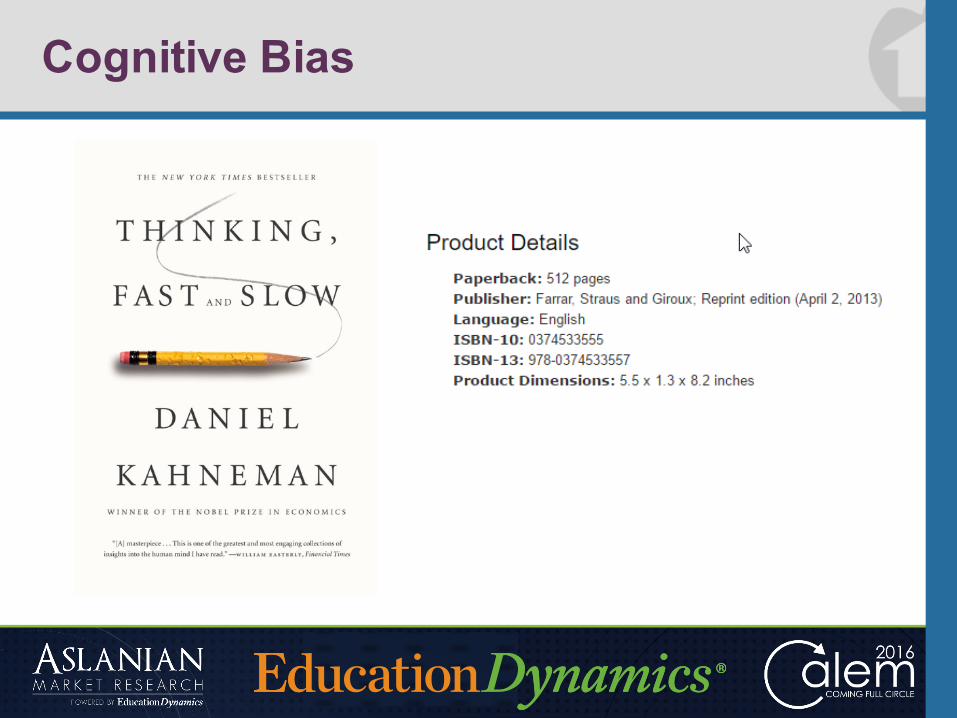
Pointers
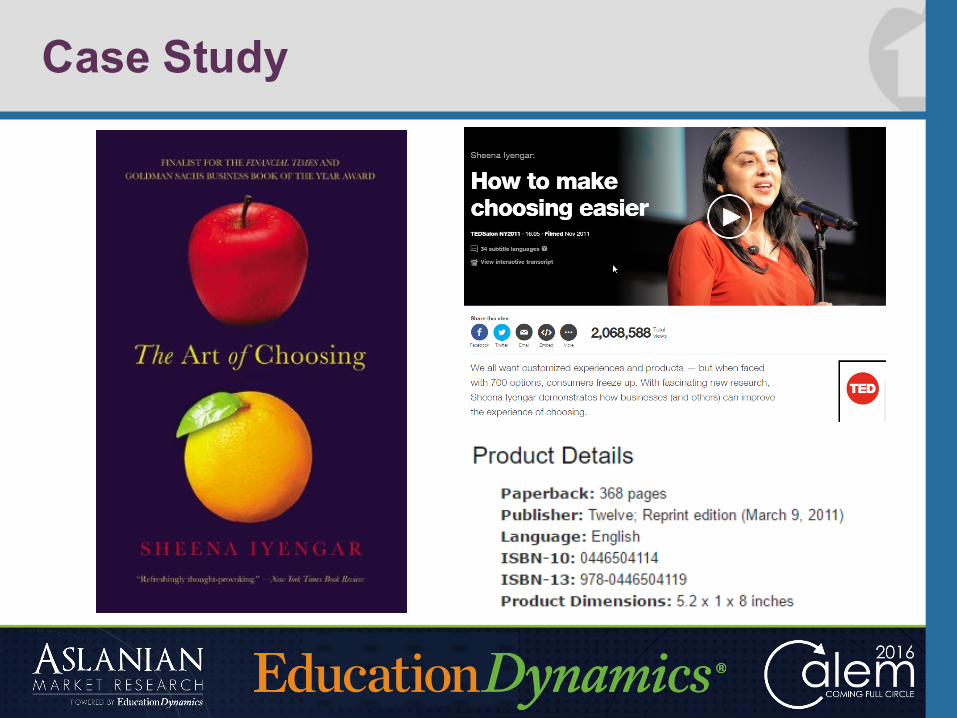
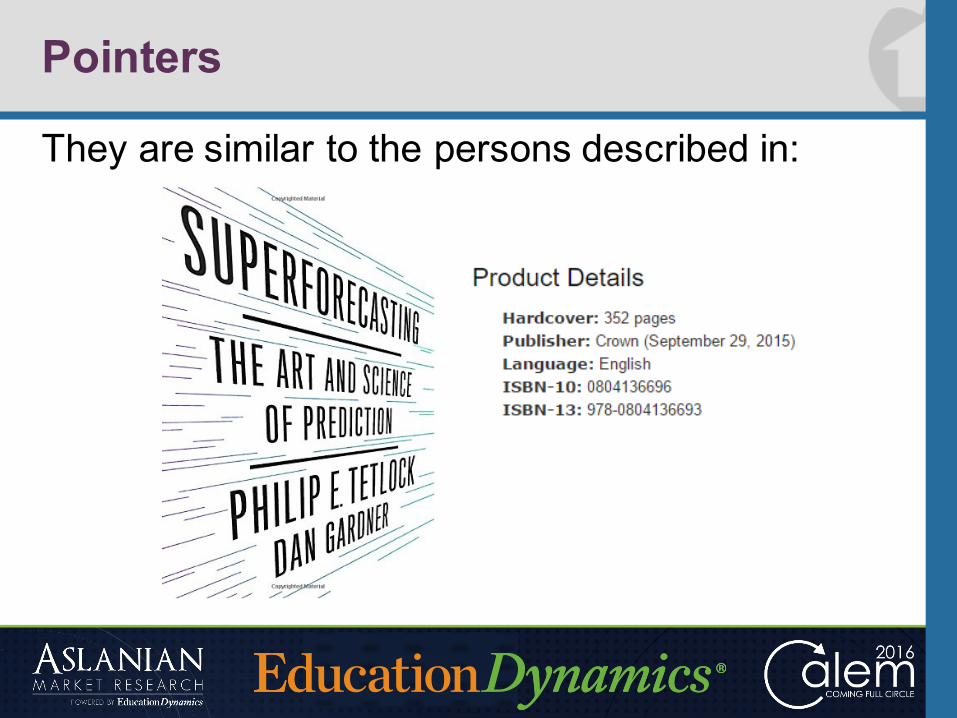
They are similar to the persons described in:
Pointers
Encouraging a Data-Driven Culture:
• The devil is in the details and some education on data systems & processing is a must
• Find a willing (or the ‘least unwilling’) partner(s) in your organization to start with
• Marketing departments are usually interested
Pointers
Encouraging a Data-Driven Culture:
• Test and iterate continuously!• What is true today may not be true tomorrow but it
may be again next week!
• Level the field by democratizing data• Allow as many voices as possible to participate
• Encourage beneficial conflicts
Pointers
Encouraging a Data-Driven Culture:
• Do not blame, instead learn from failures
• Celebrate every win, no matter how small
THANK YOU
Special Thanks To:Emily Richardson, Ed.D Queens University of CharlotteAnnemarie Black, MEd University of Virginia
Feel free to contact me:[email protected]