higher education system performance
TRANSCRIPT

Higher Education System
Performance
Institutional and System Profiles
2018/19

Higher Education System Performance
Institutional and System Profiles 2018/19
A report by the Higher Education Authority October 2021 The Higher Education Authority wishes to acknowledge the authorship of the Statistics Team in the Higher Education Authority The authors wish to acknowledge the assistance of higher education institution staff involved in submitting data to the Higher Education Authority.

1
Contents
Introduction 2
System and Institutional Profiles 2018/19 3
System Profile: All HEA funded Institutions 4
Athlone Institute of Technology 7
Cork Institute of Technology 10
Dublin City University 13
Dún Laoghaire Institute of Art, Design and Technology 16
Dundalk Institute of Technology 19
Galway-Mayo Institute of Technology 22
Institute of Technology, Carlow 25
Institute of Technology, Sligo 28
Institute of Technology, Tralee 31
Letterkenny Institute of Technology 34
Limerick Institute of Technology 37
Mary Immaculate College, Limerick 40
Maynooth University 43
National College of Art and Design 46
National University of Ireland, Galway 49
Royal College of Surgeons Ireland 52
St. Angela's College of Education, Sligo 55
Technological University Dublin 58
Trinity College Dublin 61
University College Cork 64
University College Dublin 67
University of Limerick 70
Waterford Institute of Technology 73
Appendix 1: Technical Description of Figures 76
Student Numbers 76
Disciplinary Mix 79
Participation 79
Internationalisation 81
Teaching and Learning 82
Research and Knowledge Transfer 83
Graduates in Employment 84
Staff 84
Staff gender breakdown 86
Financial Data 86
Calculation of Full-Time Equivalent (FTE) Student Numbers 87

2
INTRODUCTION
Higher Education System Performance, Institutional Profiles 2018/19 is the ninth in a series of reports from the Higher Education Authority. These profiles, developed in partnership with the Department of Further and Higher Education and the higher education institutions, have proved invaluable in supporting strategic planning at institutional and system levels. The institutional profiles play an important role in demonstrating the performance of the higher education system to the public and government. The higher education system performance framework, developed in recent years, aims to hold the higher education system accountable for performance and the delivery of national priorities; to monitor performance of the system; and to enable HEIs to identify their strategic niche and mission through the agreement of a performance compact with the Higher Education Authority. In this regard, the institutional profiles have proved a valuable part of this process, facilitating the monitoring of trends in higher education provision in terms of participation metrics, fields of study, research, knowledge transfer and the financial and human resource base underpinning the system. The HEA and the higher education institutions remain committed to the continued development and refinement of institutional profiling in Irish higher education and the 2018/19 profiles outlined in this report reflect the HEA’s commitment to enhancing the information provided in profiling by incorporating improvement developed in consultation with the higher education institutions. When comparing institutions, the metrics should be interpreted and understood in light of the mission and vision of an institution and in the context of the broader institutional profile because factors such as the disciplinary mix, the levels and modes of study and the characteristics of the student body are all important in understanding the performance of an institution. Please note the following:
• This profile reflects the of the establishment of TU Dublin in January 2019
• Equal Access Data is not available for 2018/19
• Remote enrolments are now reckoned in the calculation of Full-time equivalent student numbers and the calculation of expenditure per student.
• The metric “Senior Academic Staff who are Female” has been replaced by the metric “Staff at Most Senior Academic Grade who are Female”. More details are provided in the appendix.
Appendix 1 provides a technical description of the various data sources that are used to create the institutional and system profiles in this publication. We would like to thank the higher education institutions profiled in this report for their cooperation in providing the data presented and for the feedback on initial drafts of the 2018/19 profiles. The HEA will continue to lead the development and refinement of these profiles in partnership with the higher education institutions, the Department of Further and Higher
Education, and other relevant government departments and agencies.

3
System and Institutional Profiles 2018/19

4
STUDENT NUMBERS
STUDENT NUMBERS
73,333
Enrolments
191,493 46,217
TOP DISCIPLINES
NEW ENTRANTS
21%
19%
15%
DOCTORATES
23%
16%
14%
PARTICIPATION
8%
7%
INTERNATIONAL STUDENTS
26,280 1,743
14% 4%
Full-time Part-time
RESEARCH
€ 552.622 m 1.4
Contract Research Income
FIRST DESTINATION OF 2018 GRADUATES
75% 88%
All HEA-Funded
Institutions
Sta
tistic
al h
ighlig
hts
43,875
New Entrants Graduates
Undergraduate
Enrolments
Postgraduate
Enrolments
Arts and humanities
Business, administration and law
Health and welfare
Natural sciences, mathematics and statistics
Health and welfare
Engineering, Manufacturing & Construction
Level 8
Graduates in
Employment
Level 9/10
Graduates in
Employment
Mature Students
Entrants with a Disability
10%Entrants from Disadvantaged Socio-economic
backgrounds
Doctoral
Graduates per
10 Academic
Staff

5
No. No. %
New Entrants Year 1 (Full-time Undergraduate) 42,794 Undergraduate Graduates 51,271 70%
New Entrants Year 2+ (Full-time Undergraduate) 1,081 Postgraduate Graduates 22,062 30%
Full-time Part-time Remote Total Full-time Part-time Remote Total
Other Enrolments (IoTs only) No. 5 4,564 0 4,569 Other Enrolments (IoTs only) 0% 100% 0% 100%
QQI L5 Certificate No. 5 194 0 199 QQI L5 Certificate 3% 97% 0% 4%
QQI L6 Advanced Certificate No. 0 4,370 0 4,370 QQI L6 Advanced Certificate 0% 100% 0% 96%
of which are apprenticeships No. 0 4,387 0 4,387of which are
apprenticeships 0% 100% 0% 96%
Undergraduate No. 160,619 25,555 5,319 191,493 Undergraduate 84% 13% 3% 81%
Foundation/Access No. 352 361 0 713 Foundation/Access 49% 51% 0% 0%
Diploma No. 527 2,819 568 3,914 Diploma 13% 72% 15% 2%
Certificate No. 336 10,861 1,766 12,963 Certificate 3% 84% 14% 7%
Higher Certificate No. 3,340 2,092 355 5,787 Higher Certificate 58% 36% 6% 3%
Ordinary Degree (L7) No. 17,287 2,960 1,060 21,307 Ordinary Degree (L7) 81% 14% 5% 11%
Honours Degree (L8) No. 135,267 3,643 1,569 140,479 Honours Degree (L8) 96% 3% 1% 73%
Occasional No. 3,510 2,819 1 6,330 Occasional 55% 45% 0% 3%
Postgraduate No. 24,855 17,474 3,888 46,217 Postgraduate 54% 38% 8% 19%
Postgrad Diploma No. 803 3,408 676 4,887 Postgrad Diploma 16% 70% 14% 11%
Postgrad Higher Diploma No. 1,027 1,106 713 2,846 Postgrad Higher Diploma 36% 39% 25% 6%
Postgrad Certificate No. 75 2,084 431 2,590 Postgrad Certificate 3% 80% 17% 6%
Masters Taught (L9) No. 14,673 7,972 1,663 24,308 Masters Taught (L9) 60% 33% 7% 53%
Masters Research (L9) No. 1,105 317 1 1,423 Masters Research (L9) 78% 22% 0% 3%
Doctorate (L10) No. 7,066 1,577 0 8,643 Doctorate (L10) 82% 18% 0% 19%
Occasional No. 106 1,010 404 1,520 Occasional 7% 66% 27% 3%
Total UG and PG Enrolments No. 185,474 43,029 9,207 237,710 Total UG and PG Enrolments 78% 18% 4% 100%
Research & Taught (L9/10) FTE 28,609 Research & Taught (L9/10) 16.5%
Research (L9/10) FTE 9,119 Research (L9/10) 5.3%
Research (L10) FTE 7,855 Research (L10) 4.5%
No. % No. %
Generic programmes and qualifications 272 1% Generic programmes and qualifications 55 1%
Education 1,936 5% Education 528 6%
Arts and humanities 8,782 21% Arts and humanities 1,134 13%
Social sciences, journalism and information 2,357 6% Social sciences, journalism and information 1,008 12%
Business, administration and law 8,081 19% Business, administration and law 738 9%
Natural sciences, mathematics and statistics 4,637 11% Natural sciences, mathematics and statistics 1,955 23%
Information and Communication Technologies (ICTs) 2,570 6% Information and Communication Technologies (ICTs) 419 5%
Engineering, Manufacturing & Construction 4,838 11% Engineering, Manufacturing & Construction 1,236 14%
Agriculture, forestry, fisheries and veterinary 865 2% Agriculture, forestry, fisheries and veterinary 163 2%
Health and welfare 6,566 15% Health and welfare 1,390 16%
Services 1,890 4% Services 17 0%
Total 42,794 100% Total 8,643 100%
No. %Mature Entrants Year 1 (Full-time Undergraduate) 3,285 8%Mature Entrants Year 2+ (Full-time Undergraduate) 273
No. %
Flexible Learners (PT, Distance, E-Learning, In-Service) 52,236 22%
5,163 55%
20%41% Regional Intake (% of Full-time Enrolments) No. %
29% from the institution's county 44%
10% from the institution's county and bordering counties 72%
No. %26,280 14% Erasmus Students Incoming (excl. work placements) 5,190
EU 5,360 3%Non-EU 20,920 11% Total no. of International (FT, PT & Erasmus Incoming) Students 33,213
No. % Erasmus Students Outgoing 3,1981,743 4% Other Exchange Outgoing 525
EU 932 2%Non-EU 811 2%
All HEA-Funded Institutions - Profile 2018/19
STUDENT NUMBERSEntrants Graduates
Enrolments
% FTE Honours Bach Degree L8 and all PG
% FTE Honours Bach Degree L8 and all PG
% FTE Honours Bach Degree L8 and all PG
DISCIPLINARY MIXFirst Year Full-time Undergraduate New Entrants Doctorate (All modes)
PARTICIPATION(% of New Entrants)
Students in receipt of the Fund for Students with Disabilities (% of Full-
time UG & PG Enrolments)12,908 7%
(% of Total Enrolments incl. Flexible Learning)
Deprivation Index Scores (% of Full-time and Part-time, Undergraduate
and Postgraduate Enrolments) Springboard+ enrolments (% of National Participation) Affluent Marginally above average
Marginally Below average
Disadvantaged
INTERNATIONALISATIONInternational Students (Full-time)
(% of Full-time Enrolments)
International Students (Part-time)
(% of Part-time Enrolments)

6
Level 6 Level 7 Level 8
% % %
Generic programmes and qualifications 32% - - Indicator Indicator Score (out of 60)
Education - 28% 4% Higher Order Learning 36.5
Arts and humanities 29% 25% 15% Reflective and Integrative Learning 30.9
Social sciences, journalism and information 0% 31% 9% Quantitative Reasoning 20.2
Business, administration and law 17% 26% 9% Learning Strategies 31.0
Natural sciences, mathematics and statistics 24% 23% 10% Collaborative Learning 31.0
Information and Communication Technologies (ICTs) 28% 35% 15% Student-Faculty Interaction 14.3
Engineering, Manufacturing & Construction 24% 29% 12% Effective Teaching Practices 34.7
Agriculture, forestry, fisheries and veterinary - 10% 7% Quality of Interactions 39.3
Health and welfare 13% 19% 7% Supportive Environment 28.7
Services 25% 24% 16%
Total 22% 26% 11%
No. of Doctorate Graduates per 10 Academic Staff 1.4
No. Contract Research Income (€000) 552,622
Priority Patent Applications 131 State and Semi-State 334,994
Total Patents Granted 73 EU 102,524Invention Disclosures 431 Industry 39,840
Licence agreements (institution - private industry) 191 Other 57,811
Spin-out companies created 25 Contribution in respect of overheads 17,454
%
Level 8 Graduates in Permanent/Temporary Employment 75% Total Contract Research Income per Academic Staff €48,659
Level 8 Graduates in Further Study 19% EU Contract Research Income per Academic Staff €9,027
Level 9/10 Graduates in Permament/Temporary Employment 88%
Level 9/10 Graduates in Further Study 4%
Core Staff 19,012 100% Total Income (€000) 2,698,577 100%
Academic Staff 9,977 52% State Grants 718,431 27%
Support staff 9,034 48% Fees 1,233,040 46%
Contract Research & Specialist Staff 7,336 100% HEA Fees 319,457 12%
Academic Staff 4,418 60% Other Fees 913,583 34%
Support staff 2,918 40% Research Grants & Contracts 525,824 19%
Total Staff 26,348 100% Other Income 221,283 8%
Total Academic 14,395 55% Total Expenditure (€000) 2,671,765 100%
Total Support 11,953 45% Core - Pay 1,588,594 59%
Core - Non-Pay 554,591 21%
Non-Academic/Academic All Staff Ratio 0.8 Research Grants & Contracts - Pay 316,924 12%
Student FTE/Academic Staff Ratio 19 Research Grants & Contracts - Non-Pay 211,656 8%
Staff Age Profile (Proportion of Staff aged…) %20-39 28% Total Expenditure per Student (SRS)
111,085
40-54 49% Exchequer/Non-Exchequer Fees Ratio 0.3
55 and above 22%
Proportion of Academic Staff who are female 45% Pay/Non-Pay Expenditure Ratio (incl. Research) 2.5
Proportion of Staff at Most Senior Academic Grade who are Female 28% Pay/Non-Pay Expenditure Ratio (excl. Research) 2.9
Staff Qualifications (Proportion of…) %
Full-time Permanent Academic Staff with Masters or higher qual. 94%Full-time Permanent Academic Staff with Doctorate qualification 63%
All Permanent Academic Staff with Masters or higher qualification 96%All Permanent Academic Staff with Doctorate qualification 64%
All HEA-Funded Institutions - Profile 2018/19 - continued
TEACHING AND LEARNING
Non-Progression Rate from 1st to 2nd Year Engagement Indicators (Irish Survey of Student Engagement 2019)
RESEARCH, KNOWLEDGE TRANSFER AND GRADUATE OUTCOMES
2019
Graduate Outomes (2019 Graduates)
STAFF FINANCIAL DATA
1 Total expenditure per FTE student excluding research and depreciation with pension adjustments, based on
unadjusted SRS numbers.

7
STUDENT NUMBERS
STUDENT NUMBERS
1,932
Enrolments
4,701 511
TOP DISCIPLINES
NEW ENTRANTS
32%
13%
13%
DOCTORATES
38%
34%
28%
PARTICIPATION
16%
6%
INTERNATIONAL STUDENTS
539 29
14% 3%
Full-time Part-time
RESEARCH
€ 6.17 m 0.2
Contract Research Income
FIRST DESTINATION OF 2018 GRADUATES
79% 85%
Athlone Institute of
Technology
Sta
tistic
al h
ighlig
hts
1,120
New Entrants Graduates
Undergraduate
Enrolments
Postgraduate
Enrolments
Health and welfare
Services
Business, administration and law
Engineering, Manufacturing & Construction
Information and Communication Technologies (ICTs)
Natural sciences, mathematics and statistics
Level 8
Graduates in
Employment
Level 9/10
Graduates in
Employment
Mature Students
Entrants with a Disability
14%Entrants from Disadvantaged Socio-economic
backgrounds
Doctoral
Graduates per
10 Academic
Staff

8
No. No. %
New Entrants Year 1 (Full-time Undergraduate) 979 Undergraduate Graduates 1,739 90%
New Entrants Year 2+ (Full-time Undergraduate) 141 Postgraduate Graduates 193 10%
Full-time Part-time Remote Total Full-time Part-time Remote Total
Other Enrolments (IoTs only) No. 0 275 0 275 Other Enrolments (IoTs only) 0% 100% 0% 100%
QQI L5 Certificate No. 0 0 0 0 QQI L5 Certificate 0% 0% 0% 0%
QQI L6 Advanced Certificate No. 0 275 0 275 QQI L6 Advanced Certificate 0% 100% 0% 100%
of which are apprenticeships No. 0 263 0 263of which are
apprenticeships 0% 100% 0% 96%
Undergraduate No. 3,504 985 212 4,701 Undergraduate 75% 21% 5% 90%
Foundation/Access No. 21 0 0 21 Foundation/Access 100% 0% 0% 0%
Diploma No. 0 13 0 13 Diploma 0% 100% 0% 0%
Certificate No. 0 315 147 462 Certificate 0% 68% 32% 10%
Higher Certificate No. 449 132 8 589 Higher Certificate 76% 22% 1% 13%
Ordinary Degree (L7) No. 1,109 268 34 1,411 Ordinary Degree (L7) 79% 19% 2% 30%
Honours Degree (L8) No. 1,925 139 23 2,087 Honours Degree (L8) 92% 7% 1% 44%
Occasional No. 0 118 0 118 Occasional 0% 100% 0% 3%
Postgraduate No. 214 130 167 511 Postgraduate 42% 25% 33% 10%
Postgrad Diploma No. 0 0 32 32 Postgrad Diploma 0% 0% 100% 6%
Postgrad Higher Diploma No. 31 53 0 84 Postgrad Higher Diploma 37% 63% 0% 16%
Postgrad Certificate No. 0 0 24 24 Postgrad Certificate 0% 0% 100% 5%
Masters Taught (L9) No. 106 68 111 285 Masters Taught (L9) 37% 24% 39% 56%
Masters Research (L9) No. 48 6 0 54 Masters Research (L9) 89% 11% 0% 11%
Doctorate (L10) No. 29 3 0 32 Doctorate (L10) 91% 9% 0% 6%
Occasional No. 0 0 0 0 Occasional 0% 0% 0% 0%
Total UG and PG Enrolments No. 3,718 1,115 379 5,212 Total UG and PG Enrolments 71% 21% 7% 100%
Research & Taught (L9/10) FTE 277 Research & Taught (L9/10) 11.7%
Research (L9/10) FTE 82 Research (L9/10) 3.4%
Research (L10) FTE 31 Research (L10) 1.3%
No. % No. %
Generic programmes and qualifications 21 2% Generic programmes and qualifications 0 0%
Education 0 0% Education 0 0%
Arts and humanities 54 6% Arts and humanities 0 0%
Social sciences, journalism and information 22 2% Social sciences, journalism and information 0 0%
Business, administration and law 125 13% Business, administration and law 0 0%
Natural sciences, mathematics and statistics 98 10% Natural sciences, mathematics and statistics 9 28%
Information and Communication Technologies (ICTs) 70 7% Information and Communication Technologies (ICTs) 11 34%
Engineering, Manufacturing & Construction 103 11% Engineering, Manufacturing & Construction 12 38%
Agriculture, forestry, fisheries and veterinary 41 4% Agriculture, forestry, fisheries and veterinary 0 0%
Health and welfare 315 32% Health and welfare 0 0%
Services 130 13% Services 0 0%
Total 979 100% Total 32 100%
No. %Mature Entrants Year 1 (Full-time Undergraduate) 161 16%Mature Entrants Year 2+ (Full-time Undergraduate) 14
No. %
Flexible Learners (PT, Distance, E-Learning, In-Service) 1,494 29%
453 5%
5%38% Regional Intake (% of Full-time Enrolments) No. %
44% from the institution's county 22%
14% from the institution's county and bordering counties 74%
No. %539 14% Erasmus Students Incoming (excl. work placements) 0
EU 194 5%Non-EU 345 9% Total no. of International (FT, PT & Erasmus Incoming) Students 568
No. % Erasmus Students Outgoing 029 3% Other Exchange Outgoing 0
EU 5 0%Non-EU 24 2%
Athlone Institute of Technology - Profile 2018/19
STUDENT NUMBERSEntrants Graduates
Enrolments
% FTE Honours Bach Degree L8 and all PG
% FTE Honours Bach Degree L8 and all PG
% FTE Honours Bach Degree L8 and all PG
DISCIPLINARY MIXFirst Year Full-time Undergraduate New Entrants Doctorate (All modes)
PARTICIPATION(% of New Entrants)
Students in receipt of the Fund for Students with Disabilities (% of Full-
time UG & PG Enrolments)238 6%
(% of Total Enrolments incl. Flexible Learning)
Deprivation Index Scores (% of Full-time and Part-time, Undergraduate
and Postgraduate Enrolments) Springboard+ enrolments (% of National Participation) Affluent Marginally above average
Marginally Below average
Disadvantaged
INTERNATIONALISATIONInternational Students (Full-time)
(% of Full-time Enrolments)
International Students (Part-time)
(% of Part-time Enrolments)

9
Level 6 Level 7 Level 8
% % %
Generic programmes and qualifications - - - Indicator Indicator Score (out of 60)
Education - - - Higher Order Learning 36.9
Arts and humanities 37% 31% 19% Reflective and Integrative Learning 30.6
Social sciences, journalism and information - - 0% Quantitative Reasoning 21.9
Business, administration and law 16% 15% 7% Learning Strategies 31.9
Natural sciences, mathematics and statistics 17% 22% 8% Collaborative Learning 34.7
Information and Communication Technologies (ICTs) - 32% 32% Student-Faculty Interaction 17.4
Engineering, Manufacturing & Construction 41% 16% 14% Effective Teaching Practices 37.6
Agriculture, forestry, fisheries and veterinary - 4% - Quality of Interactions 43.5
Health and welfare 9% 11% 8% Supportive Environment 31.0
Services 22% 19% 14%
Total 22% 16% 11%
No. of Doctorate Graduates per 10 Academic Staff 0.2
No. Contract Research Income (€000) 6,170
Priority Patent Applications 0 State and Semi-State 5,017
Total Patents Granted 0 EU 236Invention Disclosures 6 Industry 858
Licence agreements (institution - private industry) 3 Other 59
Spin-out companies created 0 Contribution in respect of overheads 0
%
Level 8 Graduates in Permanent/Temporary Employment 79% Total Contract Research Income per Academic Staff €21,206
Level 8 Graduates in Further Study 14% EU Contract Research Income per Academic Staff €811
Level 9/10 Graduates in Permament/Temporary Employment 85%
Level 9/10 Graduates in Further Study 7%
Core Staff 462 100% Total Income (€000) 51,250 100%
Academic Staff 269 58% State Grants 20,433 40%
Support staff 193 42% Fees 18,779 37%
Contract Research & Specialist Staff 94 100% HEA Fees 2,511 5%
Academic Staff 22 23% Other Fees 16,268 32%
Support staff 72 77% Research Grants & Contracts 5,710 11%
Total Staff 556 100% Other Income 6,328 12%
Total Academic 291 52% Total Expenditure (€000) 49,923 100%
Total Support 265 48% Core - Pay 35,335 71%
Core - Non-Pay 9,253 19%
Non-Academic/Academic All Staff Ratio 0.9 Research Grants & Contracts - Pay 3,505 7%
Student FTE/Academic Staff Ratio 16 Research Grants & Contracts - Non-Pay 1,830 4%
Staff Age Profile (Proportion of Staff aged…) %20-39 26% Total Expenditure per Student (SRS)
19,688
40-54 52% Exchequer/Non-Exchequer Fees Ratio 0.2
55 and above 21%
Proportion of Academic Staff who are female 47% Pay/Non-Pay Expenditure Ratio (incl. Research) 3.5
Proportion of Staff at Most Senior Academic Grade who are Female 0% Pay/Non-Pay Expenditure Ratio (excl. Research) 3.8
Staff Qualifications (Proportion of…) %
Full-time Permanent Academic Staff with Masters or higher qual. 86%Full-time Permanent Academic Staff with Doctorate qualification 33%
All Permanent Academic Staff with Masters or higher qualification 84%All Permanent Academic Staff with Doctorate qualification 31%
Athlone Institute of Technology - Profile 2018/19 - continued
TEACHING AND LEARNING
Non-Progression Rate from 1st to 2nd Year Engagement Indicators (Irish Survey of Student Engagement 2019)
RESEARCH, KNOWLEDGE TRANSFER AND GRADUATE OUTCOMES
2019
Graduate Outomes (2019 Graduates)
STAFF FINANCIAL DATA
1 Total expenditure per FTE student excluding research and depreciation with pension adjustments, based on
unadjusted SRS numbers.
0
50
100
150
200
250
300
350
400
Flexible Learners(as % of all Enrolment)
Participants in Labour Market Activation(Springboard)
Level 6/7 Enrolment(as % of all Enrolment)
FT Mature Entrants(as % of all FT New Entrants)
FT New Entrants from DisadvantagedBackgrounds
FTE Research Enrolment (as % of FTELevel 8 and Postgraduate Enrolment)
Doctorate Graduates per 10 AcademicStaff
Total Contract Research Income perAcademic Staff
EU Contract Research Income perAcademic Staff
Graduates in Employment (Level 8)
Progression Rate Level 81st to 2nd Year
Non-Academic/Academic Staff ratio(Core staff)
Student FTE/Academic Staff ratio(FTE students/Core Academic staff)
Pay/Non-Pay ratio (excl. Research)
Exchequer/Non-Exchequer Fees ratio
Total Expenditure per FTE Student, SRS(excl. Depreciation & Research)
Maximum HEA AIT Average All HEA

10
STUDENT NUMBERS
STUDENT NUMBERS
3,425
Enrolments
10,312 1,005
TOP DISCIPLINES
NEW ENTRANTS
27%
26%
11%
DOCTORATES
42%
21%
15%
PARTICIPATION
2%
8%
INTERNATIONAL STUDENTS
261 41
3% 2%
Full-time Part-time
RESEARCH
€ 16.506 m 0.3
Contract Research Income
FIRST DESTINATION OF 2018 GRADUATES
82% 87%
Cork Institute of
Technology
Sta
tistic
al h
ighlig
hts
1,768
New Entrants Graduates
Undergraduate
Enrolments
Postgraduate
Enrolments
Business, administration and law
Engineering, Manufacturing & Construction
Natural sciences, mathematics and statistics
Generic programmes and qualifications
Engineering, Manufacturing & Construction
Natural sciences, mathematics and statistics
Level 8
Graduates in
Employment
Level 9/10
Graduates in
Employment
Mature Students
Entrants with a Disability
9%Entrants from Disadvantaged Socio-economic
backgrounds
Doctoral
Graduates per
10 Academic
Staff

11
No. No. %
New Entrants Year 1 (Full-time Undergraduate) 1,741 Undergraduate Graduates 3,044 89%
New Entrants Year 2+ (Full-time Undergraduate) 27 Postgraduate Graduates 381 11%
Full-time Part-time Remote Total Full-time Part-time Remote Total
Other Enrolments (IoTs only) No. 0 960 0 960 Other Enrolments (IoTs only) 0% 100% 0% 100%
QQI L5 Certificate No. 0 24 0 24 QQI L5 Certificate 0% 100% 0% 3%
QQI L6 Advanced Certificate No. 0 936 0 936 QQI L6 Advanced Certificate 0% 100% 0% 98%
of which are apprenticeships No. 0 858 0 858of which are
apprenticeships 0% 100% 0% 89%
Undergraduate No. 7,931 2,317 64 10,312 Undergraduate 77% 22% 1% 91%
Foundation/Access No. 0 0 0 0 Foundation/Access 0% 0% 0% 0%
Diploma No. 27 1 0 28 Diploma 96% 4% 0% 0%
Certificate No. 7 1,164 39 1,210 Certificate 1% 96% 3% 12%
Higher Certificate No. 88 255 0 343 Higher Certificate 26% 74% 0% 3%
Ordinary Degree (L7) No. 2,959 346 0 3,305 Ordinary Degree (L7) 90% 10% 0% 32%
Honours Degree (L8) No. 4,850 276 25 5,151 Honours Degree (L8) 94% 5% 0% 50%
Occasional No. 0 275 0 275 Occasional 0% 100% 0% 3%
Postgraduate No. 395 411 199 1,005 Postgraduate 39% 41% 20% 9%
Postgrad Diploma No. 1 4 6 11 Postgrad Diploma 9% 36% 55% 1%
Postgrad Higher Diploma No. 11 42 28 81 Postgrad Higher Diploma 14% 52% 35% 8%
Postgrad Certificate No. 0 40 20 60 Postgrad Certificate 0% 67% 33% 6%
Masters Taught (L9) No. 250 279 145 674 Masters Taught (L9) 37% 41% 22% 67%
Masters Research (L9) No. 22 10 0 32 Masters Research (L9) 69% 31% 0% 3%
Doctorate (L10) No. 111 20 0 131 Doctorate (L10) 85% 15% 0% 13%
Occasional No. 0 16 0 16 Occasional 0% 100% 0% 2%
Total UG and PG Enrolments No. 8,326 2,728 263 11,317 Total UG and PG Enrolments 74% 24% 2% 100%
Research & Taught (L9/10) FTE 610 Research & Taught (L9/10) 10.7%
Research (L9/10) FTE 148 Research (L9/10) 2.6%
Research (L10) FTE 121 Research (L10) 2.1%
No. % No. %
Generic programmes and qualifications 0 0% Generic programmes and qualifications 55 42%
Education 7 0% Education 0 0%
Arts and humanities 150 9% Arts and humanities 0 0%
Social sciences, journalism and information 0 0% Social sciences, journalism and information 0 0%
Business, administration and law 471 27% Business, administration and law 11 8%
Natural sciences, mathematics and statistics 192 11% Natural sciences, mathematics and statistics 19 15%
Information and Communication Technologies (ICTs) 94 5% Information and Communication Technologies (ICTs) 19 15%
Engineering, Manufacturing & Construction 451 26% Engineering, Manufacturing & Construction 27 21%
Agriculture, forestry, fisheries and veterinary 35 2% Agriculture, forestry, fisheries and veterinary 0 0%
Health and welfare 186 11% Health and welfare 0 0%
Services 155 9% Services 0 0%
Total 1,741 100% Total 131 100%
No. %Mature Entrants Year 1 (Full-time Undergraduate) 30 2%Mature Entrants Year 2+ (Full-time Undergraduate) 7
No. %
Flexible Learners (PT, Distance, E-Learning, In-Service) 2,991 26%
238 3%
17%49% Regional Intake (% of Full-time Enrolments) No. %
26% from the institution's county 73%
9% from the institution's county and bordering counties 93%
No. %261 3% Erasmus Students Incoming (excl. work placements) 161
EU 59 1%Non-EU 202 2% Total no. of International (FT, PT & Erasmus Incoming) Students 463
No. % Erasmus Students Outgoing 041 2% Other Exchange Outgoing 0
EU 24 1%Non-EU 17 1%
Cork Institute of Technology - Profile 2018/19
STUDENT NUMBERSEntrants Graduates
Enrolments
% FTE Honours Bach Degree L8 and all PG
% FTE Honours Bach Degree L8 and all PG
% FTE Honours Bach Degree L8 and all PG
DISCIPLINARY MIXFirst Year Full-time Undergraduate New Entrants Doctorate (All modes)
PARTICIPATION(% of New Entrants)
Students in receipt of the Fund for Students with Disabilities (% of Full-
time UG & PG Enrolments)670 8%
(% of Total Enrolments incl. Flexible Learning)
Deprivation Index Scores (% of Full-time and Part-time, Undergraduate
and Postgraduate Enrolments) Springboard+ enrolments (% of National Participation) Affluent Marginally above average
Marginally Below average
Disadvantaged
INTERNATIONALISATIONInternational Students (Full-time)
(% of Full-time Enrolments)
International Students (Part-time)
(% of Part-time Enrolments)

12
Level 6 Level 7 Level 8
% % %
Generic programmes and qualifications - - - Indicator Indicator Score (out of 60)
Education - 38% - Higher Order Learning 33.5
Arts and humanities - 43% 8% Reflective and Integrative Learning 28.3
Social sciences, journalism and information - - - Quantitative Reasoning 18.3
Business, administration and law 10% 13% 5% Learning Strategies 28.1
Natural sciences, mathematics and statistics - 10% 12% Collaborative Learning 31.8
Information and Communication Technologies (ICTs) - 31% 24% Student-Faculty Interaction 14.8
Engineering, Manufacturing & Construction - 25% 16% Effective Teaching Practices 33.9
Agriculture, forestry, fisheries and veterinary - 6% - Quality of Interactions 38.8
Health and welfare - 8% 13% Supportive Environment 27.1
Services 11% 16% 19%
Total 11% 17% 12%
No. of Doctorate Graduates per 10 Academic Staff 0.3
No. Contract Research Income (€000) 16,506
Priority Patent Applications 3 State and Semi-State 8,453
Total Patents Granted 3 EU 3,918Invention Disclosures 16 Industry 881
Licence agreements (institution - private industry) 11 Other 3,254
Spin-out companies created 0 Contribution in respect of overheads 0
%
Level 8 Graduates in Permanent/Temporary Employment 82% Total Contract Research Income per Academic Staff €27,747
Level 8 Graduates in Further Study 12% EU Contract Research Income per Academic Staff €6,586
Level 9/10 Graduates in Permament/Temporary Employment 87%
Level 9/10 Graduates in Further Study 3%
Core Staff 929 100% Total Income (€000) 110,130 100%
Academic Staff 581 63% State Grants 49,139 45%
Support staff 348 37% Fees 38,109 35%
Contract Research & Specialist Staff 118 100% HEA Fees 5,182 5%
Academic Staff 14 12% Other Fees 32,927 30%
Support staff 104 88% Research Grants & Contracts 16,091 15%
Total Staff 1,048 100% Other Income 6,791 6%
Total Academic 595 57% Total Expenditure (€000) 105,214 100%
Total Support 453 43% Core - Pay 70,798 67%
Core - Non-Pay 19,082 18%
Non-Academic/Academic All Staff Ratio 0.8 Research Grants & Contracts - Pay 6,913 7%
Student FTE/Academic Staff Ratio 17 Research Grants & Contracts - Non-Pay 8,421 8%
Staff Age Profile (Proportion of Staff aged…) %20-39 23% Total Expenditure per Student (SRS)
18,725
40-54 50% Exchequer/Non-Exchequer Fees Ratio 0.2
55 and above 27%
Proportion of Academic Staff who are female 45% Pay/Non-Pay Expenditure Ratio (incl. Research) 2.8
Proportion of Staff at Most Senior Academic Grade who are Female 31% Pay/Non-Pay Expenditure Ratio (excl. Research) 3.7
Staff Qualifications (Proportion of…) %
Full-time Permanent Academic Staff with Masters or higher qual. 100%Full-time Permanent Academic Staff with Doctorate qualification 34%
All Permanent Academic Staff with Masters or higher qualification 100%All Permanent Academic Staff with Doctorate qualification 32%
Cork Institute of Technology - Profile 2018/19 - continued
TEACHING AND LEARNING
Non-Progression Rate from 1st to 2nd Year Engagement Indicators (Irish Survey of Student Engagement 2019)
RESEARCH, KNOWLEDGE TRANSFER AND GRADUATE OUTCOMES
2019
Graduate Outomes (2019 Graduates)
STAFF FINANCIAL DATA
1 Total expenditure per FTE student excluding research and depreciation with pension adjustments, based on
unadjusted SRS numbers.
0
50
100
150
200
250
300
350
400
Flexible Learners(as % of all Enrolment)
Participants in Labour Market Activation(Springboard)
Level 6/7 Enrolment(as % of all Enrolment)
FT Mature Entrants(as % of all FT New Entrants)
FT New Entrants from DisadvantagedBackgrounds
FTE Research Enrolment (as % of FTELevel 8 and Postgraduate Enrolment)
Doctorate Graduates per 10 AcademicStaff
Total Contract Research Income perAcademic Staff
EU Contract Research Income perAcademic Staff
Graduates in Employment (Level 8)
Progression Rate Level 81st to 2nd Year
Non-Academic/Academic Staff ratio(Core staff)
Student FTE/Academic Staff ratio(FTE students/Core Academic staff)
Pay/Non-Pay ratio (excl. Research)
Exchequer/Non-Exchequer Fees ratio
Total Expenditure per FTE Student, SRS(excl. Depreciation & Research)
Maximum HEA CIT Average All HEA

13
STUDENT NUMBERS
STUDENT NUMBERS
4,137
Enrolments
13,013 3,436
TOP DISCIPLINES
NEW ENTRANTS
24%
19%
17%
DOCTORATES
20%
19%
17%
PARTICIPATION
6%
5%
INTERNATIONAL STUDENTS
1,028 46
8% 2%
Full-time Part-time
RESEARCH
€ 41.66 m 1.8
Contract Research Income
FIRST DESTINATION OF 2018 GRADUATES
76% 95%
Dublin City University
Sta
tistic
al h
ighlig
hts
3,577
New Entrants Graduates
Undergraduate
Enrolments
Postgraduate
Enrolments
Arts and humanities
Education
Business, administration and law
Education
Business, administration and law
Arts and humanities
Level 8
Graduates in
Employment
Level 9/10
Graduates in
Employment
Mature Students
Entrants with a Disability
8%Entrants from Disadvantaged Socio-economic
backgrounds
Doctoral
Graduates per
10 Academic
Staff

14
No. No. %
New Entrants Year 1 (Full-time Undergraduate) 3,509 Undergraduate Graduates 2,915 70%
New Entrants Year 2+ (Full-time Undergraduate) 68 Postgraduate Graduates 1,222 30%
Full-time Part-time Remote Total Full-time Part-time Remote Total
Other Enrolments (IoTs only) No. 0 0 0 0 Other Enrolments (IoTs only) 0% 0% 0% 0%
QQI L5 Certificate No. 0 0 0 0 QQI L5 Certificate 0% 0% 0% 0%
QQI L6 Advanced Certificate No. 0 0 0 0 QQI L6 Advanced Certificate 0% 0% 0% 0%
of which are apprenticeships No. 0 0 0 0of which are
apprenticeships 0% 0% 0% 0%
Undergraduate No. 12,060 372 581 13,013 Undergraduate 93% 3% 4% 79%
Foundation/Access No. 0 0 0 0 Foundation/Access 0% 0% 0% 0%
Diploma No. 0 0 0 0 Diploma 0% 0% 0% 0%
Certificate No. 0 93 48 141 Certificate 0% 66% 34% 1%
Higher Certificate No. 0 0 0 0 Higher Certificate 0% 0% 0% 0%
Ordinary Degree (L7) No. 0 0 0 0 Ordinary Degree (L7) 0% 0% 0% 0%
Honours Degree (L8) No. 12,032 87 532 12,651 Honours Degree (L8) 95% 1% 4% 97%
Occasional No. 28 192 1 221 Occasional 13% 87% 0% 2%
Postgraduate No. 1,575 1,551 310 3,436 Postgraduate 46% 45% 9% 21%
Postgrad Diploma No. 0 329 39 368 Postgrad Diploma 0% 89% 11% 11%
Postgrad Higher Diploma No. 37 0 81 118 Postgrad Higher Diploma 31% 0% 69% 3%
Postgrad Certificate No. 0 108 0 108 Postgrad Certificate 0% 100% 0% 3%
Masters Taught (L9) No. 1,078 840 190 2,108 Masters Taught (L9) 51% 40% 9% 61%
Masters Research (L9) No. 35 12 0 47 Masters Research (L9) 74% 26% 0% 1%
Doctorate (L10) No. 425 262 0 687 Doctorate (L10) 62% 38% 0% 20%
Occasional No. 0 0 0 0 Occasional 0% 0% 0% 0%
Total UG and PG Enrolments No. 13,635 1,923 891 16,449 Total UG and PG Enrolments 83% 12% 5% 100%
Research & Taught (L9/10) FTE 2,190 Research & Taught (L9/10) 14.8%
Research (L9/10) FTE 597 Research (L9/10) 4.0%
Research (L10) FTE 556 Research (L10) 3.7%
No. % No. %
Generic programmes and qualifications 58 2% Generic programmes and qualifications 0 0%
Education 670 19% Education 139 20%
Arts and humanities 835 24% Arts and humanities 119 17%
Social sciences, journalism and information 274 8% Social sciences, journalism and information 22 3%
Business, administration and law 591 17% Business, administration and law 130 19%
Natural sciences, mathematics and statistics 294 8% Natural sciences, mathematics and statistics 112 16%
Information and Communication Technologies (ICTs) 189 5% Information and Communication Technologies (ICTs) 54 8%
Engineering, Manufacturing & Construction 236 7% Engineering, Manufacturing & Construction 38 6%
Agriculture, forestry, fisheries and veterinary 0 0% Agriculture, forestry, fisheries and veterinary 0 0%
Health and welfare 362 10% Health and welfare 73 11%
Services 0 0% Services 0 0%
Total 3,509 100% Total 687 100%
No. %Mature Entrants Year 1 (Full-time Undergraduate) 218 6%Mature Entrants Year 2+ (Full-time Undergraduate) 8
No. %
Flexible Learners (PT, Distance, E-Learning, In-Service) 2,814 17%
301 3%
21%42% Regional Intake (% of Full-time Enrolments) No. %
28% from the institution's county 42%
8% from the institution's county and bordering counties 59%
No. %1,028 8% Erasmus Students Incoming (excl. work placements) 343
EU 452 3%Non-EU 576 4% Total no. of International (FT, PT & Erasmus Incoming) Students 1,417
No. % Erasmus Students Outgoing 29546 2% Other Exchange Outgoing 0
EU 32 2%Non-EU 14 1%
Dublin City University - Profile 2018/19
STUDENT NUMBERSEntrants Graduates
Enrolments
% FTE Honours Bach Degree L8 and all PG
% FTE Honours Bach Degree L8 and all PG
% FTE Honours Bach Degree L8 and all PG
DISCIPLINARY MIXFirst Year Full-time Undergraduate New Entrants Doctorate (All modes)
PARTICIPATION(% of New Entrants)
Students in receipt of the Fund for Students with Disabilities (% of Full-
time UG & PG Enrolments)740 5%
(% of Total Enrolments incl. Flexible Learning)
Deprivation Index Scores (% of Full-time and Part-time, Undergraduate
and Postgraduate Enrolments) Springboard+ enrolments (% of National Participation) Affluent Marginally above average
Marginally Below average
Disadvantaged
INTERNATIONALISATIONInternational Students (Full-time)
(% of Full-time Enrolments)
International Students (Part-time)
(% of Part-time Enrolments)

15
Level 6 Level 7 Level 8
% % %
Generic programmes and qualifications - - - Indicator Indicator Score (out of 60)
Education - - 4% Higher Order Learning 37.7
Arts and humanities - - 17% Reflective and Integrative Learning 31.9
Social sciences, journalism and information - - 9% Quantitative Reasoning 21.0
Business, administration and law - - 8% Learning Strategies 30.7
Natural sciences, mathematics and statistics - - 10% Collaborative Learning 32.6
Information and Communication Technologies (ICTs) - - 12% Student-Faculty Interaction 12.9
Engineering, Manufacturing & Construction - - 14% Effective Teaching Practices 33.1
Agriculture, forestry, fisheries and veterinary - - - Quality of Interactions 38.3
Health and welfare - - 6% Supportive Environment 31.2
Services - - -
Total - - 10%
No. of Doctorate Graduates per 10 Academic Staff 1.8
No. Contract Research Income (€000) 41,660
Priority Patent Applications 10 State and Semi-State 23,896
Total Patents Granted 6 EU 7,083Invention Disclosures 27 Industry 5,179
Licence agreements (institution - private industry) 27 Other 5,502
Spin-out companies created 1 Contribution in respect of overheads 0
%
Level 8 Graduates in Permanent/Temporary Employment 76% Total Contract Research Income per Academic Staff €61,518
Level 8 Graduates in Further Study 19% EU Contract Research Income per Academic Staff €10,459
Level 9/10 Graduates in Permament/Temporary Employment 95%
Level 9/10 Graduates in Further Study 1%
Core Staff 1,215 100% Total Income (€000) 199,945 100%
Academic Staff 664 55% State Grants 50,848 25%
Support staff 551 45% Fees 89,082 45%
Contract Research & Specialist Staff 340 100% HEA Fees 35,932 18%
Academic Staff 223 66% Other Fees 53,150 27%
Support staff 117 34% Research Grants & Contracts 51,909 26%
Total Staff 1,555 100% Other Income 8,106 4%
Total Academic 887 57% Total Expenditure (€000) 199,925 100%
Total Support 668 43% Core - Pay 109,648 55%
Core - Non-Pay 38,368 19%
Non-Academic/Academic All Staff Ratio 0.8 Research Grants & Contracts - Pay 31,185 16%
Student FTE/Academic Staff Ratio 22 Research Grants & Contracts - Non-Pay 20,724 10%
Staff Age Profile (Proportion of Staff aged…) %20-39 31% Total Expenditure per Student (SRS)
19,609
40-54 49% Exchequer/Non-Exchequer Fees Ratio 0.7
55 and above 21%
Proportion of Academic Staff who are female 52% Pay/Non-Pay Expenditure Ratio (incl. Research) 2.4
Proportion of Staff at Most Senior Academic Grade who are Female 30% Pay/Non-Pay Expenditure Ratio (excl. Research) 2.9
Staff Qualifications (Proportion of…) %
Full-time Permanent Academic Staff with Masters or higher qual. 100%Full-time Permanent Academic Staff with Doctorate qualification 83%
All Permanent Academic Staff with Masters or higher qualification 100%All Permanent Academic Staff with Doctorate qualification 83%
Dublin City University - Profile 2018/19 - continued
TEACHING AND LEARNING
Non-Progression Rate from 1st to 2nd Year Engagement Indicators (Irish Survey of Student Engagement 2019)
RESEARCH, KNOWLEDGE TRANSFER AND GRADUATE OUTCOMES
2019
Graduate Outomes (2019 Graduates)
STAFF FINANCIAL DATA
1 Total expenditure per FTE student excluding research and depreciation with pension adjustments, based on
unadjusted SRS numbers.
0
50
100
150
200
250
300
350
400
Flexible Learners(as % of all Enrolment)
Participants in Labour Market Activation(Springboard)
Level 6/7 Enrolment(as % of all Enrolment)
FT Mature Entrants(as % of all FT New Entrants)
FT New Entrants from DisadvantagedBackgrounds
FTE Research Enrolment (as % of FTELevel 8 and Postgraduate Enrolment)
Doctorate Graduates per 10 AcademicStaff
Total Contract Research Income perAcademic Staff
EU Contract Research Income perAcademic Staff
Graduates in Employment (Level 8)
Progression Rate Level 81st to 2nd Year
Non-Academic/Academic Staff ratio(Core staff)
Student FTE/Academic Staff ratio(FTE students/Core Academic staff)
Pay/Non-Pay ratio (excl. Research)
Exchequer/Non-Exchequer Fees ratio
Total Expenditure per FTE Student, SRS(excl. Depreciation & Research)
Maximum HEA DCU Average All HEA

16
STUDENT NUMBERS
STUDENT NUMBERS
788
Enrolments
2,050 285
TOP DISCIPLINES
NEW ENTRANTS
60%
19%
11%
PARTICIPATION
8%
13%
INTERNATIONAL STUDENTS
80 16
4% 6%
Full-time Part-time
RESEARCH
€ .702 m
Contract Research Income
FIRST DESTINATION OF 2018 GRADUATES
75% 90%
Dún Laoghaire Institute of
Art, Design and
Technology Sta
tistic
al h
ighlig
hts
523
New Entrants Graduates
Undergraduate
Enrolments
Postgraduate
Enrolments
Arts and humanities
Business, administration and law
Social sciences, journalism and information
Level 8
Graduates in
Employment
Level 9/10
Graduates in
Employment
Mature Students
Entrants with a Disability
8%Entrants from Disadvantaged Socio-economic
backgrounds

17
No. No. %
New Entrants Year 1 (Full-time Undergraduate) 498 Undergraduate Graduates 564 72%
New Entrants Year 2+ (Full-time Undergraduate) 25 Postgraduate Graduates 224 28%
Full-time Part-time Remote Total Full-time Part-time Remote Total
Other Enrolments (IoTs only) No. 0 0 0 0 Other Enrolments (IoTs only) 0% 0% 0% 0%
QQI L5 Certificate No. 0 0 0 0 QQI L5 Certificate 0% 0% 0% 0%
QQI L6 Advanced Certificate No. 0 0 0 0 QQI L6 Advanced Certificate 0% 0% 0% 0%
of which are apprenticeships No. 0 0 0 0of which are
apprenticeships 0% 0% 0% 0%
Undergraduate No. 1,952 98 0 2,050 Undergraduate 95% 5% 0% 88%
Foundation/Access No. 0 0 0 0 Foundation/Access 0% 0% 0% 0%
Diploma No. 0 0 0 0 Diploma 0% 0% 0% 0%
Certificate No. 0 63 0 63 Certificate 0% 100% 0% 3%
Higher Certificate No. 0 0 0 0 Higher Certificate 0% 0% 0% 0%
Ordinary Degree (L7) No. 161 0 0 161 Ordinary Degree (L7) 100% 0% 0% 8%
Honours Degree (L8) No. 1,791 35 0 1,826 Honours Degree (L8) 98% 2% 0% 89%
Occasional No. 0 0 0 0 Occasional 0% 0% 0% 0%
Postgraduate No. 94 191 0 285 Postgraduate 33% 67% 0% 12%
Postgrad Diploma No. 0 39 0 39 Postgrad Diploma 0% 100% 0% 14%
Postgrad Higher Diploma No. 0 0 0 0 Postgrad Higher Diploma 0% 0% 0% 0%
Postgrad Certificate No. 0 72 0 72 Postgrad Certificate 0% 100% 0% 25%
Masters Taught (L9) No. 86 80 0 166 Masters Taught (L9) 52% 48% 0% 58%
Masters Research (L9) No. 8 0 0 8 Masters Research (L9) 100% 0% 0% 3%
Doctorate (L10) No. 0 0 0 0 Doctorate (L10) 0% 0% 0% 0%
Occasional No. 0 0 0 0 Occasional 0% 0% 0% 0%
Total UG and PG Enrolments No. 2,046 289 0 2,335 Total UG and PG Enrolments 88% 12% 0% 100%
Research & Taught (L9/10) FTE 134 Research & Taught (L9/10) 6.7%
Research (L9/10) FTE 8 Research (L9/10) 0.4%
Research (L10) FTE 0 Research (L10) 0.0%
No. % No. %
Generic programmes and qualifications 0 0% Generic programmes and qualifications 0 0%
Education 0 0% Education 0 0%
Arts and humanities 299 60% Arts and humanities 0 0%
Social sciences, journalism and information 53 11% Social sciences, journalism and information 0 0%
Business, administration and law 94 19% Business, administration and law 0 0%
Natural sciences, mathematics and statistics 0 0% Natural sciences, mathematics and statistics 0 0%
Information and Communication Technologies (ICTs) 52 10% Information and Communication Technologies (ICTs) 0 0%
Engineering, Manufacturing & Construction 0 0% Engineering, Manufacturing & Construction 0 0%
Agriculture, forestry, fisheries and veterinary 0 0% Agriculture, forestry, fisheries and veterinary 0 0%
Health and welfare 0 0% Health and welfare 0 0%
Services 0 0% Services 0 0%
Total 498 100% Total 0 0%
No. %Mature Entrants Year 1 (Full-time Undergraduate) 41 8%Mature Entrants Year 2+ (Full-time Undergraduate) 11
No. %
Flexible Learners (PT, Distance, E-Learning, In-Service) 289 12%
23 0%
34%38% Regional Intake (% of Full-time Enrolments) No. %
21% from the institution's county 55%
8% from the institution's county and bordering counties 78%
No. %80 4% Erasmus Students Incoming (excl. work placements) 24
EU 46 2%Non-EU 34 2% Total no. of International (FT, PT & Erasmus Incoming) Students 120
No. % Erasmus Students Outgoing 1916 6% Other Exchange Outgoing 0
EU 5 2%Non-EU 11 4%
Dún Laoghaire Institute of Art, Design and Technology - Profile 2018/19
STUDENT NUMBERSEntrants Graduates
Enrolments
% FTE Honours Bach Degree L8 and all PG
% FTE Honours Bach Degree L8 and all PG
% FTE Honours Bach Degree L8 and all PG
DISCIPLINARY MIXFirst Year Full-time Undergraduate New Entrants Doctorate (All modes)
PARTICIPATION(% of New Entrants)
Students in receipt of the Fund for Students with Disabilities (% of Full-
time UG & PG Enrolments)257 13%
(% of Total Enrolments incl. Flexible Learning)
Deprivation Index Scores (% of Full-time and Part-time, Undergraduate
and Postgraduate Enrolments) Springboard+ enrolments (% of National Participation) Affluent Marginally above average
Marginally Below average
Disadvantaged
INTERNATIONALISATIONInternational Students (Full-time)
(% of Full-time Enrolments)
International Students (Part-time)
(% of Part-time Enrolments)

18
Level 6 Level 7 Level 8
% % %
Generic programmes and qualifications - - - Indicator Indicator Score (out of 60)
Education - - - Higher Order Learning 38.6
Arts and humanities - 3% 10% Reflective and Integrative Learning 35.3
Social sciences, journalism and information - - 3% Quantitative Reasoning 17.7
Business, administration and law - 25% 24% Learning Strategies 30.8
Natural sciences, mathematics and statistics - - - Collaborative Learning 33.3
Information and Communication Technologies (ICTs) - - 25% Student-Faculty Interaction 18.7
Engineering, Manufacturing & Construction - - - Effective Teaching Practices 36.2
Agriculture, forestry, fisheries and veterinary - - - Quality of Interactions 42.9
Health and welfare - - - Supportive Environment 28.6
Services - - -
Total - 16% 13%
No. of Doctorate Graduates per 10 Academic Staff N/A
No. Contract Research Income (€000) 702
Priority Patent Applications 0 State and Semi-State 467
Total Patents Granted 0 EU 85Invention Disclosures 0 Industry 124
Licence agreements (institution - private industry) 0 Other 26
Spin-out companies created 0 Contribution in respect of overheads 0
%
Level 8 Graduates in Permanent/Temporary Employment 75% Total Contract Research Income per Academic Staff €5,390
Level 8 Graduates in Further Study 8% EU Contract Research Income per Academic Staff €653
Level 9/10 Graduates in Permament/Temporary Employment 90%
Level 9/10 Graduates in Further Study 0%
Core Staff 203 100% Total Income (€000) 20,117 100%
Academic Staff 121 60% State Grants 9,009 45%
Support staff 82 40% Fees 9,036 45%
Contract Research & Specialist Staff 15 100% HEA Fees 1,442 7%
Academic Staff 9 62% Other Fees 7,594 38%
Support staff 6 38% Research Grants & Contracts 691 3%
Total Staff 218 100% Other Income 1,381 7%
Total Academic 130 60% Total Expenditure (€000) 21,313 100%
Total Support 88 40% Core - Pay 15,172 71%
Core - Non-Pay 5,553 26%
Non-Academic/Academic All Staff Ratio 0.7 Research Grants & Contracts - Pay 188 1%
Student FTE/Academic Staff Ratio 17 Research Grants & Contracts - Non-Pay 400 2%
Staff Age Profile (Proportion of Staff aged…) %20-39 13% Total Expenditure per Student (SRS)
19,461
40-54 58% Exchequer/Non-Exchequer Fees Ratio 0.2
55 and above 24%
Proportion of Academic Staff who are female 46% Pay/Non-Pay Expenditure Ratio (incl. Research) 2.6
Proportion of Staff at Most Senior Academic Grade who are Female 50% Pay/Non-Pay Expenditure Ratio (excl. Research) 2.7
Staff Qualifications (Proportion of…) %
Full-time Permanent Academic Staff with Masters or higher qual. 100%Full-time Permanent Academic Staff with Doctorate qualification 34%
All Permanent Academic Staff with Masters or higher qualification 100%All Permanent Academic Staff with Doctorate qualification 32%
Dún Laoghaire Institute of Art, Design and Technology - Profile 2018/19 - continued
TEACHING AND LEARNING
Non-Progression Rate from 1st to 2nd Year Engagement Indicators (Irish Survey of Student Engagement 2019)
RESEARCH, KNOWLEDGE TRANSFER AND GRADUATE OUTCOMES
2019
Graduate Outomes (2019 Graduates)
STAFF FINANCIAL DATA
1 Total expenditure per FTE student excluding research and depreciation with pension adjustments, based on
unadjusted SRS numbers.
0
50
100
150
200
250
300
350
400
Flexible Learners(as % of all Enrolment)
Participants in Labour Market Activation(Springboard)
Level 6/7 Enrolment(as % of all Enrolment)
FT Mature Entrants(as % of all FT New Entrants)
FT New Entrants from DisadvantagedBackgrounds
FTE Research Enrolment (as % of FTELevel 8 and Postgraduate Enrolment)
Doctorate Graduates per 10 AcademicStaff
Total Contract Research Income perAcademic Staff
EU Contract Research Income perAcademic Staff
Graduates in Employment (Level 8)
Progression Rate Level 81st to 2nd Year
Non-Academic/Academic Staff ratio(Core staff)
Student FTE/Academic Staff ratio(FTE students/Core Academic staff)
Pay/Non-Pay ratio (excl. Research)
Exchequer/Non-Exchequer Fees ratio
Total Expenditure per FTE Student, SRS(excl. Depreciation & Research)
Maximum HEA IADT Average All HEA

19
STUDENT NUMBERS
STUDENT NUMBERS
1,556
Enrolments
4,612 260
TOP DISCIPLINES
NEW ENTRANTS
21%
20%
14%
DOCTORATES
29%
27%
24%
PARTICIPATION
13%
5%
INTERNATIONAL STUDENTS
561 3
14% 0%
Full-time Part-time
RESEARCH
€ 4.043 m 0.2
Contract Research Income
FIRST DESTINATION OF 2018 GRADUATES
83% 75%
Dundalk Institute of
Technology
Sta
tistic
al h
ighlig
hts
1,121
New Entrants Graduates
Undergraduate
Enrolments
Postgraduate
Enrolments
Health and welfare
Business, administration and law
Engineering, Manufacturing & Construction
Health and welfare
Information and Communication Technologies (ICTs)
Natural sciences, mathematics and statistics
Level 8
Graduates in
Employment
Level 9/10
Graduates in
Employment
Mature Students
Entrants with a Disability
14%Entrants from Disadvantaged Socio-economic
backgrounds
Doctoral
Graduates per
10 Academic
Staff

20
No. No. %
New Entrants Year 1 (Full-time Undergraduate) 1,088 Undergraduate Graduates 1,480 95%
New Entrants Year 2+ (Full-time Undergraduate) 33 Postgraduate Graduates 76 5%
Full-time Part-time Remote Total Full-time Part-time Remote Total
Other Enrolments (IoTs only) No. 0 471 0 471 Other Enrolments (IoTs only) 0% 100% 0% 100%
QQI L5 Certificate No. 0 12 0 12 QQI L5 Certificate 0% 100% 0% 3%
QQI L6 Advanced Certificate No. 0 459 0 459 QQI L6 Advanced Certificate 0% 100% 0% 97%
of which are apprenticeships No. 0 459 0 459of which are
apprenticeships 0% 100% 0% 97%
Undergraduate No. 3,988 624 0 4,612 Undergraduate 86% 14% 0% 95%
Foundation/Access No. 0 0 0 0 Foundation/Access 0% 0% 0% 0%
Diploma No. 0 15 0 15 Diploma 0% 100% 0% 0%
Certificate No. 57 398 0 455 Certificate 13% 87% 0% 10%
Higher Certificate No. 56 0 0 56 Higher Certificate 100% 0% 0% 1%
Ordinary Degree (L7) No. 1,543 67 0 1,610 Ordinary Degree (L7) 96% 4% 0% 35%
Honours Degree (L8) No. 2,332 130 0 2,462 Honours Degree (L8) 95% 5% 0% 53%
Occasional No. 0 14 0 14 Occasional 0% 100% 0% 0%
Postgraduate No. 107 153 0 260 Postgraduate 41% 59% 0% 5%
Postgrad Diploma No. 0 0 0 0 Postgrad Diploma 0% 0% 0% 0%
Postgrad Higher Diploma No. 16 74 0 90 Postgrad Higher Diploma 18% 82% 0% 35%
Postgrad Certificate No. 0 31 0 31 Postgrad Certificate 0% 100% 0% 12%
Masters Taught (L9) No. 39 37 0 76 Masters Taught (L9) 51% 49% 0% 29%
Masters Research (L9) No. 16 2 0 18 Masters Research (L9) 89% 11% 0% 7%
Doctorate (L10) No. 36 9 0 45 Doctorate (L10) 80% 20% 0% 17%
Occasional No. 0 0 0 0 Occasional 0% 0% 0% 0%
Total UG and PG Enrolments No. 4,095 777 0 4,872 Total UG and PG Enrolments 84% 16% 0% 100%
Research & Taught (L9/10) FTE 115 Research & Taught (L9/10) 4.5%
Research (L9/10) FTE 58 Research (L9/10) 2.2%
Research (L10) FTE 41 Research (L10) 1.6%
No. % No. %
Generic programmes and qualifications 20 2% Generic programmes and qualifications 0 0%
Education 0 0% Education 0 0%
Arts and humanities 121 11% Arts and humanities 2 4%
Social sciences, journalism and information 24 2% Social sciences, journalism and information 0 0%
Business, administration and law 215 20% Business, administration and law 0 0%
Natural sciences, mathematics and statistics 49 5% Natural sciences, mathematics and statistics 11 24%
Information and Communication Technologies (ICTs) 129 12% Information and Communication Technologies (ICTs) 12 27%
Engineering, Manufacturing & Construction 149 14% Engineering, Manufacturing & Construction 7 16%
Agriculture, forestry, fisheries and veterinary 53 5% Agriculture, forestry, fisheries and veterinary 0 0%
Health and welfare 225 21% Health and welfare 13 29%
Services 103 9% Services 0 0%
Total 1,088 100% Total 45 100%
No. %Mature Entrants Year 1 (Full-time Undergraduate) 139 13%Mature Entrants Year 2+ (Full-time Undergraduate) 14
No. %
Flexible Learners (PT, Distance, E-Learning, In-Service) 777 16%
142 2%
5%39% Regional Intake (% of Full-time Enrolments) No. %
42% from the institution's county 45%
14% from the institution's county and bordering counties 73%
No. %561 14% Erasmus Students Incoming (excl. work placements) 107
EU 103 3%Non-EU 458 11% Total no. of International (FT, PT & Erasmus Incoming) Students 671
No. % Erasmus Students Outgoing 173 0% Other Exchange Outgoing 0
EU 3 0%Non-EU 0 0%
Dundalk Institute of Technology - Profile 2018/19
STUDENT NUMBERSEntrants Graduates
Enrolments
% FTE Honours Bach Degree L8 and all PG
% FTE Honours Bach Degree L8 and all PG
% FTE Honours Bach Degree L8 and all PG
DISCIPLINARY MIXFirst Year Full-time Undergraduate New Entrants Doctorate (All modes)
PARTICIPATION(% of New Entrants)
Students in receipt of the Fund for Students with Disabilities (% of Full-
time UG & PG Enrolments)207 5%
(% of Total Enrolments incl. Flexible Learning)
Deprivation Index Scores (% of Full-time and Part-time, Undergraduate
and Postgraduate Enrolments) Springboard+ enrolments (% of National Participation) Affluent Marginally above average
Marginally Below average
Disadvantaged
INTERNATIONALISATIONInternational Students (Full-time)
(% of Full-time Enrolments)
International Students (Part-time)
(% of Part-time Enrolments)

21
Level 6 Level 7 Level 8
% % %
Generic programmes and qualifications - - - Indicator Indicator Score (out of 60)
Education - - - Higher Order Learning 36.1
Arts and humanities - 14% 26% Reflective and Integrative Learning 31.1
Social sciences, journalism and information - - 16% Quantitative Reasoning 20.2
Business, administration and law - 21% 20% Learning Strategies 31.1
Natural sciences, mathematics and statistics - 15% - Collaborative Learning 32.1
Information and Communication Technologies (ICTs) - 35% 8% Student-Faculty Interaction 17.0
Engineering, Manufacturing & Construction - 33% 18% Effective Teaching Practices 38.2
Agriculture, forestry, fisheries and veterinary - 11% 3% Quality of Interactions 42.2
Health and welfare - 9% 12% Supportive Environment 30.1
Services 47% 30% -
Total 47% 24% 15%
No. of Doctorate Graduates per 10 Academic Staff 0.2
No. Contract Research Income (€000) 4,043
Priority Patent Applications 0 State and Semi-State 1,593
Total Patents Granted 0 EU 2,216Invention Disclosures 9 Industry 12
Licence agreements (institution - private industry) 2 Other 222
Spin-out companies created 0 Contribution in respect of overheads 0
%
Level 8 Graduates in Permanent/Temporary Employment 83% Total Contract Research Income per Academic Staff €13,660
Level 8 Graduates in Further Study 8% EU Contract Research Income per Academic Staff €7,487
Level 9/10 Graduates in Permament/Temporary Employment 75%
Level 9/10 Graduates in Further Study 4%
Core Staff 440 100% Total Income (€000) 49,636 100%
Academic Staff 276 63% State Grants 21,217 43%
Support staff 164 37% Fees 19,192 39%
Contract Research & Specialist Staff 84 100% HEA Fees 3,308 7%
Academic Staff 41 49% Other Fees 15,884 32%
Support staff 42 51% Research Grants & Contracts 4,043 8%
Total Staff 524 100% Other Income 5,184 10%
Total Academic 317 61% Total Expenditure (€000) 48,650 100%
Total Support 207 39% Core - Pay 35,402 73%
Core - Non-Pay 9,209 19%
Non-Academic/Academic All Staff Ratio 0.7 Research Grants & Contracts - Pay 2,751 6%
Student FTE/Academic Staff Ratio 16 Research Grants & Contracts - Non-Pay 1,288 3%
Staff Age Profile (Proportion of Staff aged…) %20-39 16% Total Expenditure per Student (SRS)
19,453
40-54 58% Exchequer/Non-Exchequer Fees Ratio 0.2
55 and above 26%
Proportion of Academic Staff who are female 45% Pay/Non-Pay Expenditure Ratio (incl. Research) 3.6
Proportion of Staff at Most Senior Academic Grade who are Female 49% Pay/Non-Pay Expenditure Ratio (excl. Research) 3.8
Staff Qualifications (Proportion of…) %
Full-time Permanent Academic Staff with Masters or higher qual. 94%Full-time Permanent Academic Staff with Doctorate qualification 32%
All Permanent Academic Staff with Masters or higher qualification 94%All Permanent Academic Staff with Doctorate qualification 32%
Dundalk Institute of Technology - Profile 2018/19 - continued
TEACHING AND LEARNING
Non-Progression Rate from 1st to 2nd Year Engagement Indicators (Irish Survey of Student Engagement 2019)
RESEARCH, KNOWLEDGE TRANSFER AND GRADUATE OUTCOMES
2019
Graduate Outomes (2019 Graduates)
STAFF FINANCIAL DATA
1 Total expenditure per FTE student excluding research and depreciation with pension adjustments, based on
unadjusted SRS numbers.
0
50
100
150
200
250
300
350
400
Flexible Learners(as % of all Enrolment)
Participants in Labour Market Activation(Springboard)
Level 6/7 Enrolment(as % of all Enrolment)
FT Mature Entrants(as % of all FT New Entrants)
FT New Entrants from DisadvantagedBackgrounds
FTE Research Enrolment (as % of FTELevel 8 and Postgraduate Enrolment)
Doctorate Graduates per 10 AcademicStaff
Total Contract Research Income perAcademic Staff
EU Contract Research Income perAcademic Staff
Graduates in Employment (Level 8)
Progression Rate Level 81st to 2nd Year
Non-Academic/Academic Staff ratio(Core staff)
Student FTE/Academic Staff ratio(FTE students/Core Academic staff)
Pay/Non-Pay ratio (excl. Research)
Exchequer/Non-Exchequer Fees ratio
Total Expenditure per FTE Student, SRS(excl. Depreciation & Research)
Maximum HEA DKIT Average All HEA

22
STUDENT NUMBERS
STUDENT NUMBERS
1,973
Enrolments
6,485 662
TOP DISCIPLINES
NEW ENTRANTS
22%
20%
14%
DOCTORATES
70%
19%
11%
PARTICIPATION
8%
10%
INTERNATIONAL STUDENTS
216 5
4% 1%
Full-time Part-time
RESEARCH
€ 4.665 m 0.2
Contract Research Income
FIRST DESTINATION OF 2018 GRADUATES
82% 86%
Galway-Mayo Institute of
Technology
Sta
tistic
al h
ighlig
hts
1,572
New Entrants Graduates
Undergraduate
Enrolments
Postgraduate
Enrolments
Engineering, Manufacturing & Construction
Business, administration and law
Natural sciences, mathematics and statistics
Natural sciences, mathematics and statistics
Engineering, Manufacturing & Construction
Business, administration and law
Level 8
Graduates in
Employment
Level 9/10
Graduates in
Employment
Mature Students
Entrants with a Disability
12%Entrants from Disadvantaged Socio-economic
backgrounds
Doctoral
Graduates per
10 Academic
Staff

23
No. No. %
New Entrants Year 1 (Full-time Undergraduate) 1,552 Undergraduate Graduates 1,811 92%
New Entrants Year 2+ (Full-time Undergraduate) 20 Postgraduate Graduates 162 8%
Full-time Part-time Remote Total Full-time Part-time Remote Total
Other Enrolments (IoTs only) No. 0 253 0 253 Other Enrolments (IoTs only) 0% 100% 0% 100%
QQI L5 Certificate No. 0 0 0 0 QQI L5 Certificate 0% 0% 0% 0%
QQI L6 Advanced Certificate No. 0 253 0 253 QQI L6 Advanced Certificate 0% 100% 0% 100%
of which are apprenticeships No. 0 253 0 253of which are
apprenticeships 0% 100% 0% 100%
Undergraduate No. 5,622 771 92 6,485 Undergraduate 87% 12% 1% 91%
Foundation/Access No. 0 63 0 63 Foundation/Access 0% 100% 0% 1%
Diploma No. 0 0 0 0 Diploma 0% 0% 0% 0%
Certificate No. 0 401 92 493 Certificate 0% 81% 19% 8%
Higher Certificate No. 122 26 0 148 Higher Certificate 82% 18% 0% 2%
Ordinary Degree (L7) No. 1,489 141 0 1,630 Ordinary Degree (L7) 91% 9% 0% 25%
Honours Degree (L8) No. 4,011 77 0 4,088 Honours Degree (L8) 98% 2% 0% 63%
Occasional No. 0 63 0 63 Occasional 0% 100% 0% 1%
Postgraduate No. 96 162 404 662 Postgraduate 15% 24% 61% 9%
Postgrad Diploma No. 13 24 0 37 Postgrad Diploma 35% 65% 0% 6%
Postgrad Higher Diploma No. 12 28 403 443 Postgrad Higher Diploma 3% 6% 91% 67%
Postgrad Certificate No. 0 63 0 63 Postgrad Certificate 0% 100% 0% 10%
Masters Taught (L9) No. 8 37 1 46 Masters Taught (L9) 17% 80% 2% 7%
Masters Research (L9) No. 41 5 0 46 Masters Research (L9) 89% 11% 0% 7%
Doctorate (L10) No. 22 5 0 27 Doctorate (L10) 81% 19% 0% 4%
Occasional No. 0 0 0 0 Occasional 0% 0% 0% 0%
Total UG and PG Enrolments No. 5,718 933 496 7,147 Total UG and PG Enrolments 80% 13% 7% 100%
Research & Taught (L9/10) FTE 95 Research & Taught (L9/10) 2.1%
Research (L9/10) FTE 68 Research (L9/10) 1.5%
Research (L10) FTE 25 Research (L10) 0.6%
No. % No. %
Generic programmes and qualifications 0 0% Generic programmes and qualifications 0 0%
Education 28 2% Education 0 0%
Arts and humanities 137 9% Arts and humanities 0 0%
Social sciences, journalism and information 11 1% Social sciences, journalism and information 0 0%
Business, administration and law 318 20% Business, administration and law 3 11%
Natural sciences, mathematics and statistics 211 14% Natural sciences, mathematics and statistics 19 70%
Information and Communication Technologies (ICTs) 132 9% Information and Communication Technologies (ICTs) 0 0%
Engineering, Manufacturing & Construction 349 22% Engineering, Manufacturing & Construction 5 19%
Agriculture, forestry, fisheries and veterinary 102 7% Agriculture, forestry, fisheries and veterinary 0 0%
Health and welfare 98 6% Health and welfare 0 0%
Services 166 11% Services 0 0%
Total 1,552 100% Total 27 100%
No. %Mature Entrants Year 1 (Full-time Undergraduate) 117 8%Mature Entrants Year 2+ (Full-time Undergraduate) 8
No. %
Flexible Learners (PT, Distance, E-Learning, In-Service) 1,429 20%
514 5%
8%41% Regional Intake (% of Full-time Enrolments) No. %
39% from the institution's county 40%
12% from the institution's county and bordering counties 71%
No. %216 4% Erasmus Students Incoming (excl. work placements) 67
EU 82 1%Non-EU 134 2% Total no. of International (FT, PT & Erasmus Incoming) Students 288
No. % Erasmus Students Outgoing 195 1% Other Exchange Outgoing 2
EU 1 0%Non-EU 4 0%
Galway-Mayo Institute of Technology - Profile 2018/19
STUDENT NUMBERSEntrants Graduates
Enrolments
% FTE Honours Bach Degree L8 and all PG
% FTE Honours Bach Degree L8 and all PG
% FTE Honours Bach Degree L8 and all PG
DISCIPLINARY MIXFirst Year Full-time Undergraduate New Entrants Doctorate (All modes)
PARTICIPATION(% of New Entrants)
Students in receipt of the Fund for Students with Disabilities (% of Full-
time UG & PG Enrolments)553 10%
(% of Total Enrolments incl. Flexible Learning)
Deprivation Index Scores (% of Full-time and Part-time, Undergraduate
and Postgraduate Enrolments) Springboard+ enrolments (% of National Participation) Affluent Marginally above average
Marginally Below average
Disadvantaged
INTERNATIONALISATIONInternational Students (Full-time)
(% of Full-time Enrolments)
International Students (Part-time)
(% of Part-time Enrolments)
24
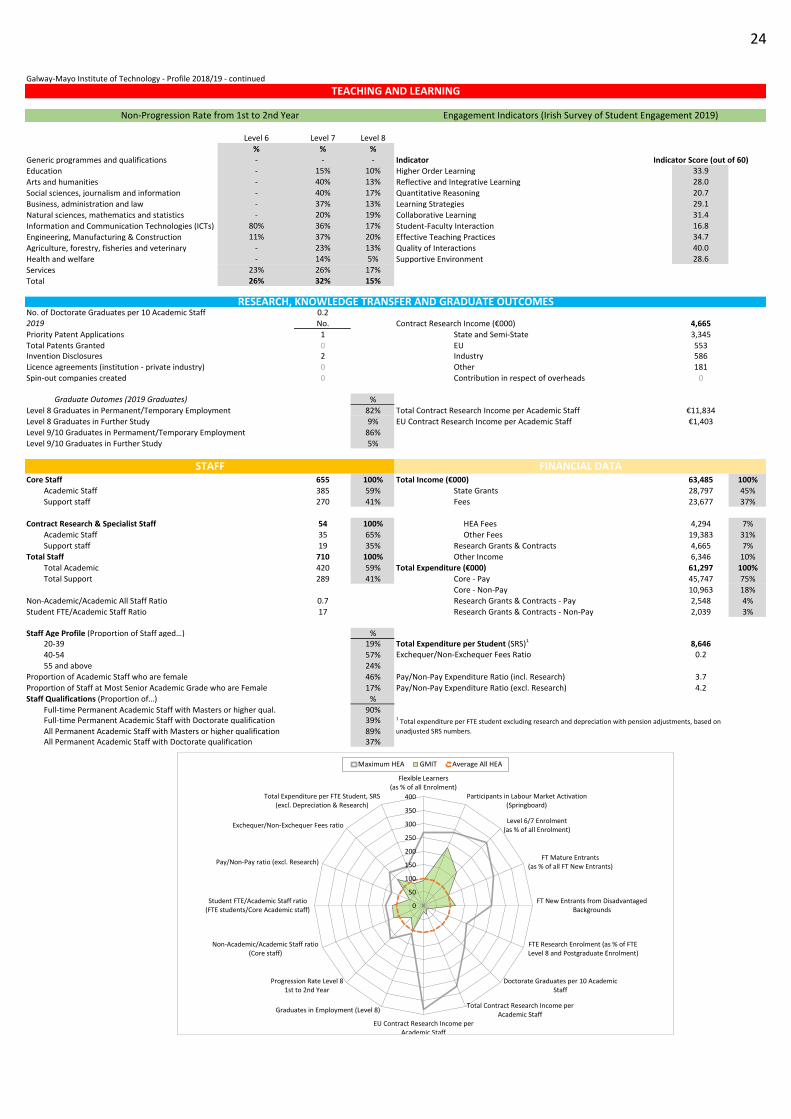
Level 6 Level 7 Level 8
% % %
Generic programmes and qualifications - - - Indicator Indicator Score (out of 60)
Education - 15% 10% Higher Order Learning 33.9
Arts and humanities - 40% 13% Reflective and Integrative Learning 28.0
Social sciences, journalism and information - 40% 17% Quantitative Reasoning 20.7
Business, administration and law - 37% 13% Learning Strategies 29.1
Natural sciences, mathematics and statistics - 20% 19% Collaborative Learning 31.4
Information and Communication Technologies (ICTs) 80% 36% 17% Student-Faculty Interaction 16.8
Engineering, Manufacturing & Construction 11% 37% 20% Effective Teaching Practices 34.7
Agriculture, forestry, fisheries and veterinary - 23% 13% Quality of Interactions 40.0
Health and welfare - 14% 5% Supportive Environment 28.6
Services 23% 26% 17%
Total 26% 32% 15%
No. of Doctorate Graduates per 10 Academic Staff 0.2
No. Contract Research Income (€000) 4,665
Priority Patent Applications 1 State and Semi-State 3,345
Total Patents Granted 0 EU 553Invention Disclosures 2 Industry 586
Licence agreements (institution - private industry) 0 Other 181
Spin-out companies created 0 Contribution in respect of overheads 0
%
Level 8 Graduates in Permanent/Temporary Employment 82% Total Contract Research Income per Academic Staff €11,834
Level 8 Graduates in Further Study 9% EU Contract Research Income per Academic Staff €1,403
Level 9/10 Graduates in Permament/Temporary Employment 86%
Level 9/10 Graduates in Further Study 5%
Core Staff 655 100% Total Income (€000) 63,485 100%
Academic Staff 385 59% State Grants 28,797 45%
Support staff 270 41% Fees 23,677 37%
Contract Research & Specialist Staff 54 100% HEA Fees 4,294 7%
Academic Staff 35 65% Other Fees 19,383 31%
Support staff 19 35% Research Grants & Contracts 4,665 7%
Total Staff 710 100% Other Income 6,346 10%
Total Academic 420 59% Total Expenditure (€000) 61,297 100%
Total Support 289 41% Core - Pay 45,747 75%
Core - Non-Pay 10,963 18%
Non-Academic/Academic All Staff Ratio 0.7 Research Grants & Contracts - Pay 2,548 4%
Student FTE/Academic Staff Ratio 17 Research Grants & Contracts - Non-Pay 2,039 3%
Staff Age Profile (Proportion of Staff aged…) %20-39 19% Total Expenditure per Student (SRS)
18,646
40-54 57% Exchequer/Non-Exchequer Fees Ratio 0.2
55 and above 24%
Proportion of Academic Staff who are female 46% Pay/Non-Pay Expenditure Ratio (incl. Research) 3.7
Proportion of Staff at Most Senior Academic Grade who are Female 17% Pay/Non-Pay Expenditure Ratio (excl. Research) 4.2
Staff Qualifications (Proportion of…) %
Full-time Permanent Academic Staff with Masters or higher qual. 90%Full-time Permanent Academic Staff with Doctorate qualification 39%
All Permanent Academic Staff with Masters or higher qualification 89%All Permanent Academic Staff with Doctorate qualification 37%
Galway-Mayo Institute of Technology - Profile 2018/19 - continued
TEACHING AND LEARNING
Non-Progression Rate from 1st to 2nd Year Engagement Indicators (Irish Survey of Student Engagement 2019)
RESEARCH, KNOWLEDGE TRANSFER AND GRADUATE OUTCOMES
2019
Graduate Outomes (2019 Graduates)
STAFF FINANCIAL DATA
1 Total expenditure per FTE student excluding research and depreciation with pension adjustments, based on
unadjusted SRS numbers.
0
50
100
150
200
250
300
350
400
Flexible Learners(as % of all Enrolment)
Participants in Labour Market Activation(Springboard)
Level 6/7 Enrolment(as % of all Enrolment)
FT Mature Entrants(as % of all FT New Entrants)
FT New Entrants from DisadvantagedBackgrounds
FTE Research Enrolment (as % of FTELevel 8 and Postgraduate Enrolment)
Doctorate Graduates per 10 AcademicStaff
Total Contract Research Income perAcademic Staff
EU Contract Research Income perAcademic Staff
Graduates in Employment (Level 8)
Progression Rate Level 81st to 2nd Year
Non-Academic/Academic Staff ratio(Core staff)
Student FTE/Academic Staff ratio(FTE students/Core Academic staff)
Pay/Non-Pay ratio (excl. Research)
Exchequer/Non-Exchequer Fees ratio
Total Expenditure per FTE Student, SRS(excl. Depreciation & Research)
Maximum HEA GMIT Average All HEA

25
STUDENT NUMBERS
STUDENT NUMBERS
3,244
Enrolments
6,940 1,196
TOP DISCIPLINES
NEW ENTRANTS
23%
22%
16%
DOCTORATES
67%
17%
17%
PARTICIPATION
15%
6%
INTERNATIONAL STUDENTS
452 31
10% 1%
Full-time Part-time
RESEARCH
€ 2.127 m 0.2
Contract Research Income
FIRST DESTINATION OF 2018 GRADUATES
84% 88%
Institute of Technology,
Carlow
Sta
tistic
al h
ighlig
hts
1,202
New Entrants Graduates
Undergraduate
Enrolments
Postgraduate
Enrolments
Business, administration and law
Health and welfare
Engineering, Manufacturing & Construction
Natural sciences, mathematics and statistics
Information and Communication Technologies (ICTs)
Engineering, Manufacturing & Construction
Level 8
Graduates in
Employment
Level 9/10
Graduates in
Employment
Mature Students
Entrants with a Disability
17%Entrants from Disadvantaged Socio-economic
backgrounds
Doctoral
Graduates per
10 Academic
Staff

26
No. No. %
New Entrants Year 1 (Full-time Undergraduate) 1,092 Undergraduate Graduates 2,712 84%
New Entrants Year 2+ (Full-time Undergraduate) 110 Postgraduate Graduates 532 16%
Full-time Part-time Remote Total Full-time Part-time Remote Total
Other Enrolments (IoTs only) No. 0 158 0 158 Other Enrolments (IoTs only) 0% 100% 0% 100%
QQI L5 Certificate No. 0 158 0 158 QQI L5 Certificate 0% 100% 0% 100%
QQI L6 Advanced Certificate No. 0 0 0 0 QQI L6 Advanced Certificate 0% 0% 0% 0%
of which are apprenticeships No. 0 158 0 158of which are
apprenticeships 0% 100% 0% 100%
Undergraduate No. 3,794 3,146 0 6,940 Undergraduate 55% 45% 0% 85%
Foundation/Access No. 0 0 0 0 Foundation/Access 0% 0% 0% 0%
Diploma No. 0 8 0 8 Diploma 0% 100% 0% 0%
Certificate No. 28 1,521 0 1,549 Certificate 2% 98% 0% 22%
Higher Certificate No. 222 404 0 626 Higher Certificate 35% 65% 0% 9%
Ordinary Degree (L7) No. 938 420 0 1,358 Ordinary Degree (L7) 69% 31% 0% 20%
Honours Degree (L8) No. 2,606 713 0 3,319 Honours Degree (L8) 79% 21% 0% 48%
Occasional No. 0 80 0 80 Occasional 0% 100% 0% 1%
Postgraduate No. 660 536 0 1,196 Postgraduate 55% 45% 0% 15%
Postgrad Diploma No. 0 1 0 1 Postgrad Diploma 0% 100% 0% 0%
Postgrad Higher Diploma No. 180 216 0 396 Postgrad Higher Diploma 45% 55% 0% 33%
Postgrad Certificate No. 0 97 0 97 Postgrad Certificate 0% 100% 0% 8%
Masters Taught (L9) No. 331 173 0 504 Masters Taught (L9) 66% 34% 0% 42%
Masters Research (L9) No. 131 28 0 159 Masters Research (L9) 82% 18% 0% 13%
Doctorate (L10) No. 18 0 0 18 Doctorate (L10) 100% 0% 0% 2%
Occasional No. 0 21 0 21 Occasional 0% 100% 0% 2%
Total UG and PG Enrolments No. 4,454 3,682 0 8,136 Total UG and PG Enrolments 55% 45% 0% 100%
Research & Taught (L9/10) FTE 581 Research & Taught (L9/10) 14.9%
Research (L9/10) FTE 163 Research (L9/10) 4.2%
Research (L10) FTE 18 Research (L10) 0.5%
No. % No. %
Generic programmes and qualifications 0 0% Generic programmes and qualifications 0 0%
Education 11 1% Education 0 0%
Arts and humanities 129 12% Arts and humanities 0 0%
Social sciences, journalism and information 0 0% Social sciences, journalism and information 0 0%
Business, administration and law 246 23% Business, administration and law 0 0%
Natural sciences, mathematics and statistics 58 5% Natural sciences, mathematics and statistics 12 67%
Information and Communication Technologies (ICTs) 119 11% Information and Communication Technologies (ICTs) 3 17%
Engineering, Manufacturing & Construction 175 16% Engineering, Manufacturing & Construction 3 17%
Agriculture, forestry, fisheries and veterinary 11 1% Agriculture, forestry, fisheries and veterinary 0 0%
Health and welfare 238 22% Health and welfare 0 0%
Services 105 10% Services 0 0%
Total 1,092 100% Total 18 100%
No. %Mature Entrants Year 1 (Full-time Undergraduate) 165 15%Mature Entrants Year 2+ (Full-time Undergraduate) 16
No. %
Flexible Learners (PT, Distance, E-Learning, In-Service) 3,682 45%
655 7%
7%33% Regional Intake (% of Full-time Enrolments) No. %
43% from the institution's county 17%
17% from the institution's county and bordering counties 74%
No. %452 10% Erasmus Students Incoming (excl. work placements) 154
EU 68 2%Non-EU 384 9% Total no. of International (FT, PT & Erasmus Incoming) Students 637
No. % Erasmus Students Outgoing 431 1% Other Exchange Outgoing 0
EU 16 0%Non-EU 15 0%
Institute of Technology, Carlow - Profile 2018/19
STUDENT NUMBERSEntrants Graduates
Enrolments
% FTE Honours Bach Degree L8 and all PG
% FTE Honours Bach Degree L8 and all PG
% FTE Honours Bach Degree L8 and all PG
DISCIPLINARY MIXFirst Year Full-time Undergraduate New Entrants Doctorate (All modes)
PARTICIPATION(% of New Entrants)
Students in receipt of the Fund for Students with Disabilities (% of Full-
time UG & PG Enrolments)284 6%
(% of Total Enrolments incl. Flexible Learning)
Deprivation Index Scores (% of Full-time and Part-time, Undergraduate
and Postgraduate Enrolments) Springboard+ enrolments (% of National Participation) Affluent Marginally above average
Marginally Below average
Disadvantaged
INTERNATIONALISATIONInternational Students (Full-time)
(% of Full-time Enrolments)
International Students (Part-time)
(% of Part-time Enrolments)

27
Level 6 Level 7 Level 8
% % %
Generic programmes and qualifications - - - Indicator Indicator Score (out of 60)
Education - - - Higher Order Learning 37.5
Arts and humanities - 31% 20% Reflective and Integrative Learning 31.9
Social sciences, journalism and information - - - Quantitative Reasoning 19.4
Business, administration and law 31% 33% 16% Learning Strategies 31.2
Natural sciences, mathematics and statistics 21% 38% 17% Collaborative Learning 32.2
Information and Communication Technologies (ICTs) 47% 38% 16% Student-Faculty Interaction 15.9
Engineering, Manufacturing & Construction 0% 39% 18% Effective Teaching Practices 36.5
Agriculture, forestry, fisheries and veterinary - 20% 0% Quality of Interactions 40.2
Health and welfare 17% 37% 13% Supportive Environment 26.8
Services - 13% 6%
Total 28% 33% 14%
No. of Doctorate Graduates per 10 Academic Staff 0.2
No. Contract Research Income (€000) 2,127
Priority Patent Applications 0 State and Semi-State 1,698
Total Patents Granted 0 EU 252Invention Disclosures 4 Industry 170
Licence agreements (institution - private industry) 1 Other 7
Spin-out companies created 0 Contribution in respect of overheads 0
%
Level 8 Graduates in Permanent/Temporary Employment 84% Total Contract Research Income per Academic Staff €8,890
Level 8 Graduates in Further Study 9% EU Contract Research Income per Academic Staff €1,053
Level 9/10 Graduates in Permament/Temporary Employment 88%
Level 9/10 Graduates in Further Study 3%
Core Staff 367 100% Total Income (€000) 49,747 100%
Academic Staff 239 65% State Grants 22,274 45%
Support staff 128 35% Fees 22,248 45%
Contract Research & Specialist Staff 103 100% HEA Fees 2,266 5%
Academic Staff 60 58% Other Fees 19,982 40%
Support staff 43 42% Research Grants & Contracts 2,096 4%
Total Staff 470 100% Other Income 3,129 6%
Total Academic 299 64% Total Expenditure (€000) 43,641 100%
Total Support 171 36% Core - Pay 30,327 69%
Core - Non-Pay 9,508 22%
Non-Academic/Academic All Staff Ratio 0.6 Research Grants & Contracts - Pay 2,171 5%
Student FTE/Academic Staff Ratio 27 Research Grants & Contracts - Non-Pay 1,635 4%
Staff Age Profile (Proportion of Staff aged…) %20-39 19% Total Expenditure per Student (SRS)
16,250
40-54 58% Exchequer/Non-Exchequer Fees Ratio 0.1
55 and above 23%
Proportion of Academic Staff who are female 42% Pay/Non-Pay Expenditure Ratio (incl. Research) 2.9
Proportion of Staff at Most Senior Academic Grade who are Female 67% Pay/Non-Pay Expenditure Ratio (excl. Research) 3.2
Staff Qualifications (Proportion of…) %
Full-time Permanent Academic Staff with Masters or higher qual. 97%Full-time Permanent Academic Staff with Doctorate qualification 42%
All Permanent Academic Staff with Masters or higher qualification 97%All Permanent Academic Staff with Doctorate qualification 38%
Institute of Technology, Carlow - Profile 2018/19 - continued
TEACHING AND LEARNING
Non-Progression Rate from 1st to 2nd Year Engagement Indicators (Irish Survey of Student Engagement 2019)
RESEARCH, KNOWLEDGE TRANSFER AND GRADUATE OUTCOMES
2019
Graduate Outomes (2019 Graduates)
STAFF FINANCIAL DATA
1 Total expenditure per FTE student excluding research and depreciation with pension adjustments, based on
unadjusted SRS numbers.
0
50
100
150
200
250
300
350
400
Flexible Learners(as % of all Enrolment)
Participants in Labour Market Activation(Springboard)
Level 6/7 Enrolment(as % of all Enrolment)
FT Mature Entrants(as % of all FT New Entrants)
FT New Entrants from DisadvantagedBackgrounds
FTE Research Enrolment (as % of FTELevel 8 and Postgraduate Enrolment)
Doctorate Graduates per 10 AcademicStaff
Total Contract Research Income perAcademic Staff
EU Contract Research Income perAcademic Staff
Graduates in Employment (Level 8)
Progression Rate Level 81st to 2nd Year
Non-Academic/Academic Staff ratio(Core staff)
Student FTE/Academic Staff ratio(FTE students/Core Academic staff)
Pay/Non-Pay ratio (excl. Research)
Exchequer/Non-Exchequer Fees ratio
Total Expenditure per FTE Student, SRS(excl. Depreciation & Research)
Maximum HEA ITC Average All HEA

28
STUDENT NUMBERS
STUDENT NUMBERS
1,633
Enrolments
7,498 743
TOP DISCIPLINES
NEW ENTRANTS
25%
16%
15%
DOCTORATES
68%
20%
7%
PARTICIPATION
12%
7%
INTERNATIONAL STUDENTS
190 135
6% 7%
Full-time Part-time
RESEARCH
€ 5.01 m 0.1
Contract Research Income
FIRST DESTINATION OF 2018 GRADUATES
84% 95%
Institute of Technology,
Sligo
Sta
tistic
al h
ighlig
hts
928
New Entrants Graduates
Undergraduate
Enrolments
Postgraduate
Enrolments
Health and welfare
Business, administration and law
Engineering, Manufacturing & Construction
Natural sciences, mathematics and statistics
Health and welfare
Social sciences, journalism and information
Level 8
Graduates in
Employment
Level 9/10
Graduates in
Employment
Mature Students
Entrants with a Disability
16%Entrants from Disadvantaged Socio-economic
backgrounds
Doctoral
Graduates per
10 Academic
Staff

29
No. No. %
New Entrants Year 1 (Full-time Undergraduate) 893 Undergraduate Graduates 1,526 93%
New Entrants Year 2+ (Full-time Undergraduate) 35 Postgraduate Graduates 107 7%
Full-time Part-time Remote Total Full-time Part-time Remote Total
Other Enrolments (IoTs only) No. 0 406 0 406 Other Enrolments (IoTs only) 0% 100% 0% 100%
QQI L5 Certificate No. 0 0 0 0 QQI L5 Certificate 0% 0% 0% 0%
QQI L6 Advanced Certificate No. 0 406 0 406 QQI L6 Advanced Certificate 0% 100% 0% 100%
of which are apprenticeships No. 0 406 0 406of which are
apprenticeships 0% 100% 0% 100%
Undergraduate No. 3,310 1,833 2,355 7,498 Undergraduate 44% 24% 31% 91%
Foundation/Access No. 0 0 0 0 Foundation/Access 0% 0% 0% 0%
Diploma No. 0 0 0 0 Diploma 0% 0% 0% 0%
Certificate No. 4 1,754 856 2,614 Certificate 0% 67% 33% 35%
Higher Certificate No. 145 12 188 345 Higher Certificate 42% 3% 54% 5%
Ordinary Degree (L7) No. 1,232 62 764 2,058 Ordinary Degree (L7) 60% 3% 37% 27%
Honours Degree (L8) No. 1,929 5 547 2,481 Honours Degree (L8) 78% 0% 22% 33%
Occasional No. 0 0 0 0 Occasional 0% 0% 0% 0%
Postgraduate No. 107 6 630 743 Postgraduate 14% 1% 85% 9%
Postgrad Diploma No. 0 0 88 88 Postgrad Diploma 0% 0% 100% 12%
Postgrad Higher Diploma No. 0 0 43 43 Postgrad Higher Diploma 0% 0% 100% 6%
Postgrad Certificate No. 0 0 199 199 Postgrad Certificate 0% 0% 100% 27%
Masters Taught (L9) No. 32 0 300 332 Masters Taught (L9) 10% 0% 90% 45%
Masters Research (L9) No. 36 4 0 40 Masters Research (L9) 90% 10% 0% 5%
Doctorate (L10) No. 39 2 0 41 Doctorate (L10) 95% 5% 0% 6%
Occasional No. 0 0 0 0 Occasional 0% 0% 0% 0%
Total UG and PG Enrolments No. 3,417 1,839 2,985 8,241 Total UG and PG Enrolments 41% 22% 36% 100%
Research & Taught (L9/10) FTE 260 Research & Taught (L9/10) 9.9%
Research (L9/10) FTE 78 Research (L9/10) 3.0%
Research (L10) FTE 40 Research (L10) 1.5%
No. % No. %
Generic programmes and qualifications 0 0% Generic programmes and qualifications 0 0%
Education 0 0% Education 0 0%
Arts and humanities 68 8% Arts and humanities 0 0%
Social sciences, journalism and information 30 3% Social sciences, journalism and information 3 7%
Business, administration and law 142 16% Business, administration and law 0 0%
Natural sciences, mathematics and statistics 90 10% Natural sciences, mathematics and statistics 28 68%
Information and Communication Technologies (ICTs) 103 12% Information and Communication Technologies (ICTs) 0 0%
Engineering, Manufacturing & Construction 133 15% Engineering, Manufacturing & Construction 0 0%
Agriculture, forestry, fisheries and veterinary 0 0% Agriculture, forestry, fisheries and veterinary 0 0%
Health and welfare 225 25% Health and welfare 8 20%
Services 102 11% Services 2 5%
Total 893 100% Total 41 100%
No. %Mature Entrants Year 1 (Full-time Undergraduate) 103 12%Mature Entrants Year 2+ (Full-time Undergraduate) 14
No. %
Flexible Learners (PT, Distance, E-Learning, In-Service) 4,824 59%
373 4%
16%32% Regional Intake (% of Full-time Enrolments) No. %
37% from the institution's county 26%
16% from the institution's county and bordering counties 55%
No. %190 6% Erasmus Students Incoming (excl. work placements) 104
EU 40 1%Non-EU 150 4% Total no. of International (FT, PT & Erasmus Incoming) Students 429
No. % Erasmus Students Outgoing 12135 7% Other Exchange Outgoing 0
EU 125 7%Non-EU 10 1%
Institute of Technology, Sligo - Profile 2018/19
STUDENT NUMBERSEntrants Graduates
Enrolments
% FTE Honours Bach Degree L8 and all PG
% FTE Honours Bach Degree L8 and all PG
% FTE Honours Bach Degree L8 and all PG
DISCIPLINARY MIXFirst Year Full-time Undergraduate New Entrants Doctorate (All modes)
PARTICIPATION(% of New Entrants)
Students in receipt of the Fund for Students with Disabilities (% of Full-
time UG & PG Enrolments)238 7%
(% of Total Enrolments incl. Flexible Learning)
Deprivation Index Scores (% of Full-time and Part-time, Undergraduate
and Postgraduate Enrolments) Springboard+ enrolments (% of National Participation) Affluent Marginally above average
Marginally Below average
Disadvantaged
INTERNATIONALISATIONInternational Students (Full-time)
(% of Full-time Enrolments)
International Students (Part-time)
(% of Part-time Enrolments)
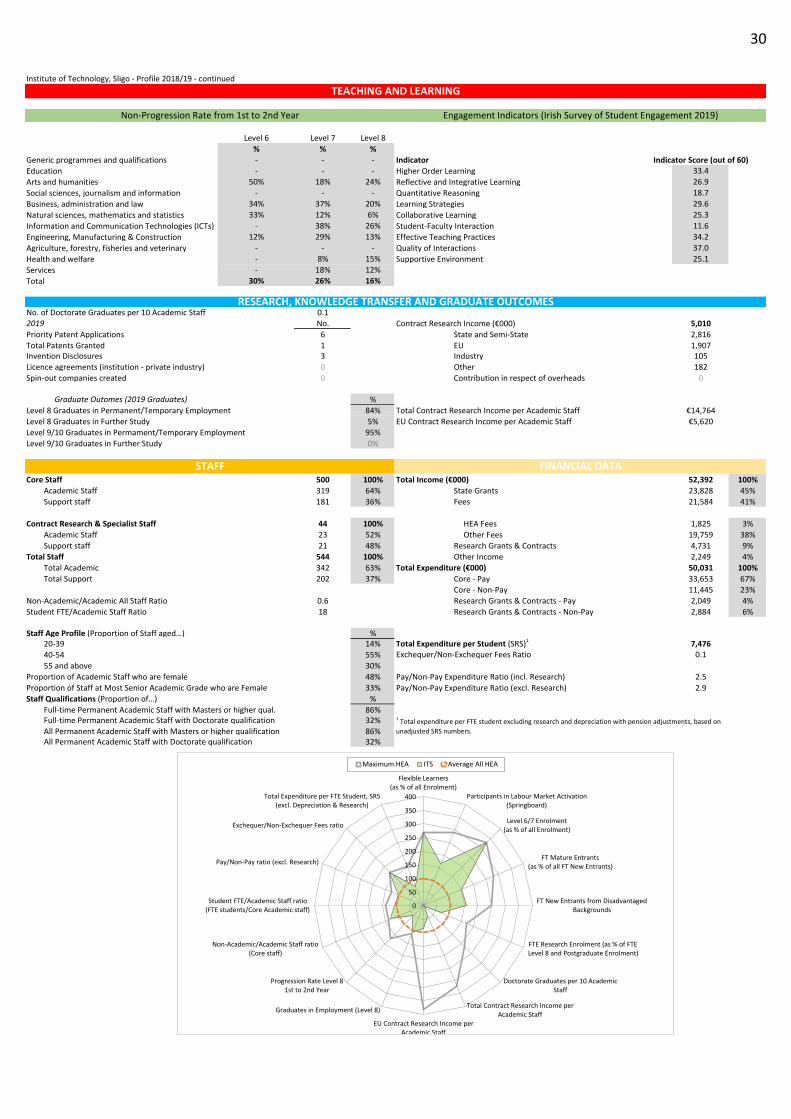
30
Level 6 Level 7 Level 8
% % %
Generic programmes and qualifications - - - Indicator Indicator Score (out of 60)
Education - - - Higher Order Learning 33.4
Arts and humanities 50% 18% 24% Reflective and Integrative Learning 26.9
Social sciences, journalism and information - - - Quantitative Reasoning 18.7
Business, administration and law 34% 37% 20% Learning Strategies 29.6
Natural sciences, mathematics and statistics 33% 12% 6% Collaborative Learning 25.3
Information and Communication Technologies (ICTs) - 38% 26% Student-Faculty Interaction 11.6
Engineering, Manufacturing & Construction 12% 29% 13% Effective Teaching Practices 34.2
Agriculture, forestry, fisheries and veterinary - - - Quality of Interactions 37.0
Health and welfare - 8% 15% Supportive Environment 25.1
Services - 18% 12%
Total 30% 26% 16%
No. of Doctorate Graduates per 10 Academic Staff 0.1
No. Contract Research Income (€000) 5,010
Priority Patent Applications 6 State and Semi-State 2,816
Total Patents Granted 1 EU 1,907Invention Disclosures 3 Industry 105
Licence agreements (institution - private industry) 0 Other 182
Spin-out companies created 0 Contribution in respect of overheads 0
%
Level 8 Graduates in Permanent/Temporary Employment 84% Total Contract Research Income per Academic Staff €14,764
Level 8 Graduates in Further Study 5% EU Contract Research Income per Academic Staff €5,620
Level 9/10 Graduates in Permament/Temporary Employment 95%
Level 9/10 Graduates in Further Study 0%
Core Staff 500 100% Total Income (€000) 52,392 100%
Academic Staff 319 64% State Grants 23,828 45%
Support staff 181 36% Fees 21,584 41%
Contract Research & Specialist Staff 44 100% HEA Fees 1,825 3%
Academic Staff 23 52% Other Fees 19,759 38%
Support staff 21 48% Research Grants & Contracts 4,731 9%
Total Staff 544 100% Other Income 2,249 4%
Total Academic 342 63% Total Expenditure (€000) 50,031 100%
Total Support 202 37% Core - Pay 33,653 67%
Core - Non-Pay 11,445 23%
Non-Academic/Academic All Staff Ratio 0.6 Research Grants & Contracts - Pay 2,049 4%
Student FTE/Academic Staff Ratio 18 Research Grants & Contracts - Non-Pay 2,884 6%
Staff Age Profile (Proportion of Staff aged…) %20-39 14% Total Expenditure per Student (SRS)
17,476
40-54 55% Exchequer/Non-Exchequer Fees Ratio 0.1
55 and above 30%
Proportion of Academic Staff who are female 48% Pay/Non-Pay Expenditure Ratio (incl. Research) 2.5
Proportion of Staff at Most Senior Academic Grade who are Female 33% Pay/Non-Pay Expenditure Ratio (excl. Research) 2.9
Staff Qualifications (Proportion of…) %
Full-time Permanent Academic Staff with Masters or higher qual. 86%Full-time Permanent Academic Staff with Doctorate qualification 32%
All Permanent Academic Staff with Masters or higher qualification 86%All Permanent Academic Staff with Doctorate qualification 32%
Institute of Technology, Sligo - Profile 2018/19 - continued
TEACHING AND LEARNING
Non-Progression Rate from 1st to 2nd Year Engagement Indicators (Irish Survey of Student Engagement 2019)
RESEARCH, KNOWLEDGE TRANSFER AND GRADUATE OUTCOMES
2019
Graduate Outomes (2019 Graduates)
STAFF FINANCIAL DATA
1 Total expenditure per FTE student excluding research and depreciation with pension adjustments, based on
unadjusted SRS numbers.
0
50
100
150
200
250
300
350
400
Flexible Learners(as % of all Enrolment)
Participants in Labour Market Activation(Springboard)
Level 6/7 Enrolment(as % of all Enrolment)
FT Mature Entrants(as % of all FT New Entrants)
FT New Entrants from DisadvantagedBackgrounds
FTE Research Enrolment (as % of FTELevel 8 and Postgraduate Enrolment)
Doctorate Graduates per 10 AcademicStaff
Total Contract Research Income perAcademic Staff
EU Contract Research Income perAcademic Staff
Graduates in Employment (Level 8)
Progression Rate Level 81st to 2nd Year
Non-Academic/Academic Staff ratio(Core staff)
Student FTE/Academic Staff ratio(FTE students/Core Academic staff)
Pay/Non-Pay ratio (excl. Research)
Exchequer/Non-Exchequer Fees ratio
Total Expenditure per FTE Student, SRS(excl. Depreciation & Research)
Maximum HEA ITS Average All HEA

31
STUDENT NUMBERS
STUDENT NUMBERS
874
Enrolments
3,023 117
TOP DISCIPLINES
NEW ENTRANTS
48%
14%
11%
DOCTORATES
75%
25%
PARTICIPATION
11%
7%
INTERNATIONAL STUDENTS
385 2
16% 1%
Full-time Part-time
RESEARCH
€ 3.314 m
Contract Research Income
FIRST DESTINATION OF 2018 GRADUATES
85% 100%
Institute of Technology,
Tralee
Sta
tistic
al h
ighlig
hts
757
New Entrants Graduates
Undergraduate
Enrolments
Postgraduate
Enrolments
Health and welfare
Services
Natural sciences, mathematics and statistics
Arts and humanities
Natural sciences, mathematics and statistics
Level 8
Graduates in
Employment
Level 9/10
Graduates in
Employment
Mature Students
Entrants with a Disability
13%Entrants from Disadvantaged Socio-economic
backgrounds

32
No. No. %
New Entrants Year 1 (Full-time Undergraduate) 749 Undergraduate Graduates 801 92%
New Entrants Year 2+ (Full-time Undergraduate) 8 Postgraduate Graduates 73 8%
Full-time Part-time Remote Total Full-time Part-time Remote Total
Other Enrolments (IoTs only) No. 0 102 0 102 Other Enrolments (IoTs only) 0% 100% 0% 100%
QQI L5 Certificate No. 0 0 0 0 QQI L5 Certificate 0% 0% 0% 0%
QQI L6 Advanced Certificate No. 0 102 0 102 QQI L6 Advanced Certificate 0% 100% 0% 100%
of which are apprenticeships No. 0 102 0 102of which are
apprenticeships 0% 100% 0% 100%
Undergraduate No. 2,376 312 335 3,023 Undergraduate 79% 10% 11% 96%
Foundation/Access No. 4 25 0 29 Foundation/Access 14% 86% 0% 1%
Diploma No. 0 0 0 0 Diploma 0% 0% 0% 0%
Certificate No. 168 145 238 551 Certificate 30% 26% 43% 18%
Higher Certificate No. 65 103 1 169 Higher Certificate 38% 61% 1% 6%
Ordinary Degree (L7) No. 680 17 91 788 Ordinary Degree (L7) 86% 2% 12% 26%
Honours Degree (L8) No. 1,442 22 5 1,469 Honours Degree (L8) 98% 1% 0% 49%
Occasional No. 17 0 0 17 Occasional 100% 0% 0% 1%
Postgraduate No. 96 21 0 117 Postgraduate 82% 18% 0% 4%
Postgrad Diploma No. 0 0 0 0 Postgrad Diploma 0% 0% 0% 0%
Postgrad Higher Diploma No. 2 6 0 8 Postgrad Higher Diploma 25% 75% 0% 7%
Postgrad Certificate No. 0 4 0 4 Postgrad Certificate 0% 100% 0% 3%
Masters Taught (L9) No. 53 5 0 58 Masters Taught (L9) 91% 9% 0% 50%
Masters Research (L9) No. 38 5 0 43 Masters Research (L9) 88% 12% 0% 37%
Doctorate (L10) No. 3 1 0 4 Doctorate (L10) 75% 25% 0% 3%
Occasional No. 0 0 0 0 Occasional 0% 0% 0% 0%
Total UG and PG Enrolments No. 2,472 333 335 3,140 Total UG and PG Enrolments 79% 11% 11% 100%
Research & Taught (L9/10) FTE 100 Research & Taught (L9/10) 6.4%
Research (L9/10) FTE 44 Research (L9/10) 2.8%
Research (L10) FTE 4 Research (L10) 0.2%
No. % No. %
Generic programmes and qualifications 0 0% Generic programmes and qualifications 0 0%
Education 0 0% Education 0 0%
Arts and humanities 36 5% Arts and humanities 3 75%
Social sciences, journalism and information 0 0% Social sciences, journalism and information 0 0%
Business, administration and law 62 8% Business, administration and law 0 0%
Natural sciences, mathematics and statistics 79 11% Natural sciences, mathematics and statistics 1 25%
Information and Communication Technologies (ICTs) 35 5% Information and Communication Technologies (ICTs) 0 0%
Engineering, Manufacturing & Construction 15 2% Engineering, Manufacturing & Construction 0 0%
Agriculture, forestry, fisheries and veterinary 59 8% Agriculture, forestry, fisheries and veterinary 0 0%
Health and welfare 359 48% Health and welfare 0 0%
Services 104 14% Services 0 0%
Total 749 100% Total 4 100%
No. %Mature Entrants Year 1 (Full-time Undergraduate) 85 11%Mature Entrants Year 2+ (Full-time Undergraduate) 4
No. %
Flexible Learners (PT, Distance, E-Learning, In-Service) 668 21%
279 3%
4%36% Regional Intake (% of Full-time Enrolments) No. %
47% from the institution's county 55%
13% from the institution's county and bordering counties 78%
No. %385 16% Erasmus Students Incoming (excl. work placements) 68
EU 12 0%Non-EU 373 15% Total no. of International (FT, PT & Erasmus Incoming) Students 455
No. % Erasmus Students Outgoing 02 1% Other Exchange Outgoing 0
EU 2 1%Non-EU 0 0%
Institute of Technology, Tralee - Profile 2018/19
STUDENT NUMBERSEntrants Graduates
Enrolments
% FTE Honours Bach Degree L8 and all PG
% FTE Honours Bach Degree L8 and all PG
% FTE Honours Bach Degree L8 and all PG
DISCIPLINARY MIXFirst Year Full-time Undergraduate New Entrants Doctorate (All modes)
PARTICIPATION(% of New Entrants)
Students in receipt of the Fund for Students with Disabilities (% of Full-
time UG & PG Enrolments)171 7%
(% of Total Enrolments incl. Flexible Learning)
Deprivation Index Scores (% of Full-time and Part-time, Undergraduate
and Postgraduate Enrolments) Springboard+ enrolments (% of National Participation) Affluent Marginally above average
Marginally Below average
Disadvantaged
INTERNATIONALISATIONInternational Students (Full-time)
(% of Full-time Enrolments)
International Students (Part-time)
(% of Part-time Enrolments)

33
Level 6 Level 7 Level 8
% % %
Generic programmes and qualifications - - - Indicator Indicator Score (out of 60)
Education - - - Higher Order Learning 33.3
Arts and humanities - 100% 21% Reflective and Integrative Learning 29.0
Social sciences, journalism and information - - - Quantitative Reasoning 18.8
Business, administration and law - 36% 9% Learning Strategies 30.0
Natural sciences, mathematics and statistics 0% 15% 18% Collaborative Learning 32.8
Information and Communication Technologies (ICTs) 11% 47% 0% Student-Faculty Interaction 14.7
Engineering, Manufacturing & Construction - 50% 0% Effective Teaching Practices 34.0
Agriculture, forestry, fisheries and veterinary - 0% 10% Quality of Interactions 36.9
Health and welfare - 26% 11% Supportive Environment 26.1
Services 29% 31% 11%
Total 18% 32% 12%
No. of Doctorate Graduates per 10 Academic Staff N/A
No. Contract Research Income (€000) 3,314
Priority Patent Applications 1 State and Semi-State 2,638
Total Patents Granted 0 EU 171Invention Disclosures 2 Industry 490
Licence agreements (institution - private industry) 5 Other 15
Spin-out companies created 0 Contribution in respect of overheads 0
%
Level 8 Graduates in Permanent/Temporary Employment 85% Total Contract Research Income per Academic Staff €15,986
Level 8 Graduates in Further Study 11% EU Contract Research Income per Academic Staff €825
Level 9/10 Graduates in Permament/Temporary Employment 100%
Level 9/10 Graduates in Further Study 0%
Core Staff 312 100% Total Income (€000) 34,145 100%
Academic Staff 200 64% State Grants 14,154 41%
Support staff 112 36% Fees 13,231 39%
Contract Research & Specialist Staff 52 100% HEA Fees 2,072 6%
Academic Staff 9 16% Other Fees 11,159 33%
Support staff 43 84% Research Grants & Contracts 3,314 10%
Total Staff 363 100% Other Income 3,446 10%
Total Academic 208 57% Total Expenditure (€000) 35,222 100%
Total Support 155 43% Core - Pay 24,330 69%
Core - Non-Pay 7,282 21%
Non-Academic/Academic All Staff Ratio 0.7 Research Grants & Contracts - Pay 2,685 8%
Student FTE/Academic Staff Ratio 14 Research Grants & Contracts - Non-Pay 925 3%
Staff Age Profile (Proportion of Staff aged…) %20-39 24% Total Expenditure per Student (SRS)
111,065
40-54 55% Exchequer/Non-Exchequer Fees Ratio 0.2
55 and above 21%
Proportion of Academic Staff who are female 50% Pay/Non-Pay Expenditure Ratio (incl. Research) 3.3
Proportion of Staff at Most Senior Academic Grade who are Female 33% Pay/Non-Pay Expenditure Ratio (excl. Research) 3.3
Staff Qualifications (Proportion of…) %
Full-time Permanent Academic Staff with Masters or higher qual. 100%Full-time Permanent Academic Staff with Doctorate qualification 29%
All Permanent Academic Staff with Masters or higher qualification 100%All Permanent Academic Staff with Doctorate qualification 27%
Institute of Technology, Tralee - Profile 2018/19 - continued
TEACHING AND LEARNING
Non-Progression Rate from 1st to 2nd Year Engagement Indicators (Irish Survey of Student Engagement 2019)
RESEARCH, KNOWLEDGE TRANSFER AND GRADUATE OUTCOMES
2019
Graduate Outomes (2019 Graduates)
STAFF FINANCIAL DATA
1 Total expenditure per FTE student excluding research and depreciation with pension adjustments, based on
unadjusted SRS numbers.
0
50
100
150
200
250
300
350
400
Flexible Learners(as % of all Enrolment)
Participants in Labour Market Activation(Springboard)
Level 6/7 Enrolment(as % of all Enrolment)
FT Mature Entrants(as % of all FT New Entrants)
FT New Entrants from DisadvantagedBackgrounds
FTE Research Enrolment (as % of FTELevel 8 and Postgraduate Enrolment)
Doctorate Graduates per 10 AcademicStaff
Total Contract Research Income perAcademic Staff
EU Contract Research Income perAcademic Staff
Graduates in Employment (Level 8)
Progression Rate Level 81st to 2nd Year
Non-Academic/Academic Staff ratio(Core staff)
Student FTE/Academic Staff ratio(FTE students/Core Academic staff)
Pay/Non-Pay ratio (excl. Research)
Exchequer/Non-Exchequer Fees ratio
Total Expenditure per FTE Student, SRS(excl. Depreciation & Research)
Maximum HEA ITTRA Average All HEA

34
STUDENT NUMBERS
STUDENT NUMBERS
1,450
Enrolments
3,487 551
TOP DISCIPLINES
NEW ENTRANTS
26%
18%
11%
DOCTORATES
60%
40%
PARTICIPATION
14%
10%
INTERNATIONAL STUDENTS
242 48
8% 5%
Full-time Part-time
RESEARCH
€ 2.599 m
Contract Research Income
FIRST DESTINATION OF 2018 GRADUATES
84% 94%
Letterkenny Institute of
Technology
Sta
tistic
al h
ighlig
hts
937
New Entrants Graduates
Undergraduate
Enrolments
Postgraduate
Enrolments
Health and welfare
Business, administration and law
Engineering, Manufacturing & Construction
Engineering, Manufacturing & Construction
Natural sciences, mathematics and statistics
Level 8
Graduates in
Employment
Level 9/10
Graduates in
Employment
Mature Students
Entrants with a Disability
25%Entrants from Disadvantaged Socio-economic
backgrounds

35
No. No. %
New Entrants Year 1 (Full-time Undergraduate) 937 Undergraduate Graduates 1,287 89%
New Entrants Year 2+ (Full-time Undergraduate) 0 Postgraduate Graduates 163 11%
Full-time Part-time Remote Total Full-time Part-time Remote Total
Other Enrolments (IoTs only) No. 0 6 0 6 Other Enrolments (IoTs only) 0% 100% 0% 100%
QQI L5 Certificate No. 0 0 0 0 QQI L5 Certificate 0% 0% 0% 0%
QQI L6 Advanced Certificate No. 0 6 0 6 QQI L6 Advanced Certificate 0% 100% 0% 100%
of which are apprenticeships No. 0 0 0 0of which are
apprenticeships 0% 0% 0% 0%
Undergraduate No. 2,860 586 41 3,487 Undergraduate 82% 17% 1% 86%
Foundation/Access No. 94 49 0 143 Foundation/Access 66% 34% 0% 4%
Diploma No. 0 13 0 13 Diploma 0% 100% 0% 0%
Certificate No. 0 253 18 271 Certificate 0% 93% 7% 8%
Higher Certificate No. 315 5 0 320 Higher Certificate 98% 2% 0% 9%
Ordinary Degree (L7) No. 992 168 23 1,183 Ordinary Degree (L7) 84% 14% 2% 34%
Honours Degree (L8) No. 1,459 98 0 1,557 Honours Degree (L8) 94% 6% 0% 45%
Occasional No. 0 0 0 0 Occasional 0% 0% 0% 0%
Postgraduate No. 157 312 82 551 Postgraduate 28% 57% 15% 14%
Postgrad Diploma No. 14 11 51 76 Postgrad Diploma 18% 14% 67% 14%
Postgrad Higher Diploma No. 10 104 31 145 Postgrad Higher Diploma 7% 72% 21% 26%
Postgrad Certificate No. 0 22 0 22 Postgrad Certificate 0% 100% 0% 4%
Masters Taught (L9) No. 109 167 0 276 Masters Taught (L9) 39% 61% 0% 50%
Masters Research (L9) No. 19 8 0 27 Masters Research (L9) 70% 30% 0% 5%
Doctorate (L10) No. 5 0 0 5 Doctorate (L10) 100% 0% 0% 1%
Occasional No. 0 0 0 0 Occasional 0% 0% 0% 0%
Total UG and PG Enrolments No. 3,017 898 123 4,038 Total UG and PG Enrolments 75% 22% 3% 100%
Research & Taught (L9/10) FTE 221 Research & Taught (L9/10) 11.8%
Research (L9/10) FTE 28 Research (L9/10) 1.5%
Research (L10) FTE 5 Research (L10) 0.3%
No. % No. %
Generic programmes and qualifications 93 10% Generic programmes and qualifications 0 0%
Education 0 0% Education 0 0%
Arts and humanities 67 7% Arts and humanities 0 0%
Social sciences, journalism and information 0 0% Social sciences, journalism and information 0 0%
Business, administration and law 172 18% Business, administration and law 0 0%
Natural sciences, mathematics and statistics 39 4% Natural sciences, mathematics and statistics 2 40%
Information and Communication Technologies (ICTs) 85 9% Information and Communication Technologies (ICTs) 0 0%
Engineering, Manufacturing & Construction 102 11% Engineering, Manufacturing & Construction 3 60%
Agriculture, forestry, fisheries and veterinary 65 7% Agriculture, forestry, fisheries and veterinary 0 0%
Health and welfare 241 26% Health and welfare 0 0%
Services 73 8% Services 0 0%
Total 937 100% Total 5 100%
No. %Mature Entrants Year 1 (Full-time Undergraduate) 128 14%Mature Entrants Year 2+ (Full-time Undergraduate) 0
No. %
Flexible Learners (PT, Distance, E-Learning, In-Service) 1,021 25%
175 2%
3%20% Regional Intake (% of Full-time Enrolments) No. %
51% from the institution's county 78%
25% from the institution's county and bordering counties 80%
No. %242 8% Erasmus Students Incoming (excl. work placements) 46
EU 96 3%Non-EU 146 5% Total no. of International (FT, PT & Erasmus Incoming) Students 336
No. % Erasmus Students Outgoing 1048 5% Other Exchange Outgoing 0
EU 45 5%Non-EU 3 0%
Letterkenny Institute of Technology - Profile 2018/19
STUDENT NUMBERSEntrants Graduates
Enrolments
% FTE Honours Bach Degree L8 and all PG
% FTE Honours Bach Degree L8 and all PG
% FTE Honours Bach Degree L8 and all PG
DISCIPLINARY MIXFirst Year Full-time Undergraduate New Entrants Doctorate (All modes)
PARTICIPATION(% of New Entrants)
Students in receipt of the Fund for Students with Disabilities (% of Full-
time UG & PG Enrolments)306 10%
(% of Total Enrolments incl. Flexible Learning)
Deprivation Index Scores (% of Full-time and Part-time, Undergraduate
and Postgraduate Enrolments) Springboard+ enrolments (% of National Participation) Affluent Marginally above average
Marginally Below average
Disadvantaged
INTERNATIONALISATIONInternational Students (Full-time)
(% of Full-time Enrolments)
International Students (Part-time)
(% of Part-time Enrolments)

36
Level 6 Level 7 Level 8
% % %
Generic programmes and qualifications - - - Indicator Indicator Score (out of 60)
Education - - - Higher Order Learning 34.4
Arts and humanities 23% 21% 7% Reflective and Integrative Learning 28.4
Social sciences, journalism and information - - - Quantitative Reasoning 19.3
Business, administration and law 27% 42% 23% Learning Strategies 29.1
Natural sciences, mathematics and statistics - 40% 8% Collaborative Learning 31.1
Information and Communication Technologies (ICTs) 30% 40% 33% Student-Faculty Interaction 16.1
Engineering, Manufacturing & Construction - 33% 30% Effective Teaching Practices 37.7
Agriculture, forestry, fisheries and veterinary - 4% - Quality of Interactions 41.6
Health and welfare 16% - 8% Supportive Environment 30.0
Services 36% 33% 11%
Total 24% 32% 15%
No. of Doctorate Graduates per 10 Academic Staff N/A
No. Contract Research Income (€000) 2,599
Priority Patent Applications 0 State and Semi-State 1,689
Total Patents Granted 0 EU 853Invention Disclosures 1 Industry 26
Licence agreements (institution - private industry) 0 Other 31
Spin-out companies created 0 Contribution in respect of overheads 0
%
Level 8 Graduates in Permanent/Temporary Employment 84% Total Contract Research Income per Academic Staff €12,685
Level 8 Graduates in Further Study 8% EU Contract Research Income per Academic Staff €4,163
Level 9/10 Graduates in Permament/Temporary Employment 94%
Level 9/10 Graduates in Further Study 2%
Core Staff 344 100% Total Income (€000) 36,007 100%
Academic Staff 205 60% State Grants 16,484 46%
Support staff 139 40% Fees 12,665 35%
Contract Research & Specialist Staff 19 100% HEA Fees 2,332 6%
Academic Staff 0 0% Other Fees 10,333 29%
Support staff 19 100% Research Grants & Contracts 2,562 7%
Total Staff 363 100% Other Income 4,296 12%
Total Academic 205 56% Total Expenditure (€000) 33,574 100%
Total Support 158 44% Core - Pay 24,646 73%
Core - Non-Pay 6,366 19%
Non-Academic/Academic All Staff Ratio 0.8 Research Grants & Contracts - Pay 1,080 3%
Student FTE/Academic Staff Ratio 17 Research Grants & Contracts - Non-Pay 1,482 4%
Staff Age Profile (Proportion of Staff aged…) %20-39 21% Total Expenditure per Student (SRS)
18,784
40-54 52% Exchequer/Non-Exchequer Fees Ratio 0.2
55 and above 28%
Proportion of Academic Staff who are female 49% Pay/Non-Pay Expenditure Ratio (incl. Research) 3.3
Proportion of Staff at Most Senior Academic Grade who are Female 25% Pay/Non-Pay Expenditure Ratio (excl. Research) 3.9
Staff Qualifications (Proportion of…) %
Full-time Permanent Academic Staff with Masters or higher qual. 36%Full-time Permanent Academic Staff with Doctorate qualification 11%
All Permanent Academic Staff with Masters or higher qualification 100%All Permanent Academic Staff with Doctorate qualification 28%
Letterkenny Institute of Technology - Profile 2018/19 - continued
TEACHING AND LEARNING
Non-Progression Rate from 1st to 2nd Year Engagement Indicators (Irish Survey of Student Engagement 2019)
RESEARCH, KNOWLEDGE TRANSFER AND GRADUATE OUTCOMES
2019
Graduate Outomes (2019 Graduates)
STAFF FINANCIAL DATA
1 Total expenditure per FTE student excluding research and depreciation with pension adjustments, based on
unadjusted SRS numbers.
0
50
100
150
200
250
300
350
400
Flexible Learners(as % of all Enrolment)
Participants in Labour Market Activation(Springboard)
Level 6/7 Enrolment(as % of all Enrolment)
FT Mature Entrants(as % of all FT New Entrants)
FT New Entrants from DisadvantagedBackgrounds
FTE Research Enrolment (as % of FTELevel 8 and Postgraduate Enrolment)
Doctorate Graduates per 10 AcademicStaff
Total Contract Research Income perAcademic Staff
EU Contract Research Income perAcademic Staff
Graduates in Employment (Level 8)
Progression Rate Level 81st to 2nd Year
Non-Academic/Academic Staff ratio(Core staff)
Student FTE/Academic Staff ratio(FTE students/Core Academic staff)
Pay/Non-Pay ratio (excl. Research)
Exchequer/Non-Exchequer Fees ratio
Total Expenditure per FTE Student, SRS(excl. Depreciation & Research)
Maximum HEA LYIT Average All HEA

37
STUDENT NUMBERS
STUDENT NUMBERS
1,722
Enrolments
5,990 299
TOP DISCIPLINES
NEW ENTRANTS
21%
19%
16%
DOCTORATES
40%
32%
8%
PARTICIPATION
14%
6%
INTERNATIONAL STUDENTS
238 8
5% 1%
Full-time Part-time
RESEARCH
€ 3.63 m 0.0
Contract Research Income
FIRST DESTINATION OF 2018 GRADUATES
85% 97%
Limerick Institute of
Technology
Sta
tistic
al h
ighlig
hts
1,547
New Entrants Graduates
Undergraduate
Enrolments
Postgraduate
Enrolments
Engineering, Manufacturing & Construction
Business, administration and law
Arts and humanities
Natural sciences, mathematics and statistics
Arts and humanities
Social sciences, journalism and information
Level 8
Graduates in
Employment
Level 9/10
Graduates in
Employment
Mature Students
Entrants with a Disability
14%Entrants from Disadvantaged Socio-economic
backgrounds
Doctoral
Graduates per
10 Academic
Staff

38
No. No. %
New Entrants Year 1 (Full-time Undergraduate) 1,509 Undergraduate Graduates 1,588 92%
New Entrants Year 2+ (Full-time Undergraduate) 38 Postgraduate Graduates 134 8%
Full-time Part-time Remote Total Full-time Part-time Remote Total
Other Enrolments (IoTs only) No. 1 455 0 456 Other Enrolments (IoTs only) 0% 100% 0% 100%
QQI L5 Certificate No. 1 0 0 1 QQI L5 Certificate 100% 0% 0% 0%
QQI L6 Advanced Certificate No. 0 455 0 455 QQI L6 Advanced Certificate 0% 100% 0% 100%
of which are apprenticeships No. 0 455 0 455of which are
apprenticeships 0% 100% 0% 100%
Undergraduate No. 5,018 972 0 5,990 Undergraduate 84% 16% 0% 95%
Foundation/Access No. 0 0 0 0 Foundation/Access 0% 0% 0% 0%
Diploma No. 1 47 0 48 Diploma 2% 98% 0% 1%
Certificate No. 1 381 0 382 Certificate 0% 100% 0% 6%
Higher Certificate No. 412 37 0 449 Higher Certificate 92% 8% 0% 7%
Ordinary Degree (L7) No. 1,018 231 0 1,249 Ordinary Degree (L7) 82% 18% 0% 21%
Honours Degree (L8) No. 3,585 59 0 3,644 Honours Degree (L8) 98% 2% 0% 61%
Occasional No. 1 217 0 218 Occasional 0% 100% 0% 4%
Postgraduate No. 173 126 0 299 Postgraduate 58% 42% 0% 5%
Postgrad Diploma No. 4 0 0 4 Postgrad Diploma 100% 0% 0% 1%
Postgrad Higher Diploma No. 36 26 0 62 Postgrad Higher Diploma 58% 42% 0% 21%
Postgrad Certificate No. 1 48 0 49 Postgrad Certificate 2% 98% 0% 16%
Masters Taught (L9) No. 53 30 0 83 Masters Taught (L9) 64% 36% 0% 28%
Masters Research (L9) No. 64 12 0 76 Masters Research (L9) 84% 16% 0% 25%
Doctorate (L10) No. 15 10 0 25 Doctorate (L10) 60% 40% 0% 8%
Occasional No. 0 0 0 0 Occasional 0% 0% 0% 0%
Total UG and PG Enrolments No. 5,191 1,098 0 6,289 Total UG and PG Enrolments 83% 17% 0% 100%
Research & Taught (L9/10) FTE 158 Research & Taught (L9/10) 4.1%
Research (L9/10) FTE 90 Research (L9/10) 2.3%
Research (L10) FTE 20 Research (L10) 0.5%
No. % No. %
Generic programmes and qualifications 0 0% Generic programmes and qualifications 0 0%
Education 0 0% Education 0 0%
Arts and humanities 243 16% Arts and humanities 8 32%
Social sciences, journalism and information 14 1% Social sciences, journalism and information 2 8%
Business, administration and law 289 19% Business, administration and law 1 4%
Natural sciences, mathematics and statistics 115 8% Natural sciences, mathematics and statistics 10 40%
Information and Communication Technologies (ICTs) 191 13% Information and Communication Technologies (ICTs) 0 0%
Engineering, Manufacturing & Construction 314 21% Engineering, Manufacturing & Construction 2 8%
Agriculture, forestry, fisheries and veterinary 0 0% Agriculture, forestry, fisheries and veterinary 0 0%
Health and welfare 183 12% Health and welfare 0 0%
Services 160 11% Services 2 8%
Total 1,509 100% Total 25 100%
No. %Mature Entrants Year 1 (Full-time Undergraduate) 208 14%Mature Entrants Year 2+ (Full-time Undergraduate) 12
No. %
Flexible Learners (PT, Distance, E-Learning, In-Service) 1,098 17%
107 1%
8%40% Regional Intake (% of Full-time Enrolments) No. %
37% from the institution's county 36%
14% from the institution's county and bordering counties 79%
No. %238 5% Erasmus Students Incoming (excl. work placements) 35
EU 22 0%Non-EU 216 4% Total no. of International (FT, PT & Erasmus Incoming) Students 281
No. % Erasmus Students Outgoing 98 1% Other Exchange Outgoing 0
EU 3 0%Non-EU 5 0%
Limerick Institute of Technology - Profile 2018/19
STUDENT NUMBERSEntrants Graduates
Enrolments
% FTE Honours Bach Degree L8 and all PG
% FTE Honours Bach Degree L8 and all PG
% FTE Honours Bach Degree L8 and all PG
DISCIPLINARY MIXFirst Year Full-time Undergraduate New Entrants Doctorate (All modes)
PARTICIPATION(% of New Entrants)
Students in receipt of the Fund for Students with Disabilities (% of Full-
time UG & PG Enrolments)337 6%
(% of Total Enrolments incl. Flexible Learning)
Deprivation Index Scores (% of Full-time and Part-time, Undergraduate
and Postgraduate Enrolments) Springboard+ enrolments (% of National Participation) Affluent Marginally above average
Marginally Below average
Disadvantaged
INTERNATIONALISATIONInternational Students (Full-time)
(% of Full-time Enrolments)
International Students (Part-time)
(% of Part-time Enrolments)

39
Level 6 Level 7 Level 8
% % %
Generic programmes and qualifications - - - Indicator Indicator Score (out of 60)
Education - - - Higher Order Learning 33.5
Arts and humanities 23% 26% 12% Reflective and Integrative Learning 28.8
Social sciences, journalism and information 0% - 50% Quantitative Reasoning 19.1
Business, administration and law 21% 0% 13% Learning Strategies 28.6
Natural sciences, mathematics and statistics - 26% 6% Collaborative Learning 32.6
Information and Communication Technologies (ICTs) 21% 43% 25% Student-Faculty Interaction 17.2
Engineering, Manufacturing & Construction 17% 33% 20% Effective Teaching Practices 34.7
Agriculture, forestry, fisheries and veterinary - - - Quality of Interactions 39.8
Health and welfare - 22% 9% Supportive Environment 27.1
Services 27% 38% 15%
Total 21% 30% 15%
No. of Doctorate Graduates per 10 Academic Staff 0.0
No. Contract Research Income (€000) 3,630
Priority Patent Applications 0 State and Semi-State 1,964
Total Patents Granted 0 EU 610Invention Disclosures 5 Industry 42
Licence agreements (institution - private industry) 1 Other 1,014
Spin-out companies created 0 Contribution in respect of overheads 0
%
Level 8 Graduates in Permanent/Temporary Employment 85% Total Contract Research Income per Academic Staff €8,891
Level 8 Graduates in Further Study 6% EU Contract Research Income per Academic Staff €1,494
Level 9/10 Graduates in Permament/Temporary Employment 97%
Level 9/10 Graduates in Further Study 0%
Core Staff 585 100% Total Income (€000) 61,281 100%
Academic Staff 388 66% State Grants 30,833 50%
Support staff 197 34% Fees 22,370 37%
Contract Research & Specialist Staff 63 100% HEA Fees 3,091 5%
Academic Staff 39 61% Other Fees 19,279 31%
Support staff 24 39% Research Grants & Contracts 4,017 7%
Total Staff 648 100% Other Income 4,061 7%
Total Academic 427 66% Total Expenditure (€000) 60,407 100%
Total Support 222 34% Core - Pay 44,349 73%
Core - Non-Pay 12,041 20%
Non-Academic/Academic All Staff Ratio 0.5 Research Grants & Contracts - Pay 1,812 3%
Student FTE/Academic Staff Ratio 15 Research Grants & Contracts - Non-Pay 2,205 4%
Staff Age Profile (Proportion of Staff aged…) %20-39 21% Total Expenditure per Student (SRS)
19,448
40-54 57% Exchequer/Non-Exchequer Fees Ratio 0.2
55 and above 22%
Proportion of Academic Staff who are female 42% Pay/Non-Pay Expenditure Ratio (incl. Research) 3.2
Proportion of Staff at Most Senior Academic Grade who are Female 40% Pay/Non-Pay Expenditure Ratio (excl. Research) 3.7
Staff Qualifications (Proportion of…) %
Full-time Permanent Academic Staff with Masters or higher qual. 82%Full-time Permanent Academic Staff with Doctorate qualification 20%
All Permanent Academic Staff with Masters or higher qualification 82%All Permanent Academic Staff with Doctorate qualification 19%
Limerick Institute of Technology - Profile 2018/19 - continued
TEACHING AND LEARNING
Non-Progression Rate from 1st to 2nd Year Engagement Indicators (Irish Survey of Student Engagement 2019)
RESEARCH, KNOWLEDGE TRANSFER AND GRADUATE OUTCOMES
2019
Graduate Outomes (2019 Graduates)
STAFF FINANCIAL DATA
1 Total expenditure per FTE student excluding research and depreciation with pension adjustments, based on
unadjusted SRS numbers.
0
50
100
150
200
250
300
350
400
Flexible Learners(as % of all Enrolment)
Participants in Labour Market Activation(Springboard)
Level 6/7 Enrolment(as % of all Enrolment)
FT Mature Entrants(as % of all FT New Entrants)
FT New Entrants from DisadvantagedBackgrounds
FTE Research Enrolment (as % of FTELevel 8 and Postgraduate Enrolment)
Doctorate Graduates per 10 AcademicStaff
Total Contract Research Income perAcademic Staff
EU Contract Research Income perAcademic Staff
Graduates in Employment (Level 8)
Progression Rate Level 81st to 2nd Year
Non-Academic/Academic Staff ratio(Core staff)
Student FTE/Academic Staff ratio(FTE students/Core Academic staff)
Pay/Non-Pay ratio (excl. Research)
Exchequer/Non-Exchequer Fees ratio
Total Expenditure per FTE Student, SRS(excl. Depreciation & Research)
Maximum HEA LIT Average All HEA

40
STUDENT NUMBERS
STUDENT NUMBERS
1,897
Enrolments
4,417 589
TOP DISCIPLINES
NEW ENTRANTS
69%
31%
DOCTORATES
50%
31%
19%
PARTICIPATION
2%
1%
INTERNATIONAL STUDENTS
77 2
2% 0%
Full-time Part-time
RESEARCH
€ 1.499 m 0.8
Contract Research Income
FIRST DESTINATION OF 2018 GRADUATES
72% 80%
Mary Immaculate College,
Limerick
Sta
tistic
al h
ighlig
hts
904
New Entrants Graduates
Undergraduate
Enrolments
Postgraduate
Enrolments
Education
Arts and humanities
Arts and humanities
Education
Social sciences, journalism and information
Level 8
Graduates in
Employment
Level 9/10
Graduates in
Employment
Mature Students
Entrants with a Disability
9%Entrants from Disadvantaged Socio-economic
backgrounds
Doctoral
Graduates per
10 Academic
Staff

41
No. No. %
New Entrants Year 1 (Full-time Undergraduate) 904 Undergraduate Graduates 1,603 85%
New Entrants Year 2+ (Full-time Undergraduate) 0 Postgraduate Graduates 294 15%
Full-time Part-time Remote Total Full-time Part-time Remote Total
Other Enrolments (IoTs only) No. 0 0 0 0 Other Enrolments (IoTs only) 0% 0% 0% 0%
QQI L5 Certificate No. 0 0 0 0 QQI L5 Certificate 0% 0% 0% 0%
QQI L6 Advanced Certificate No. 0 0 0 0 QQI L6 Advanced Certificate 0% 0% 0% 0%
of which are apprenticeships No. 0 0 0 0of which are
apprenticeships 0% 0% 0% 0%
Undergraduate No. 3,463 954 0 4,417 Undergraduate 78% 22% 0% 88%
Foundation/Access No. 0 13 0 13 Foundation/Access 0% 100% 0% 0%
Diploma No. 0 0 0 0 Diploma 0% 0% 0% 0%
Certificate No. 0 941 0 941 Certificate 0% 100% 0% 21%
Higher Certificate No. 0 0 0 0 Higher Certificate 0% 0% 0% 0%
Ordinary Degree (L7) No. 39 0 0 39 Ordinary Degree (L7) 100% 0% 0% 1%
Honours Degree (L8) No. 3,407 0 0 3,407 Honours Degree (L8) 100% 0% 0% 77%
Occasional No. 17 0 0 17 Occasional 100% 0% 0% 0%
Postgraduate No. 455 134 0 589 Postgraduate 77% 23% 0% 12%
Postgrad Diploma No. 66 0 0 66 Postgrad Diploma 100% 0% 0% 11%
Postgrad Higher Diploma No. 0 0 0 0 Postgrad Higher Diploma 0% 0% 0% 0%
Postgrad Certificate No. 20 48 0 68 Postgrad Certificate 29% 71% 0% 12%
Masters Taught (L9) No. 192 86 0 278 Masters Taught (L9) 69% 31% 0% 47%
Masters Research (L9) No. 22 0 0 22 Masters Research (L9) 100% 0% 0% 4%
Doctorate (L10) No. 155 0 0 155 Doctorate (L10) 100% 0% 0% 26%
Occasional No. 0 0 0 0 Occasional 0% 0% 0% 0%
Total UG and PG Enrolments No. 3,918 1,088 0 5,006 Total UG and PG Enrolments 78% 22% 0% 100%
Research & Taught (L9/10) FTE 412 Research & Taught (L9/10) 10.5%
Research (L9/10) FTE 177 Research (L9/10) 4.5%
Research (L10) FTE 155 Research (L10) 3.9%
No. % No. %
Generic programmes and qualifications 0 0% Generic programmes and qualifications 0 0%
Education 620 69% Education 48 31%
Arts and humanities 284 31% Arts and humanities 78 50%
Social sciences, journalism and information 0 0% Social sciences, journalism and information 29 19%
Business, administration and law 0 0% Business, administration and law 0 0%
Natural sciences, mathematics and statistics 0 0% Natural sciences, mathematics and statistics 0 0%
Information and Communication Technologies (ICTs) 0 0% Information and Communication Technologies (ICTs) 0 0%
Engineering, Manufacturing & Construction 0 0% Engineering, Manufacturing & Construction 0 0%
Agriculture, forestry, fisheries and veterinary 0 0% Agriculture, forestry, fisheries and veterinary 0 0%
Health and welfare 0 0% Health and welfare 0 0%
Services 0 0% Services 0 0%
Total 904 100% Total 155 100%
No. %Mature Entrants Year 1 (Full-time Undergraduate) 18 2%Mature Entrants Year 2+ (Full-time Undergraduate) 0
No. %
Flexible Learners (PT, Distance, E-Learning, In-Service) 1,088 22%
0 0%
9%47% Regional Intake (% of Full-time Enrolments) No. %
35% from the institution's county 20%
9% from the institution's county and bordering counties 69%
No. %77 2% Erasmus Students Incoming (excl. work placements) 50
EU 25 1%Non-EU 52 1% Total no. of International (FT, PT & Erasmus Incoming) Students 129
No. % Erasmus Students Outgoing 662 0% Other Exchange Outgoing 9
EU 2 0%Non-EU 0 0%
Mary Immaculate College, Limerick - Profile 2018/19
STUDENT NUMBERSEntrants Graduates
Enrolments
% FTE Honours Bach Degree L8 and all PG
% FTE Honours Bach Degree L8 and all PG
% FTE Honours Bach Degree L8 and all PG
DISCIPLINARY MIXFirst Year Full-time Undergraduate New Entrants Doctorate (All modes)
PARTICIPATION(% of New Entrants)
Students in receipt of the Fund for Students with Disabilities (% of Full-
time UG & PG Enrolments)53 1%
(% of Total Enrolments incl. Flexible Learning)
Deprivation Index Scores (% of Full-time and Part-time, Undergraduate
and Postgraduate Enrolments) Springboard+ enrolments (% of National Participation) Affluent Marginally above average
Marginally Below average
Disadvantaged
INTERNATIONALISATIONInternational Students (Full-time)
(% of Full-time Enrolments)
International Students (Part-time)
(% of Part-time Enrolments)
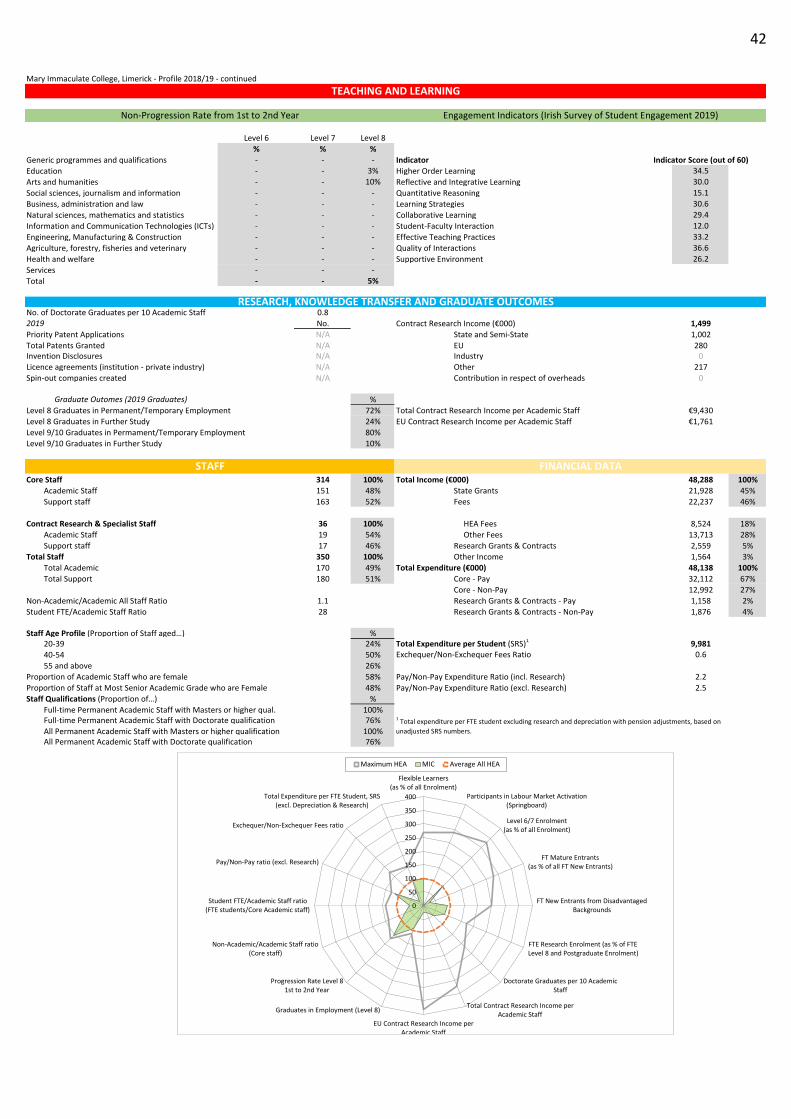
42
Level 6 Level 7 Level 8
% % %
Generic programmes and qualifications - - - Indicator Indicator Score (out of 60)
Education - - 3% Higher Order Learning 34.5
Arts and humanities - - 10% Reflective and Integrative Learning 30.0
Social sciences, journalism and information - - - Quantitative Reasoning 15.1
Business, administration and law - - - Learning Strategies 30.6
Natural sciences, mathematics and statistics - - - Collaborative Learning 29.4
Information and Communication Technologies (ICTs) - - - Student-Faculty Interaction 12.0
Engineering, Manufacturing & Construction - - - Effective Teaching Practices 33.2
Agriculture, forestry, fisheries and veterinary - - - Quality of Interactions 36.6
Health and welfare - - - Supportive Environment 26.2
Services - - -
Total - - 5%
No. of Doctorate Graduates per 10 Academic Staff 0.8
No. Contract Research Income (€000) 1,499
Priority Patent Applications N/A State and Semi-State 1,002
Total Patents Granted N/A EU 280Invention Disclosures N/A Industry 0
Licence agreements (institution - private industry) N/A Other 217
Spin-out companies created N/A Contribution in respect of overheads 0
%
Level 8 Graduates in Permanent/Temporary Employment 72% Total Contract Research Income per Academic Staff €9,430
Level 8 Graduates in Further Study 24% EU Contract Research Income per Academic Staff €1,761
Level 9/10 Graduates in Permament/Temporary Employment 80%
Level 9/10 Graduates in Further Study 10%
Core Staff 314 100% Total Income (€000) 48,288 100%
Academic Staff 151 48% State Grants 21,928 45%
Support staff 163 52% Fees 22,237 46%
Contract Research & Specialist Staff 36 100% HEA Fees 8,524 18%
Academic Staff 19 54% Other Fees 13,713 28%
Support staff 17 46% Research Grants & Contracts 2,559 5%
Total Staff 350 100% Other Income 1,564 3%
Total Academic 170 49% Total Expenditure (€000) 48,138 100%
Total Support 180 51% Core - Pay 32,112 67%
Core - Non-Pay 12,992 27%
Non-Academic/Academic All Staff Ratio 1.1 Research Grants & Contracts - Pay 1,158 2%
Student FTE/Academic Staff Ratio 28 Research Grants & Contracts - Non-Pay 1,876 4%
Staff Age Profile (Proportion of Staff aged…) %20-39 24% Total Expenditure per Student (SRS)
19,981
40-54 50% Exchequer/Non-Exchequer Fees Ratio 0.6
55 and above 26%
Proportion of Academic Staff who are female 58% Pay/Non-Pay Expenditure Ratio (incl. Research) 2.2
Proportion of Staff at Most Senior Academic Grade who are Female 48% Pay/Non-Pay Expenditure Ratio (excl. Research) 2.5
Staff Qualifications (Proportion of…) %
Full-time Permanent Academic Staff with Masters or higher qual. 100%Full-time Permanent Academic Staff with Doctorate qualification 76%
All Permanent Academic Staff with Masters or higher qualification 100%All Permanent Academic Staff with Doctorate qualification 76%
Mary Immaculate College, Limerick - Profile 2018/19 - continued
TEACHING AND LEARNING
Non-Progression Rate from 1st to 2nd Year Engagement Indicators (Irish Survey of Student Engagement 2019)
RESEARCH, KNOWLEDGE TRANSFER AND GRADUATE OUTCOMES
2019
Graduate Outomes (2019 Graduates)
STAFF FINANCIAL DATA
1 Total expenditure per FTE student excluding research and depreciation with pension adjustments, based on
unadjusted SRS numbers.
0
50
100
150
200
250
300
350
400
Flexible Learners(as % of all Enrolment)
Participants in Labour Market Activation(Springboard)
Level 6/7 Enrolment(as % of all Enrolment)
FT Mature Entrants(as % of all FT New Entrants)
FT New Entrants from DisadvantagedBackgrounds
FTE Research Enrolment (as % of FTELevel 8 and Postgraduate Enrolment)
Doctorate Graduates per 10 AcademicStaff
Total Contract Research Income perAcademic Staff
EU Contract Research Income perAcademic Staff
Graduates in Employment (Level 8)
Progression Rate Level 81st to 2nd Year
Non-Academic/Academic Staff ratio(Core staff)
Student FTE/Academic Staff ratio(FTE students/Core Academic staff)
Pay/Non-Pay ratio (excl. Research)
Exchequer/Non-Exchequer Fees ratio
Total Expenditure per FTE Student, SRS(excl. Depreciation & Research)
Maximum HEA MIC Average All HEA

43
STUDENT NUMBERS
STUDENT NUMBERS
3,989
Enrolments
10,451 2,160
TOP DISCIPLINES
NEW ENTRANTS
47%
21%
13%
DOCTORATES
29%
22%
17%
PARTICIPATION
6%
9%
INTERNATIONAL STUDENTS
776 108
7% 6%
Full-time Part-time
RESEARCH
€ 28.067 m 1.2
Contract Research Income
FIRST DESTINATION OF 2018 GRADUATES
67% 85%
Maynooth University
Sta
tistic
al h
ighlig
hts
3,225
New Entrants Graduates
Undergraduate
Enrolments
Postgraduate
Enrolments
Arts and humanities
Business, administration and law
Natural sciences, mathematics and statistics
Natural sciences, mathematics and statistics
Education
Arts and humanities
Level 8
Graduates in
Employment
Level 9/10
Graduates in
Employment
Mature Students
Entrants with a Disability
10%Entrants from Disadvantaged Socio-economic
backgrounds
Doctoral
Graduates per
10 Academic
Staff

44
No. No. %
New Entrants Year 1 (Full-time Undergraduate) 3,225 Undergraduate Graduates 2,709 68%
New Entrants Year 2+ (Full-time Undergraduate) 0 Postgraduate Graduates 1,280 32%
Full-time Part-time Remote Total Full-time Part-time Remote Total
Other Enrolments (IoTs only) No. 0 0 0 0 Other Enrolments (IoTs only) 0% 0% 0% 0%
QQI L5 Certificate No. 0 0 0 0 QQI L5 Certificate 0% 0% 0% 0%
QQI L6 Advanced Certificate No. 0 0 0 0 QQI L6 Advanced Certificate 0% 0% 0% 0%
of which are apprenticeships No. 0 0 0 0of which are
apprenticeships 0% 0% 0% 0%
Undergraduate No. 9,507 944 0 10,451 Undergraduate 91% 9% 0% 83%
Foundation/Access No. 0 41 0 41 Foundation/Access 0% 100% 0% 0%
Diploma No. 24 187 0 211 Diploma 11% 89% 0% 2%
Certificate No. 45 459 0 504 Certificate 9% 91% 0% 5%
Higher Certificate No. 0 0 0 0 Higher Certificate 0% 0% 0% 0%
Ordinary Degree (L7) No. 0 0 0 0 Ordinary Degree (L7) 0% 0% 0% 0%
Honours Degree (L8) No. 9,124 197 0 9,321 Honours Degree (L8) 98% 2% 0% 89%
Occasional No. 314 60 0 374 Occasional 84% 16% 0% 4%
Postgraduate No. 1,311 849 0 2,160 Postgraduate 61% 39% 0% 17%
Postgrad Diploma No. 4 401 0 405 Postgrad Diploma 1% 99% 0% 19%
Postgrad Higher Diploma No. 129 2 0 131 Postgrad Higher Diploma 98% 2% 0% 6%
Postgrad Certificate No. 0 44 0 44 Postgrad Certificate 0% 100% 0% 2%
Masters Taught (L9) No. 830 250 0 1,080 Masters Taught (L9) 77% 23% 0% 50%
Masters Research (L9) No. 37 3 0 40 Masters Research (L9) 93% 8% 0% 2%
Doctorate (L10) No. 310 110 0 420 Doctorate (L10) 74% 26% 0% 19%
Occasional No. 1 39 0 40 Occasional 3% 98% 0% 2%
Total UG and PG Enrolments No. 10,818 1,793 0 12,611 Total UG and PG Enrolments 86% 14% 0% 100%
Research & Taught (L9/10) FTE 1,359 Research & Taught (L9/10) 12.4%
Research (L9/10) FTE 404 Research (L9/10) 3.7%
Research (L10) FTE 365 Research (L10) 3.3%
No. % No. %
Generic programmes and qualifications 0 0% Generic programmes and qualifications 0 0%
Education 89 3% Education 93 22%
Arts and humanities 1,514 47% Arts and humanities 71 17%
Social sciences, journalism and information 267 8% Social sciences, journalism and information 51 12%
Business, administration and law 675 21% Business, administration and law 31 7%
Natural sciences, mathematics and statistics 424 13% Natural sciences, mathematics and statistics 122 29%
Information and Communication Technologies (ICTs) 91 3% Information and Communication Technologies (ICTs) 25 6%
Engineering, Manufacturing & Construction 96 3% Engineering, Manufacturing & Construction 19 5%
Agriculture, forestry, fisheries and veterinary 0 0% Agriculture, forestry, fisheries and veterinary 0 0%
Health and welfare 69 2% Health and welfare 8 2%
Services 0 0% Services 0 0%
Total 3,225 100% Total 420 100%
No. %Mature Entrants Year 1 (Full-time Undergraduate) 205 6%Mature Entrants Year 2+ (Full-time Undergraduate) 0
No. %
Flexible Learners (PT, Distance, E-Learning, In-Service) 1,793 14%
47 0%
17%43% Regional Intake (% of Full-time Enrolments) No. %
30% from the institution's county 19%
10% from the institution's county and bordering counties 68%
No. %776 7% Erasmus Students Incoming (excl. work placements) 348
EU 163 2%Non-EU 613 6% Total no. of International (FT, PT & Erasmus Incoming) Students 1,232
No. % Erasmus Students Outgoing 166108 6% Other Exchange Outgoing 24
EU 52 3%Non-EU 56 3%
Maynooth University - Profile 2018/19
STUDENT NUMBERSEntrants Graduates
Enrolments
% FTE Honours Bach Degree L8 and all PG
% FTE Honours Bach Degree L8 and all PG
% FTE Honours Bach Degree L8 and all PG
DISCIPLINARY MIXFirst Year Full-time Undergraduate New Entrants Doctorate (All modes)
PARTICIPATION(% of New Entrants)
Students in receipt of the Fund for Students with Disabilities (% of Full-
time UG & PG Enrolments)935 9%
(% of Total Enrolments incl. Flexible Learning)
Deprivation Index Scores (% of Full-time and Part-time, Undergraduate
and Postgraduate Enrolments) Springboard+ enrolments (% of National Participation) Affluent Marginally above average
Marginally Below average
Disadvantaged
INTERNATIONALISATIONInternational Students (Full-time)
(% of Full-time Enrolments)
International Students (Part-time)
(% of Part-time Enrolments)

45
Level 6 Level 7 Level 8
% % %
Generic programmes and qualifications - - - Indicator Indicator Score (out of 60)
Education - - 3% Higher Order Learning 38.7
Arts and humanities - - 16% Reflective and Integrative Learning 33.0
Social sciences, journalism and information - - 16% Quantitative Reasoning 17.3
Business, administration and law - - 9% Learning Strategies 33.4
Natural sciences, mathematics and statistics - - 13% Collaborative Learning 28.3
Information and Communication Technologies (ICTs) - - 14% Student-Faculty Interaction 12.6
Engineering, Manufacturing & Construction - - 21% Effective Teaching Practices 35.6
Agriculture, forestry, fisheries and veterinary - - - Quality of Interactions 40.6
Health and welfare - - 10% Supportive Environment 30.1
Services - - -
Total - - 13%
No. of Doctorate Graduates per 10 Academic Staff 1.2
No. Contract Research Income (€000) 28,067
Priority Patent Applications 5 State and Semi-State 9,114
Total Patents Granted 1 EU 2,736Invention Disclosures 8 Industry 424
Licence agreements (institution - private industry) 4 Other 13,410
Spin-out companies created 0 Contribution in respect of overheads 2,383
%
Level 8 Graduates in Permanent/Temporary Employment 67% Total Contract Research Income per Academic Staff €60,607
Level 8 Graduates in Further Study 26% EU Contract Research Income per Academic Staff €5,908
Level 9/10 Graduates in Permament/Temporary Employment 85%
Level 9/10 Graduates in Further Study 5%
Core Staff 553 100% Total Income (€000) 141,808 100%
Academic Staff 298 54% State Grants 26,423 19%
Support staff 255 46% Fees 73,540 52%
Contract Research & Specialist Staff 481 100% HEA Fees 27,724 20%
Academic Staff 260 54% Other Fees 45,816 32%
Support staff 220 46% Research Grants & Contracts 28,067 20%
Total Staff 1,034 100% Other Income 13,778 10%
Total Academic 559 54% Total Expenditure (€000) 135,975 100%
Total Support 475 46% Core - Pay 75,488 56%
Core - Non-Pay 32,978 24%
Non-Academic/Academic All Staff Ratio 0.8 Research Grants & Contracts - Pay 7,403 5%
Student FTE/Academic Staff Ratio 25 Research Grants & Contracts - Non-Pay 20,106 15%
Staff Age Profile (Proportion of Staff aged…) %20-39 22% Total Expenditure per Student (SRS)
18,625
40-54 51% Exchequer/Non-Exchequer Fees Ratio 0.6
55 and above 27%
Proportion of Academic Staff who are female 40% Pay/Non-Pay Expenditure Ratio (incl. Research) 1.6
Proportion of Staff at Most Senior Academic Grade who are Female 28% Pay/Non-Pay Expenditure Ratio (excl. Research) 2.3
Staff Qualifications (Proportion of…) %
Full-time Permanent Academic Staff with Masters or higher qual. 97%Full-time Permanent Academic Staff with Doctorate qualification 89%
All Permanent Academic Staff with Masters or higher qualification 97%All Permanent Academic Staff with Doctorate qualification 88%
Maynooth University - Profile 2018/19 - continued
TEACHING AND LEARNING
Non-Progression Rate from 1st to 2nd Year Engagement Indicators (Irish Survey of Student Engagement 2019)
RESEARCH, KNOWLEDGE TRANSFER AND GRADUATE OUTCOMES
2019
Graduate Outomes (2019 Graduates)
STAFF FINANCIAL DATA
1 Total expenditure per FTE student excluding research and depreciation with pension adjustments, based on
unadjusted SRS numbers.
0
50
100
150
200
250
300
350
400
Flexible Learners(as % of all Enrolment)
Participants in Labour Market Activation(Springboard)
Level 6/7 Enrolment(as % of all Enrolment)
FT Mature Entrants(as % of all FT New Entrants)
FT New Entrants from DisadvantagedBackgrounds
FTE Research Enrolment (as % of FTELevel 8 and Postgraduate Enrolment)
Doctorate Graduates per 10 AcademicStaff
Total Contract Research Income perAcademic Staff
EU Contract Research Income perAcademic Staff
Graduates in Employment (Level 8)
Progression Rate Level 81st to 2nd Year
Non-Academic/Academic Staff ratio(Core staff)
Student FTE/Academic Staff ratio(FTE students/Core Academic staff)
Pay/Non-Pay ratio (excl. Research)
Exchequer/Non-Exchequer Fees ratio
Total Expenditure per FTE Student, SRS(excl. Depreciation & Research)
Maximum HEA MU Average All HEA

46
STUDENT NUMBERS
STUDENT NUMBERS
368
Enrolments
1,064 134
TOP DISCIPLINES
NEW ENTRANTS
87%
11%
2%
DOCTORATES
90%
10%
PARTICIPATION
8%
13%
INTERNATIONAL STUDENTS
76 4
7% 2%
Full-time Part-time
RESEARCH
€ .309 m 1.0
Contract Research Income
FIRST DESTINATION OF 2018 GRADUATES
77% 85%
National College of Art
and Design
Sta
tistic
al h
ighlig
hts
303
New Entrants Graduates
Undergraduate
Enrolments
Postgraduate
Enrolments
Arts and humanities
Education
Information and Communication Technologies (ICTs)
Arts and humanities
Education
Level 8
Graduates in
Employment
Level 9/10
Graduates in
Employment
Mature Students
Entrants with a Disability
7%Entrants from Disadvantaged Socio-economic
backgrounds
Doctoral
Graduates per
10 Academic
Staff
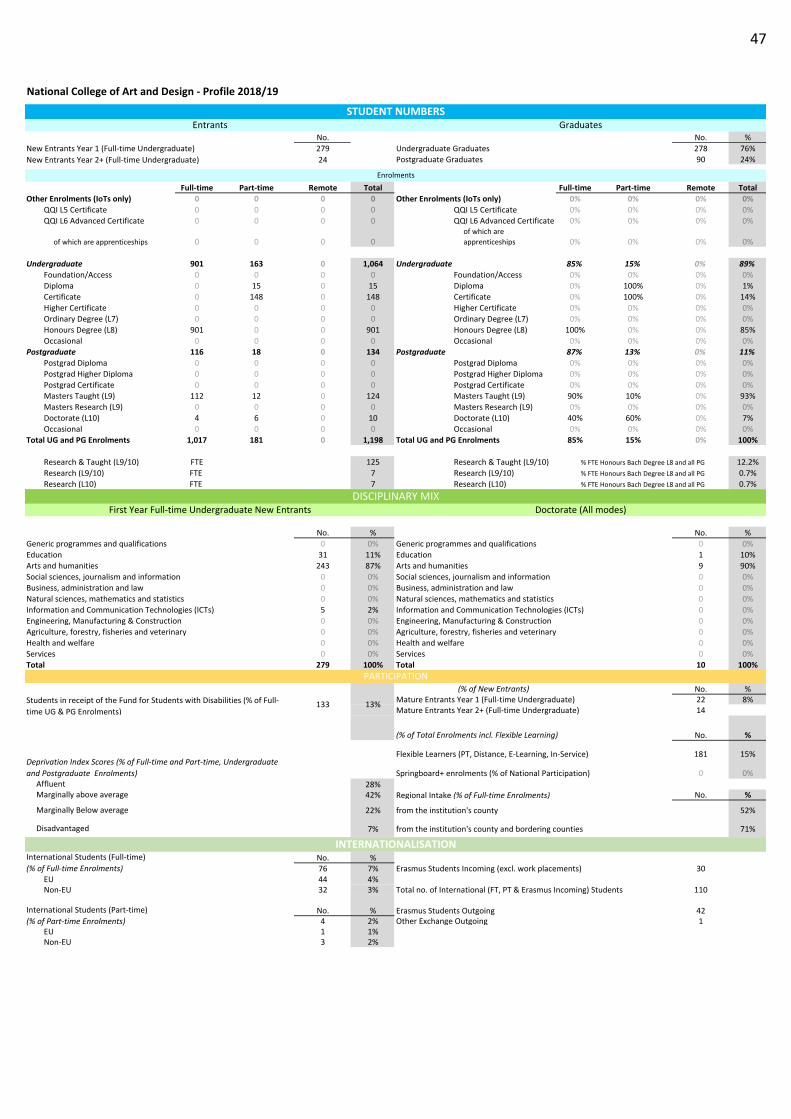
47
No. No. %
New Entrants Year 1 (Full-time Undergraduate) 279 Undergraduate Graduates 278 76%
New Entrants Year 2+ (Full-time Undergraduate) 24 Postgraduate Graduates 90 24%
Full-time Part-time Remote Total Full-time Part-time Remote Total
Other Enrolments (IoTs only) No. 0 0 0 0 Other Enrolments (IoTs only) 0% 0% 0% 0%
QQI L5 Certificate No. 0 0 0 0 QQI L5 Certificate 0% 0% 0% 0%
QQI L6 Advanced Certificate No. 0 0 0 0 QQI L6 Advanced Certificate 0% 0% 0% 0%
of which are apprenticeships No. 0 0 0 0of which are
apprenticeships 0% 0% 0% 0%
Undergraduate No. 901 163 0 1,064 Undergraduate 85% 15% 0% 89%
Foundation/Access No. 0 0 0 0 Foundation/Access 0% 0% 0% 0%
Diploma No. 0 15 0 15 Diploma 0% 100% 0% 1%
Certificate No. 0 148 0 148 Certificate 0% 100% 0% 14%
Higher Certificate No. 0 0 0 0 Higher Certificate 0% 0% 0% 0%
Ordinary Degree (L7) No. 0 0 0 0 Ordinary Degree (L7) 0% 0% 0% 0%
Honours Degree (L8) No. 901 0 0 901 Honours Degree (L8) 100% 0% 0% 85%
Occasional No. 0 0 0 0 Occasional 0% 0% 0% 0%
Postgraduate No. 116 18 0 134 Postgraduate 87% 13% 0% 11%
Postgrad Diploma No. 0 0 0 0 Postgrad Diploma 0% 0% 0% 0%
Postgrad Higher Diploma No. 0 0 0 0 Postgrad Higher Diploma 0% 0% 0% 0%
Postgrad Certificate No. 0 0 0 0 Postgrad Certificate 0% 0% 0% 0%
Masters Taught (L9) No. 112 12 0 124 Masters Taught (L9) 90% 10% 0% 93%
Masters Research (L9) No. 0 0 0 0 Masters Research (L9) 0% 0% 0% 0%
Doctorate (L10) No. 4 6 0 10 Doctorate (L10) 40% 60% 0% 7%
Occasional No. 0 0 0 0 Occasional 0% 0% 0% 0%
Total UG and PG Enrolments No. 1,017 181 0 1,198 Total UG and PG Enrolments 85% 15% 0% 100%
Research & Taught (L9/10) FTE 125 Research & Taught (L9/10) 12.2%
Research (L9/10) FTE 7 Research (L9/10) 0.7%
Research (L10) FTE 7 Research (L10) 0.7%
No. % No. %
Generic programmes and qualifications 0 0% Generic programmes and qualifications 0 0%
Education 31 11% Education 1 10%
Arts and humanities 243 87% Arts and humanities 9 90%
Social sciences, journalism and information 0 0% Social sciences, journalism and information 0 0%
Business, administration and law 0 0% Business, administration and law 0 0%
Natural sciences, mathematics and statistics 0 0% Natural sciences, mathematics and statistics 0 0%
Information and Communication Technologies (ICTs) 5 2% Information and Communication Technologies (ICTs) 0 0%
Engineering, Manufacturing & Construction 0 0% Engineering, Manufacturing & Construction 0 0%
Agriculture, forestry, fisheries and veterinary 0 0% Agriculture, forestry, fisheries and veterinary 0 0%
Health and welfare 0 0% Health and welfare 0 0%
Services 0 0% Services 0 0%
Total 279 100% Total 10 100%
No. %Mature Entrants Year 1 (Full-time Undergraduate) 22 8%Mature Entrants Year 2+ (Full-time Undergraduate) 14
No. %
Flexible Learners (PT, Distance, E-Learning, In-Service) 181 15%
0 0%
28%42% Regional Intake (% of Full-time Enrolments) No. %
22% from the institution's county 52%
7% from the institution's county and bordering counties 71%
No. %76 7% Erasmus Students Incoming (excl. work placements) 30
EU 44 4%Non-EU 32 3% Total no. of International (FT, PT & Erasmus Incoming) Students 110
No. % Erasmus Students Outgoing 424 2% Other Exchange Outgoing 1
EU 1 1%Non-EU 3 2%
National College of Art and Design - Profile 2018/19
STUDENT NUMBERSEntrants Graduates
Enrolments
% FTE Honours Bach Degree L8 and all PG
% FTE Honours Bach Degree L8 and all PG
% FTE Honours Bach Degree L8 and all PG
DISCIPLINARY MIXFirst Year Full-time Undergraduate New Entrants Doctorate (All modes)
PARTICIPATION(% of New Entrants)
Students in receipt of the Fund for Students with Disabilities (% of Full-
time UG & PG Enrolments)133 13%
(% of Total Enrolments incl. Flexible Learning)
Deprivation Index Scores (% of Full-time and Part-time, Undergraduate
and Postgraduate Enrolments) Springboard+ enrolments (% of National Participation) Affluent Marginally above average
Marginally Below average
Disadvantaged
INTERNATIONALISATIONInternational Students (Full-time)
(% of Full-time Enrolments)
International Students (Part-time)
(% of Part-time Enrolments)

48
Level 6 Level 7 Level 8
% % %
Generic programmes and qualifications - - - Indicator Indicator Score (out of 60)
Education - - 3% Higher Order Learning 39.1
Arts and humanities - - 10% Reflective and Integrative Learning 37.8
Social sciences, journalism and information - - - Quantitative Reasoning 11.6
Business, administration and law - - - Learning Strategies 30.2
Natural sciences, mathematics and statistics - - - Collaborative Learning 29.4
Information and Communication Technologies (ICTs) - - - Student-Faculty Interaction 18.0
Engineering, Manufacturing & Construction - - - Effective Teaching Practices 36.3
Agriculture, forestry, fisheries and veterinary - - - Quality of Interactions 40.7
Health and welfare - - - Supportive Environment 28.8
Services - - -
Total - - 9%
No. of Doctorate Graduates per 10 Academic Staff 1.0
No. Contract Research Income (€000) 309
Priority Patent Applications 1 State and Semi-State 213
Total Patents Granted 0 EU 17Invention Disclosures 6 Industry 61
Licence agreements (institution - private industry) 0 Other 18
Spin-out companies created 0 Contribution in respect of overheads 0
%
Level 8 Graduates in Permanent/Temporary Employment 77% Total Contract Research Income per Academic Staff €4,414
Level 8 Graduates in Further Study 12% EU Contract Research Income per Academic Staff €243
Level 9/10 Graduates in Permament/Temporary Employment 85%
Level 9/10 Graduates in Further Study 9%
Core Staff 133 100% Total Income (€000) 18,553 100%
Academic Staff 69 52% State Grants 10,180 55%
Support staff 64 48% Fees 7,840 42%
Contract Research & Specialist Staff 1 100% HEA Fees 3,806 21%
Academic Staff 1 100% Other Fees 4,034 22%
Support staff 0 0% Research Grants & Contracts 309 2%
Total Staff 134 100% Other Income 224 1%
Total Academic 70 52% Total Expenditure (€000) 18,705 100%
Total Support 64 48% Core - Pay 14,854 79%
Core - Non-Pay 3,569 19%
Non-Academic/Academic All Staff Ratio 0.9 Research Grants & Contracts - Pay 83 0%
Student FTE/Academic Staff Ratio 16 Research Grants & Contracts - Non-Pay 199 1%
Staff Age Profile (Proportion of Staff aged…) %20-39 16% Total Expenditure per Student (SRS)
115,448
40-54 52% Exchequer/Non-Exchequer Fees Ratio 0.9
55 and above 32%
Proportion of Academic Staff who are female 56% Pay/Non-Pay Expenditure Ratio (incl. Research) 4.0
Proportion of Staff at Most Senior Academic Grade who are Female 38% Pay/Non-Pay Expenditure Ratio (excl. Research) 4.2
Staff Qualifications (Proportion of…) %
Full-time Permanent Academic Staff with Masters or higher qual. 100%Full-time Permanent Academic Staff with Doctorate qualification 37%
All Permanent Academic Staff with Masters or higher qualification 100%All Permanent Academic Staff with Doctorate qualification 34%
National College of Art and Design - Profile 2018/19 - continued
TEACHING AND LEARNING
Non-Progression Rate from 1st to 2nd Year Engagement Indicators (Irish Survey of Student Engagement 2019)
RESEARCH, KNOWLEDGE TRANSFER AND GRADUATE OUTCOMES
2019
Graduate Outomes (2019 Graduates)
STAFF FINANCIAL DATA
1 Total expenditure per FTE student excluding research and depreciation with pension adjustments, based on
unadjusted SRS numbers.
-100
-50
0
50
100
150
200
250
300
350
400
Flexible Learners(as % of all Enrolment)
Participants in Labour Market Activation(Springboard)
Level 6/7 Enrolment(as % of all Enrolment)
FT Mature Entrants(as % of all FT New Entrants)
FT New Entrants from DisadvantagedBackgrounds
FTE Research Enrolment (as % of FTELevel 8 and Postgraduate Enrolment)
Doctorate Graduates per 10 AcademicStaff
Total Contract Research Income perAcademic Staff
EU Contract Research Income perAcademic Staff
Graduates in Employment (Level 8)
Progression Rate Level 81st to 2nd Year
Non-Academic/Academic Staff ratio(Core staff)
Student FTE/Academic Staff ratio(FTE students/Core Academic staff)
Pay/Non-Pay ratio (excl. Research)
Exchequer/Non-Exchequer Fees ratio
Total Expenditure per FTE Student, SRS(excl. Depreciation & Research)
Maximum HEA NCAD Average All HEA

49
STUDENT NUMBERS
STUDENT NUMBERS
5,948
Enrolments
14,236 4,453
TOP DISCIPLINES
NEW ENTRANTS
32%
22%
17%
DOCTORATES
26%
24%
23%
PARTICIPATION
4%
7%
INTERNATIONAL STUDENTS
3,401 239
22% 7%
Full-time Part-time
RESEARCH
€ 70.371 m 2.1
Contract Research Income
FIRST DESTINATION OF 2018 GRADUATES
70% 89%
National University of
Ireland Galway
Sta
tistic
al h
ighlig
hts
3,215
New Entrants Graduates
Undergraduate
Enrolments
Postgraduate
Enrolments
Arts and humanities
Business, administration and law
Natural sciences, mathematics and statistics
Social sciences, journalism and information
Natural sciences, mathematics and statistics
Engineering, Manufacturing & Construction
Level 8
Graduates in
Employment
Level 9/10
Graduates in
Employment
Mature Students
Entrants with a Disability
8%Entrants from Disadvantaged Socio-economic
backgrounds
Doctoral
Graduates per
10 Academic
Staff

50
No. No. %
New Entrants Year 1 (Full-time Undergraduate) 3,215 Undergraduate Graduates 3,617 61%
New Entrants Year 2+ (Full-time Undergraduate) 0 Postgraduate Graduates 2,331 39%
Full-time Part-time Remote Total Full-time Part-time Remote Total
Other Enrolments (IoTs only) No. 0 0 0 0 Other Enrolments (IoTs only) 0% 0% 0% 0%
QQI L5 Certificate No. 0 0 0 0 QQI L5 Certificate 0% 0% 0% 0%
QQI L6 Advanced Certificate No. 0 0 0 0 QQI L6 Advanced Certificate 0% 0% 0% 0%
of which are apprenticeships No. 0 0 0 0of which are
apprenticeships 0% 0% 0% 0%
Undergraduate No. 12,231 1,990 15 14,236 Undergraduate 86% 14% 0% 76%
Foundation/Access No. 5 164 0 169 Foundation/Access 3% 97% 0% 1%
Diploma No. 0 976 15 991 Diploma 0% 98% 2% 7%
Certificate No. 0 255 0 255 Certificate 0% 100% 0% 2%
Higher Certificate No. 0 0 0 0 Higher Certificate 0% 0% 0% 0%
Ordinary Degree (L7) No. 0 0 0 0 Ordinary Degree (L7) 0% 0% 0% 0%
Honours Degree (L8) No. 11,569 416 0 11,985 Honours Degree (L8) 97% 3% 0% 84%
Occasional No. 657 179 0 836 Occasional 79% 21% 0% 6%
Postgraduate No. 3,189 1,260 4 4,453 Postgraduate 72% 28% 0% 24%
Postgrad Diploma No. 72 319 0 391 Postgrad Diploma 18% 82% 0% 9%
Postgrad Higher Diploma No. 147 58 0 205 Postgrad Higher Diploma 72% 28% 0% 5%
Postgrad Certificate No. 0 89 0 89 Postgrad Certificate 0% 100% 0% 2%
Masters Taught (L9) No. 1,940 598 4 2,542 Masters Taught (L9) 76% 24% 0% 57%
Masters Research (L9) No. 74 15 0 89 Masters Research (L9) 83% 17% 0% 2%
Doctorate (L10) No. 956 164 0 1,120 Doctorate (L10) 85% 15% 0% 25%
Occasional No. 0 17 0 17 Occasional 0% 100% 0% 0%
Total UG and PG Enrolments No. 15,420 3,250 19 18,689 Total UG and PG Enrolments 83% 17% 0% 100%
Research & Taught (L9/10) FTE 3,361 Research & Taught (L9/10) 21.5%
Research (L9/10) FTE 1,120 Research (L9/10) 7.2%
Research (L10) FTE 1,038 Research (L10) 6.7%
No. % No. %
Generic programmes and qualifications 0 0% Generic programmes and qualifications 0 0%
Education 11 0% Education 0 0%
Arts and humanities 1,026 32% Arts and humanities 28 3%
Social sciences, journalism and information 161 5% Social sciences, journalism and information 292 26%
Business, administration and law 712 22% Business, administration and law 108 10%
Natural sciences, mathematics and statistics 559 17% Natural sciences, mathematics and statistics 274 24%
Information and Communication Technologies (ICTs) 58 2% Information and Communication Technologies (ICTs) 0 0%
Engineering, Manufacturing & Construction 282 9% Engineering, Manufacturing & Construction 255 23%
Agriculture, forestry, fisheries and veterinary 0 0% Agriculture, forestry, fisheries and veterinary 0 0%
Health and welfare 384 12% Health and welfare 163 15%
Services 22 1% Services 0 0%
Total 3,215 100% Total 1,120 100%
No. %Mature Entrants Year 1 (Full-time Undergraduate) 142 4%Mature Entrants Year 2+ (Full-time Undergraduate) 0
No. %
Flexible Learners (PT, Distance, E-Learning, In-Service) 3,269 17%
139 1%
14%46% Regional Intake (% of Full-time Enrolments) No. %
32% from the institution's county 36%
8% from the institution's county and bordering counties 60%
No. %3,401 22% Erasmus Students Incoming (excl. work placements) 381
EU 715 5%Non-EU 2,686 17% Total no. of International (FT, PT & Erasmus Incoming) Students 4,021
No. % Erasmus Students Outgoing 261239 7% Other Exchange Outgoing 0
EU 108 3%Non-EU 131 4%
National University of Ireland Galway - Profile 2018/19
STUDENT NUMBERSEntrants Graduates
Enrolments
% FTE Honours Bach Degree L8 and all PG
% FTE Honours Bach Degree L8 and all PG
% FTE Honours Bach Degree L8 and all PG
DISCIPLINARY MIXFirst Year Full-time Undergraduate New Entrants Doctorate (All modes)
PARTICIPATION(% of New Entrants)
Students in receipt of the Fund for Students with Disabilities (% of Full-
time UG & PG Enrolments)1,036 7%
(% of Total Enrolments incl. Flexible Learning)
Deprivation Index Scores (% of Full-time and Part-time, Undergraduate
and Postgraduate Enrolments) Springboard+ enrolments (% of National Participation) Affluent Marginally above average
Marginally Below average
Disadvantaged
INTERNATIONALISATIONInternational Students (Full-time)
(% of Full-time Enrolments)
International Students (Part-time)
(% of Part-time Enrolments)

51
Level 6 Level 7 Level 8
% % %
Generic programmes and qualifications - - - Indicator Indicator Score (out of 60)
Education - - 15% Higher Order Learning 38.5
Arts and humanities - - 18% Reflective and Integrative Learning 32.1
Social sciences, journalism and information - - 12% Quantitative Reasoning 21.0
Business, administration and law - - 7% Learning Strategies 32.3
Natural sciences, mathematics and statistics - - 7% Collaborative Learning 29.8
Information and Communication Technologies (ICTs) - - 8% Student-Faculty Interaction 14.1
Engineering, Manufacturing & Construction - - 6% Effective Teaching Practices 35.3
Agriculture, forestry, fisheries and veterinary - - - Quality of Interactions 39.9
Health and welfare - - 3% Supportive Environment 30.1
Services - - 9%
Total - - 10%
No. of Doctorate Graduates per 10 Academic Staff 2.1
No. Contract Research Income (€000) 70,371
Priority Patent Applications 11 State and Semi-State 50,866
Total Patents Granted 10 EU 12,590Invention Disclosures 58 Industry 5,966
Licence agreements (institution - private industry) 18 Other 949
Spin-out companies created 1 Contribution in respect of overheads 0
%
Level 8 Graduates in Permanent/Temporary Employment 70% Total Contract Research Income per Academic Staff €76,550
Level 8 Graduates in Further Study 27% EU Contract Research Income per Academic Staff €13,696
Level 9/10 Graduates in Permament/Temporary Employment 89%
Level 9/10 Graduates in Further Study 4%
Core Staff 1,493 100% Total Income (€000) 268,621 100%
Academic Staff 756 51% State Grants 53,365 20%
Support staff 737 49% Fees 123,083 46%
Contract Research & Specialist Staff 726 100% HEA Fees 35,464 13%
Academic Staff 623 86% Other Fees 87,619 33%
Support staff 103 14% Research Grants & Contracts 71,045 26%
Total Staff 2,219 100% Other Income 21,128 8%
Total Academic 1,379 62% Total Expenditure (€000) 267,002 100%
Total Support 840 38% Core - Pay 133,845 50%
Core - Non-Pay 62,112 23%
Non-Academic/Academic All Staff Ratio 0.6 Research Grants & Contracts - Pay 35,914 13%
Student FTE/Academic Staff Ratio 19 Research Grants & Contracts - Non-Pay 35,131 13%
Staff Age Profile (Proportion of Staff aged…) %20-39 25% Total Expenditure per Student (SRS)
110,671
40-54 57% Exchequer/Non-Exchequer Fees Ratio 0.4
55 and above 18%
Proportion of Academic Staff who are female 45% Pay/Non-Pay Expenditure Ratio (incl. Research) 1.7
Proportion of Staff at Most Senior Academic Grade who are Female 16% Pay/Non-Pay Expenditure Ratio (excl. Research) 2.2
Staff Qualifications (Proportion of…) %
Full-time Permanent Academic Staff with Masters or higher qual. 93%Full-time Permanent Academic Staff with Doctorate qualification 80%
All Permanent Academic Staff with Masters or higher qualification 94%All Permanent Academic Staff with Doctorate qualification 77%
National University of Ireland Galway - Profile 2018/19 - continued
TEACHING AND LEARNING
Non-Progression Rate from 1st to 2nd Year Engagement Indicators (Irish Survey of Student Engagement 2019)
RESEARCH, KNOWLEDGE TRANSFER AND GRADUATE OUTCOMES
2019
Graduate Outomes (2019 Graduates)
STAFF FINANCIAL DATA
1 Total expenditure per FTE student excluding research and depreciation with pension adjustments, based on
unadjusted SRS numbers.
0
50
100
150
200
250
300
350
400
Flexible Learners(as % of all Enrolment)
Participants in Labour Market Activation(Springboard)
Level 6/7 Enrolment(as % of all Enrolment)
FT Mature Entrants(as % of all FT New Entrants)
FT New Entrants from DisadvantagedBackgrounds
FTE Research Enrolment (as % of FTELevel 8 and Postgraduate Enrolment)
Doctorate Graduates per 10 AcademicStaff
Total Contract Research Income perAcademic Staff
EU Contract Research Income perAcademic Staff
Graduates in Employment (Level 8)
Progression Rate Level 81st to 2nd Year
Non-Academic/Academic Staff ratio(Core staff)
Student FTE/Academic Staff ratio(FTE students/Core Academic staff)
Pay/Non-Pay ratio (excl. Research)
Exchequer/Non-Exchequer Fees ratio
Total Expenditure per FTE Student, SRS(excl. Depreciation & Research)
Maximum HEA NUIG Average All HEA

52
STUDENT NUMBERS
STUDENT NUMBERS
1,236
Enrolments
2,453 1,327
TOP DISCIPLINES
NEW ENTRANTS
100%
DOCTORATES
100%
PARTICIPATION
6%
2%
INTERNATIONAL STUDENTS
1,822 47
65% 5%
Full-time Part-time
RESEARCH
2.0
Royal College of Surgeons
Ireland
Sta
tistic
al h
igh
ligh
ts
331
New Entrants Graduates
Undergraduate
Enrolments
Postgraduate
Enrolments
Health and welfare
Health and welfare
Mature Students
Entrants with a Disability
5%Entrants from Disadvantaged Socio-economic
backgrounds
Doctoral
Graduates per 10
Academic Staff

53
No. No. %
New Entrants Year 1 (Full-time Undergraduate) 331 Undergraduate Graduates 463 37%
New Entrants Year 2+ (Full-time Undergraduate) 0 Postgraduate Graduates 773 63%
Full-time Part-time Remote Total Full-time Part-time Remote Total
Other Enrolments (IoTs only) No. 0 0 0 0 Other Enrolments (IoTs only) 0% 0% 0% 0%
QQI L5 Certificate No. 0 0 0 0 QQI L5 Certificate 0% 0% 0% 0%
QQI L6 Advanced Certificate No. 0 0 0 0 QQI L6 Advanced Certificate 0% 0% 0% 0%
of which are apprenticeships No. 0 0 0 0of which are
apprenticeships 0% 0% 0% 0%
Undergraduate No. 2,379 74 0 2,453 Undergraduate 97% 3% 0% 65%
Foundation/Access No. 0 0 0 0 Foundation/Access 0% 0% 0% 0%
Diploma No. 48 0 0 48 Diploma 100% 0% 0% 2%
Certificate No. 0 0 0 0 Certificate 0% 0% 0% 0%
Higher Certificate No. 0 0 0 0 Higher Certificate 0% 0% 0% 0%
Ordinary Degree (L7) No. 0 0 0 0 Ordinary Degree (L7) 0% 0% 0% 0%
Honours Degree (L8) No. 2,331 74 0 2,405 Honours Degree (L8) 97% 3% 0% 98%
Occasional No. 0 0 0 0 Occasional 0% 0% 0% 0%
Postgraduate No. 431 896 0 1,327 Postgraduate 32% 68% 0% 35%
Postgrad Diploma No. 0 276 0 276 Postgrad Diploma 0% 100% 0% 21%
Postgrad Higher Diploma No. 0 0 0 0 Postgrad Higher Diploma 0% 0% 0% 0%
Postgrad Certificate No. 0 79 0 79 Postgrad Certificate 0% 100% 0% 6%
Masters Taught (L9) No. 196 458 0 654 Masters Taught (L9) 30% 70% 0% 49%
Masters Research (L9) No. 13 9 0 22 Masters Research (L9) 59% 41% 0% 2%
Doctorate (L10) No. 222 24 0 246 Doctorate (L10) 90% 10% 0% 19%
Occasional No. 0 50 0 50 Occasional 0% 100% 0% 4%
Total UG and PG Enrolments No. 2,810 970 0 3,780 Total UG and PG Enrolments 74% 26% 0% 100%
Research & Taught (L9/10) FTE 677 Research & Taught (L9/10) 20.8%
Research (L9/10) FTE 252 Research (L9/10) 7.7%
Research (L10) FTE 234 Research (L10) 7.2%
No. % No. %
Generic programmes and qualifications 0 0% Generic programmes and qualifications 0 0%
Education 0 0% Education 0 0%
Arts and humanities 0 0% Arts and humanities 0 0%
Social sciences, journalism and information 0 0% Social sciences, journalism and information 0 0%
Business, administration and law 0 0% Business, administration and law 0 0%
Natural sciences, mathematics and statistics 0 0% Natural sciences, mathematics and statistics 0 0%
Information and Communication Technologies (ICTs) 0 0% Information and Communication Technologies (ICTs) 0 0%
Engineering, Manufacturing & Construction 0 0% Engineering, Manufacturing & Construction 0 0%
Agriculture, forestry, fisheries and veterinary 0 0% Agriculture, forestry, fisheries and veterinary 0 0%
Health and welfare 331 100% Health and welfare 246 100%
Services 0 0% Services 0 0%
Total 331 100% Total 246 100%
No. %Mature Entrants Year 1 (Full-time Undergraduate) 20 6%Mature Entrants Year 2+ (Full-time Undergraduate) 0
No. %
Flexible Learners (PT, Distance, E-Learning, In-Service) 970 26%
0 0%
33%41% Regional Intake (% of Full-time Enrolments) No. %
21% from the institution's county 44%
5% from the institution's county and bordering counties 57%
No. %1,822 65% Erasmus Students Incoming (excl. work placements) 0
EU 117 4%Non-EU 1,705 61% Total no. of International (FT, PT & Erasmus Incoming) Students 1,869
No. % Erasmus Students Outgoing 047 5% Other Exchange Outgoing 0
EU 6 1%Non-EU 41 4%
Royal College of Surgeons Ireland - Profile 2018/19
STUDENT NUMBERSEntrants Graduates
Enrolments
% FTE Honours Bach Degree L8 and all PG
% FTE Honours Bach Degree L8 and all PG
% FTE Honours Bach Degree L8 and all PG
DISCIPLINARY MIXFirst Year Full-time Undergraduate New Entrants Doctorate (All modes)
PARTICIPATION(% of New Entrants)
Students in receipt of the Fund for Students with Disabilities (% of Full-
time UG & PG Enrolments)56 2%
(% of Total Enrolments incl. Flexible Learning)
Deprivation Index Scores (% of Full-time and Part-time, Undergraduate
and Postgraduate Enrolments) Springboard+ enrolments (% of National Participation) Affluent Marginally above average
Marginally Below average
Disadvantaged
INTERNATIONALISATIONInternational Students (Full-time)
(% of Full-time Enrolments)
International Students (Part-time)
(% of Part-time Enrolments)

54
Level 6 Level 7 Level 8
% % %
Generic programmes and qualifications - - - Indicator Indicator Score (out of 60)
Education - - - Higher Order Learning 40.4
Arts and humanities - - - Reflective and Integrative Learning 35.1
Social sciences, journalism and information - - - Quantitative Reasoning 21.6
Business, administration and law - - - Learning Strategies 36.2
Natural sciences, mathematics and statistics - - - Collaborative Learning 31.4
Information and Communication Technologies (ICTs) - - - Student-Faculty Interaction 16.6
Engineering, Manufacturing & Construction - - - Effective Teaching Practices 36.3
Agriculture, forestry, fisheries and veterinary - - - Quality of Interactions 42.5
Health and welfare - - 3% Supportive Environment 32.5
Services - - -
Total - - 3%
No. of Doctorate Graduates per 10 Academic Staff 2.0
No. Contract Research Income (€000) N/A
Priority Patent Applications 5 State and Semi-State N/A
Total Patents Granted 1 EU N/AInvention Disclosures 18 Industry N/A
Licence agreements (institution - private industry) 5 Other N/A
Spin-out companies created 0 Contribution in respect of overheads N/A
%
Level 8 Graduates in Permanent/Temporary Employment N/A Total Contract Research Income per Academic Staff N/A
Level 8 Graduates in Further Study N/A EU Contract Research Income per Academic Staff N/A
Level 9/10 Graduates in Permament/Temporary Employment N/A
Level 9/10 Graduates in Further Study N/A
Core Staff 527 100% Total Income (€000) N/A N/A
Academic Staff 147 28% State Grants N/A N/A
Support staff 380 72% Fees N/A N/A
Contract Research & Specialist Staff 232 100% HEA Fees N/A N/A
Academic Staff 132 57% Other Fees N/A N/A
Support staff 100 43% Research Grants & Contracts N/A N/A
Total Staff 758 100% Other Income N/A N/A
Total Academic 279 37% Total Expenditure (€000) N/A N/A
Total Support 480 63% Core - Pay N/A N/A
Core - Non-Pay N/A N/A
Non-Academic/Academic All Staff Ratio 1.7 Research Grants & Contracts - Pay N/A N/A
Student FTE/Academic Staff Ratio 12 Research Grants & Contracts - Non-Pay N/A N/A
Staff Age Profile (Proportion of Staff aged…) %20-39 49% Total Expenditure per Student (SRS)
1N/A
40-54 38% Exchequer/Non-Exchequer Fees Ratio N/A
55 and above 13%
Proportion of Academic Staff who are female 55% Pay/Non-Pay Expenditure Ratio (incl. Research) N/A
Proportion of Staff at Most Senior Academic Grade who are Female 28% Pay/Non-Pay Expenditure Ratio (excl. Research) N/A
Staff Qualifications (Proportion of…) %
Full-time Permanent Academic Staff with Masters or higher qual. 100%Full-time Permanent Academic Staff with Doctorate qualification 95%
All Permanent Academic Staff with Masters or higher qualification 100%All Permanent Academic Staff with Doctorate qualification 93%
Royal College of Surgeons Ireland - Profile 2018/19 - continued
TEACHING AND LEARNING
Non-Progression Rate from 1st to 2nd Year Engagement Indicators (Irish Survey of Student Engagement 2019)
RESEARCH, KNOWLEDGE TRANSFER AND GRADUATE OUTCOMES
2019
Graduate Outomes (2019 Graduates)
STAFF FINANCIAL DATA
1 Total expenditure per FTE student excluding research and depreciation with pension adjustments, based on
unadjusted SRS numbers.
-50
0
50
100
150
200
250
300
350
400
Flexible Learners(as % of all Enrolment)
Participants in Labour Market Activation(Springboard)
Level 6/7 Enrolment(as % of all Enrolment)
FT Mature Entrants(as % of all FT New Entrants)
FT New Entrants from DisadvantagedBackgrounds
FTE Research Enrolment (as % of FTELevel 8 and Postgraduate Enrolment)
Doctorate Graduates per 10 AcademicStaff
Total Contract Research Income perAcademic Staff
EU Contract Research Income perAcademic Staff
Graduates in Employment (Level 8)
Progression Rate Level 81st to 2nd Year
Non-Academic/Academic Staff ratio(Core staff)
Student FTE/Academic Staff ratio(FTE students/Core Academic staff)
Pay/Non-Pay ratio (excl. Research)
Exchequer/Non-Exchequer Fees ratio
Total Expenditure per FTE Student, SRS(excl. Depreciation & Research)
Maximum HEA RCSI Average All HEA
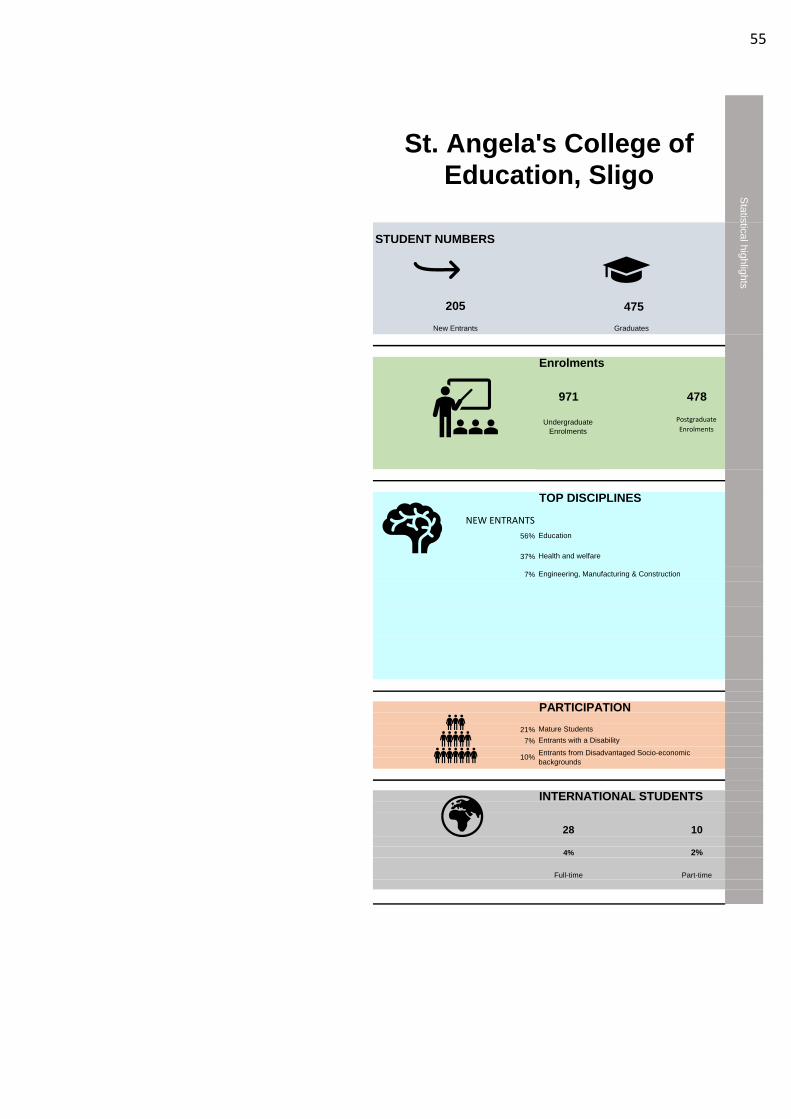
55
STUDENT NUMBERS
STUDENT NUMBERS
475
Enrolments
971 478
TOP DISCIPLINES
NEW ENTRANTS
56%
37%
7%
PARTICIPATION
21%
7%
INTERNATIONAL STUDENTS
28 10
4% 2%
Full-time Part-time
St. Angela's College of
Education, Sligo
Sta
tistic
al h
igh
ligh
ts
205
New Entrants Graduates
Undergraduate
Enrolments
Postgraduate
Enrolments
Education
Health and welfare
Engineering, Manufacturing & Construction
Mature Students
Entrants with a Disability
10%Entrants from Disadvantaged Socio-economic
backgrounds

56
No. No. %
New Entrants Year 1 (Full-time Undergraduate) 205 Undergraduate Graduates 306 64%
New Entrants Year 2+ (Full-time Undergraduate) 0 Postgraduate Graduates 169 36%
Full-time Part-time Remote Total Full-time Part-time Remote Total
Other Enrolments (IoTs only) No. 0 0 0 0 Other Enrolments (IoTs only) 0% 0% 0% 0%
QQI L5 Certificate No. 0 0 0 0 QQI L5 Certificate 0% 0% 0% 0%
QQI L6 Advanced Certificate No. 0 0 0 0 QQI L6 Advanced Certificate 0% 0% 0% 0%
of which are apprenticeships No. 0 0 0 0of which are
apprenticeships 0% 0% 0% 0%
Undergraduate No. 688 276 7 971 Undergraduate 71% 28% 1% 67%
Foundation/Access No. 0 0 0 0 Foundation/Access 0% 0% 0% 0%
Diploma No. 0 35 0 35 Diploma 0% 100% 0% 4%
Certificate No. 0 194 7 201 Certificate 0% 97% 3% 21%
Higher Certificate No. 0 0 0 0 Higher Certificate 0% 0% 0% 0%
Ordinary Degree (L7) No. 0 0 0 0 Ordinary Degree (L7) 0% 0% 0% 0%
Honours Degree (L8) No. 688 7 0 695 Honours Degree (L8) 99% 1% 0% 72%
Occasional No. 0 40 0 40 Occasional 0% 100% 0% 4%
Postgraduate No. 109 368 1 478 Postgraduate 23% 77% 0% 33%
Postgrad Diploma No. 109 46 0 155 Postgrad Diploma 70% 30% 0% 32%
Postgrad Higher Diploma No. 0 0 0 0 Postgrad Higher Diploma 0% 0% 0% 0%
Postgrad Certificate No. 0 19 0 19 Postgrad Certificate 0% 100% 0% 4%
Masters Taught (L9) No. 0 73 0 73 Masters Taught (L9) 0% 100% 0% 15%
Masters Research (L9) No. 0 0 0 0 Masters Research (L9) 0% 0% 0% 0%
Doctorate (L10) No. 0 0 0 0 Doctorate (L10) 0% 0% 0% 0%
Occasional No. 0 230 1 231 Occasional 0% 100% 0% 48%
Total UG and PG Enrolments No. 797 644 8 1,449 Total UG and PG Enrolments 55% 44% 1% 100%
Research & Taught (L9/10) FTE 37 Research & Taught (L9/10) 3.7%
Research (L9/10) FTE 0 Research (L9/10) 0.0%
Research (L10) FTE 0 Research (L10) 0.0%
No. % No. %
Generic programmes and qualifications 0 0% Generic programmes and qualifications 0 0%
Education 115 56% Education 0 0%
Arts and humanities 0 0% Arts and humanities 0 0%
Social sciences, journalism and information 0 0% Social sciences, journalism and information 0 0%
Business, administration and law 0 0% Business, administration and law 0 0%
Natural sciences, mathematics and statistics 0 0% Natural sciences, mathematics and statistics 0 0%
Information and Communication Technologies (ICTs) 0 0% Information and Communication Technologies (ICTs) 0 0%
Engineering, Manufacturing & Construction 14 7% Engineering, Manufacturing & Construction 0 0%
Agriculture, forestry, fisheries and veterinary 0 0% Agriculture, forestry, fisheries and veterinary 0 0%
Health and welfare 76 37% Health and welfare 0 0%
Services 0 0% Services 0 0%
Total 205 100% Total 0 0%
No. %Mature Entrants Year 1 (Full-time Undergraduate) 44 21%Mature Entrants Year 2+ (Full-time Undergraduate) 0
No. %
Flexible Learners (PT, Distance, E-Learning, In-Service) 652 45%
0 0%
7%38% Regional Intake (% of Full-time Enrolments) No. %
45% from the institution's county 13%
10% from the institution's county and bordering counties 31%
No. %28 4% Erasmus Students Incoming (excl. work placements) 0
EU 4 1%Non-EU 24 3% Total no. of International (FT, PT & Erasmus Incoming) Students 38
No. % Erasmus Students Outgoing 010 2% Other Exchange Outgoing 0
EU 2 0%Non-EU 8 1%
St. Angela's College of Education, Sligo - Profile 2018/19
STUDENT NUMBERSEntrants Graduates
Enrolments
% FTE Honours Bach Degree L8 and all PG
% FTE Honours Bach Degree L8 and all PG
% FTE Honours Bach Degree L8 and all PG
DISCIPLINARY MIXFirst Year Full-time Undergraduate New Entrants Doctorate (All modes)
PARTICIPATION(% of New Entrants)
Students in receipt of the Fund for Students with Disabilities (% of Full-
time UG & PG Enrolments)55 7%
(% of Total Enrolments incl. Flexible Learning)
Deprivation Index Scores (% of Full-time and Part-time, Undergraduate
and Postgraduate Enrolments) Springboard+ enrolments (% of National Participation) Affluent Marginally above average
Marginally Below average
Disadvantaged
INTERNATIONALISATIONInternational Students (Full-time)
(% of Full-time Enrolments)
International Students (Part-time)
(% of Part-time Enrolments)

57
Level 6 Level 7 Level 8
% % %
Generic programmes and qualifications - - - Indicator Indicator Score (out of 60)
Education - - 4% Higher Order Learning 37.7
Arts and humanities - - - Reflective and Integrative Learning 31.3
Social sciences, journalism and information - - - Quantitative Reasoning 17.2
Business, administration and law - - - Learning Strategies 29.0
Natural sciences, mathematics and statistics - - - Collaborative Learning 32.2
Information and Communication Technologies (ICTs) - - - Student-Faculty Interaction 14.4
Engineering, Manufacturing & Construction - - 5% Effective Teaching Practices 34.5
Agriculture, forestry, fisheries and veterinary - - - Quality of Interactions 34.1
Health and welfare - - 11% Supportive Environment 22.3
Services - - -
Total - - 6%
No. of Doctorate Graduates per 10 Academic Staff N/A
No. Contract Research Income (€000) 0
Priority Patent Applications N/A State and Semi-State 0
Total Patents Granted N/A EU 0Invention Disclosures N/A Industry 0
Licence agreements (institution - private industry) N/A Other 0
Spin-out companies created N/A Contribution in respect of overheads 0
%
Level 8 Graduates in Permanent/Temporary Employment N/A Total Contract Research Income per Academic Staff €0
Level 8 Graduates in Further Study N/A EU Contract Research Income per Academic Staff €0
Level 9/10 Graduates in Permament/Temporary Employment N/A
Level 9/10 Graduates in Further Study N/A
Core Staff 118 100% Total Income (€000) 12,340 100%
Academic Staff 62 52% State Grants 6,225 50%
Support staff 56 48% Fees 5,349 43%
Contract Research & Specialist Staff 0 0% HEA Fees 2,293 19%
Academic Staff 0 0% Other Fees 3,056 25%
Support staff 0 0% Research Grants & Contracts 0 0%
Total Staff 118 100% Other Income 766 6%
Total Academic 62 52% Total Expenditure (€000) 8,383 100%
Total Support 56 48% Core - Pay 6,724 80%
Core - Non-Pay 1,659 20%
Non-Academic/Academic All Staff Ratio 0.9 Research Grants & Contracts - Pay 0 0%
Student FTE/Academic Staff Ratio 18 Research Grants & Contracts - Non-Pay 0 0%
Staff Age Profile (Proportion of Staff aged…) %20-39 35% Total Expenditure per Student (SRS)
17,614
40-54 59% Exchequer/Non-Exchequer Fees Ratio 0.8
55 and above 6%
Proportion of Academic Staff who are female 86% Pay/Non-Pay Expenditure Ratio (incl. Research) 4.1
Proportion of Staff at Most Senior Academic Grade who are Female 100% Pay/Non-Pay Expenditure Ratio (excl. Research) 4.1
Staff Qualifications (Proportion of…) %
Full-time Permanent Academic Staff with Masters or higher qual. 100%Full-time Permanent Academic Staff with Doctorate qualification 40%
All Permanent Academic Staff with Masters or higher qualification 100%All Permanent Academic Staff with Doctorate qualification 38%
St. Angela's College of Education, Sligo - Profile 2018/19 - continued
TEACHING AND LEARNING
Non-Progression Rate from 1st to 2nd Year Engagement Indicators (Irish Survey of Student Engagement 2019)
RESEARCH, KNOWLEDGE TRANSFER AND GRADUATE OUTCOMES
2019
Graduate Outomes (2019 Graduates)
STAFF FINANCIAL DATA
1 Total expenditure per FTE student excluding research and depreciation with pension adjustments, based on
unadjusted SRS numbers.
-50
0
50
100
150
200
250
300
350
400
Flexible Learners(as % of all Enrolment)
Participants in Labour Market Activation(Springboard)
Level 6/7 Enrolment(as % of all Enrolment)
FT Mature Entrants(as % of all FT New Entrants)
FT New Entrants from DisadvantagedBackgrounds
FTE Research Enrolment (as % of FTELevel 8 and Postgraduate Enrolment)
Doctorate Graduates per 10 AcademicStaff
Total Contract Research Income perAcademic Staff
EU Contract Research Income perAcademic Staff
Graduates in Employment (Level 8)
Progression Rate Level 81st to 2nd Year
Non-Academic/Academic Staff ratio(Core staff)
Student FTE/Academic Staff ratio(FTE students/Core Academic staff)
Pay/Non-Pay ratio (excl. Research)
Exchequer/Non-Exchequer Fees ratio
Total Expenditure per FTE Student, SRS(excl. Depreciation & Research)
Maximum HEA St Angela's Average All HEA

58
STUDENT NUMBERS
STUDENT NUMBERS
7,384
Enrolments
23,799 3,573
TOP DISCIPLINES
NEW ENTRANTS
25%
20%
13%
DOCTORATES
33%
22%
18%
PARTICIPATION
8%
7%
INTERNATIONAL STUDENTS
1,609 300
9% 4%
Full-time Part-time
RESEARCH
€ 17.037 m 0.3
Contract Research Income
FIRST DESTINATION OF 2018 GRADUATES
85% 94%
Technological University
Dublin
Sta
tistic
al h
ighlig
hts
4,844
New Entrants Graduates
Undergraduate
Enrolments
Postgraduate
Enrolments
Business, administration and law
Engineering, Manufacturing & Construction
Arts and humanities
Natural sciences, mathematics and statistics
Engineering, Manufacturing & Construction
Arts and humanities
Level 8
Graduates in
Employment
Level 9/10
Graduates in
Employment
Mature Students
Entrants with a Disability
11%Entrants from Disadvantaged Socio-economic
backgrounds
Doctoral
Graduates per
10 Academic
Staff

59
No. No. %
New Entrants Year 1 (Full-time Undergraduate) 4,757 Undergraduate Graduates 6,183 84%
New Entrants Year 2+ (Full-time Undergraduate) 87 Postgraduate Graduates 1,201 16%
Full-time Part-time Remote Total Full-time Part-time Remote Total
Other Enrolments (IoTs only) No. 4 1,126 0 1,130 Other Enrolments (IoTs only) 0% 100% 0% 100%
QQI L5 Certificate No. 4 0 0 4 QQI L5 Certificate 100% 0% 0% 0%
QQI L6 Advanced Certificate No. 0 1,126 0 1,126 QQI L6 Advanced Certificate 0% 100% 0% 100%
of which are apprenticeships No. 0 1,081 0 1,081of which are
apprenticeships 0% 100% 0% 96%
Undergraduate No. 17,674 5,532 593 23,799 Undergraduate 74% 23% 2% 87%
Foundation/Access No. 90 6 0 96 Foundation/Access 94% 6% 0% 0%
Diploma No. 3 283 0 286 Diploma 1% 99% 0% 1%
Certificate No. 4 1,290 79 1,373 Certificate 0% 94% 6% 6%
Higher Certificate No. 941 708 158 1,807 Higher Certificate 52% 39% 9% 8%
Ordinary Degree (L7) No. 3,640 1,049 127 4,816 Ordinary Degree (L7) 76% 22% 3% 20%
Honours Degree (L8) No. 12,946 949 229 14,124 Honours Degree (L8) 92% 7% 2% 59%
Occasional No. 50 1,247 0 1,297 Occasional 4% 96% 0% 5%
Postgraduate No. 1,188 2,204 181 3,573 Postgraduate 33% 62% 5% 13%
Postgrad Diploma No. 49 203 0 252 Postgrad Diploma 19% 81% 0% 7%
Postgrad Higher Diploma No. 5 34 57 96 Postgrad Higher Diploma 5% 35% 59% 3%
Postgrad Certificate No. 0 147 0 147 Postgrad Certificate 0% 100% 0% 4%
Masters Taught (L9) No. 706 1,240 123 2,069 Masters Taught (L9) 34% 60% 6% 58%
Masters Research (L9) No. 62 46 1 109 Masters Research (L9) 57% 42% 1% 3%
Doctorate (L10) No. 366 197 0 563 Doctorate (L10) 65% 35% 0% 16%
Occasional No. 0 337 0 337 Occasional 0% 100% 0% 9%
Total UG and PG Enrolments No. 18,862 7,736 774 27,372 Total UG and PG Enrolments 69% 28% 3% 100%
Research & Taught (L9/10) FTE 1,938 Research & Taught (L9/10) 12.2%
Research (L9/10) FTE 550 Research (L9/10) 3.5%
Research (L10) FTE 465 Research (L10) 2.9%
No. % No. %
Generic programmes and qualifications 16 0% Generic programmes and qualifications 0 0%
Education 39 1% Education 0 0%
Arts and humanities 622 13% Arts and humanities 102 18%
Social sciences, journalism and information 91 2% Social sciences, journalism and information 21 4%
Business, administration and law 1,181 25% Business, administration and law 94 17%
Natural sciences, mathematics and statistics 463 10% Natural sciences, mathematics and statistics 183 33%
Information and Communication Technologies (ICTs) 447 9% Information and Communication Technologies (ICTs) 41 7%
Engineering, Manufacturing & Construction 963 20% Engineering, Manufacturing & Construction 122 22%
Agriculture, forestry, fisheries and veterinary 7 0% Agriculture, forestry, fisheries and veterinary 0 0%
Health and welfare 471 10% Health and welfare 0 0%
Services 457 10% Services 0 0%
Total 4,757 100% Total 563 100%
No. %Mature Entrants Year 1 (Full-time Undergraduate) 377 8%Mature Entrants Year 2+ (Full-time Undergraduate) 38
No. %
Flexible Learners (PT, Distance, E-Learning, In-Service) 8,510 31%
448 5%
27%40% Regional Intake (% of Full-time Enrolments) No. %
23% from the institution's county 62%
11% from the institution's county and bordering counties 83%
No. %1,609 9% Erasmus Students Incoming (excl. work placements) 546
EU 287 2%Non-EU 1,322 7% Total no. of International (FT, PT & Erasmus Incoming) Students 2,455
No. % Erasmus Students Outgoing 461300 4% Other Exchange Outgoing 28
EU 162 2%Non-EU 138 2%
Technological University Dublin - Profile 2018/19
STUDENT NUMBERSEntrants Graduates
Enrolments
% FTE Honours Bach Degree L8 and all PG
% FTE Honours Bach Degree L8 and all PG
% FTE Honours Bach Degree L8 and all PG
DISCIPLINARY MIXFirst Year Full-time Undergraduate New Entrants Doctorate (All modes)
PARTICIPATION(% of New Entrants)
Students in receipt of the Fund for Students with Disabilities (% of Full-
time UG & PG Enrolments)1,351 7%
(% of Total Enrolments incl. Flexible Learning)
Deprivation Index Scores (% of Full-time and Part-time, Undergraduate
and Postgraduate Enrolments) Springboard+ enrolments (% of National Participation) Affluent Marginally above average
Marginally Below average
Disadvantaged
INTERNATIONALISATIONInternational Students (Full-time)
(% of Full-time Enrolments)
International Students (Part-time)
(% of Part-time Enrolments)

60
Level 6 Level 7 Level 8
% % %
Generic programmes and qualifications 32% - - Indicator Indicator Score (out of 60)
Education - - 6% Higher Order Learning 35.2
Arts and humanities - 28% 20% Reflective and Integrative Learning 29.4
Social sciences, journalism and information - 29% 15% Quantitative Reasoning 21.0
Business, administration and law 13% 32% 13% Learning Strategies 29.9
Natural sciences, mathematics and statistics 43% 25% 21% Collaborative Learning 32.2
Information and Communication Technologies (ICTs) 19% 32% 19% Student-Faculty Interaction 14.2
Engineering, Manufacturing & Construction 28% 23% 15% Effective Teaching Practices 34.3
Agriculture, forestry, fisheries and veterinary - 0% 67% Quality of Interactions 37.9
Health and welfare 5% 34% 10% Supportive Environment 25.7
Services 26% 22% 19%
Total 19% 26% 16%
No. of Doctorate Graduates per 10 Academic Staff 0.3
No. Contract Research Income (€000) 17,037
Priority Patent Applications 11 State and Semi-State 12,542
Total Patents Granted 3 EU 876Invention Disclosures 28 Industry 762
Licence agreements (institution - private industry) 16 Other 2,858
Spin-out companies created 3 Contribution in respect of overheads 0
%
Level 8 Graduates in Permanent/Temporary Employment 85% Total Contract Research Income per Academic Staff €12,507
Level 8 Graduates in Further Study 8% EU Contract Research Income per Academic Staff €643
Level 9/10 Graduates in Permament/Temporary Employment 94%
Level 9/10 Graduates in Further Study 1%
Core Staff 2,209 100% Total Income (€000) 114,385 100%
Academic Staff 1,276 58% State Grants 52,775 46%
Support staff 933 42% Fees 45,899 40%
Contract Research & Specialist Staff 278 100% HEA Fees 8,414 7%
Academic Staff 178 64% Other Fees 37,485 33%
Support staff 100 36% Research Grants & Contracts 8,422 7%
Total Staff 2,486 100% Other Income 7,289 6%
Total Academic 1,454 58% Total Expenditure (€000) 113,492 100%
Total Support 1,032 42% Core - Pay 83,042 73%
Core - Non-Pay 20,339 18%
Non-Academic/Academic All Staff Ratio 0.7 Research Grants & Contracts - Pay 3,959 3%
Student FTE/Academic Staff Ratio 17 Research Grants & Contracts - Non-Pay 6,151 5%
Staff Age Profile (Proportion of Staff aged…) %20-39 21% Total Expenditure per Student (SRS)
17,760
40-54 51% Exchequer/Non-Exchequer Fees Ratio 0.2
55 and above 28%
Proportion of Academic Staff who are female 40% Pay/Non-Pay Expenditure Ratio (incl. Research) 3.3
Proportion of Staff at Most Senior Academic Grade who are Female 32% Pay/Non-Pay Expenditure Ratio (excl. Research) 4.1
Staff Qualifications (Proportion of…) %
Full-time Permanent Academic Staff with Masters or higher qual. 92%Full-time Permanent Academic Staff with Doctorate qualification 43%
All Permanent Academic Staff with Masters or higher qualification 92%All Permanent Academic Staff with Doctorate qualification 43%
Technological University Dublin - Profile 2018/19 - continued
TEACHING AND LEARNING
Non-Progression Rate from 1st to 2nd Year Engagement Indicators (Irish Survey of Student Engagement 2019)
RESEARCH, KNOWLEDGE TRANSFER AND GRADUATE OUTCOMES
2019
Graduate Outomes (2019 Graduates)
STAFF FINANCIAL DATA
1 Total expenditure per FTE student excluding research and depreciation with pension adjustments, based on
unadjusted SRS numbers.
0
50
100
150
200
250
300
350
400
Flexible Learners(as % of all Enrolment)
Participants in Labour Market Activation(Springboard)
Level 6/7 Enrolment(as % of all Enrolment)
FT Mature Entrants(as % of all FT New Entrants)
FT New Entrants from DisadvantagedBackgrounds
FTE Research Enrolment (as % of FTELevel 8 and Postgraduate Enrolment)
Doctorate Graduates per 10 AcademicStaff
Total Contract Research Income perAcademic Staff
EU Contract Research Income perAcademic Staff
Graduates in Employment (Level 8)
Progression Rate Level 81st to 2nd Year
Non-Academic/Academic Staff ratio(Core staff)
Student FTE/Academic Staff ratio(FTE students/Core Academic staff)
Pay/Non-Pay ratio (excl. Research)
Exchequer/Non-Exchequer Fees ratio
Total Expenditure per FTE Student, SRS(excl. Depreciation & Research)
Maximum HEA TU Dublin Average All HEA

61
STUDENT NUMBERS
STUDENT NUMBERS
5,614
Enrolments
12,207 5,029
TOP DISCIPLINES
NEW ENTRANTS
27%
22%
16%
DOCTORATES
25%
23%
16%
PARTICIPATION
7%
9%
INTERNATIONAL STUDENTS
4,354 169
28% 11%
Full-time Part-time
RESEARCH
€ 101.41 m 3.0
Contract Research Income
FIRST DESTINATION OF 2018 GRADUATES
71% 89%
Trinity College Dublin
Sta
tistic
al h
ighlig
hts
3,307
New Entrants Graduates
Undergraduate
Enrolments
Postgraduate
Enrolments
Health and welfare
Arts and humanities
Natural sciences, mathematics and statistics
Health and welfare
Natural sciences, mathematics and statistics
Arts and humanities
Level 8
Graduates in
Employment
Level 9/10
Graduates in
Employment
Mature Students
Entrants with a Disability
5%Entrants from Disadvantaged Socio-economic
backgrounds
Doctoral
Graduates per
10 Academic
Staff

62
No. No. %
New Entrants Year 1 (Full-time Undergraduate) 3,113 Undergraduate Graduates 3,081 55%
New Entrants Year 2+ (Full-time Undergraduate) 194 Postgraduate Graduates 2,533 45%
Full-time Part-time Remote Total Full-time Part-time Remote Total
Other Enrolments (IoTs only) No. 0 0 0 0 Other Enrolments (IoTs only) 0% 0% 0% 0%
QQI L5 Certificate No. 0 0 0 0 QQI L5 Certificate 0% 0% 0% 0%
QQI L6 Advanced Certificate No. 0 0 0 0 QQI L6 Advanced Certificate 0% 0% 0% 0%
of which are apprenticeships No. 0 0 0 0of which are
apprenticeships 0% 0% 0% 0%
Undergraduate No. 12,131 76 0 12,207 Undergraduate 99% 1% 0% 71%
Foundation/Access No. 64 0 0 64 Foundation/Access 100% 0% 0% 1%
Diploma No. 83 19 0 102 Diploma 81% 19% 0% 1%
Certificate No. 0 42 0 42 Certificate 0% 100% 0% 0%
Higher Certificate No. 0 0 0 0 Higher Certificate 0% 0% 0% 0%
Ordinary Degree (L7) No. 0 0 0 0 Ordinary Degree (L7) 0% 0% 0% 0%
Honours Degree (L8) No. 11,977 15 0 11,992 Honours Degree (L8) 100% 0% 0% 98%
Occasional No. 7 0 0 7 Occasional 100% 0% 0% 0%
Postgraduate No. 3,412 1,520 97 5,029 Postgraduate 68% 30% 2% 29%
Postgrad Diploma No. 36 178 34 248 Postgrad Diploma 15% 72% 14% 5%
Postgrad Higher Diploma No. 58 0 0 58 Postgrad Higher Diploma 100% 0% 0% 1%
Postgrad Certificate No. 0 309 23 332 Postgrad Certificate 0% 93% 7% 7%
Masters Taught (L9) No. 1,881 767 40 2,688 Masters Taught (L9) 70% 29% 1% 53%
Masters Research (L9) No. 52 22 0 74 Masters Research (L9) 70% 30% 0% 1%
Doctorate (L10) No. 1,316 212 0 1,528 Doctorate (L10) 86% 14% 0% 30%
Occasional No. 69 32 0 101 Occasional 68% 32% 0% 2%
Total UG and PG Enrolments No. 15,543 1,596 97 17,236 Total UG and PG Enrolments 90% 9% 1% 100%
Research & Taught (L9/10) FTE 3,770 Research & Taught (L9/10) 23.3%
Research (L9/10) FTE 1,485 Research (L9/10) 9.2%
Research (L10) FTE 1,422 Research (L10) 8.8%
No. % No. %
Generic programmes and qualifications 64 2% Generic programmes and qualifications 0 0%
Education 11 0% Education 69 5%
Arts and humanities 690 22% Arts and humanities 250 16%
Social sciences, journalism and information 356 11% Social sciences, journalism and information 195 13%
Business, administration and law 317 10% Business, administration and law 74 5%
Natural sciences, mathematics and statistics 493 16% Natural sciences, mathematics and statistics 352 23%
Information and Communication Technologies (ICTs) 117 4% Information and Communication Technologies (ICTs) 92 6%
Engineering, Manufacturing & Construction 222 7% Engineering, Manufacturing & Construction 112 7%
Agriculture, forestry, fisheries and veterinary 0 0% Agriculture, forestry, fisheries and veterinary 0 0%
Health and welfare 843 27% Health and welfare 384 25%
Services 0 0% Services 0 0%
Total 3,113 100% Total 1,528 100%
No. %Mature Entrants Year 1 (Full-time Undergraduate) 227 7%Mature Entrants Year 2+ (Full-time Undergraduate) 69
No. %
Flexible Learners (PT, Distance, E-Learning, In-Service) 1,693 10%
145 2%
36%39% Regional Intake (% of Full-time Enrolments) No. %
19% from the institution's county 51%
5% from the institution's county and bordering counties 68%
No. %4,354 28% Erasmus Students Incoming (excl. work placements) 530
EU 1,251 8%Non-EU 3,103 20% Total no. of International (FT, PT & Erasmus Incoming) Students 5,053
No. % Erasmus Students Outgoing 361169 11% Other Exchange Outgoing 72
EU 65 4%Non-EU 104 7%
Trinity College Dublin - Profile 2018/19
STUDENT NUMBERSEntrants Graduates
Enrolments
% FTE Honours Bach Degree L8 and all PG
% FTE Honours Bach Degree L8 and all PG
% FTE Honours Bach Degree L8 and all PG
DISCIPLINARY MIXFirst Year Full-time Undergraduate New Entrants Doctorate (All modes)
PARTICIPATION(% of New Entrants)
Students in receipt of the Fund for Students with Disabilities (% of Full-
time UG & PG Enrolments)1,356 9%
(% of Total Enrolments incl. Flexible Learning)
Deprivation Index Scores (% of Full-time and Part-time, Undergraduate
and Postgraduate Enrolments) Springboard+ enrolments (% of National Participation) Affluent Marginally above average
Marginally Below average
Disadvantaged
INTERNATIONALISATIONInternational Students (Full-time)
(% of Full-time Enrolments)
International Students (Part-time)
(% of Part-time Enrolments)

63
Level 6 Level 7 Level 8
% % %
Generic programmes and qualifications - - - Indicator Indicator Score (out of 60)
Education - - 9% Higher Order Learning 38.6
Arts and humanities - - 8% Reflective and Integrative Learning 34.2
Social sciences, journalism and information - - 5% Quantitative Reasoning 21.3
Business, administration and law - - 6% Learning Strategies 33.2
Natural sciences, mathematics and statistics - - 10% Collaborative Learning 29.9
Information and Communication Technologies (ICTs) - - 11% Student-Faculty Interaction 12.4
Engineering, Manufacturing & Construction - - 7% Effective Teaching Practices 32.5
Agriculture, forestry, fisheries and veterinary - - - Quality of Interactions 36.3
Health and welfare - - 6% Supportive Environment 28.7
Services - - -
Total - - 7%
No. of Doctorate Graduates per 10 Academic Staff 3.0
No. Contract Research Income (€000) 101,410
Priority Patent Applications 16 State and Semi-State 56,699
Total Patents Granted 20 EU 19,522Invention Disclosures 57 Industry 5,411
Licence agreements (institution - private industry) 23 Other 12,013
Spin-out companies created 6 Contribution in respect of overheads 7,765
%
Level 8 Graduates in Permanent/Temporary Employment 71% Total Contract Research Income per Academic Staff €105,330
Level 8 Graduates in Further Study 23% EU Contract Research Income per Academic Staff €20,277
Level 9/10 Graduates in Permament/Temporary Employment 89%
Level 9/10 Graduates in Further Study 5%
Core Staff 1,717 100% Total Income (€000) 317,665 100%
Academic Staff 683 40% State Grants 50,363 16%
Support staff 1,034 60% Fees 151,758 48%
Contract Research & Specialist Staff 1,618 100% HEA Fees 38,060 12%
Academic Staff 1,045 65% Other Fees 113,698 36%
Support staff 574 35% Research Grants & Contracts 87,786 28%
Total Staff 3,335 100% Other Income 27,758 9%
Total Academic 1,728 52% Total Expenditure (€000) 318,353 100%
Total Support 1,607 48% Core - Pay 158,273 50%
Core - Non-Pay 72,294 23%
Non-Academic/Academic All Staff Ratio 0.9 Research Grants & Contracts - Pay 59,970 19%
Student FTE/Academic Staff Ratio 17 Research Grants & Contracts - Non-Pay 27,816 9%
Staff Age Profile (Proportion of Staff aged…) %20-39 36% Total Expenditure per Student (SRS)
112,880
40-54 42% Exchequer/Non-Exchequer Fees Ratio 0.3
55 and above 22%
Proportion of Academic Staff who are female 46% Pay/Non-Pay Expenditure Ratio (incl. Research) 2.2
Proportion of Staff at Most Senior Academic Grade who are Female 29% Pay/Non-Pay Expenditure Ratio (excl. Research) 2.2
Staff Qualifications (Proportion of…) %
Full-time Permanent Academic Staff with Masters or higher qual. 100%Full-time Permanent Academic Staff with Doctorate qualification 80%
All Permanent Academic Staff with Masters or higher qualification 100%All Permanent Academic Staff with Doctorate qualification 79%
Trinity College Dublin - Profile 2018/19 - continued
TEACHING AND LEARNING
Non-Progression Rate from 1st to 2nd Year Engagement Indicators (Irish Survey of Student Engagement 2019)
RESEARCH, KNOWLEDGE TRANSFER AND GRADUATE OUTCOMES
2019
Graduate Outomes (2019 Graduates)
STAFF FINANCIAL DATA
1 Total expenditure per FTE student excluding research and depreciation with pension adjustments, based on
unadjusted SRS numbers.
0
50
100
150
200
250
300
350
400
Flexible Learners(as % of all Enrolment)
Participants in Labour Market Activation(Springboard)
Level 6/7 Enrolment(as % of all Enrolment)
FT Mature Entrants(as % of all FT New Entrants)
FT New Entrants from DisadvantagedBackgrounds
FTE Research Enrolment (as % of FTELevel 8 and Postgraduate Enrolment)
Doctorate Graduates per 10 AcademicStaff
Total Contract Research Income perAcademic Staff
EU Contract Research Income perAcademic Staff
Graduates in Employment (Level 8)
Progression Rate Level 81st to 2nd Year
Non-Academic/Academic Staff ratio(Core staff)
Student FTE/Academic Staff ratio(FTE students/Core Academic staff)
Pay/Non-Pay ratio (excl. Research)
Exchequer/Non-Exchequer Fees ratio
Total Expenditure per FTE Student, SRS(excl. Depreciation & Research)
Maximum HEA TCD Average All HEA

64
STUDENT NUMBERS
STUDENT NUMBERS
7,048
Enrolments
15,842 5,318
TOP DISCIPLINES
NEW ENTRANTS
24%
20%
19%
DOCTORATES
32%
23%
18%
PARTICIPATION
7%
8%
INTERNATIONAL STUDENTS
2,732 151
15% 5%
Full-time Part-time
RESEARCH
€ 99.032 m 1.9
Contract Research Income
FIRST DESTINATION OF 2018 GRADUATES
65% 83%
University College Cork
Sta
tistic
al h
ighlig
hts
3,735
New Entrants Graduates
Undergraduate
Enrolments
Postgraduate
Enrolments
Arts and humanities
Health and welfare
Business, administration and law
Natural sciences, mathematics and statistics
Arts and humanities
Health and welfare
Level 8
Graduates in
Employment
Level 9/10
Graduates in
Employment
Mature Students
Entrants with a Disability
6%Entrants from Disadvantaged Socio-economic
backgrounds
Doctoral
Graduates per
10 Academic
Staff

65
No. No. %
New Entrants Year 1 (Full-time Undergraduate) 3,608 Undergraduate Graduates 4,082 58%
New Entrants Year 2+ (Full-time Undergraduate) 127 Postgraduate Graduates 2,966 42%
Full-time Part-time Remote Total Full-time Part-time Remote Total
Other Enrolments (IoTs only) No. 0 0 0 0 Other Enrolments (IoTs only) 0% 0% 0% 0%
QQI L5 Certificate No. 0 0 0 0 QQI L5 Certificate 0% 0% 0% 0%
QQI L6 Advanced Certificate No. 0 0 0 0 QQI L6 Advanced Certificate 0% 0% 0% 0%
of which are apprenticeships No. 0 0 0 0of which are
apprenticeships 0% 0% 0% 0%
Undergraduate No. 14,579 1,242 21 15,842 Undergraduate 92% 8% 0% 75%
Foundation/Access No. 0 0 0 0 Foundation/Access 0% 0% 0% 0%
Diploma No. 197 713 0 910 Diploma 22% 78% 0% 6%
Certificate No. 0 402 0 402 Certificate 0% 100% 0% 3%
Higher Certificate No. 0 0 0 0 Higher Certificate 0% 0% 0% 0%
Ordinary Degree (L7) No. 0 0 21 21 Ordinary Degree (L7) 0% 0% 100% 0%
Honours Degree (L8) No. 13,640 65 0 13,705 Honours Degree (L8) 100% 0% 0% 87%
Occasional No. 742 62 0 804 Occasional 92% 8% 0% 5%
Postgraduate No. 3,142 2,015 161 5,318 Postgraduate 59% 38% 3% 25%
Postgrad Diploma No. 134 188 0 322 Postgrad Diploma 42% 58% 0% 6%
Postgrad Higher Diploma No. 96 379 2 477 Postgrad Higher Diploma 20% 79% 0% 9%
Postgrad Certificate No. 25 181 0 206 Postgrad Certificate 12% 88% 0% 4%
Masters Taught (L9) No. 1,758 818 159 2,735 Masters Taught (L9) 64% 30% 6% 51%
Masters Research (L9) No. 160 74 0 234 Masters Research (L9) 68% 32% 0% 4%
Doctorate (L10) No. 933 130 0 1,063 Doctorate (L10) 88% 12% 0% 20%
Occasional No. 36 245 0 281 Occasional 13% 87% 0% 5%
Total UG and PG Enrolments No. 17,721 3,257 182 21,160 Total UG and PG Enrolments 84% 15% 1% 100%
Research & Taught (L9/10) FTE 3,442 Research & Taught (L9/10) 19.2%
Research (L9/10) FTE 1,195 Research (L9/10) 6.7%
Research (L10) FTE 998 Research (L10) 5.6%
No. % No. %
Generic programmes and qualifications 0 0% Generic programmes and qualifications 0 0%
Education 51 1% Education 9 1%
Arts and humanities 872 24% Arts and humanities 247 23%
Social sciences, journalism and information 350 10% Social sciences, journalism and information 35 3%
Business, administration and law 676 19% Business, administration and law 73 7%
Natural sciences, mathematics and statistics 502 14% Natural sciences, mathematics and statistics 340 32%
Information and Communication Technologies (ICTs) 236 7% Information and Communication Technologies (ICTs) 12 1%
Engineering, Manufacturing & Construction 203 6% Engineering, Manufacturing & Construction 160 15%
Agriculture, forestry, fisheries and veterinary 0 0% Agriculture, forestry, fisheries and veterinary 0 0%
Health and welfare 718 20% Health and welfare 187 18%
Services 0 0% Services 0 0%
Total 3,608 100% Total 1,063 100%
No. %Mature Entrants Year 1 (Full-time Undergraduate) 245 7%Mature Entrants Year 2+ (Full-time Undergraduate) 26
No. %
Flexible Learners (PT, Distance, E-Learning, In-Service) 3,439 16%
164 2%
22%48% Regional Intake (% of Full-time Enrolments) No. %
24% from the institution's county 62%
6% from the institution's county and bordering counties 86%
No. %2,732 15% Erasmus Students Incoming (excl. work placements) 734
EU 328 2%Non-EU 2,404 14% Total no. of International (FT, PT & Erasmus Incoming) Students 3,617
No. % Erasmus Students Outgoing 464151 5% Other Exchange Outgoing 0
EU 63 2%Non-EU 88 3%
University College Cork - Profile 2018/19
STUDENT NUMBERSEntrants Graduates
Enrolments
% FTE Honours Bach Degree L8 and all PG
% FTE Honours Bach Degree L8 and all PG
% FTE Honours Bach Degree L8 and all PG
DISCIPLINARY MIXFirst Year Full-time Undergraduate New Entrants Doctorate (All modes)
PARTICIPATION(% of New Entrants)
Students in receipt of the Fund for Students with Disabilities (% of Full-
time UG & PG Enrolments)1,470 8%
(% of Total Enrolments incl. Flexible Learning)
Deprivation Index Scores (% of Full-time and Part-time, Undergraduate
and Postgraduate Enrolments) Springboard+ enrolments (% of National Participation) Affluent Marginally above average
Marginally Below average
Disadvantaged
INTERNATIONALISATIONInternational Students (Full-time)
(% of Full-time Enrolments)
International Students (Part-time)
(% of Part-time Enrolments)

66
Level 6 Level 7 Level 8
% % %
Generic programmes and qualifications - - - Indicator Indicator Score (out of 60)
Education - - 2% Higher Order Learning 38.9
Arts and humanities - - 11% Reflective and Integrative Learning 31.7
Social sciences, journalism and information - - 7% Quantitative Reasoning 19.2
Business, administration and law - - 4% Learning Strategies 31.6
Natural sciences, mathematics and statistics - - 5% Collaborative Learning 25.9
Information and Communication Technologies (ICTs) - - 7% Student-Faculty Interaction 11.3
Engineering, Manufacturing & Construction - - 7% Effective Teaching Practices 34.2
Agriculture, forestry, fisheries and veterinary - - - Quality of Interactions 39.2
Health and welfare - - 6% Supportive Environment 29.7
Services - - -
Total - - 7%
No. of Doctorate Graduates per 10 Academic Staff 1.9
No. Contract Research Income (€000) 99,032
Priority Patent Applications 22 State and Semi-State 67,801
Total Patents Granted 9 EU 14,934Invention Disclosures 77 Industry 12,251
Licence agreements (institution - private industry) 35 Other 4,046
Spin-out companies created 5 Contribution in respect of overheads 0
%
Level 8 Graduates in Permanent/Temporary Employment 65% Total Contract Research Income per Academic Staff €108,928
Level 8 Graduates in Further Study 23% EU Contract Research Income per Academic Staff €16,426
Level 9/10 Graduates in Permament/Temporary Employment 83%
Level 9/10 Graduates in Further Study 4%
Core Staff 1,976 100% Total Income (€000) 340,307 100%
Academic Staff 808 41% State Grants 57,773 17%
Support staff 1,167 59% Fees 146,580 43%
Contract Research & Specialist Staff 923 100% HEA Fees 47,210 14%
Academic Staff 599 65% Other Fees 99,370 29%
Support staff 323 35% Research Grants & Contracts 91,341 27%
Total Staff 2,899 100% Other Income 44,613 13%
Total Academic 1,408 49% Total Expenditure (€000) 340,273 100%
Total Support 1,491 51% Core - Pay 178,208 52%
Core - Non-Pay 70,724 21%
Non-Academic/Academic All Staff Ratio 1.1 Research Grants & Contracts - Pay 66,540 20%
Student FTE/Academic Staff Ratio 21 Research Grants & Contracts - Non-Pay 24,801 7%
Staff Age Profile (Proportion of Staff aged…) %20-39 32% Total Expenditure per Student (SRS)
111,548
40-54 48% Exchequer/Non-Exchequer Fees Ratio 0.5
55 and above 20%
Proportion of Academic Staff who are female 44% Pay/Non-Pay Expenditure Ratio (incl. Research) 2.6
Proportion of Staff at Most Senior Academic Grade who are Female 24% Pay/Non-Pay Expenditure Ratio (excl. Research) 2.5
Staff Qualifications (Proportion of…) %
Full-time Permanent Academic Staff with Masters or higher qual. 100%Full-time Permanent Academic Staff with Doctorate qualification 71%
All Permanent Academic Staff with Masters or higher qualification 100%All Permanent Academic Staff with Doctorate qualification 70%
University College Cork - Profile 2018/19 - continued
TEACHING AND LEARNING
Non-Progression Rate from 1st to 2nd Year Engagement Indicators (Irish Survey of Student Engagement 2019)
RESEARCH, KNOWLEDGE TRANSFER AND GRADUATE OUTCOMES
2019
Graduate Outomes (2019 Graduates)
STAFF FINANCIAL DATA
1 Total expenditure per FTE student excluding research and depreciation with pension adjustments, based on
unadjusted SRS numbers.
0
50
100
150
200
250
300
350
400
Flexible Learners(as % of all Enrolment)
Participants in Labour Market Activation(Springboard)
Level 6/7 Enrolment(as % of all Enrolment)
FT Mature Entrants(as % of all FT New Entrants)
FT New Entrants from DisadvantagedBackgrounds
FTE Research Enrolment (as % of FTELevel 8 and Postgraduate Enrolment)
Doctorate Graduates per 10 AcademicStaff
Total Contract Research Income perAcademic Staff
EU Contract Research Income perAcademic Staff
Graduates in Employment (Level 8)
Progression Rate Level 81st to 2nd Year
Non-Academic/Academic Staff ratio(Core staff)
Student FTE/Academic Staff ratio(FTE students/Core Academic staff)
Pay/Non-Pay ratio (excl. Research)
Exchequer/Non-Exchequer Fees ratio
Total Expenditure per FTE Student, SRS(excl. Depreciation & Research)
Maximum HEA UCC Average All HEA

67
STUDENT NUMBERS
STUDENT NUMBERS
9,763
Enrolments
18,477 9,660
TOP DISCIPLINES
NEW ENTRANTS
19%
17%
16%
DOCTORATES
20%
17%
16%
PARTICIPATION
5%
5%
INTERNATIONAL STUDENTS
4,919 267
22% 7%
Full-time Part-time
RESEARCH
€ 89.221 m 2.3
Contract Research Income
FIRST DESTINATION OF 2018 GRADUATES
65% 88%
University College Dublin
Sta
tistic
al h
ighlig
hts
4,290
New Entrants Graduates
Undergraduate
Enrolments
Postgraduate
Enrolments
Arts and humanities
Business, administration and law
Health and welfare
Engineering, Manufacturing & Construction
Natural sciences, mathematics and statistics
Health and welfare
Level 8
Graduates in
Employment
Level 9/10
Graduates in
Employment
Mature Students
Entrants with a Disability
5%Entrants from Disadvantaged Socio-economic
backgrounds
Doctoral
Graduates per
10 Academic
Staff

68
No. No. %
New Entrants Year 1 (Full-time Undergraduate) 4,229 Undergraduate Graduates 4,447 46%
New Entrants Year 2+ (Full-time Undergraduate) 61 Postgraduate Graduates 5,316 54%
Full-time Part-time Remote Total Full-time Part-time Remote Total
Other Enrolments (IoTs only) No. 0 0 0 0 Other Enrolments (IoTs only) 0% 0% 0% 0%
QQI L5 Certificate No. 0 0 0 0 QQI L5 Certificate 0% 0% 0% 0%
QQI L6 Advanced Certificate No. 0 0 0 0 QQI L6 Advanced Certificate 0% 0% 0% 0%
of which are apprenticeships No. 0 0 0 0of which are
apprenticeships 0% 0% 0% 0%
Undergraduate No. 17,468 768 241 18,477 Undergraduate 95% 4% 1% 66%
Foundation/Access No. 0 0 0 0 Foundation/Access 0% 0% 0% 0%
Diploma No. 86 216 115 417 Diploma 21% 52% 28% 2%
Certificate No. 2 240 34 276 Certificate 1% 87% 12% 1%
Higher Certificate No. 0 0 0 0 Higher Certificate 0% 0% 0% 0%
Ordinary Degree (L7) No. 0 0 0 0 Ordinary Degree (L7) 0% 0% 0% 0%
Honours Degree (L8) No. 16,133 85 92 16,310 Honours Degree (L8) 99% 1% 1% 88%
Occasional No. 1,247 227 0 1,474 Occasional 85% 15% 0% 8%
Postgraduate No. 5,324 3,174 1,162 9,660 Postgraduate 55% 33% 12% 34%
Postgrad Diploma No. 269 942 194 1,405 Postgrad Diploma 19% 67% 14% 15%
Postgrad Higher Diploma No. 191 15 0 206 Postgrad Higher Diploma 93% 7% 0% 2%
Postgrad Certificate No. 14 652 139 805 Postgrad Certificate 2% 81% 17% 8%
Masters Taught (L9) No. 3,378 1,258 426 5,062 Masters Taught (L9) 67% 25% 8% 52%
Masters Research (L9) No. 139 29 0 168 Masters Research (L9) 83% 17% 0% 2%
Doctorate (L10) No. 1,333 278 0 1,611 Doctorate (L10) 83% 17% 0% 17%
Occasional No. 0 0 403 403 Occasional 0% 0% 100% 4%
Total UG and PG Enrolments No. 22,792 3,942 1,403 28,137 Total UG and PG Enrolments 81% 14% 5% 100%
Research & Taught (L9/10) FTE 5,846 Research & Taught (L9/10) 24.7%
Research (L9/10) FTE 1,626 Research (L9/10) 6.9%
Research (L10) FTE 1,472 Research (L10) 6.2%
No. % No. %
Generic programmes and qualifications 0 0% Generic programmes and qualifications 0 0%
Education 0 0% Education 80 5%
Arts and humanities 787 19% Arts and humanities 146 9%
Social sciences, journalism and information 582 14% Social sciences, journalism and information 211 13%
Business, administration and law 709 17% Business, administration and law 64 4%
Natural sciences, mathematics and statistics 581 14% Natural sciences, mathematics and statistics 270 17%
Information and Communication Technologies (ICTs) 125 3% Information and Communication Technologies (ICTs) 104 6%
Engineering, Manufacturing & Construction 373 9% Engineering, Manufacturing & Construction 322 20%
Agriculture, forestry, fisheries and veterinary 376 9% Agriculture, forestry, fisheries and veterinary 163 10%
Health and welfare 696 16% Health and welfare 251 16%
Services 0 0% Services 0 0%
Total 4,229 100% Total 1,611 100%
No. %Mature Entrants Year 1 (Full-time Undergraduate) 222 5%Mature Entrants Year 2+ (Full-time Undergraduate) 3
No. %
Flexible Learners (PT, Distance, E-Learning, In-Service) 5,345 19%
431 5%
35%38% Regional Intake (% of Full-time Enrolments) No. %
21% from the institution's county 47%
5% from the institution's county and bordering counties 63%
No. %4,919 22% Erasmus Students Incoming (excl. work placements) 716
EU 782 3%Non-EU 4,137 18% Total no. of International (FT, PT & Erasmus Incoming) Students 5,902
No. % Erasmus Students Outgoing 438267 7% Other Exchange Outgoing 313
EU 167 4%Non-EU 100 3%
University College Dublin - Profile 2018/19
STUDENT NUMBERSEntrants Graduates
Enrolments
% FTE Honours Bach Degree L8 and all PG
% FTE Honours Bach Degree L8 and all PG
% FTE Honours Bach Degree L8 and all PG
DISCIPLINARY MIXFirst Year Full-time Undergraduate New Entrants Doctorate (All modes)
PARTICIPATION(% of New Entrants)
Students in receipt of the Fund for Students with Disabilities (% of Full-
time UG & PG Enrolments)1,214 5%
(% of Total Enrolments incl. Flexible Learning)
Deprivation Index Scores (% of Full-time and Part-time, Undergraduate
and Postgraduate Enrolments) Springboard+ enrolments (% of National Participation) Affluent Marginally above average
Marginally Below average
Disadvantaged
INTERNATIONALISATIONInternational Students (Full-time)
(% of Full-time Enrolments)
International Students (Part-time)
(% of Part-time Enrolments)

69
Level 6 Level 7 Level 8
% % %
Generic programmes and qualifications - - - Indicator Indicator Score (out of 60)
Education - - - Higher Order Learning 38.4
Arts and humanities - - 14% Reflective and Integrative Learning 32.9
Social sciences, journalism and information - - 7% Quantitative Reasoning 22.4
Business, administration and law - - 3% Learning Strategies 32.6
Natural sciences, mathematics and statistics - - 7% Collaborative Learning 30.4
Information and Communication Technologies (ICTs) - - 2% Student-Faculty Interaction 13.6
Engineering, Manufacturing & Construction - - 5% Effective Teaching Practices 34.0
Agriculture, forestry, fisheries and veterinary - - 5% Quality of Interactions 39.4
Health and welfare - - 5% Supportive Environment 30.4
Services - - -
Total - - 8%
No. of Doctorate Graduates per 10 Academic Staff 2.3
No. Contract Research Income (€000) 89,221
Priority Patent Applications 23 State and Semi-State 51,235
Total Patents Granted 10 EU 17,433Invention Disclosures 75 Industry 2,962
Licence agreements (institution - private industry) 25 Other 10,285
Spin-out companies created 5 Contribution in respect of overheads 7,306
%
Level 8 Graduates in Permanent/Temporary Employment 65% Total Contract Research Income per Academic Staff €71,814
Level 8 Graduates in Further Study 30% EU Contract Research Income per Academic Staff €14,032
Level 9/10 Graduates in Permament/Temporary Employment 88%
Level 9/10 Graduates in Further Study 5%
Core Staff 2,151 100% Total Income (€000) 405,430 100%
Academic Staff 1,046 49% State Grants 70,432 17%
Support staff 1,105 51% Fees 233,690 58%
Contract Research & Specialist Staff 1,461 100% HEA Fees 45,807 11%
Academic Staff 671 46% Other Fees 187,883 46%
Support staff 790 54% Research Grants & Contracts 79,224 20%
Total Staff 3,612 100% Other Income 22,084 5%
Total Academic 1,717 48% Total Expenditure (€000) 405,224 100%
Total Support 1,895 52% Core - Pay 250,857 62%
Core - Non-Pay 75,143 19%
Non-Academic/Academic All Staff Ratio 1.1 Research Grants & Contracts - Pay 58,760 15%
Student FTE/Academic Staff Ratio 20 Research Grants & Contracts - Non-Pay 20,464 5%
Staff Age Profile (Proportion of Staff aged…) %20-39 37% Total Expenditure per Student (SRS)
111,659
40-54 43% Exchequer/Non-Exchequer Fees Ratio 0.2
55 and above 20%
Proportion of Academic Staff who are female 43% Pay/Non-Pay Expenditure Ratio (incl. Research) 3.2
Proportion of Staff at Most Senior Academic Grade who are Female 24% Pay/Non-Pay Expenditure Ratio (excl. Research) 3.3
Staff Qualifications (Proportion of…) %
Full-time Permanent Academic Staff with Masters or higher qual. 100%Full-time Permanent Academic Staff with Doctorate qualification 91%
All Permanent Academic Staff with Masters or higher qualification 100%All Permanent Academic Staff with Doctorate qualification 90%
University College Dublin - Profile 2018/19 - continued
TEACHING AND LEARNING
Non-Progression Rate from 1st to 2nd Year Engagement Indicators (Irish Survey of Student Engagement 2019)
RESEARCH, KNOWLEDGE TRANSFER AND GRADUATE OUTCOMES
2019
Graduate Outomes (2019 Graduates)
STAFF FINANCIAL DATA
1 Total expenditure per FTE student excluding research and depreciation with pension adjustments, based on
unadjusted SRS numbers.
0
50
100
150
200
250
300
350
400
Flexible Learners(as % of all Enrolment)
Participants in Labour Market Activation(Springboard)
Level 6/7 Enrolment(as % of all Enrolment)
FT Mature Entrants(as % of all FT New Entrants)
FT New Entrants from DisadvantagedBackgrounds
FTE Research Enrolment (as % of FTELevel 8 and Postgraduate Enrolment)
Doctorate Graduates per 10 AcademicStaff
Total Contract Research Income perAcademic Staff
EU Contract Research Income perAcademic Staff
Graduates in Employment (Level 8)
Progression Rate Level 81st to 2nd Year
Non-Academic/Academic Staff ratio(Core staff)
Student FTE/Academic Staff ratio(FTE students/Core Academic staff)
Pay/Non-Pay ratio (excl. Research)
Exchequer/Non-Exchequer Fees ratio
Total Expenditure per FTE Student, SRS(excl. Depreciation & Research)
Maximum HEA UCD Average All HEA

70
STUDENT NUMBERS
STUDENT NUMBERS
4,658
Enrolments
12,168 3,444
TOP DISCIPLINES
NEW ENTRANTS
23%
19%
18%
DOCTORATES
19%
19%
18%
PARTICIPATION
5%
6%
INTERNATIONAL STUDENTS
1,727 32
13% 2%
Full-time Part-time
RESEARCH
€ 34.248 m 1.9
Contract Research Income
FIRST DESTINATION OF 2018 GRADUATES
79% 90%
University of Limerick
Sta
tistic
al h
ighlig
hts
2,477
New Entrants Graduates
Undergraduate
Enrolments
Postgraduate
Enrolments
Business, administration and law
Arts and humanities
Engineering, Manufacturing & Construction
Social sciences, journalism and information
Natural sciences, mathematics and statistics
Engineering, Manufacturing & Construction
Level 8
Graduates in
Employment
Level 9/10
Graduates in
Employment
Mature Students
Entrants with a Disability
8%Entrants from Disadvantaged Socio-economic
backgrounds
Doctoral
Graduates per
10 Academic
Staff

71
No. No. %
New Entrants Year 1 (Full-time Undergraduate) 2,445 Undergraduate Graduates 3,182 68%
New Entrants Year 2+ (Full-time Undergraduate) 32 Postgraduate Graduates 1,476 32%
Full-time Part-time Remote Total Full-time Part-time Remote Total
Other Enrolments (IoTs only) No. 0 0 0 0 Other Enrolments (IoTs only) 0% 0% 0% 0%
QQI L5 Certificate No. 0 0 0 0 QQI L5 Certificate 0% 0% 0% 0%
QQI L6 Advanced Certificate No. 0 0 0 0 QQI L6 Advanced Certificate 0% 0% 0% 0%
of which are apprenticeships No. 0 0 0 0of which are
apprenticeships 0% 0% 0% 0%
Undergraduate No. 10,985 424 759 12,168 Undergraduate 90% 3% 6% 78%
Foundation/Access No. 74 0 0 74 Foundation/Access 100% 0% 0% 1%
Diploma No. 58 211 438 707 Diploma 8% 30% 62% 6%
Certificate No. 16 62 205 283 Certificate 6% 22% 72% 2%
Higher Certificate No. 81 33 0 114 Higher Certificate 71% 29% 0% 1%
Ordinary Degree (L7) No. 0 0 0 0 Ordinary Degree (L7) 0% 0% 0% 0%
Honours Degree (L8) No. 10,328 118 116 10,562 Honours Degree (L8) 98% 1% 1% 87%
Occasional No. 428 0 0 428 Occasional 100% 0% 0% 4%
Postgraduate No. 2,068 954 422 3,444 Postgraduate 60% 28% 12% 22%
Postgrad Diploma No. 22 403 232 657 Postgrad Diploma 3% 61% 35% 19%
Postgrad Higher Diploma No. 31 3 0 34 Postgrad Higher Diploma 91% 9% 0% 1%
Postgrad Certificate No. 15 0 26 41 Postgrad Certificate 37% 0% 63% 1%
Masters Taught (L9) No. 1,266 440 164 1,870 Masters Taught (L9) 68% 24% 9% 54%
Masters Research (L9) No. 61 19 0 80 Masters Research (L9) 76% 24% 0% 2%
Doctorate (L10) No. 673 89 0 762 Doctorate (L10) 88% 12% 0% 22%
Occasional No. 0 0 0 0 Occasional 0% 0% 0% 0%
Total UG and PG Enrolments No. 13,053 1,378 1,181 15,612 Total UG and PG Enrolments 84% 9% 8% 100%
Research & Taught (L9/10) FTE 2,356 Research & Taught (L9/10) 17.8%
Research (L9/10) FTE 788 Research (L9/10) 6.0%
Research (L10) FTE 718 Research (L10) 5.4%
No. % No. %
Generic programmes and qualifications 0 0% Generic programmes and qualifications 0 0%
Education 253 10% Education 86 11%
Arts and humanities 464 19% Arts and humanities 60 8%
Social sciences, journalism and information 73 3% Social sciences, journalism and information 147 19%
Business, administration and law 573 23% Business, administration and law 94 12%
Natural sciences, mathematics and statistics 286 12% Natural sciences, mathematics and statistics 142 19%
Information and Communication Technologies (ICTs) 149 6% Information and Communication Technologies (ICTs) 46 6%
Engineering, Manufacturing & Construction 441 18% Engineering, Manufacturing & Construction 135 18%
Agriculture, forestry, fisheries and veterinary 0 0% Agriculture, forestry, fisheries and veterinary 0 0%
Health and welfare 159 7% Health and welfare 52 7%
Services 47 2% Services 0 0%
Total 2,445 100% Total 762 100%
No. %Mature Entrants Year 1 (Full-time Undergraduate) 119 5%Mature Entrants Year 2+ (Full-time Undergraduate) 2
No. %
Flexible Learners (PT, Distance, E-Learning, In-Service) 2,559 16%
281 3%
12%46% Regional Intake (% of Full-time Enrolments) No. %
34% from the institution's county 25%
8% from the institution's county and bordering counties 64%
No. %1,727 13% Erasmus Students Incoming (excl. work placements) 569
EU 287 2%Non-EU 1,440 11% Total no. of International (FT, PT & Erasmus Incoming) Students 2,328
No. % Erasmus Students Outgoing 51232 2% Other Exchange Outgoing 67
EU 19 1%Non-EU 13 1%
University of Limerick - Profile 2018/19
STUDENT NUMBERSEntrants Graduates
Enrolments
% FTE Honours Bach Degree L8 and all PG
% FTE Honours Bach Degree L8 and all PG
% FTE Honours Bach Degree L8 and all PG
DISCIPLINARY MIXFirst Year Full-time Undergraduate New Entrants Doctorate (All modes)
PARTICIPATION(% of New Entrants)
Students in receipt of the Fund for Students with Disabilities (% of Full-
time UG & PG Enrolments)804 6%
(% of Total Enrolments incl. Flexible Learning)
Deprivation Index Scores (% of Full-time and Part-time, Undergraduate
and Postgraduate Enrolments) Springboard+ enrolments (% of National Participation) Affluent Marginally above average
Marginally Below average
Disadvantaged
INTERNATIONALISATIONInternational Students (Full-time)
(% of Full-time Enrolments)
International Students (Part-time)
(% of Part-time Enrolments)

72
Level 6 Level 7 Level 8
% % %
Generic programmes and qualifications - - - Indicator Indicator Score (out of 60)
Education - - 5% Higher Order Learning 37.8
Arts and humanities - - 16% Reflective and Integrative Learning 31.5
Social sciences, journalism and information - - 6% Quantitative Reasoning 21.2
Business, administration and law - - 6% Learning Strategies 32.2
Natural sciences, mathematics and statistics - - 7% Collaborative Learning 33.5
Information and Communication Technologies (ICTs) - - 10% Student-Faculty Interaction 13.3
Engineering, Manufacturing & Construction - - 7% Effective Teaching Practices 35.5
Agriculture, forestry, fisheries and veterinary - - - Quality of Interactions 37.9
Health and welfare - - 7% Supportive Environment 30.8
Services - - 13%
Total - - 9%
No. of Doctorate Graduates per 10 Academic Staff 1.9
No. Contract Research Income (€000) 34,248
Priority Patent Applications 11 State and Semi-State 25,890
Total Patents Granted 8 EU 3,286Invention Disclosures 21 Industry 2,550
Licence agreements (institution - private industry) 5 Other 2,522
Spin-out companies created 2 Contribution in respect of overheads 0
%
Level 8 Graduates in Permanent/Temporary Employment 79% Total Contract Research Income per Academic Staff €54,506
Level 8 Graduates in Further Study 17% EU Contract Research Income per Academic Staff €5,230
Level 9/10 Graduates in Permament/Temporary Employment 90%
Level 9/10 Graduates in Further Study 4%
Core Staff 1,059 100% Total Income (€000) 205,350 100%
Academic Staff 547 52% State Grants 47,278 23%
Support staff 511 48% Fees 102,743 50%
Contract Research & Specialist Staff 453 100% HEA Fees 32,648 16%
Academic Staff 313 69% Other Fees 70,095 34%
Support staff 140 31% Research Grants & Contracts 36,240 18%
Total Staff 1,512 100% Other Income 19,089 9%
Total Academic 861 57% Total Expenditure (€000) 210,100 100%
Total Support 651 43% Core - Pay 122,973 59%
Core - Non-Pay 50,881 24%
Non-Academic/Academic All Staff Ratio 0.8 Research Grants & Contracts - Pay 18,260 9%
Student FTE/Academic Staff Ratio 23 Research Grants & Contracts - Non-Pay 17,986 9%
Staff Age Profile (Proportion of Staff aged…) %20-39 33% Total Expenditure per Student (SRS)
111,719
40-54 47% Exchequer/Non-Exchequer Fees Ratio 0.5
55 and above 20%
Proportion of Academic Staff who are female 45% Pay/Non-Pay Expenditure Ratio (incl. Research) 2.1
Proportion of Staff at Most Senior Academic Grade who are Female 31% Pay/Non-Pay Expenditure Ratio (excl. Research) 2.4
Staff Qualifications (Proportion of…) %
Full-time Permanent Academic Staff with Masters or higher qual. 100%Full-time Permanent Academic Staff with Doctorate qualification 91%
All Permanent Academic Staff with Masters or higher qualification 100%All Permanent Academic Staff with Doctorate qualification 91%
University of Limerick - Profile 2018/19 - continued
TEACHING AND LEARNING
Non-Progression Rate from 1st to 2nd Year Engagement Indicators (Irish Survey of Student Engagement 2019)
RESEARCH, KNOWLEDGE TRANSFER AND GRADUATE OUTCOMES
2019
Graduate Outomes (2019 Graduates)
STAFF FINANCIAL DATA
1 Total expenditure per FTE student excluding research and depreciation with pension adjustments, based on
unadjusted SRS numbers.
0
50
100
150
200
250
300
350
400
Flexible Learners(as % of all Enrolment)
Participants in Labour Market Activation(Springboard)
Level 6/7 Enrolment(as % of all Enrolment)
FT Mature Entrants(as % of all FT New Entrants)
FT New Entrants from DisadvantagedBackgrounds
FTE Research Enrolment (as % of FTELevel 8 and Postgraduate Enrolment)
Doctorate Graduates per 10 AcademicStaff
Total Contract Research Income perAcademic Staff
EU Contract Research Income perAcademic Staff
Graduates in Employment (Level 8)
Progression Rate Level 81st to 2nd Year
Non-Academic/Academic Staff ratio(Core staff)
Student FTE/Academic Staff ratio(FTE students/Core Academic staff)
Pay/Non-Pay ratio (excl. Research)
Exchequer/Non-Exchequer Fees ratio
Total Expenditure per FTE Student, SRS(excl. Depreciation & Research)
Maximum HEA UL Average All HEA

73
STUDENT NUMBERS
STUDENT NUMBERS
2,219
Enrolments
7,297 987
TOP DISCIPLINES
NEW ENTRANTS
26%
20%
14%
DOCTORATES
37%
33%
9%
PARTICIPATION
13%
7%
INTERNATIONAL STUDENTS
567 50
9% 3%
Full-time Part-time
RESEARCH
€ 21.002 m 0.4
Contract Research Income
FIRST DESTINATION OF 2018 GRADUATES
81% 88%
Waterford Institute of
Technology
Sta
tistic
al h
ighlig
hts
1,987
New Entrants Graduates
Undergraduate
Enrolments
Postgraduate
Enrolments
Business, administration and law
Health and welfare
Services
Business, administration and law
Natural sciences, mathematics and statistics
Engineering, Manufacturing & Construction
Level 8
Graduates in
Employment
Level 9/10
Graduates in
Employment
Mature Students
Entrants with a Disability
17%Entrants from Disadvantaged Socio-economic
backgrounds
Doctoral
Graduates per
10 Academic
Staff

74
No. No. %
New Entrants Year 1 (Full-time Undergraduate) 1,936 Undergraduate Graduates 1,853 84%
New Entrants Year 2+ (Full-time Undergraduate) 51 Postgraduate Graduates 366 16%
Full-time Part-time Remote Total Full-time Part-time Remote Total
Other Enrolments (IoTs only) No. 0 352 0 352 Other Enrolments (IoTs only) 0% 100% 0% 100%
QQI L5 Certificate No. 0 0 0 0 QQI L5 Certificate 0% 0% 0% 0%
QQI L6 Advanced Certificate No. 0 352 0 352 QQI L6 Advanced Certificate 0% 100% 0% 100%
of which are apprenticeships No. 0 352 0 352of which are
apprenticeships 0% 100% 0% 100%
Undergraduate No. 6,198 1,096 3 7,297 Undergraduate 85% 15% 0% 88%
Foundation/Access No. 0 0 0 0 Foundation/Access 0% 0% 0% 0%
Diploma No. 0 67 0 67 Diploma 0% 100% 0% 1%
Certificate No. 4 340 3 347 Certificate 1% 98% 1% 5%
Higher Certificate No. 444 377 0 821 Higher Certificate 54% 46% 0% 11%
Ordinary Degree (L7) No. 1,487 191 0 1,678 Ordinary Degree (L7) 89% 11% 0% 23%
Honours Degree (L8) No. 4,261 76 0 4,337 Honours Degree (L8) 98% 2% 0% 59%
Occasional No. 2 45 0 47 Occasional 4% 96% 0% 1%
Postgraduate No. 436 483 68 987 Postgraduate 44% 49% 7% 12%
Postgrad Diploma No. 10 44 0 54 Postgrad Diploma 19% 81% 0% 5%
Postgrad Higher Diploma No. 35 66 68 169 Postgrad Higher Diploma 21% 39% 40% 17%
Postgrad Certificate No. 0 31 0 31 Postgrad Certificate 0% 100% 0% 3%
Masters Taught (L9) No. 269 256 0 525 Masters Taught (L9) 51% 49% 0% 53%
Masters Research (L9) No. 27 8 0 35 Masters Research (L9) 77% 23% 0% 4%
Doctorate (L10) No. 95 55 0 150 Doctorate (L10) 63% 37% 0% 15%
Occasional No. 0 23 0 23 Occasional 0% 100% 0% 2%
Total UG and PG Enrolments No. 6,634 1,579 71 8,284 Total UG and PG Enrolments 80% 19% 1% 100%
Research & Taught (L9/10) FTE 551 Research & Taught (L9/10) 11.0%
Research (L9/10) FTE 154 Research (L9/10) 3.1%
Research (L10) FTE 123 Research (L10) 2.4%
No. % No. %
Generic programmes and qualifications 0 0% Generic programmes and qualifications 0 0%
Education 0 0% Education 3 2%
Arts and humanities 141 7% Arts and humanities 11 7%
Social sciences, journalism and information 49 3% Social sciences, journalism and information 0 0%
Business, administration and law 513 26% Business, administration and law 55 37%
Natural sciences, mathematics and statistics 104 5% Natural sciences, mathematics and statistics 49 33%
Information and Communication Technologies (ICTs) 143 7% Information and Communication Technologies (ICTs) 0 0%
Engineering, Manufacturing & Construction 217 11% Engineering, Manufacturing & Construction 14 9%
Agriculture, forestry, fisheries and veterinary 116 6% Agriculture, forestry, fisheries and veterinary 0 0%
Health and welfare 387 20% Health and welfare 5 3%
Services 266 14% Services 13 9%
Total 1,936 100% Total 150 100%
No. %Mature Entrants Year 1 (Full-time Undergraduate) 249 13%Mature Entrants Year 2+ (Full-time Undergraduate) 13
No. %
Flexible Learners (PT, Distance, E-Learning, In-Service) 1,650 20%
248 3%
6%37% Regional Intake (% of Full-time Enrolments) No. %
41% from the institution's county 30%
17% from the institution's county and bordering counties 77%
No. %567 9% Erasmus Students Incoming (excl. work placements) 177
EU 183 3%Non-EU 384 6% Total no. of International (FT, PT & Erasmus Incoming) Students 794
No. % Erasmus Students Outgoing 4250 3% Other Exchange Outgoing 9
EU 24 2%Non-EU 26 2%
Waterford Institute of Technology - Profile 2018/19
STUDENT NUMBERSEntrants Graduates
Enrolments
% FTE Honours Bach Degree L8 and all PG
% FTE Honours Bach Degree L8 and all PG
% FTE Honours Bach Degree L8 and all PG
DISCIPLINARY MIXFirst Year Full-time Undergraduate New Entrants Doctorate (All modes)
PARTICIPATION(% of New Entrants)
Students in receipt of the Fund for Students with Disabilities (% of Full-
time UG & PG Enrolments)444 7%
(% of Total Enrolments incl. Flexible Learning)
Deprivation Index Scores (% of Full-time and Part-time, Undergraduate
and Postgraduate Enrolments) Springboard+ enrolments (% of National Participation) Affluent Marginally above average
Marginally Below average
Disadvantaged
INTERNATIONALISATIONInternational Students (Full-time)
(% of Full-time Enrolments)
International Students (Part-time)
(% of Part-time Enrolments)

75
Level 6 Level 7 Level 8
% % %
Generic programmes and qualifications - - - Indicator Indicator Score (out of 60)
Education - - - Higher Order Learning 34.9
Arts and humanities - - 31% Reflective and Integrative Learning 30.1
Social sciences, journalism and information - - 12% Quantitative Reasoning 19.0
Business, administration and law 11% 20% 17% Learning Strategies 29.3
Natural sciences, mathematics and statistics - 24% 14% Collaborative Learning 31.2
Information and Communication Technologies (ICTs) - 26% 30% Student-Faculty Interaction 15.3
Engineering, Manufacturing & Construction 37% 43% 22% Effective Teaching Practices 35.7
Agriculture, forestry, fisheries and veterinary - 15% 7% Quality of Interactions 40.4
Health and welfare - 19% 8% Supportive Environment 28.5
Services 20% 54% 22%
Total 18% 26% 17%
No. of Doctorate Graduates per 10 Academic Staff 0.4
No. Contract Research Income (€000) 21,002
Priority Patent Applications 5 State and Semi-State 6,056
Total Patents Granted 1 EU 12,966Invention Disclosures 8 Industry 980
Licence agreements (institution - private industry) 10 Other 1,000
Spin-out companies created 2 Contribution in respect of overheads 0
%
Level 8 Graduates in Permanent/Temporary Employment 81% Total Contract Research Income per Academic Staff €40,562
Level 8 Graduates in Further Study 12% EU Contract Research Income per Academic Staff €25,042
Level 9/10 Graduates in Permament/Temporary Employment 88%
Level 9/10 Graduates in Further Study 4%
Core Staff 750 100% Total Income (€000) 97,695 100%
Academic Staff 486 65% State Grants 34,673 35%
Support staff 265 35% Fees 30,347 31%
Contract Research & Specialist Staff 142 100% HEA Fees 5,251 5%
Academic Staff 101 72% Other Fees 25,096 26%
Support staff 40 28% Research Grants & Contracts 21,002 21%
Total Staff 892 100% Other Income 11,673 12%
Total Academic 587 66% Total Expenditure (€000) 96,924 100%
Total Support 305 34% Core - Pay 62,811 65%
Core - Non-Pay 12,830 13%
Non-Academic/Academic All Staff Ratio 0.5 Research Grants & Contracts - Pay 7,990 8%
Student FTE/Academic Staff Ratio 15 Research Grants & Contracts - Non-Pay 13,293 14%
Staff Age Profile (Proportion of Staff aged…) %20-39 18% Total Expenditure per Student (SRS)
19,907
40-54 57% Exchequer/Non-Exchequer Fees Ratio 0.2
55 and above 25%
Proportion of Academic Staff who are female 49% Pay/Non-Pay Expenditure Ratio (incl. Research) 2.7
Proportion of Staff at Most Senior Academic Grade who are Female 29% Pay/Non-Pay Expenditure Ratio (excl. Research) 4.9
Staff Qualifications (Proportion of…) %
Full-time Permanent Academic Staff with Masters or higher qual. 90%Full-time Permanent Academic Staff with Doctorate qualification 40%
All Permanent Academic Staff with Masters or higher qualification 90%All Permanent Academic Staff with Doctorate qualification 41%
Waterford Institute of Technology - Profile 2018/19 - continued
TEACHING AND LEARNING
Non-Progression Rate from 1st to 2nd Year Engagement Indicators (Irish Survey of Student Engagement 2019)
RESEARCH, KNOWLEDGE TRANSFER AND GRADUATE OUTCOMES
2019
Graduate Outomes (2019 Graduates)
STAFF FINANCIAL DATA
1 Total expenditure per FTE student excluding research and depreciation with pension adjustments, based on
unadjusted SRS numbers.
0
50
100
150
200
250
300
350
400
Flexible Learners(as % of all Enrolment)
Participants in Labour Market Activation(Springboard)
Level 6/7 Enrolment(as % of all Enrolment)
FT Mature Entrants(as % of all FT New Entrants)
FT New Entrants from DisadvantagedBackgrounds
FTE Research Enrolment (as % of FTELevel 8 and Postgraduate Enrolment)
Doctorate Graduates per 10 AcademicStaff
Total Contract Research Income perAcademic Staff
EU Contract Research Income perAcademic Staff
Graduates in Employment (Level 8)
Progression Rate Level 81st to 2nd Year
Non-Academic/Academic Staff ratio(Core staff)
Student FTE/Academic Staff ratio(FTE students/Core Academic staff)
Pay/Non-Pay ratio (excl. Research)
Exchequer/Non-Exchequer Fees ratio
Total Expenditure per FTE Student, SRS(excl. Depreciation & Research)
Maximum HEA WIT Average All HEA

76
APPENDIX 1: TECHNICAL DESCRIPTION OF FIGURES Student Numbers Based on March 2019 submission to the Student Records System (SRS) Please note that unless otherwise stated in this document, student numbers in the institutional profiles are aligned with published data. Student numbers will therefore exclude studying on overseas campuses and incoming exchange students:
• nsAttend: OS
• Exchng: EI; XI; E1; E2; E3; T1; T2; T3; X1; X2; X3
Entrants: New Entrants Year 1
• Source: SRS
• Enrolment Status: Enrolment
• Mode: Full-time
• Programme Type: Undergraduate certificate, undergraduate Higher Certificate, undergraduate diploma, undergraduate ordinary/general degree, undergraduate honours degree, undergraduate occasional, foundation (undergraduate), access (undergraduate), postgraduate qualifier (undergraduate), professional training qualification (undergraduate)
• Student Code: NE (new entrant)
• Course Year: 1 New Entrants Year 2+
• Source: SRS
• Enrolment Status: Enrolment
• Mode: Full-time
• Programme Type: Undergraduate certificate, undergraduate Higher Certificate, undergraduate diploma, undergraduate ordinary/general degree, undergraduate honours degree, undergraduate occasional, foundation (undergraduate), access (undergraduate), postgraduate qualifier (undergraduate), professional training qualification (undergraduate)
• Student Code: NE (new entrant)
• Course Year: 2, 3, 4, 5
Graduates: Undergraduate Graduates
• Source: SRS
• Enrolment Status: Graduate
• Mode: All modes
• Award Type: Undergraduate certificate, undergraduate Higher Certificate, undergraduate diploma, undergraduate ordinary/general degree, undergraduate honours degree

77
Postgraduate Graduates
• Source: SRS
• Enrolment Status: Graduate
• Award Type: Postgraduate certificate, postgraduate diploma, Higher Diploma, masters taught, masters research, Doctorate
Enrolments All enrolments
• Source: SRS
• Enrolment Status: Enrolment Full-time
• Source: SRS
• Mode: Full-time Part-time
• Source: SRS
• Mode: Part-time Remote
• Source: SRS
• Modes: Distance, e-Learning, in-service Other Enrolments (IoT only) QQI L5 Certificate
• Source: SRS
• Programme Type: QQI Certificate for Institutes of Technology only QQI L6 Advanced Certificate
• Source: SRS
• Programme Type: QQI Advanced Certificate for Institutes of Technology only Of which are apprenticeships
• Course name: Those courses which relate to apprenticeship trades Undergraduate Foundation and Access
• Source: SRS
• Programme Type: Foundation and Access Diploma/Cert/Higher Cert
• Source: SRS
• Programme Type: Undergraduate diploma, undergraduate certificate, Undergraduate Higher Certificate

78
Ordinary Degree (L7)
• Source: SRS
• Programme Type: Undergraduate ordinary/general degree Honours Degree (L8)
• Source: SRS
• Programme Type: Undergraduate honours degree Occasional
• Source: SRS
• Programme Type: Undergraduate occasional, Professional Training Qualification
• (Undergraduate), Postgraduate Qualifier (Undergraduate) Postgraduate Postgrad Diploma/Higher Diploma/Cert
• Source: SRS
• Programme Type: Postgraduate diploma, Higher Diploma, postgraduate certificate Masters Taught (L9)
• Source: SRS
• Programme Type: Masters Taught Masters Research (L9)
• Source: SRS
• Programme Type: Masters Research Doctorate (L10)
• Source: SRS
• Programme Type: Doctorate Occasional
• Source: SRS
• Programme Type: Postgraduate occasional, Professional Training Qualification Research & Taught (L9/10) FTE
• Masters Taught, Masters Research, Doctorate: Full-time + 0.5 * Part-time + 0.5 * Remote
Research (L9/10) FTE
• Masters Research, Doctorate: Full-time + 0.5 * Part-time + 0.5 * Remote Research (L10) FTE
• Doctorate: Full-time + 0.5 * Part-time + 0.5 * Remote

79
Disciplinary Mix Full-time Undergraduate New Entrants
• Source: SRS
• Enrolment Status: Enrolment
• Mode: Full-time
• Programme Type: Undergraduate certificate, undergraduate Higher Certificate, undergraduate diploma, undergraduate ordinary/general degree, undergraduate honours degree, undergraduate occasional, foundation (undergraduate), access (undergraduate), postgraduate qualifier (undergraduate), professional training qualification (undergraduate)
• Course Year: 1
• ISCED Code: ISCED1 Broad Fields are totalled in the table Doctorate (all modes)
• Source: SRS
• Enrolment Status: Enrolment
• Mode: All modes
• Programme Type: Doctorate
• ISCED Code: ISCED1 Broad Fields are totalled in the table
Participation Flexible Learners (PT, Distance, E-Learning, In-Service)
• Source: SRS
• Enrolment Status: Enrolment
• Mode: Part-time, Remote (distance education, e-learning, in-service)
• Programme Type: Programme Type: Undergraduate certificate, Undergraduate Higher Certificate, undergraduate diploma, undergraduate ordinary/general degree, undergraduate honours degree, undergraduate occasional, foundation (undergraduate), access (undergraduate), postgraduate qualifier (undergraduate), professional training qualification (undergraduate), postgraduate certificate, postgraduate diploma, Higher Diploma, masters taught, masters research, Doctorate, Professional training qualification (postgraduate), postgraduate occasional

80
% =Flexible Learners
𝐴𝑙𝑙 𝑒𝑛𝑟𝑜𝑙𝑚𝑒𝑛𝑡𝑠 (𝐹𝑇, 𝑃𝑇, 𝑅𝑒𝑚𝑜𝑡𝑒)
Participants in Labour Market Activation (Springboard+)
Source: Numbers of persons enrolled on courses funded under the 2018 Springboard call (including L8 ICT Skills Conversion courses) as per the springboard+ applications management system (AMS) Mode: All modes of delivery (FT, PT, Remote)
% =𝑆𝑝𝑟𝑖𝑛𝑔𝑏𝑜𝑎𝑟𝑑 + 𝑝𝑎𝑟𝑡𝑖𝑐𝑖𝑝𝑎𝑛𝑛𝑡𝑠
𝐴𝑙𝑙 𝑆𝑝𝑟𝑖𝑛𝑔𝑏𝑜𝑎𝑟𝑑 + 𝑃𝑎𝑟𝑡𝑖𝑐𝑖𝑝𝑎𝑡𝑖𝑜𝑛 𝑁𝑎𝑡𝑖𝑜𝑛𝑎𝑙𝑙𝑦
Regional Intake (% of Full-time Enrolments)
• Source: SRS
• Enrolment Status: Enrolment
• Mode: Full-time
• Domiciliary: Ireland
• Programme Type: Undergraduate certificate, Undergraduate
• Higher Certificate, undergraduate diploma, undergraduate ordinary/general degree,
• undergraduate honours degree, undergraduate occasional, foundation (undergraduate), access (undergraduate), postgraduate qualifier (undergraduate), professional training qualification (undergraduate), postgraduate certificate, Higher Diploma, postgraduate diploma, masters taught, masters research, Doctorate, Professional training qualification (postgraduate), postgraduate occasional
From the institution's county:
• County of Origin of such above students where county is that of the institution From the institution's county and bordering counties:
• Counties of Origin of such above students where counties are that of the institution or border that of the institution
Mature Entrants Year 1 (Full-time Undergraduate)
• Source: SRS
• Enrolment Status: Enrolment
• Mode: Full-time
• Programme Type: Undergraduate certificate, Undergraduate Higher Certificate, undergraduate diploma, undergraduate ordinary/general degree, undergraduate honours degree, undergraduate occasional, foundation (undergraduate), access (undergraduate), postgraduate qualifier (undergraduate), professional training qualification (undergraduate)
• Student Code: NE (new entrant)

81
• Course Year: 1
• Age: 23 years of age on year of entry to programme Mature Entrants Year 2+ (Full-time Undergraduate)
• Source: SRS
• Enrolment Status: Enrolment
• Mode: Full-time
• Programme Type: Undergraduate certificate, Undergraduate Higher Certificate, undergraduate diploma, undergraduate ordinary/general degree, undergraduate honours degree, undergraduate occasional, foundation (undergraduate), access (undergraduate), postgraduate qualifier (undergraduate), professional training qualification (undergraduate)
• Student Code: NE (new entrant)
• Course Year: 2, 3, 4, 5
• Age: 23 years of age on year of entry to programme Students in receipt of the Fund for Students with a Disability (FSD)
• Source: Applications for funding (based on list of eligible students) submitted to HEA
• Enrolment status: Enrolment
• NFQ Level: Levels 6, 7, 8, 9, 10 This estimates the % of enrolments in receipt of the FSD and is calculated as follows:
No. of UG & PG in receipt of the FSD
𝑇𝑜𝑡𝑎𝑙 𝑛𝑜. 𝐹𝑇 𝑒𝑛𝑟𝑜𝑙𝑚𝑒𝑛𝑡𝑠 (𝑈𝑛𝑑𝑒𝑟𝑔𝑟𝑎𝑑𝑢𝑎𝑡𝑒𝑠 + 𝑃𝑜𝑠𝑡𝑔𝑟𝑎𝑑𝑢𝑎𝑡𝑒𝑠)
Deprivation Index Scores:
Percentage of Irish domiciled students from areas categorised as affluent, marginally above average, marginally Below average or disadvantaged, as per the Census Small Area Deprivation Index Scores. Source: Student Home Address Data (Irish Domiciled students only), Academic Year 2018/19 Note: Equal Access Data not available for 2018/19
Internationalisation International Students (Full-time)
• Source: SRS
• Enrolment Status: Enrolment
• Mode: Full-time
• This figure includes Exchange codes EI; XI; X1; X2; X3.
• Programme Type: Programme Type: Undergraduate certificate, undergraduate Higher Certificate, undergraduate diploma, undergraduate ordinary/general degree, undergraduate honours degree, undergraduate occasional, foundation (undergraduate), access (undergraduate), postgraduate qualifier (undergraduate), professional training qualification (undergraduate), postgraduate certificate, Higher Diploma, postgraduate diploma, masters taught, masters research, Doctorate, Professional training qualification (postgraduate), postgraduate occasional
• Domiciliary of Origin: EU countries (excluding Ireland) and non-EU countries

82
% =𝐼𝑛𝑡𝑒𝑟𝑛𝑎𝑡𝑖𝑜𝑛𝑎𝑙 𝑆𝑡𝑢𝑑𝑒𝑛𝑡𝑠 (𝐹𝑢𝑙𝑙 − 𝑡𝑖𝑚𝑒)
𝐹𝑢𝑙𝑙 − 𝑡𝑖𝑚𝑒 𝑆𝑡𝑢𝑑𝑒𝑛𝑡𝑠 (𝑈𝑛𝑑𝑒𝑟𝑔𝑟𝑎𝑑𝑢𝑎𝑡𝑒 + 𝑃𝑜𝑠𝑡𝑔𝑟𝑎𝑑𝑢𝑎𝑡𝑒)
International Students (Part-time)
• Source: SRS
• Enrolment Status: Enrolment
• Mode: Part-time
• This figure includes Other Exchange Incoming EI; XI; X1; X2; X3 .
• Programme Type: Programme Type: Undergraduate certificate, undergraduate Higher Certificate, undergraduate diploma, undergraduate ordinary/general degree, undergraduate honours degree, undergraduate occasional, foundation (undergraduate), access (undergraduate), postgraduate qualifier (undergraduate), professional training qualification (undergraduate), postgraduate certificate, Higher Diploma, postgraduate diploma, masters taught, masters research, Doctorate, Professional training qualification (postgraduate), postgraduate occasional
• Domiciliary of Origin: EU countries (excluding Ireland) and non-EU countries
% =𝐼𝑛𝑡𝑒𝑟𝑛𝑎𝑡𝑖𝑜𝑛𝑎𝑙 𝑆𝑡𝑢𝑑𝑒𝑛𝑡𝑠 (𝑃𝑎𝑟𝑡 − 𝑡𝑖𝑚𝑒)
𝑃𝑎𝑟𝑡 − 𝑡𝑖𝑚𝑒 𝑆𝑡𝑢𝑑𝑒𝑛𝑡𝑠 (𝑈𝑛𝑑𝑒𝑟𝑔𝑟𝑎𝑑𝑢𝑎𝑡𝑒 + 𝑃𝑜𝑠𝑡𝑔𝑟𝑎𝑑𝑢𝑎𝑡𝑒)
Erasmus Students
• Source: SRS
• Enrolment Status: Enrolment
• Programme Type: Undergraduate certificate, undergraduate Higher Certificate, undergraduate diploma, undergraduate ordinary/general degree, undergraduate honours degree, undergraduate occasional, foundation (undergraduate), access (undergraduate), postgraduate qualifier (undergraduate), professional training qualification (undergraduate), postgraduate certificate, postgraduate diploma, masters taught, masters research, Doctorate, Professional training qualification (postgraduate), postgraduate occasional, Higher Diploma
• Erasmus Outgoing = E4, E5, E6
• Erasmus Incoming = EI, E1, E2, E3,
• Other Exchange Outgoing = XO.
• Total International figure = FT + PT + Erasmus Incoming.
• Mode: Full-time and part-time
Teaching and Learning Non-Progression Rate from 1st to 2nd year
• Source: SRS
• Mode of Study: Full-time
• NFQ Level: Levels 6, 7, 8 (IOTs), Level 8 (Universities and Colleges)
• Student Code: NE (2017/18) and all student codes except TE (2018/19)
• Course Year: Year 1 (2017/18) and all course years, all modes of study, all NFQ
• levels (2018/19)
• Note: This process involves the matching of student IDs at March 2018 and March 2019. Students who repeated or changed course within their institution are

83
identifiable, however students transferring to another institution are coded as ‘non-progressed’.
Engagement Indicators (Irish Survey of Student Engagement 2019)
• Scores (out of 60) taken from results of Student Survey (formerly Irish Survey of Student Engagement)
• 2018-19 scores are taken from the from the results of the 2019 survey: https://studentsurvey.ie/results
Research and Knowledge Transfer No. of Doctorate Graduates per 10 Academic Staff
• Source: SRS (Doctorate Graduates full-time and part-time) and quarterly staffing statistics as of December 2018 (academic staff)
𝑁𝑜. 𝑜𝑓 𝐷𝑜𝑐𝑡𝑜𝑟𝑎𝑡𝑒 𝐺𝑟𝑎𝑑𝑢𝑎𝑡𝑒𝑠 𝑝𝑒𝑟 10 𝐴𝑐𝑎𝑑𝑒𝑚𝑖𝑐 𝑆𝑡𝑎𝑓𝑓 =𝐷𝑜𝑐𝑡𝑜𝑟𝑎𝑡𝑒 𝐺𝑟𝑎𝑑𝑢𝑎𝑡𝑒𝑠
(𝐴𝑐𝑎𝑑𝑒𝑚𝑖𝑐 𝐿𝑒𝑐𝑡𝑢𝑟𝑖𝑛𝑔 𝑆𝑡𝑎𝑓𝑓)/10
Note: Total academic staff engaged in lecturing includes all Academic Core Staff (Paragraph 1.1 of ECF), Permanent Academic Exchequer Funded Research Staff (Paragraph 1.2 of ECF), Permanent Academic - Specialist project based Staff (Paragraph 1.3 of ECF), Temporary Academic - Specialist project based Staff (Paragraph 1.3 of ECF), Permanent Academic - EU Funded Research Staff (Paragraph 1.3 of ECF), Permanent Academic - Non- EU Funded Research Staff (Paragraph 1.3 of ECF). Total non-academic staff (support) includes all Non-Academic Core Staff (Paragraph 1.1 of ECF), Permanent Non-Academic Exchequer Funded Research Staff (Paragraph 1.2 of ECF), Permanent Non-Academic - Specialist project based Staff (Paragraph 1.3 of ECF), Temporary Non-Academic - Specialist project based Staff (Paragraph 1.3 of ECF), Permanent Non-Academic - EU Funded Research Staff (Paragraph 1.3 of ECF), Permanent Non-Academic - Non- EU Funded Research Staff (Paragraph 1.3 of ECF). Contract Research Income 2018/19
• Source: Consolidated Financial Statements and quarterly staffing statistics at December 2018 (academic lecturing staff as defined under “No. of Doctorate Graduates per 10 Academic Staff”)
• Institutions: all HEIs where applicable Invention Disclosures, Licenses, Options and Assignments, Spin-outs, Priority Patent Applications, Total Patents Granted created
• Source: Knowledge Transfer Ireland (KTI) obtained from the KTI Review an Annual Knowledge Transfer Survey 2019
• Definitions: Invention Disclosures - Contains basic information which helps to evaluate, subsequently protect and potentially commercialise the intellectual property associated with an invention. Number of Licenses - Options and Assignments - An agreement between a public research organisation and one or more commercial undertakings, whereby IP rights are transferred to that undertaking for the purpose of commercialisation.

84
Number of Spin-Outs - Spin out is an incorporated entity, with a business plan consistent with Enterprise Ireland High Potential Start-Up guidelines, set up for the purpose of exploiting technology from a university. Priority Patent Applications - The first filing under the form of a provisional, national patent application, regional or international (Patent Cooperation Treaty) patent application from which priority date all national patents will derive. Total Patents Granted - Differently from the new patent grants (technically unique patent grants), this number includes all the grants obtained in the reference year, even if they are related to the same invention and also even if the corresponding technically unique patent grant has been counted in a previous year.
Graduates in Employment Source: Graduate Outcomes Survey File, 2018 Graduates (survey conducted 9 months after graduation in 2019) Institutions: Universities, Institutes of Technology, Mary Immaculate College and National College of Art & Design Level 8 graduates in employment:
• Respondents: Yes
• Award Code: 11
• Principal economic status: Working full-time, working part-time, due to start a job in the next 3 months
Level 8 graduates in further studies/training:
• Respondents: Yes
• Award Code: 11
• Principal economic status: Engaged in full-time further study or training/Engaged in part-time further study or training
Level 9/10 graduates in employment (including those due to commence employment)
• Respondents: Yes
• Award Code: 25, 26, 27
• Principal economic status: Working full-time, working part-time, due to start a job in the next 3 months
Level 9/10 graduates in further studies/training:
• Respondents: Yes
• Award Code: 25, 26, 27
• Principal economic status: Engaged in full-time further study or training/Engaged in part-time further study or training.
Staff Core Staff, Contract Research & Specialist Staff
• Source: Quarterly staff returns at December 2018 as submitted to HEA (WTEs) Staff numbers are at December 2018. Staff numbers are categorised according to the Employment Control Framework (ECF). The ECF encompasses three broad categories of post, defined according to their nature and their source of funding.

85
Paragraph 1.1 of the ECF includes core staff, i.e. mainstream posts funded from the core grant, undergraduate tuition fees (including grant in lieu of fees), student services charge and the student contribution. Paragraph 1.2 of the ECF 2 includes non-core-funded research and related project posts, including commercialisation posts, funded from exchequer resources external to the institution. Paragraph 1.3 of the ECF includes other research and/or specialist project-based posts funded from non-exchequer sources: EU research and other grants, private sector income, international student income, postgraduate and part-time fees - but not including fulltime EU undergraduate tuition fees/student contributions as non-exchequer, non-core income.
Staff Classification: Academic Lecturing Staff:
• All Academic Core Staff (Paragraph 1.1 of ECF)
• Permanent Academic Exchequer Funded Research Staff (Paragraph 1.2 of ECF)
• Permanent Academic - Specialist project based Staff (Paragraph 1.3 of ECF)
• Temporary Academic - Specialist project based Staff (Paragraph 1.3 of ECF)
• Permanent Academic - EU Funded Research Staff (Paragraph 1.3 of ECF)
• Permanent Academic - Non- EU Funded Research Staff (Paragraph 1.3 of ECF) Non-Academic Staff (support):
• All Non-Academic Core Staff (Paragraph 1.1 of ECF)
• Permanent Non-Academic Exchequer Funded Research Staff (Paragraph 1.2 of
• ECF)
• Permanent Non-Academic - Specialist project based Staff (Paragraph 1.3 of ECF)
• Temporary Non-Academic - Specialist project based Staff (Paragraph 1.3 of ECF)
• Permanent Non-Academic - EU Funded Research Staff (Paragraph 1.3 of ECF)
• Permanent Non-Academic - Non- EU Funded Research Staff (Paragraph 1.3 of ECF) Staff Age Profile
• Submission to HEA in following request for staff qualification figures.
• Age profile data (WTEs). This includes all core and exchequer funded academic and non-academic staff.
Staff Qualifications
• Source: Submission to HEA in following request for staff qualification figures.
• Permanent academic staff is core and exchequer funded staff

86
Proportion of Academic Staff who are female
• The 2018/19 figures are taken from the publication Higher Education Institutional Staff Profiles by Gender 2019 [accessed 14/02/2019). This data in this publication is taken from Quarterly staff returns at December 2018 as submitted to HEA containing gender breakdown of staffing (WTEs).
Proportion of Staff at Most Senior Academic Grade who are Female
Universities/RCSI: Proportion of staff at Professor grade who are female Colleges: Proportion Senior Lecturer grade who are female Institutes of Technology/TU Dublin: Proportion of staff at Senior Lecturer grades 3 who are female
Non-Academic/Academic All Staff Ratio Non-Academic/Academic All Staff Ratio = All Non − Academic Staff All Academic Staff
Non − academic/academic All Staff Ratio =𝐴𝑙𝑙 𝑁𝑜𝑛 − 𝐴𝑐𝑎𝑑𝑒𝑚𝑖𝑐 𝑆𝑡𝑎𝑓𝑓
𝐴𝑙𝑙 𝐴𝑐𝑎𝑑𝑒𝑚𝑖𝑐 𝑆𝑡𝑎𝑓𝑓
Student/Academic Staff Ratio Calculated as follows:
Student/Academic Staff Ratio = 𝑁𝑢𝑚𝑏𝑒𝑟 𝑜𝑓 𝐹𝑇𝐸 𝑆𝑡𝑢𝑑𝑒𝑛𝑡𝑠
𝐴𝑐𝑎𝑑𝑒𝑚𝑖𝑐 𝐿𝑒𝑐𝑡𝑢𝑟𝑖𝑛𝑔 𝑆𝑡𝑎𝑓𝑓
(Please see above for methodology for calculating FTE)
Financial Data Total Income
• Source: Institutional Funding Statements 2018/19 and Fee claims to HEA 2018/19:
• State Grants: Income and Expenditure Account (State Grants)
• Fees: Income and Expenditure Account (Fees)
• HEA: Fee claims as submitted to HEA (general Free Fees claim and nursing claim)
• Other: Total Fees minus HEA Fees
• Other Income: Income and Expenditure Account (Other Income) Note: Institute of Technology figures exclude Release from Capital Account. Total Expenditure
• Source: Institutional Funding Statements
• Core – Pay: Notes to Accounts
• Core - Non-Pay: Notes to Accounts
• Research Grants & Contracts – Pay: Notes to Accounts
• Research Grants & Contracts - Non-Pay: Notes to Accounts Note: Institute of Technology figures exclude Depreciation.
87
Total Expenditure Per Student (SRS)
• Adjusted Total Expenditure (adjusted for pensions funding – universities and
• colleges, adjusted for depreciation – institutes of technology) per FTE student numbers.
Calculation of Full-time Equivalent (FTE) student numbers FTE is calculated as follows:
All Full Time Enrolments
+ Part-time Enrolments/2
+ Remote Enrolments/2
+ Full Time QQI Cert enrolments
+ Full Time QQI advanced certificate enrolments (non-apprenticeship)
+ Full Time Apprenticeships/3
+ Part-time QQI Cert/2
+ Part-time QQI Advanced Cert/2 (Including apprenticeships)
+ Remote QQI Cert/2
+ Remote QQI Advanced Cert/2 (Including apprenticeships)