highlights managerial analysis - s3.amazonaws.com · 2 earnings release 2q18 with regard to the...
TRANSCRIPT

1
EARNINGS RELEASE 2Q18
¹ Excludes investments in M&A and Special Projects.
Special note: 2Q17 and 1H17 figures include the results from FAIR, FAC/FAMAT and NOVATEC operations.
¹ Excludes figures form FAIR, FAC/FAMAT and NOVATEC for 2017, as well as the results of new units (Greenfields).
On July 16, Kroton was rated triple A (brAAA) by Standard & Poor’s, which noted that the Company should continue
to capture economies of scale and efficiency gains and that, after the acquisition of Somos, be able to capture
synergies and to deleverage by growing its cash generation. Previously, Fitch Ratings already had attributed a
Long-Term National Rating of AA+(bra), having a positive view on the acquisition of Somos, since it will enable
greater complementarity and diversification of the services portfolio, with sufficient potential operational and
financial synergies to offset the higher financial leverage. These ratings are the highest in the industry and attest
to the Company’s strong balance sheet and solid future prospects.
Saber, Kroton’s subsidiary in the primary and secondary education segment, concluded its registration as a
category B issuer of securities and the Board of Directors has already approved its funding instrument, whose
conditions are disclosed on the CVM website. This represents yet another important step in the acquisition of
Somos, whose conclusion is still pending approval by CADE.
The pace of new unit openings remains vigorous and, for the second semester of the year, a total of 13 new on-
campus units and 100 new DL centers will participate in the student admissions process for 2018/2. Kroton also
acquired a small institution in Bacabal and another in João Pessoa, which is still pending approval by CADE.
Values in R$ ('000) 2Q18 2Q17 Chg.% 1Q18 Chg.% 1H18 1H17 Chg.%
Gross Revenue 2,036,156 1,938,603 5.0% 1,757,827 15.8% 3,793,983 3,679,384 3.1%
Net Revenue 1,526,273 1,519,391 0.5% 1,363,325 12.0% 2,889,598 2,884,513 0.2%
Gross Income 1,130,807 1,131,921 -0.1% 1,050,550 7.6% 2,181,357 2,193,072 -0.5%
Gross Margin 74.1% 74.5% -0.4 p.p. 77.1% -3.0 p.p. 75.5% 76.0% -0.5 p.p.
Operating Result 816,606 850,475 -4.0% 785,792 3.9% 1,602,397 1,664,477 -3.7%
Operat ing Margin 53.5% 56.0% -2.5 p.p. 57.6% -4.1 p.p. 55.5% 57.7% -2.2 p.p.
Adjusted EBITDA 641,549 700,230 -8.4% 614,713 4.4% 1,256,262 1,339,759 -6.2%
Adjust ed EBITDA Margin 42.0% 46.1% -4.1 p.p. 45.1% -3.1 p.p. 43.5% 46.4% -3.0 p.p.
Adjusted Net Income 562,075 644,885 -12.8% 538,991 4.3% 1,101,067 1,221,947 -9.9%
Adjust ed Net Margin 36.8% 42.4% -5.6 p.p. 39.5% -2.7 p.p. 38.1% 42.4% -4.3 p.p.
Adjusted Net Income /share 0.34 0.39 -12.8% 0.33 4.3% 0.67 0.74 -9.9%
Operating Cash Generation (OCG) after Capex ¹ 318,066 460,908 -31.0% (125,271) n.a. 192,795 512,063 -62.3%
OCG aft er Capex1
/ EBITDA (unadjust ed) 56.3% 71.9% -15.6 p.p. - n.a. 17.0% 41.4% -24.4 p.p.
Consolidated - Values in R$ ('000) 2Q18 2Q17 Chg.% 1H18 1H17 Chg.%
Net Revenue 1,516,278 1,510,670 0.4% 2,874,230 2,867,926 0.2%
Adjusted EBITDA 652,103 694,331 -6.1% 1,281,852 1,328,782 -3.5%
Adjust ed EBITDA Margin 43.0% 46.0% -3.0 p.p. 44.6% 46.3% -1.7 p.p.
Adjusted Net Income 573,899 638,979 -10.2% 1,128,632 1,210,957 -6.8%
Adjust ed Net Margin 37.8% 42.3% -4.4 p.p. 39.3% 42.2% -3.0 p.p.
HIGHLIGHTS – MANAGERIAL ANALYSIS
HIGHLIGHTS – MANAGERIAL ANALYSIS (Ex-asset divestment and greenfields1)
Belo Horizonte, August 14, 2018 – Kroton Educacional S.A. (B3: KROT3; OTCQX: KROTY),
“Kroton” or the “Company,” announces today its results for the second quarter of 2018 (2Q18). The Company’s
financial information is presented on a consolidated basis and in Brazilian real, in accordance with Brazilian Corporate
Law and Generally Accepted Accounting Principles in Brazil (BRGAAP), and already conforms to International Financial
Reporting Standards (IFRS), except where stated otherwise.
HIGHLIGHTS
INVESTOR RELATIONS
Carlos Lazar – IRO
Pedro Gomes – IR Manager
Ana Troster – IR Coordinator
+55 11 3133-7309 / 7311 / 7314
www.kroton.com.br/ri

2
EARNINGS RELEASE 2Q18
With regard to the quarter’s financial performance, net revenue grew 0.5% from the same period of 2017, reflecting
the solid performance of the latest student recruiting processes, in addition to the improvement in the mix of
academic programs and the higher average ticket, with these factors neutralizing the asset divestments carried
out late last year and the higher number of graduates and dropouts, which adversely affected the student base.
In the six-month period, net revenue was R$2,889.6 million, up 0.2% from the same period of 2017, corroborating
the assertive sales strategy adopted in the period, which was able to mitigate the challenges posed by the
challenging economic scenario.
Adjusted EBITDA (managerial analysis) amounted to R$641.5 million in the quarter, down 8.4% from 2Q17,
accompanied by EBITDA margin contraction of 4.1 p.p. In the six-month period, adjusted EBITDA decreased 6.2%,
with EBITDA margin contracting 3.0 p.p. from 1H17. The lower profitability reflects the pressures from the shift in
the profile of the student base, with higher provisioning to support the installment plans, and the higher level of
costs and expenses related to the new units. This latter factor, however, is only temporary and should become
increasingly less relevant as the greenfield projects naturally mature. The results reinforce the expectation of
delivering the Guidance announced for the end of the year.
Adjusted net income was R$562.1 million in 2Q18, down 12.8% from R$644.9 million in the same quarter of 2017,
with adjusted net margin contracting 560 bps. In the first six months of the year, adjusted net income fell 9.9% to
R$1.1 billion, with adjusted net margin contracting 4.3 p.p. Excluding the figures from FAIR, FAC/FAMAT and
Novatec for 1H17, the decrease in the period would be slightly lower, of 6.8%, and reflects, additionally, the higher
depreciation rate and lower financial result in the period.
Operating cash generation after capex (before special projects) came to R$318.1 million in 2Q18, with an EBITDA-
to-cash conversion ratio of 56.3%, which represents a recovery from the negative conversion ratios of the previous
quarter due to FIES-related issues. Performance this quarter attests to the Company’s resilience and to the strength
of its operations, despite all the challenges posed by the country’s economic crisis. It also confirms the positive
outlook for cash generation in the second half of the year, which also includes receipt of the last installment under
PN23, credited in early August.
In 2Q18, the Company intensified share buybacks by spending over R$200 million to optimize returns for
shareholders. Since the program’s start, a total of 17,412,500 ordinary shares have been repurchased at an average
price of R$12.61 per share, which represents 35.7% of the limit established by the program.
On September 3, 2018, Kroton will hold an Extraordinary Shareholders Meeting (ESM) to approve the Company’s
New Restricted Share Plan. The maximum number of shares under the plan is 19.4 million, which corresponds to
1.18% of the total capital of the Company. The plan aims to align the long-term interests of its participants and to
strengthen retention incentives.
3
EARNINGS RELEASE 2Q18
MESSAGE FROM MANAGEMENT
At the start of 2018, we clearly defined our organization’s strategies, which are based on four key pillars: i) Student Success;
ii) Organic & Inorganic Growth; iii) Operating & Financial Efficiency; all supported by a far-reaching Digital Transformation
iv) in the services offered to our students (GO DIGITAL) and in the construction of a company with a truly digital mindset
(BE DIGITAL). The actions and projects developed in this second quarter reaffirm that we are on the right path for delivering
these strategies.
As you will see, we have evolved on each of these strategic fronts. In Organic & Inorganic Growth, we have very good news.
In terms of organic growth, between 2017 and the first semester of 2019, we will implement 61 new units, expanding the
number of our on-campus units from 112 to 173, which represents expansion of 55%. The project to implement new units
has been a success, with the results far exceeding the figures projected in the business plan. On a consolidated basis, the
units in 2018/1 delivered net revenue growth of 38%, new enrollment growth of 24% and a reduction in costs and expenses
of 5%. Considering the IRR of the original business plan of 42.4% in perpetuity and 26.2% in 10 years, the project is expected
to create significant value for shareholders. In addition to own units, we have implemented, since 2017, 400 new centers,
with another 200 planned for 2019, all of which duly installed with high-quality, well-selected and prepared partners. As we
always say, it is one thing to have a center accredited to offer DL education and another to have a structured network of
partners and products to offer quality DL services efficiently and profitably in order to remain sustainable over time.
Still on the growth front, in addition to our movements in postsecondary education (on-campus and DL), we took a
transformational step with the acquisition of Somos, which was announced in April and currently is awaiting analysis by the
antitrust agency CADE. On this front, we are working to plan the integration with a “clean team” to execute all phases of the
integration after receiving approval from CADE to create an even more solid and efficient company. This is an important
strategic step that was structured over one year ago and will enable the Company to operate in a market twice the size of
the private Postsecondary Education market. As widely announced, our strategy in this segment is to offer high quality
education, while maintaining the characteristics of the educational projects of the high schools that have come to integrate
the group and increasing the operation’s efficiency.
On the strategy for our Digital Transformation, we have completed important steps in recent months. One of the most
important of these was completely changing the methods for developing systems or the organization’s way of working. In
six months, we migrated 100% of Kroton’s development teams to the agile methodology. It was an aggressive process, since
many large companies in the market have spent years pursuing this change. We were able to engage the entire team in a
complete migration in a short period of time, which increases productivity and avoids any risks of teams working with a
combination of old and new methodologies. The migration demanded the total commitment of everyone at the
organization (both inside and outside of the technology area), but was a complete success. Today, we have over 500
professionals (IT and business) working on 55 agile teams, distributed among seven agile delivery “trains,” supported by the
methodology Scaled Agile Framework (SAFe), ensuring complete alignment between the business and technology areas, in
order to deliver a faster, more flexible and more productive way of working.
However, we understand that the success of any digital transformation requires more than just an internal process. There
are changes that come from within, such as transforming the way we develop systems described above and promoting a
cultural change at the organization. But we also must stay open to everything that is happening outside of our company.
And one of the ways we chose to stay open to what’s new is to associate with Cubo Itaú, as the partner responsible for the
verticalization of Education, giving rise to Cubo Education, which is born already Latin America’s largest innovation and
entrepreneurship hub in applied educational technology. Cubo Education, a center dedicated to fostering “edtech”
4
EARNINGS RELEASE 2Q18
companies, will focus on adding technological value and knowledge to the development of education in Brazil. By
establishing close contact with startup companies, Kroton not only fosters the educational technology market, but also
supports the discovery of new ways to transform the future of its students. The partnership also will give students an
opportunity to experience the innovation and entrepreneurship environment that exists in this market. More recently, Kroton
announced another partnership, this time with Udacity (a platform of online programs positioned as the University of Silicon
Valley), along with the launch of an Executive MBA in Digital Marketing. The program, which will be offered by Kroton’s
Distance Learning institutions with a mixture of content from Kroton and Udacity, seeks to meet the needs of the job market.
But, despite the relevance of the other strategic pillars, the largest number of projects and initiatives by the company is
related to the strategic pillar Student Success. We base student success on a set of three attributes: quality, student
experience at all touchpoints (on-campus and digital; academic and non-academic) and employability. Of the 126 projects
ongoing at the organization, 37 are related to Student Success. The bulk of the company’s energy, efforts and resources is
being allocated to ensure Student Success, given our belief that this is the only way to ensure the sustainability of our
business in the long run.
However, when we designed our strategic map, we imposed on ourselves the challenge of delivering all the other strategic
pillars without losing sight of the Operating & Financial Efficiency we have achieved over the years, with this delivery
becoming even more challenging in light of the scenario and context we are facing this year. In 2018, we have the impacts
from the graduation, in late 2017, of large classes of FIES students who enrolled in the admissions processes of 2013 and
2014, coupled with the macroeconomic effects, especially high unemployment and a scenario of more intense competition
in distance learning. Despite this combination of pressures, we have been able to capture efficiency gains in virtually all cost
and expense lines and to sustain a unique level of financial and operating performance with much resilience. In this respect,
we reaffirm our expectation of delivering the guidance we announced last quarter, with the results we achieved in the first
six months corroborating this expectation.
Lastly, in order to better manage all of these simultaneous projects, the Company recently reformulated its corporate
structure, which led to the creation of two presidencies: Primary & Secondary Education and Postsecondary Education. The
integration of the on-campus and DL operations into a single Postsecondary Education structure is aligned with the new
reality of this market, that education is increasingly hybrid, which will make our decision making more agile. This new
structure will help to improve management in the Company’s various areas, which have unique strategies and different
target publics, but common goals: to be a reference in teaching quality and ensure growing returns for all stakeholders.

5
EARNINGS RELEASE 2Q18
POSTSECONDARY EDUCATION
Evolution in Number of Students
The evolution in the number of Postsecondary students between 1Q18 and 2Q18 by product (Undergraduate and Graduate)
and teaching format (On-Campus and Distance Learning) is presented below.
* Divestment of FAIR, FAC/FAMAT and NOVATEC at the end of 2017
At the end of 1S18, Kroton had 936,888 students enrolled in Postsecondary Education (Undergraduate and Graduate),
considering on-campus and distance-learning formats, down 2.6% from the same period last year. However, note that this
result incorporates a 29.4% increase in the level of graduations, as well as a shift in the student base profile, with fewer FIES
students, who historically have lower dropout rates. Furthermore, the country’s persistently high unemployment rate
contributed to the higher dropout rate, adversely affecting student base growth. Excluding factors beyond the Company’s
control, such as social and economic indicators, the resilience and effectiveness of its commercial strategy in recent student-
recruiting cycles becomes clear, with solid and consistent results despite the increased competition. Compared to the prior
Students Undergraduate Graduate Total Undergraduate Graduate Total
2Q17 Base 417,010 8,099 425,109 516,250 25,601 541,851
Asset sales* 5,060 21 5,081 - - -
Comparable 2Q17 411,950 8,078 420,028 516,250 25,601 541,851
1Q18 Base 406,040 9,600 415,640 551,874 29,669 581,543
New Enrollments - 488 488 - 6,336 6,336
Graduates - (2,079) (2,079) - (8,016) (8,016)
Dropouts (20,356) (192) (20,548) (35,893) (583) (36,476)
2Q18 Base 385,684 7,817 393,501 515,981 27,406 543,387
% 2Q18 Base / 2Q17 Base -6.4% -3.2% -6.3% -0.1% 7.1% 0.3%
% 2Q18 Base / 1Q18 Base -5.0% -18.6% -5.3% -6.5% -7.6% -6.6%
Students
2Q17 Base 933,260 33,700 966,960
Asset sales* 5,060 21 5,081
Comparable 2Q17 928,200 33,679 961,879
1Q18 Base 957,914 39,269 997,183
New Enrollments - 6,824 6,824
Graduates - (10,095) (10,095)
Dropouts (56,249) (775) (57,024)
2Q18 Base 901,665 35,223 936,888
% 2Q18 Base / 2Q17 Base -2.9% 4.6% -2.6%
% 2Q18 Base / 1Q18 Base -5.9% -10.3% -6.0%
On-Campus Distance Learning
Total
Undergraduate
Total
GraduateTotal
OPERATING PERFORMANCE
6
EARNINGS RELEASE 2Q18
quarter, the 6.0% reduction is explained by the natural seasonality of the business. A breakdown by teaching format shows
that On-Campus Postsecondary Education accounted for 42% of the student base, while Distance Learning Education
accounted for the other 58%.
Considering only Graduate programs, the student base expanded by 4.6% from the same period last year, supported by
the student-recruiting processes conducted during the year, with most students enrolling in Distance Learning programs.
Compared to the prior quarter, the 10.3% decline is explained by the seasonality of the operation, with graduations and
dropouts offsetting the new students admitted in the period. Bear in mind that the LFG business also offers Graduate
programs, whose students are included in the above table.
The admissions and re-enrollment processes for the second semester of 2018 are still ongoing, including 13 new campuses
and 100 new Distance Learning centers compared to the first semester. The processes are expected to end in September.
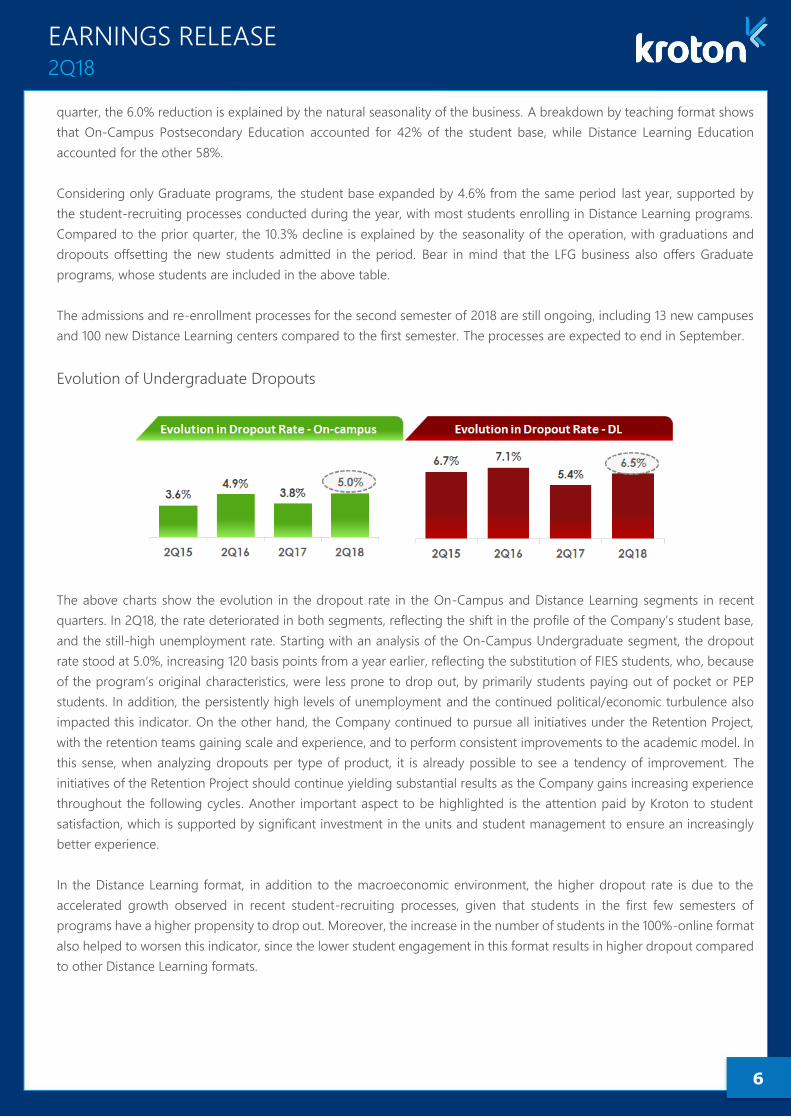
Evolution of Undergraduate Dropouts
The above charts show the evolution in the dropout rate in the On-Campus and Distance Learning segments in recent
quarters. In 2Q18, the rate deteriorated in both segments, reflecting the shift in the profile of the Company’s student base,
and the still-high unemployment rate. Starting with an analysis of the On-Campus Undergraduate segment, the dropout
rate stood at 5.0%, increasing 120 basis points from a year earlier, reflecting the substitution of FIES students, who, because
of the program’s original characteristics, were less prone to drop out, by primarily students paying out of pocket or PEP
students. In addition, the persistently high levels of unemployment and the continued political/economic turbulence also
impacted this indicator. On the other hand, the Company continued to pursue all initiatives under the Retention Project,
with the retention teams gaining scale and experience, and to perform consistent improvements to the academic model. In
this sense, when analyzing dropouts per type of product, it is already possible to see a tendency of improvement. The
initiatives of the Retention Project should continue yielding substantial results as the Company gains increasing experience
throughout the following cycles. Another important aspect to be highlighted is the attention paid by Kroton to student
satisfaction, which is supported by significant investment in the units and student management to ensure an increasingly
better experience.
In the Distance Learning format, in addition to the macroeconomic environment, the higher dropout rate is due to the
accelerated growth observed in recent student-recruiting processes, given that students in the first few semesters of
programs have a higher propensity to drop out. Moreover, the increase in the number of students in the 100%-online format
also helped to worsen this indicator, since the lower student engagement in this format results in higher dropout compared
to other Distance Learning formats.

7
EARNINGS RELEASE 2Q18
FIES
Number of FIES Students
At the end of 2Q18, the Company had 113,490 students enrolled with FIES contracts, down 33.6% from the same period of
2017, following the trend of recent quarters, with increasingly fewer new students and higher graduations of these students.
As a result, FIES students accounted for 29.4% of the On-Campus Undergraduate base, or 12.6% of the total Undergraduate
student base, down 11.6 p.p. and 5.7 p.p., respectively, on the prior-year period.
Private Special Installment Plan (PEP) and Late Enrollment Installment Plan (PMT)
Considering its installment payment products, Kroton closed the semester with around 59,100 students enrolled in PEP
programs, with about 45,400 enrolled in PEP30 and 13,600 in PEP50. For the student-recruiting process for the second
semester of 2018, Kroton will continue to draw on the strength of this product to attract new students, projecting a similar
exposure to the level observed at the start of the year. Note that Kroton continues to adopt the same conservative policies
as it did in previous quarters with regards to revenue recognition, including the calculation of the Adjustment to Present
Value (APV) of revenue, and for provisioning losses from bad debt, which is accrued at 50% of the financed portion for all
PEP students, as was done over the past few quarters.
Furthermore, note that the dropout curve is naturally higher during the first semesters of academic programs and that the
actual dropout rate of PEP students is comparable to the dropout rates of students without installment plans within the
same classes, which corroborates the product’s sustainability. This behavior is true for both PEP30 and PEP50.
PMT (or temporary PEP) is an alternative for the payment in installments of monthly tuitions related exclusively to periods
during which new students were not yet enrolled because they were admitted after the start of classes, but still with sufficient
time to complete the minimum classroom hours in the semester. Instead of exempting students from these monthly tuitions,
Kroton started to offer this option to new On-campus students as of the second semester of 2016, and to new DL students
as of the first semester of 2017. Therefore, the Company continues to attract freshmen, enabling their late enrollment without
foregoing revenues by granting scholarships or discounts. Note that Kroton adopts the same accounting practice for PEP
and PMT, whereby revenues are adjusted to present value and provisions for bad debt are accrued for 50% of the installment
amounts. In addition, as with the policy adopted for PEP, the outstanding balance of these tuitions becomes due
automatically if the student drops out before graduation.
8
EARNINGS RELEASE 2Q18
Preparatory Courses (LFG), Unregulated Programs and Language Courses
Through the brand LFG, the Company offers preparatory courses for the examination of the Brazilian Bar Association (OAB)
and for examinations for civil servant positions. Positioned as a reference in preparatory courses, LFG registered an average
student base of 28,535 in 2Q18 (note that these students were not included in the number of Postsecondary students
reported previously), representing expansion of 3.4% from the same period of 2017, reflecting the efforts to improve the
operation carried out since the start of the year.
Kroton also offers short-duration open enrollment programs that allow students to increase their knowledge in various
fields, such as Management, Education, Mathematics and Languages. In 2Q18, there were 33,515 students enrolled in these
programs (who also are not considered in the total number of Postsecondary students), down 13.5% from 2Q17.
PRIMARY & SECONDARY
As part of the Company’s expansion strategy already disclosed to the market, Kroton created “Saber,” a holding company
exclusively dedicated to the Primary & Secondary Education market. Saber will consolidate all of Kroton’s current operations
in the Primary & Secondary Education business, which include learning systems and operating own and third-party schools,
as well as any future deals that the Company eventually carries out in this segment, including asset acquisitions and their
subsequent expansion through new units, using the brand of the acquired asset. Note that the educational projects of the
institutions under the holding company Saber will be maintained, since they concentrate a large part of the value attributed
to the brand.
Through the Pitágoras Network, which offers Learning Systems, including textbook collections, teacher training, educational
assessments and other services to private schools in the Pre-School, Primary & Secondary Education, the Company serves
a total of 687 Associated Schools and approximately 227,000 students in the private sector, which represent increases of
2.2% and 3.1% compared to last year, respectively.
In April, Saber concluded its first acquisition, of Centro Educacional Leonardo Da Vinci (“CELV”). Founded in the 1990s and
located in Vitória, Espírito Santo, CELV has unique facilities and serves 1,311 students (December 2017 base), 71% of whom
are enrolled in full-time programs. With a strong focus on quality, CELV placed first in the state’s ENEM examination for six
times in recent years, and offers a bilingual program from primary to secondary school, including the option of a high school
diploma that facilitates acceptance by U.S. universities. This was the first quarter in which CELV figures were incorporated
into Kroton’s primary and secondary education segment, increasing to 2 the number of own schools (Pitágoras and now
CELV), in addition to the management contracts.
More recently, on April 22, Saber announced the execution of an agreement to acquire a controlling interest in Somos
Educação S.A., which has complementary operations, offering a wide array of high-quality products and services in Primary
& Secondary Education, including schools, learning systems, textbooks, publishing houses and language courses. With this
acquisition, Saber will serve about 37,000 students in own schools, 25,000 students in language courses, 1.2 million students
in partner private schools, in addition to reaching some 33 million students in public schools through the National Textbook
Program (PNLD). Saber will also become an important community of teachers who use its products and services in Brazil,
with approximately 85,000 professionals working in private schools and 1.7 million teachers in public schools. Saber will be
responsible for renowned teaching institutions, such as Pitágoras, PH, Anglo, Red Balloon, and publishing houses, such as
Ática, Scipione and Saraiva, among others, with a nationwide presence in all Brazilian states. The consummation of the
transaction is subject to evaluation and prior approval by Brazil's antitrust authority CADE. Until all due validations are
obtained and the operation is approved by the regulatory agency, the companies will continue to operate in a totally
independent manner.
9
EARNINGS RELEASE 2Q18
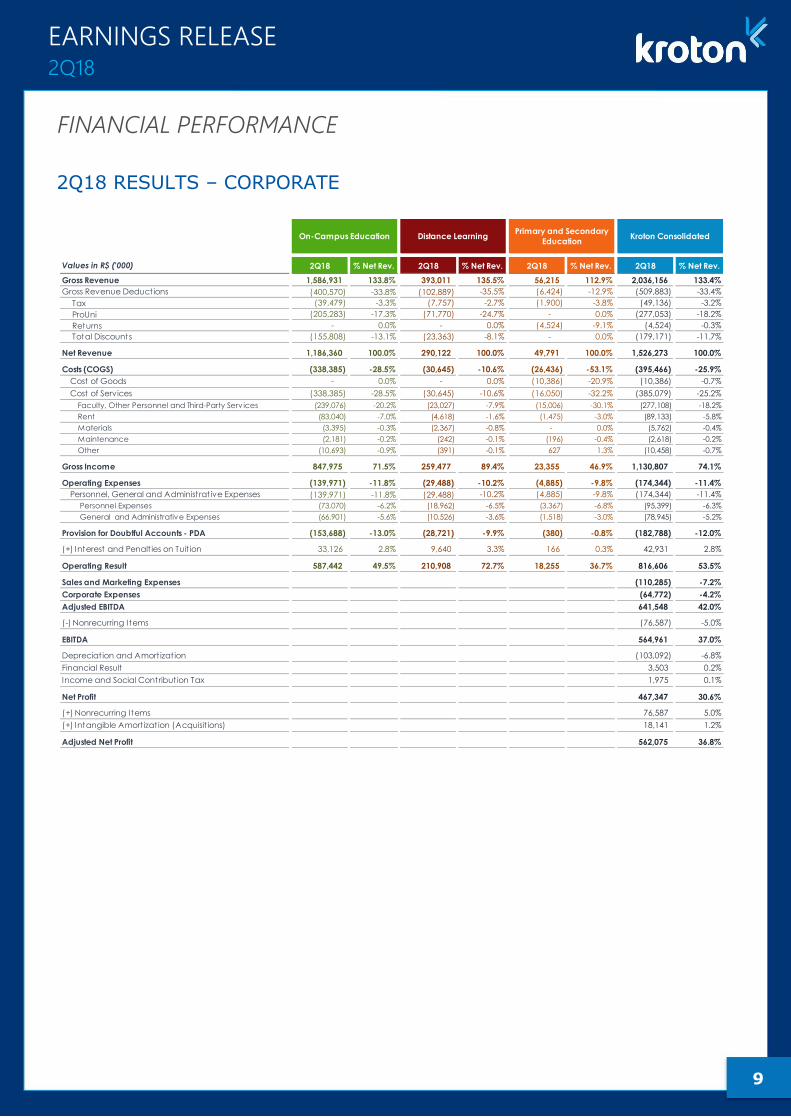
2Q18 RESULTS – CORPORATE
Values in R$ ('000) 2Q18 % Net Rev. 2Q18 % Net Rev. 2Q18 % Net Rev. 2Q18 % Net Rev.
Gross Revenue 1,586,931 133.8% 393,011 135.5% 56,215 112.9% 2,036,156 133.4%
Gross Revenue Deductions (400,570) -33.8% (102,889) -35.5% (6,424) -12.9% (509,883) -33.4%
Tax (39,479) -3.3% (7,757) -2.7% (1,900) -3.8% (49,136) -3.2%
ProUni (205,283) -17.3% (71,770) -24.7% - 0.0% (277,053) -18.2%
Returns - 0.0% - 0.0% (4,524) -9.1% (4,524) -0.3%
Total Discounts (155,808) -13.1% (23,363) -8.1% - 0.0% (179,171) -11.7%
Net Revenue 1,186,360 100.0% 290,122 100.0% 49,791 100.0% 1,526,273 100.0%
Costs (COGS) (338,385) -28.5% (30,645) -10.6% (26,436) -53.1% (395,466) -25.9%
Cost of Goods - 0.0% - 0.0% (10,386) -20.9% (10,386) -0.7%
Cost of Services (338,385) -28.5% (30,645) -10.6% (16,050) -32.2% (385,079) -25.2%
Faculty, Other Personnel and Third-Party Serv ices (239,076) -20.2% (23,027) -7.9% (15,006) -30.1% (277,108) -18.2%
Rent (83,040) -7.0% (4,618) -1.6% (1,475) -3.0% (89,133) -5.8%
Materials (3,395) -0.3% (2,367) -0.8% - 0.0% (5,762) -0.4%
Maintenance (2,181) -0.2% (242) -0.1% (196) -0.4% (2,618) -0.2%
Other (10,693) -0.9% (391) -0.1% 627 1.3% (10,458) -0.7%
Gross Income 847,975 71.5% 259,477 89.4% 23,355 46.9% 1,130,807 74.1%
Operating Expenses (139,971) -11.8% (29,488) -10.2% (4,885) -9.8% (174,344) -11.4%
Personnel, General and Administrat ive Expenses (139,971) -11.8% (29,488) -10.2% (4,885) -9.8% (174,344) -11.4%
Personnel Expenses (73,070) -6.2% (18,962) -6.5% (3,367) -6.8% (95,399) -6.3%
General and Administrative Expenses (66,901) -5.6% (10,526) -3.6% (1,518) -3.0% (78,945) -5.2%
Provision for Doubtful Accounts - PDA (153,688) -13.0% (28,721) -9.9% (380) -0.8% (182,788) -12.0%
(+) Interest and Penalt ies on Tuit ion 33,126 2.8% 9,640 3.3% 166 0.3% 42,931 2.8%
Operating Result 587,442 49.5% 210,908 72.7% 18,255 36.7% 816,606 53.5%
Sales and Marketing Expenses (110,285) -7.2%
Corporate ExpensesC
o(64,772) -4.2%
Adjusted EBITDA 641,548 42.0%
(-) Nonrecurring Items (76,587) -5.0%
EBITDA 564,961 37.0%
Depreciat ion and Amort izat ion (103,092) -6.8%
Financial Result 3,503 0.2%
Income and Social Contribut ion Tax 1,975 0.1%
Net Profit 467,347 30.6%
(+) Nonrecurring Items 76,587 5.0%
(+) Intangible Amort izat ion (Acquisit ions) 18,141 1.2%
Adjusted Net Profit 562,075 36.8%
On-Campus Education Distance LearningPrimary and Secondary
EducationKroton Consolidated
FINANCIAL PERFORMANCE

10
EARNINGS RELEASE 2Q18
1H18 RESULTS – CORPORATE
Values in R$ ('000) 1H18 % Net Rev. 1H18 % Net Rev. 1H18 % Net Rev. 1H18 % Net Rev.
Gross Revenue 2,950,429 131.1% 739,336 133.8% 104,218 121.5% 3,793,983 131.3%
Gross Revenue Deductions (699,081) -31.1% (186,886) -33.8% (18,418) -21.5% (904,385) -31.3%
Tax (79,932) -3.6% (14,789) -2.7% (3,185) -3.7% (97,906) -3.4%
ProUni (390,350) -17.3% (130,349) -23.6% - 0.0% (520,698) -18.0%
Returns - 0.0% - 0.0% (15,233) -17.8% (15,233) -0.5%
Total Discounts (228,799) -10.2% (41,749) -7.6% - 0.0% (270,548) -9.4%
Net Revenue 2,251,348 100.0% 552,450 100.0% 85,800 100.0% 2,889,598 100.0%
Costs (COGS) (616,054) -27.4% (52,854) -9.6% (39,333) -45.8% (708,241) -24.5%
Cost of Goods - 0.0% - 0.0% (15,480) -18.0% (15,480) -0.5%
Cost of Services (616,054) -27.4% (52,854) -9.6% (23,853) -27.8% (692,761) -24.0%
Faculty, Other Personnel and Third-Party Serv ices (423,764) -18.8% (40,396) -7.3% (21,601) -25.2% (485,761) -16.8%
Rent (164,879) -7.3% (8,294) -1.5% (1,677) -2.0% (174,850) -6.1%
Materials (5,990) -0.3% (5,595) -1.0% - 0.0% (11,585) -0.4%
Maintenance (5,295) -0.2% (425) -0.1% (257) -0.3% (5,976) -0.2%
Other (16,126) -0.7% 1,856 0.3% (318) -0.4% (14,588) -0.5%
Gross Income 1,635,294 72.6% 499,596 90.4% 46,467 54.2% 2,181,357 75.5%
Operating Expenses (256,562) -11.4% (54,664) -9.9% (8,454) -9.9% (319,681) -11.1%
Personnel, General and Administrat ive Expenses (256,562) -11.4% (54,664) -9.9% (8,454) -9.9% (319,681) -11.1%
Personnel (133,728) -5.9% (34,362) -6.2% (6,473) -7.5% (174,563) -6.0%
General and Administrative (122,834) -5.5% (20,303) -3.7% (1,980) -2.3% (145,118) -5.0%
Provision for Doubtful Accounts - PDA (288,667) -12.8% (54,283) -9.8% (669) -0.8% (343,619) -11.9%
(+) Interest and Penalt ies on Tuit ion 60,024 2.7% 23,784 4.3% 532 0.6% 84,340 2.9%
Operating Result 1,150,088 51.1% 414,432 75.0% 37,877 44.1% 1,602,397 55.5%
Sales and Marketing Expenses (224,210) -7.8%
Corporate Expenses (121,927) -4.2%
Adjusted EBITDA 1,256,261 43.5%
(-) Nonrecurring Items (122,059) -4.2%
EBITDA 1,134,203 39.3%
Depreciat ion and Amort izat ion (205,316) -7.1%
Financial Result 21,315 0.7%
Income and Social Contribut ion Tax (7,440) -0.3%
Income Tax / Social Cont. - Disposal of Uniasselvi - 0.0%
Net Profit 942,762 32.6%
(+) Nonrecurring Items 122,059 4.2%
(+) Intangible Amort izat ion (Acquisit ions) 36,246 1.3%
(+) Income Tax / Social Cont. - Disposal of Uniasselvi - 0.0%
Adjusted Net Profit 1,101,066 38.1%
On-Campus Education Distance LearningPrimary and Secondary
EducationKroton Consolidated

11
EARNINGS RELEASE 2Q18
CORPORATE FINANCIAL PERFORMANCE – ON-CAMPUS EDUCATION1
1 The corporate financial data for 2017 include eight months (January to August) of the operations of the units FAIR, FAC/ FAMAT and 12 months of the operations of
NOVATEC in the On-Campus segment, since the sales were concluded on August 31, 2017 and on December 29, 2917, respectively. Meanwhile, the financial data ex FAIR,
FAC/FAMAT and NOVATEC exclude the figures from these operations from the On-Campus segment for all periods.
On-Campus Education - Values in R$ ('000) 2Q18 2Q17 Chg.% 1Q18 Chg.% 1H18 1H17 Chg.%
Gross Revenue 1,586,931 1,507,854 5.2% 1,363,498 16.4% 2,950,429 2,866,616 2.9%
Gross Revenue Deductions (400,570) (327,748) 22.2% (298,511) 34.2% (699,081) (619,882) 12.8%
Tax (39,479) (43,398) -9.0% (40,453) -2.4% (79,932) (82,951) -3.6%
ProUni (205,283) (173,530) 18.3% (185,066) 10.9% (390,350) (339,376) 15.0%
Returns - - n.a. - n.a. - - n.a.
Total Discounts (155,808) (110,820) 40.6% (72,992) 113.5% (228,799) (197,554) 15.8%
FGEDUC (29,873) (34,541) -13.5% (24,048) 24.2% (53,921) (64,912) -16.9%
FIES - Administratuve Fee (11,399) (12,296) -7.3% (8,952) 27.3% (20,351) (25,065) -18.8%
Other (114,536) (63,984) 79.0% (39,992) 186.4% (154,528) (107,578) 43.6%
Net Revenue 1,186,361 1,180,105 0.5% 1,064,987 11.4% 2,251,348 2,246,735 0.2%
Net Revenue - Undergraduate 1,176,465 1,167,942 0.7% 1,031,629 14.0% 2,208,095 2,220,257 -0.5%
Net Revenue - Out-of-pocket 541,630 384,757 40.8% 446,150 21.4% 987,780 695,285 42.1%
Net Revenue - FIES (financed part net of APV) 419,768 608,479 -31.0% 389,775 7.7% 809,543 1,144,886 -29.3%
Net Revenue - PEP (installment part net of APV) 150,893 134,655 12.1% 125,718 20.0% 276,611 280,587 -1.4%
Net Revenue - PMT (installment part net of APV) 64,175 40,051 60.2% 69,987 -8.3% 134,162 99,499 34.8%
Net Revenue - Graduate, Unregulated Programs, Pronatec 9,895 12,163 -18.6% 33,358 -70.3% 43,253 26,477 63.4%
Total of Costs (338,385) (330,090) 2.5% (277,669) 21.9% (616,054) (590,691) 4.3%
Cost of Goods - - n.a. - n.a. - - n.a.
Cost of Services (338,385) (330,090) 2.5% (277,669) 21.9% (616,054) (590,691) 4.3%
Faculty, Other Personnel and Third-Party Serv ices (239,076) (241,938) -1.2% (184,688) 29.4% (423,764) (419,414) 1.0%
Rent (83,039) (79,572) 4.4% (81,840) 1.5% (164,879) (159,587) 3.3%
Materials (3,395) (3,792) -10.5% (2,595) 30.8% (5,990) (5,740) 4.3%
Maintenance (2,182) (1,916) 13.9% (3,113) -29.9% (5,295) (2,145) 146.8%
Other (10,693) (2,872) 272.3% (5,433) 96.8% (16,126) (3,804) 323.9%
Gross Income 847,976 850,014 -0.2% 787,319 7.7% 1,635,294 1,656,044 -1.3%
Gross Margin 71.5% 72.0% -0.6 p.p. 73.9% -2.5 p.p. 72.6% 73.7% -1.1 p.p.
Total Operating Expenses (139,972) (126,650) 10.5% (116,591) 20.1% (256,562) (231,463) 10.8%
Personnel Expenses (73,070) (66,630) 9.7% (60,658) 20.5% (133,728) (124,929) 7.0%
General and Administrative Expenses (66,901) (60,020) 11.5% (55,933) 19.6% (122,834) (106,534) 15.3%
Provision for Doubtful Account - PDA (153,688) (122,443) 25.5% (134,980) 13.9% (288,667) (253,916) 13.7%
(+) Interest and Penalt ies on Tuit ion 33,126 24,997 32.5% 26,898 23.2% 60,024 60,229 -0.3%
Operating Result 587,442 625,918 -6.1% 562,646 4.4% 1,150,088 1,230,895 -6.6%
Operat ing Margin 49.5% 53.0% -3.5 p.p. 52.8% -3.3 p.p. 51.1% 54.8% -3.7 p.p.
12
EARNINGS RELEASE 2Q18
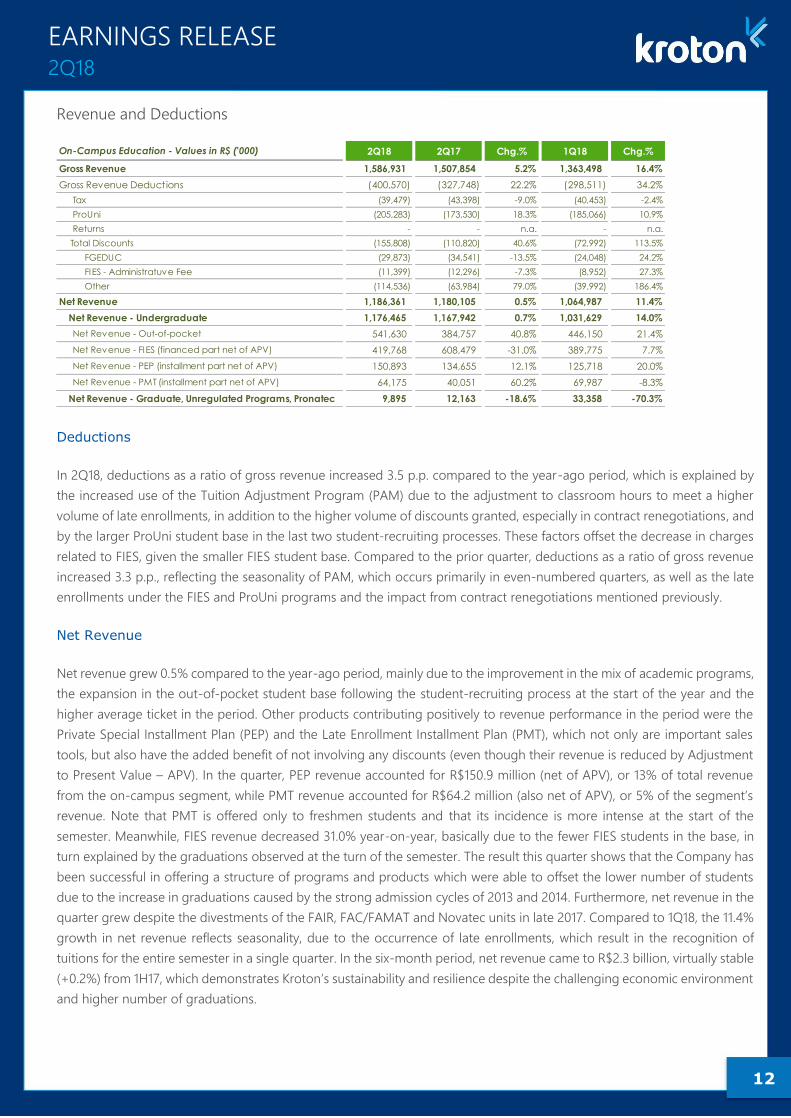
Revenue and Deductions
Deductions
In 2Q18, deductions as a ratio of gross revenue increased 3.5 p.p. compared to the year-ago period, which is explained by
the increased use of the Tuition Adjustment Program (PAM) due to the adjustment to classroom hours to meet a higher
volume of late enrollments, in addition to the higher volume of discounts granted, especially in contract renegotiations, and
by the larger ProUni student base in the last two student-recruiting processes. These factors offset the decrease in charges
related to FIES, given the smaller FIES student base. Compared to the prior quarter, deductions as a ratio of gross revenue
increased 3.3 p.p., reflecting the seasonality of PAM, which occurs primarily in even-numbered quarters, as well as the late
enrollments under the FIES and ProUni programs and the impact from contract renegotiations mentioned previously.
Net Revenue
Net revenue grew 0.5% compared to the year-ago period, mainly due to the improvement in the mix of academic programs,
the expansion in the out-of-pocket student base following the student-recruiting process at the start of the year and the
higher average ticket in the period. Other products contributing positively to revenue performance in the period were the
Private Special Installment Plan (PEP) and the Late Enrollment Installment Plan (PMT), which not only are important sales
tools, but also have the added benefit of not involving any discounts (even though their revenue is reduced by Adjustment
to Present Value – APV). In the quarter, PEP revenue accounted for R$150.9 million (net of APV), or 13% of total revenue
from the on-campus segment, while PMT revenue accounted for R$64.2 million (also net of APV), or 5% of the segment’s
revenue. Note that PMT is offered only to freshmen students and that its incidence is more intense at the start of the
semester. Meanwhile, FIES revenue decreased 31.0% year-on-year, basically due to the fewer FIES students in the base, in
turn explained by the graduations observed at the turn of the semester. The result this quarter shows that the Company has
been successful in offering a structure of programs and products which were able to offset the lower number of students
due to the increase in graduations caused by the strong admission cycles of 2013 and 2014. Furthermore, net revenue in the
quarter grew despite the divestments of the FAIR, FAC/FAMAT and Novatec units in late 2017. Compared to 1Q18, the 11.4%
growth in net revenue reflects seasonality, due to the occurrence of late enrollments, which result in the recognition of
tuitions for the entire semester in a single quarter. In the six-month period, net revenue came to R$2.3 billion, virtually stable
(+0.2%) from 1H17, which demonstrates Kroton’s sustainability and resilience despite the challenging economic environment
and higher number of graduations.
On-Campus Education - Values in R$ ('000) 2Q18 2Q17 Chg.% 1Q18 Chg.%
Gross Revenue 1,586,931 1,507,854 5.2% 1,363,498 16.4%
Gross Revenue Deductions (400,570) (327,748) 22.2% (298,511) 34.2%
Tax (39,479) (43,398) -9.0% (40,453) -2.4%
ProUni (205,283) (173,530) 18.3% (185,066) 10.9%
Returns - - n.a. - n.a.
Total Discounts (155,808) (110,820) 40.6% (72,992) 113.5%
FGEDUC (29,873) (34,541) -13.5% (24,048) 24.2%
FIES - Administratuve Fee (11,399) (12,296) -7.3% (8,952) 27.3%
Other (114,536) (63,984) 79.0% (39,992) 186.4%
Net Revenue 1,186,361 1,180,105 0.5% 1,064,987 11.4%
Net Revenue - Undergraduate 1,176,465 1,167,942 0.7% 1,031,629 14.0%
Net Revenue - Out-of-pocket 541,630 384,757 40.8% 446,150 21.4%
Net Revenue - FIES (financed part net of APV) 419,768 608,479 -31.0% 389,775 7.7%
Net Revenue - PEP (installment part net of APV) 150,893 134,655 12.1% 125,718 20.0%
Net Revenue - PMT (installment part net of APV) 64,175 40,051 60.2% 69,987 -8.3%
Net Revenue - Graduate, Unregulated Programs, Pronatec 9,895 12,163 -18.6% 33,358 -70.3%

13
EARNINGS RELEASE 2Q18
Average Net Ticket
Calculation of the net average ticket considers Net Revenue after FGEDUC, FIES Administrative Fee, Prouni Scholarship and Taxes on all On-campus products (Undergraduate,
Graduate, Research Degree and Extension), excluding revenue from Pronatec and the effects of APV.
For a better understanding, the calculation of Kroton’s average ticket considers the number of students effectively billed in
the period (including ProUni students), since, due to retroactive contract amendments, a student could be billed more than
once in a certain month. The net average ticket of On-Campus programs in 2Q18 was R$860.42, an increase of 0.5% from
the year-ago period, reflecting the annual adjustment of monthly tuitions and the increased share of programs with higher
monthly tuitions in the base, with these factors offset by the lower price practiced for late enrollments and by the higher
number of ProUni students. Furthermore, the increase in the average ticket below inflation in the period also reflects the
different mix of new students, with a higher share of out-of-pocket students (which have discounted tickets). Compared to
the previous quarter, the 4.3% decrease in average ticket is due to the increased use of PAM this quarter to enable classroom
hours better aligned with students’ needs. In the six-month period, the average ticket in the On-Campus segment was
R$877.67, up 1.4% from the same period of 2017.
Breakdown of Average Net Ticket of On-Campus Undergraduate – Student by Product Perspective
Last year, Kroton began reporting the analysis of average tickets from the “student by product perspective” for the On-
Campus Undergraduate business. This perspective considers the different revenue sources of each product separately, i.e.,
the ex-FIES and ex-PEP average ticket is formed by the amounts of students paying 100% of tuition out of pocket and those
contracting the PMT plan. Meanwhile, the PEP and FIES average tickets are divided into Out-of-pocket, Installment/Financing
and PMT. The analysis of the combination of the Ex-FIES and PMT average tickets is called “On-Campus Undergraduate
Out-Of-Pocket (ex-FIES and ex-Prouni).” This analysis enables a better understanding of the dynamics of the average ticket
across the various types of students and of products offered by the Company.
¹ Revenue used to calculate net average ticket; ² Amounts / ‘000; ³ On-campus ex Graduate/Unregulated /Extension/Language/Pronatec programs.
As noted previously, an analysis of the above table proves the importance of offering student financing/installment plans in
terms of enabling students to pursue careers with more expensive monthly tuitions, which is a policy that was adopted by
the Brazilian government itself in offering FIES financing. Since there is no difference in the amounts of the base tuition
among students in the same class, the differences in the average ticket observed among installment/financing products
reinforces this point, given the higher share of students enrolled in more expensive programs. Accordingly, PEP is the
segment’s channel with the highest average ticket, of R$1,296.1 per student, in 2Q18. Next comes FIES, with an average ticket
of R$1,232.0, followed by students paying out of pocket, with an average ticket of R$688.5.
On-Campus Postsecondary Education- Values in R$ 2Q18 2Q17 Chg.% 1Q18 Chg.%
Total 860.42 855.74 0.5% 898.80 -4.3%
Student Product Net Revenue APV NR Ex-APV ¹ Invoices² Net Ticket Net Revenue APV NR Ex-APV ¹ Invoices² Net TicketΔ Net
TicketΔ NR
Ex-FIES Ex-PEP 405,476 206 405,682 591 686.8 265,832 1,350 267,182 409 653.9 5.0% 51.8%
Out-of-Pocket 346,493 - 346,493 - - 225,993 - 225,993 - - - -
PMT 58,983 206 59,189 - - 39,839 1,350 41,189 - - - -
PEP 242,652 22,516 265,167 205 1,296.1 222,450 25,284 247,734 204 1,216.5 6.5% 7.0%
Out-of-Pocket 87,772 - 87,772 - - 85,900 - 85,900 - - - -
Installment 150,893 21,732 172,624 - - 134,626 27,433 162,060 - - - -
PMT 3,987 784 4,771 - - 1,924 (2,149) (226) - - - -
648,128 22,722 670,849 795 843.6 488,282 26,634 514,917 612 841.0 0.3% 30.3%
FIES 528,284 (2,549) 525,735 427 1,232.0 679,658 (4,181) 675,477 627 1,077.8 14.3% -22.2%
Out-of-Pocket 107,311 - 107,311 - - 72,862 - 72,862 - - - -
Installment 419,768 (1,941) 417,827 - - 608,479 (2,936) 605,543 - - - -
PEP+PMT 1,205 (608) 597 - - (1,683) (1,245) (2,928) - - - -
1,176,412 20,173 1,196,584 1,222 979.2 1,167,940 22,453 1,190,393 1,239 960.8 1.9% 0.5%
1,176,412 20,173 1,196,584 1,370 873.6 1,167,940 22,453 1,190,393 1,368 870.3 0.4% 0.5%
Chg.%
Ex-FIES e Ex-PEP
ON-CAMPUS UNDERGRADUATE 2Q18 2Q17
PEP
Out-of-Pocket On-Campus Undergrad. Ex-FIES Ex-Prouni
FIES
TOTAL On-Campus Undergradraduate³ ExProuni
TOTAL On-Campus Undergradraduate³

14
EARNINGS RELEASE 2Q18
To exclude seasonality from the quarterly comparison, such as the effects from PMT, the Tuition Adjustment Process (PAM)
and the different contracting curves of ProUni and FIES students, the following table presents an analysis of On-campus
average ticket by product in the semester:
¹ Revenue used to calculate net average ticket; ² Amounts / ‘000; ³ On-campus ex Graduate/Unregulated /Extension/Language/Pronatec programs.
Costs
In 2Q18, cost of services as a ratio of net revenue increased 0.6 p.p. compared to the same period of 2017, basically due to
costs related to the Company’s growth projects, which significantly expanded the number of new units in recent months.
This ends up creating additional costs related to faculty, rent and materials, which represent the segment’s main expenses.
Despite this pressure to spur future growth, all efforts related to projects to capture efficiency gains and streamline the cost
structure remain in place. The main proof of this is that, despite the more than 29 new units opened or integrated into the
portfolio, the increase in costs was only marginal, with some lines even presenting decreases. This result attests to the efforts
made under initiatives such as implementing the operational research (OR) software, combined with the more efficient
allocation of faculty and utilization of facilities, as well as negotiations related to the strategic sourcing project. Compared
to the previous quarter, total costs as a ratio of net revenue increased 2.5 p.p.. In addition to seasonality, this upturn is
explained by wage increases under collective bargaining agreements.
Student Product Net Revenue APV NR Ex-APV ¹ Invoices² Net Ticket Net Revenue APV NR Ex-APV ¹ Invoices² Net TicketΔ Net
TicketΔ NR
Ex-FIES Ex-PEP 796,516 (9,420) 787,096 1,064 739.9 527,335 13,135 540,470 785 688.5 7.5% 45.6%
Out-of-Pocket 684,896 - 684,896 - - 444,252 - 444,252 - - - -
PMT 111,620 (9,420) 102,200 - - 83,082 13,135 96,127 - - - -
PEP 439,940 32,438 472,377 368 1,285.0 437,542 31,003 468,545 395 1,186.4 8.3% 0.8%
Out-of-Pocket 142,384 - 142,384 - - 147,522 - 147,522 - - - -
Installment 276,611 29,606 306,217 - - 274,127 26,674 300,801 - - - -
PMT 20,945 2,831 23,776 - - 15,892 4,329 20,222 - - - -
1,236,456 23,018 1,259,474 1,431 879.9 964,876 44,138 1,009,014 1,180 855.2 2.9% 24.8%
FIES 971,599 (5,186) 966,412 783 1,233.7 1,255,378 (5,663) 1,249,716 1,144 1,092.6 12.9% -22.7%
Out-of-Pocket 160,459 - 160,459 - - 103,509 - 103,509 - - - -
Installment 809,543 (3,882) 805,661 - - 1,144,886 (5,874) 1,139,012 - - - -
PEP+PMT 1,597 (1,304) 293 - - 6,983 211 7,194 - - - -
2,208,054 17,831 2,225,886 2,215 1,005.0 2,220,255 38,475 2,258,730 2,324 972.1 3.4% -1.5%
2,208,054 17,831 2,225,886 2,497 891.4 2,220,255 38,475 2,258,730 2,571 878.6 1.5% -1.5%
ON-CAMPUS UNDERGRADUATE 1H18 1H17 Chg.%
PEP
Out-of-Pocket On-Campus Undergrad. Ex-FIES Ex-Prouni
FIES*
TOTAL On-Campus Undergradraduate³ ExProuni
TOTAL On-Campus Undergradraduate³
Ex-FIES and Ex-PEP
On-Campus Education - Values in R$ ('000) 2Q18 2Q17 Chg.% 1Q18 Chg.%
Total of Costs (338,385) (330,090) 2.5% (277,669) 21.9%
Cost of Goods (CG) - - n.a. - n.a.
Cost of Services (CS) (338,385) (330,090) 2.5% (277,669) 21.9%
Faculty, Other Personnel and Third-Party Serv ices (239,076) (241,938) -1.2% (184,688) 29.4%
Rent (83,039) (79,572) 4.4% (81,840) 1.5%
Materials (3,395) (3,792) -10.5% (2,595) 30.8%
Maintenance (2,182) (1,916) 13.9% (3,113) -29.9%
Other (10,693) (2,872) 272.3% (5,433) 96.8%
% of Net Revenues 2Q18 2Q17 Chg.% 1Q18 Chg.%
Total of Costs -28.5% -28.0% -0.6 p.p. -26.1% -2.5 p.p.
Cost of Goods (CG) 0.0% 0.0% n.a. 0.0% n.a.
Cost of Services (CS) -28.5% -28.0% -0.6 p.p. -26.1% -2.5 p.p.
Faculty, Other Personnel and Third-Party Serv ices -20.2% -20.5% 0.3 p.p. -17.3% -2.8 p.p.
Rent -7.0% -6.7% -0.3 p.p. -7.7% 0.7 p.p.
Materials -0.3% -0.3% 0.0 p.p. -0.2% 0.0 p.p.
Maintenance -0.2% -0.2% 0.0 p.p. -0.3% 0.1 p.p.
Other -0.9% -0.2% -0.7 p.p. -0.5% -0.4 p.p.

15
EARNINGS RELEASE 2Q18
Gross Income
Gross income from On-Campus Education was R$848.0 million in 2Q18, virtually stable compared to the same period last
year. Gross margin, however, contracted 0.6 p.p., due to the higher cost structure to support the growth projects. Compared
to the prior quarter, the 2.5 p.p. gross margin contraction reflects the seasonal increases in costs with faculty and third-party
services, which more than offset the higher revenue and the positive impact from the normalization of FIES enrollments. In
the six-month period, gross margin fell 1.1 p.p. to 72.6%, which reflects the accelerated addition of new units to the
Company’s portfolio, which offset the efforts to ensure continuous efficiency gains.
Operating Expenses
Personnel, General and Administrative Expenses
As a ratio of net revenue, total personnel, general and administrative expenses increased 1.1 p.p. from the year-ago quarter,
which also was due to the larger workforce and the higher administrative expenses related to the new units, particularly with
utilities. Compared to the prior quarter, the increase of 0.9 p.p. in this indicator is explained by the segment’s natura l
seasonality.
Provision for Doubtful Accounts (PDA)
Total PDA as a ratio of net revenue in the On-Campus segment increased 2.6 p.p. from the same period last year, to 13.0%.
The performance is related to the higher share of PEP and PMT students, as well as to the accruals to PDA out-of-pocket to
better reflect the change in the mix of the student base. Furthermore, the higher dropout rate observed in 2017 and the
higher delinquency rate led the Company to increase provisioning for the out-of-pocket student base in order to balance
On-Campus Education - Values in R$ ('000) 2Q18 2Q17 Chg.% 1Q18 Chg.%
Gross Income 847,976 850,014 -0.2% 787,319 7.7%
Gross Margin 71.5% 72.0% -0.6 p.p. 73.9% -2.5 p.p.
On-Campus Education - Values in R$ ('000) 2Q18 2Q17 Chg.% 1Q18 Chg.%
Total Operating Expenses (139,972) (126,650) 10.5% (116,591) 20.1%
Personnel Expenses (73,070) (66,630) 9.7% (60,658) 20.5%
General and Administrative Expenses (66,901) (60,020) 11.5% (55,933) 19.6%
% of Net Revenues 2Q18 2Q17 Chg.% 1Q18 Chg.%
Total Operating Expenses -11.8% -10.7% -1.1 p.p. -10.9% -0.9 p.p.
Personnel Expenses -6.2% -5.6% -0.5 p.p. -5.7% -0.5 p.p.
General and Administrative Expenses -5.6% -5.1% -0.6 p.p. -5.3% -0.4 p.p.
On-Campus Education - Values in R$ ('000) 2Q18 2Q17 Chg.% 1Q18 Chg.%
Provision for Doubtful Account - PDA (153,688) (122,443) 25.5% (134,980) 13.9%
PDA / Postsecondary Net Revenues¹ -13.0% -10.4% -2.6 p.p. -13.0% -0.0 p.p.
PDA Out -of-pocket (42,376) (29,613) 43.1% (33,620) 26.0%
PDA Out-of-pocket / Postsecondary Net Revenues Out-of-pocket¹ -7.7% -7.5% -0.2 p.p. -7.4% -0.3 p.p.
PDA FIES - Financed Part (3,778) (5,476) -31.0% (3,508) 7.7%
PDA FIES / Postsecondary Net Revenues FIES¹ -0.9% -0.9% 0.0 p.p -0.9% -0.0 p.p.
PDA PEP - Inst allment Part (75,446) (67,328) 12.1% (62,859) 20.0%
PDA PEP / Postsecondary Net Revenues PEP¹ -50.0% -50.0% 0.0 p.p -50.0% 0.0 p.p
PDA PMT - Inst allment Part (32,088) (20,026) 60.2% (34,993) -8.3%
PDA PMT / Postsecondary Net Revenues PMT¹ -50.0% -50.0% 0.0 p.p -50.0% 0.0 p.p
¹ Net Revenue for the On-Campus excludes revenues from Pronatec
16
EARNINGS RELEASE 2Q18
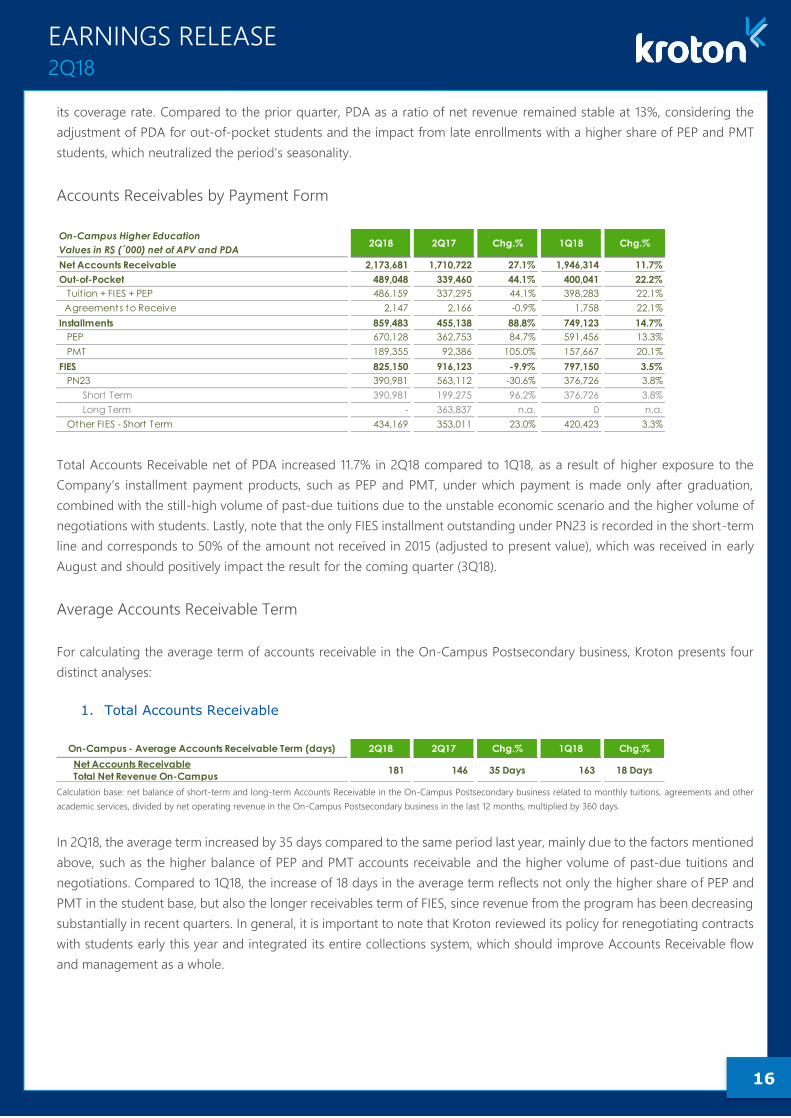
its coverage rate. Compared to the prior quarter, PDA as a ratio of net revenue remained stable at 13%, considering the
adjustment of PDA for out-of-pocket students and the impact from late enrollments with a higher share of PEP and PMT
students, which neutralized the period’s seasonality.
Accounts Receivables by Payment Form
Total Accounts Receivable net of PDA increased 11.7% in 2Q18 compared to 1Q18, as a result of higher exposure to the
Company’s installment payment products, such as PEP and PMT, under which payment is made only after graduation,
combined with the still-high volume of past-due tuitions due to the unstable economic scenario and the higher volume of
negotiations with students. Lastly, note that the only FIES installment outstanding under PN23 is recorded in the short-term
line and corresponds to 50% of the amount not received in 2015 (adjusted to present value), which was received in early
August and should positively impact the result for the coming quarter (3Q18).
Average Accounts Receivable Term
For calculating the average term of accounts receivable in the On-Campus Postsecondary business, Kroton presents four
distinct analyses:
1. Total Accounts Receivable
Calculation base: net balance of short-term and long-term Accounts Receivable in the On-Campus Postsecondary business related to monthly tuitions, agreements and other
academic services, divided by net operating revenue in the On-Campus Postsecondary business in the last 12 months, multiplied by 360 days.
In 2Q18, the average term increased by 35 days compared to the same period last year, mainly due to the factors mentioned
above, such as the higher balance of PEP and PMT accounts receivable and the higher volume of past-due tuitions and
negotiations. Compared to 1Q18, the increase of 18 days in the average term reflects not only the higher share of PEP and
PMT in the student base, but also the longer receivables term of FIES, since revenue from the program has been decreasing
substantially in recent quarters. In general, it is important to note that Kroton reviewed its policy for renegotiating contracts
with students early this year and integrated its entire collections system, which should improve Accounts Receivable flow
and management as a whole.
On-Campus Higher Education
Values in R$ (´000) net of APV and PDA2Q18 2Q17 Chg.% 1Q18 Chg.%
Net Accounts Receivable 2,173,681 1,710,722 27.1% 1,946,314 11.7%
Out-of-Pocket 489,048 339,460 44.1% 400,041 22.2%
Tuit ion + FIES + PEP 486,159 337,295 44.1% 398,283 22.1%
Agreements to Receive 2,147 2,166 -0.9% 1,758 22.1%
Installments 859,483 455,138 88.8% 749,123 14.7%
PEP 670,128 362,753 84.7% 591,456 13.3%
PMT 189,355 92,386 105.0% 157,667 20.1%
FIES 825,150 916,123 -9.9% 797,150 3.5%
PN23 390,981 563,112 -30.6% 376,726 3.8%
Short Term 390,981 199,275 96.2% 376,726 3.8%
Long Term - 363,837 n.a. 0 n.a.
Other FIES - Short Term 434,169 353,011 23.0% 420,423 3.3%
On-Campus - Average Accounts Receivable Term (days) 2Q18 2Q17 Chg.% 1Q18 Chg.%
Net Accounts Receivable
Total Net Revenue On-Campus181 146 35 Days 163 18 Days
17
EARNINGS RELEASE 2Q18
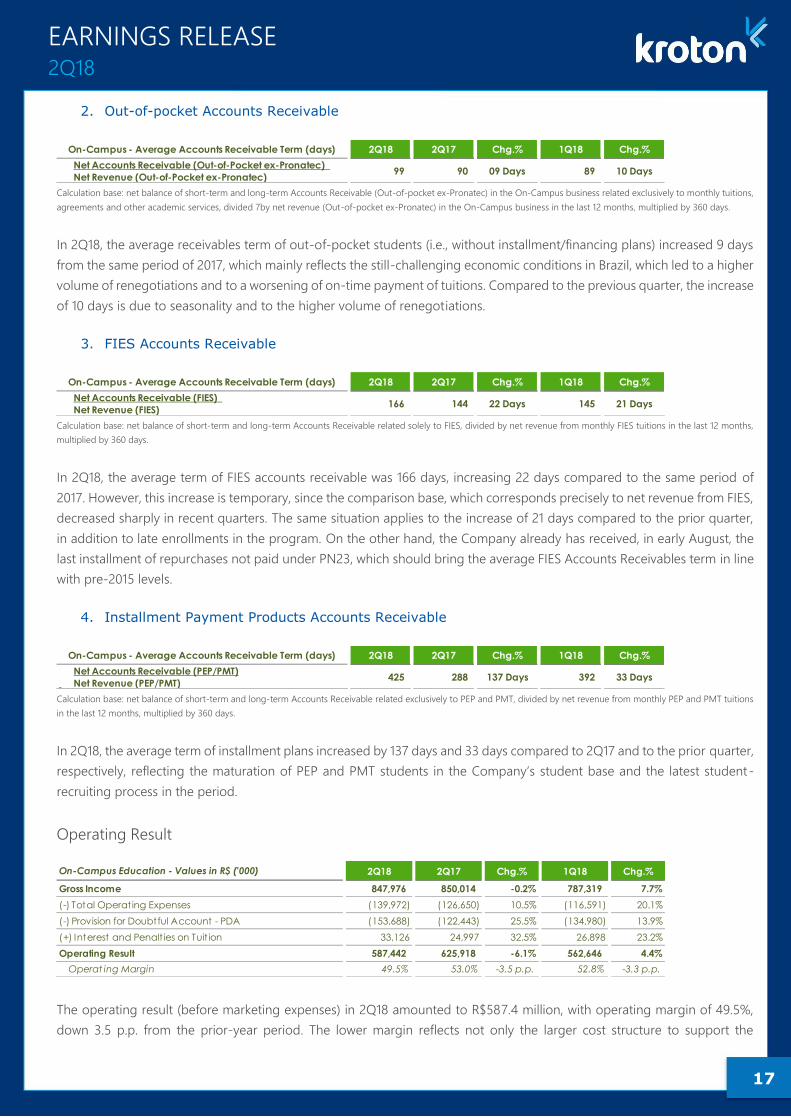
2. Out-of-pocket Accounts Receivable
Calculation base: net balance of short-term and long-term Accounts Receivable (Out-of-pocket ex-Pronatec) in the On-Campus business related exclusively to monthly tuitions,
agreements and other academic services, divided 7by net revenue (Out-of-pocket ex-Pronatec) in the On-Campus business in the last 12 months, multiplied by 360 days.
In 2Q18, the average receivables term of out-of-pocket students (i.e., without installment/financing plans) increased 9 days
from the same period of 2017, which mainly reflects the still-challenging economic conditions in Brazil, which led to a higher
volume of renegotiations and to a worsening of on-time payment of tuitions. Compared to the previous quarter, the increase
of 10 days is due to seasonality and to the higher volume of renegotiations.
3. FIES Accounts Receivable
Calculation base: net balance of short-term and long-term Accounts Receivable related solely to FIES, divided by net revenue from monthly FIES tuitions in the last 12 months,
multiplied by 360 days.
In 2Q18, the average term of FIES accounts receivable was 166 days, increasing 22 days compared to the same period of
2017. However, this increase is temporary, since the comparison base, which corresponds precisely to net revenue from FIES,
decreased sharply in recent quarters. The same situation applies to the increase of 21 days compared to the prior quarter,
in addition to late enrollments in the program. On the other hand, the Company already has received, in early August, the
last installment of repurchases not paid under PN23, which should bring the average FIES Accounts Receivables term in line
with pre-2015 levels.
4. Installment Payment Products Accounts Receivable
Calculation base: net balance of short-term and long-term Accounts Receivable related exclusively to PEP and PMT, divided by net revenue from monthly PEP and PMT tuitions
in the last 12 months, multiplied by 360 days.
In 2Q18, the average term of installment plans increased by 137 days and 33 days compared to 2Q17 and to the prior quarter,
respectively, reflecting the maturation of PEP and PMT students in the Company’s student base and the latest student-
recruiting process in the period.
Operating Result
The operating result (before marketing expenses) in 2Q18 amounted to R$587.4 million, with operating margin of 49.5%,
down 3.5 p.p. from the prior-year period. The lower margin reflects not only the larger cost structure to support the
On-Campus - Average Accounts Receivable Term (days) 2Q18 2Q17 Chg.% 1Q18 Chg.%
Net Accounts Receivable (Out-of-Pocket ex-Pronatec)
Net Revenue (Out-of-Pocket ex-Pronatec)99 90 09 Days 89 10 Days
On-Campus - Average Accounts Receivable Term (days) 2Q18 2Q17 Chg.% 1Q18 Chg.%
Net Accounts Receivable (FIES)
Net Revenue (FIES)166 144 22 Days 145 21 Days
On-Campus - Average Accounts Receivable Term (days) 2Q18 2Q17 Chg.% 1Q18 Chg.%
Net Accounts Receivable (PEP/PMT)
Net Revenue (PEP/PMT)425 288 137 Days 392 33 Days
On-Campus Education - Values in R$ ('000) 2Q18 2Q17 Chg.% 1Q18 Chg.%
Gross Income 847,976 850,014 -0.2% 787,319 7.7%
(-) Total Operating Expenses (139,972) (126,650) 10.5% (116,591) 20.1%
(-) Provision for Doubtful Account - PDA (153,688) (122,443) 25.5% (134,980) 13.9%
(+) Interest and Penalt ies on Tuit ion 33,126 24,997 32.5% 26,898 23.2%
Operating Result 587,442 625,918 -6.1% 562,646 4.4%
Operat ing Margin 49.5% 53.0% -3.5 p.p. 52.8% -3.3 p.p.
18
EARNINGS RELEASE 2Q18
Company’s growth projects, but also all other pressures, which mainly refer to the shift in the profile of the On-Campus
student base and to the higher provisioning to support the Company’s conservative approach to its installment plans.
However, note that the maintenance of operating margins around 50%, despite these short-term challenges, the weaker
economic activity and the accelerated expansion of units, demonstrates the effectiveness and consistency of the Company’s
various levers for continuing to deliver a high level of efficiency. Compared to the previous quarter, operating margin fell
3.3 p.p., due to the seasonal increase in costs and expenses and to the higher provisioning for out-of-pocket students in
the quarter. In the six-month period, operating result was R$1,150.1 million, with operating margin of 51.1%, down 3.7 p.p.
from the same period of 2017.
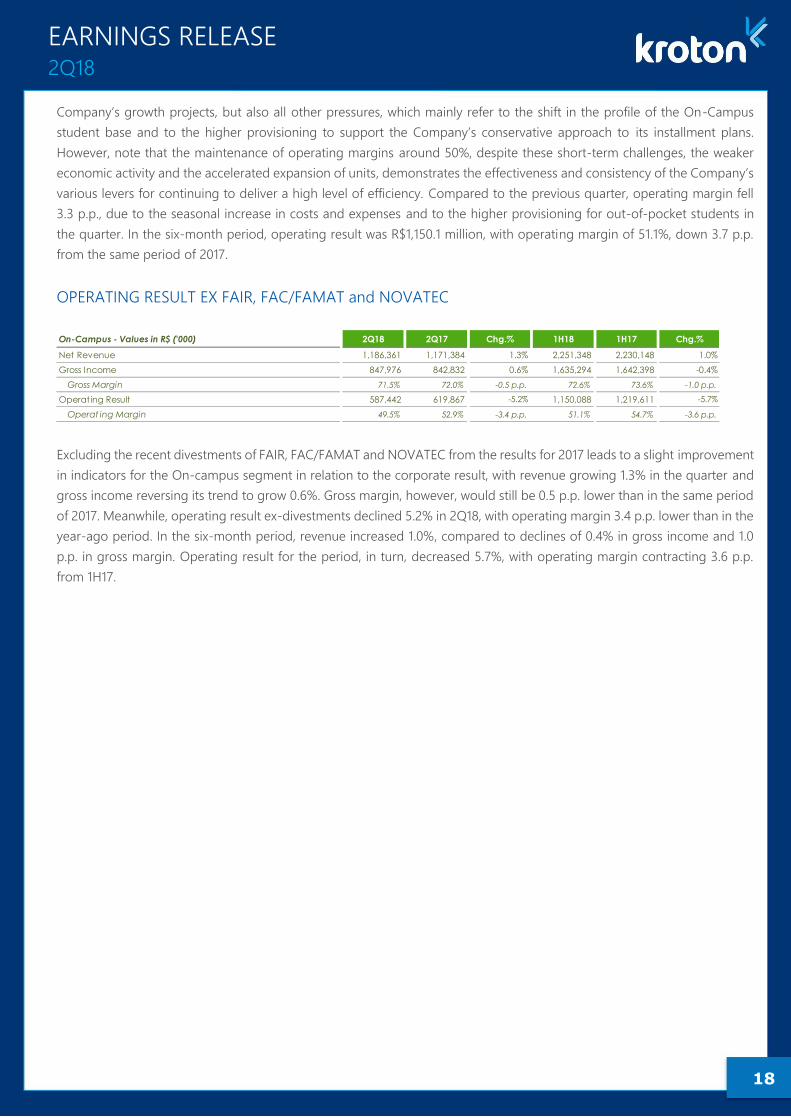
OPERATING RESULT EX FAIR, FAC/FAMAT and NOVATEC
Excluding the recent divestments of FAIR, FAC/FAMAT and NOVATEC from the results for 2017 leads to a slight improvement
in indicators for the On-campus segment in relation to the corporate result, with revenue growing 1.3% in the quarter and
gross income reversing its trend to grow 0.6%. Gross margin, however, would still be 0.5 p.p. lower than in the same period
of 2017. Meanwhile, operating result ex-divestments declined 5.2% in 2Q18, with operating margin 3.4 p.p. lower than in the
year-ago period. In the six-month period, revenue increased 1.0%, compared to declines of 0.4% in gross income and 1.0
p.p. in gross margin. Operating result for the period, in turn, decreased 5.7%, with operating margin contracting 3.6 p.p.
from 1H17.
On-Campus - Values in R$ ('000) 2Q18 2Q17 Chg.% 1H18 1H17 Chg.%
Net Revenue 1,186,361 1,171,384 1.3% 2,251,348 2,230,148 1.0%
Gross Income 847,976 842,832 0.6% 1,635,294 1,642,398 -0.4%
Gross Margin 71.5% 72.0% -0.5 p.p. 72.6% 73.6% -1.0 p.p.
Operating Result 587,442 619,867 -5.2% 1,150,088 1,219,611 -5.7%
Operat ing Margin 49.5% 52.9% -3.4 p.p. 51.1% 54.7% -3.6 p.p.
19
EARNINGS RELEASE 2Q18
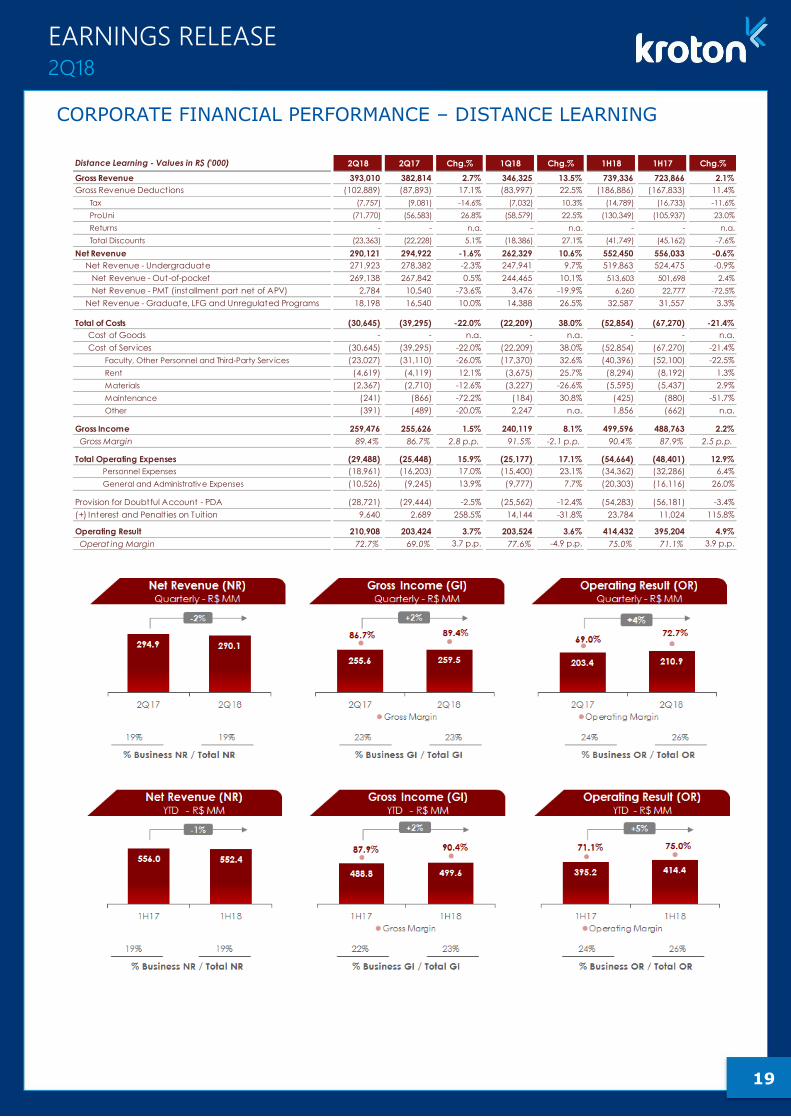
CORPORATE FINANCIAL PERFORMANCE – DISTANCE LEARNING
Distance Learning - Values in R$ ('000) 2Q18 2Q17 Chg.% 1Q18 Chg.% 1H18 1H17 Chg.%
Gross Revenue 393,010 382,814 2.7% 346,325 13.5% 739,336 723,866 2.1%
Gross Revenue Deductions (102,889) (87,893) 17.1% (83,997) 22.5% (186,886) (167,833) 11.4%
Tax (7,757) (9,081) -14.6% (7,032) 10.3% (14,789) (16,733) -11.6%
ProUni (71,770) (56,583) 26.8% (58,579) 22.5% (130,349) (105,937) 23.0%
Returns - - n.a. - n.a. - - n.a.
Total Discounts (23,363) (22,228) 5.1% (18,386) 27.1% (41,749) (45,162) -7.6%
Net Revenue 290,121 294,922 -1.6% 262,329 10.6% 552,450 556,033 -0.6%
Net Revenue - Undergraduate 271,923 278,382 -2.3% 247,941 9.7% 519,863 524,475 -0.9%
Net Revenue - Out-of-pocket 269,138 267,842 0.5% 244,465 10.1% 513,603 501,698 2.4%
Net Revenue - PMT (installment part net of APV) 2,784 10,540 -73.6% 3,476 -19.9% 6,260 22,777 -72.5%
Net Revenue - Graduate, LFG and Unregulated Programs 18,198 16,540 10.0% 14,388 26.5% 32,587 31,557 3.3%
Total of Costs (30,645) (39,295) -22.0% (22,209) 38.0% (52,854) (67,270) -21.4%
Cost of Goods - - n.a. - n.a. - - n.a.
Cost of Services (30,645) (39,295) -22.0% (22,209) 38.0% (52,854) (67,270) -21.4%
Faculty, Other Personnel and Third-Party Serv ices (23,027) (31,110) -26.0% (17,370) 32.6% (40,396) (52,100) -22.5%
Rent (4,619) (4,119) 12.1% (3,675) 25.7% (8,294) (8,192) 1.3%
Materials (2,367) (2,710) -12.6% (3,227) -26.6% (5,595) (5,437) 2.9%
Maintenance (241) (866) -72.2% (184) 30.8% (425) (880) -51.7%
Other (391) (489) -20.0% 2,247 n.a. 1,856 (662) n.a.
Gross Income 259,476 255,626 1.5% 240,119 8.1% 499,596 488,763 2.2%
Gross Margin 89.4% 86.7% 2.8 p.p. 91.5% -2.1 p.p. 90.4% 87.9% 2.5 p.p.
Total Operating Expenses (29,488) (25,448) 15.9% (25,177) 17.1% (54,664) (48,401) 12.9%
Personnel Expenses (18,961) (16,203) 17.0% (15,400) 23.1% (34,362) (32,286) 6.4%
General and Administrative Expenses (10,526) (9,245) 13.9% (9,777) 7.7% (20,303) (16,116) 26.0%
Provision for Doubtful Account - PDA (28,721) (29,444) -2.5% (25,562) -12.4% (54,283) (56,181) -3.4%
(+) Interest and Penalt ies on Tuit ion 9,640 2,689 258.5% 14,144 -31.8% 23,784 11,024 115.8%
Operating Result 210,908 203,424 3.7% 203,524 3.6% 414,432 395,204 4.9%
Operat ing Margin 72.7% 69.0% 3.7 p.p. 77.6% -4.9 p.p. 75.0% 71.1% 3.9 p.p.
20
EARNINGS RELEASE 2Q18
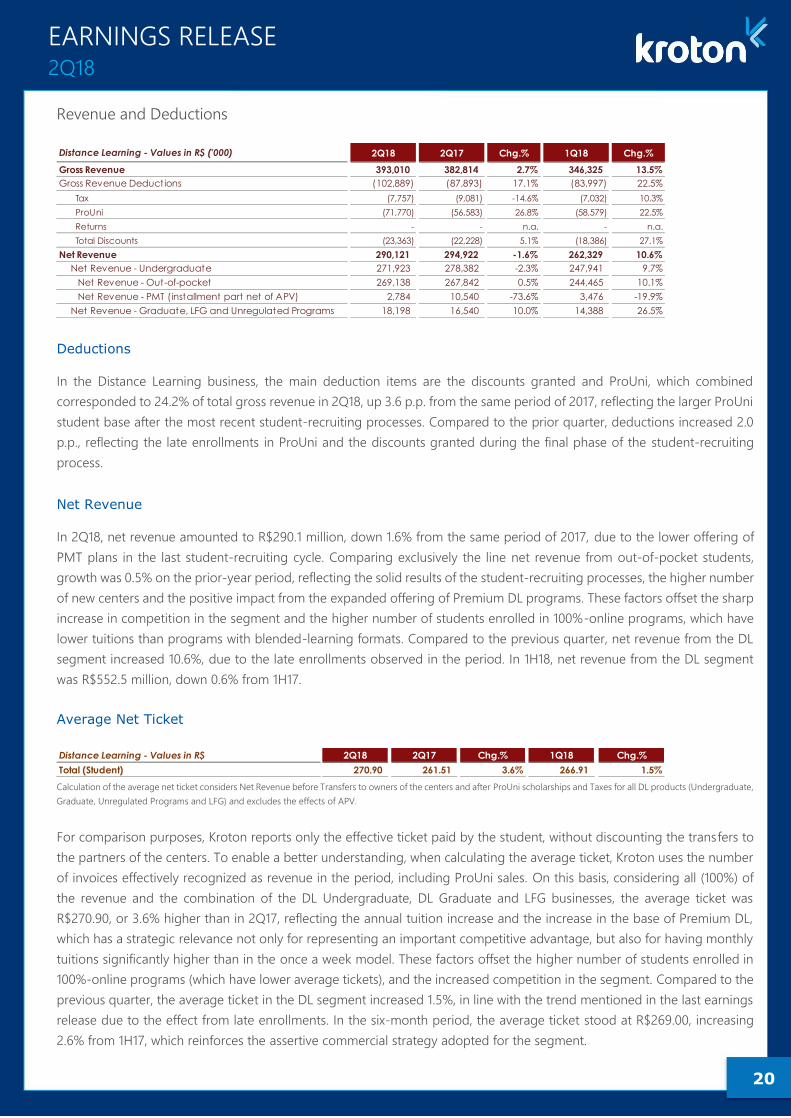
Revenue and Deductions
Deductions
In the Distance Learning business, the main deduction items are the discounts granted and ProUni, which combined
corresponded to 24.2% of total gross revenue in 2Q18, up 3.6 p.p. from the same period of 2017, reflecting the larger ProUni
student base after the most recent student-recruiting processes. Compared to the prior quarter, deductions increased 2.0
p.p., reflecting the late enrollments in ProUni and the discounts granted during the final phase of the student-recruiting
process.
Net Revenue
In 2Q18, net revenue amounted to R$290.1 million, down 1.6% from the same period of 2017, due to the lower offering of
PMT plans in the last student-recruiting cycle. Comparing exclusively the line net revenue from out-of-pocket students,
growth was 0.5% on the prior-year period, reflecting the solid results of the student-recruiting processes, the higher number
of new centers and the positive impact from the expanded offering of Premium DL programs. These factors offset the sharp
increase in competition in the segment and the higher number of students enrolled in 100%-online programs, which have
lower tuitions than programs with blended-learning formats. Compared to the previous quarter, net revenue from the DL
segment increased 10.6%, due to the late enrollments observed in the period. In 1H18, net revenue from the DL segment
was R$552.5 million, down 0.6% from 1H17.
Average Net Ticket
Calculation of the average net ticket considers Net Revenue before Transfers to owners of the centers and after ProUni scholarships and Taxes for all DL products (Undergraduate,
Graduate, Unregulated Programs and LFG) and excludes the effects of APV.
For comparison purposes, Kroton reports only the effective ticket paid by the student, without discounting the transfers to
the partners of the centers. To enable a better understanding, when calculating the average ticket, Kroton uses the number
of invoices effectively recognized as revenue in the period, including ProUni sales. On this basis, considering all (100%) of
the revenue and the combination of the DL Undergraduate, DL Graduate and LFG businesses, the average ticket was
R$270.90, or 3.6% higher than in 2Q17, reflecting the annual tuition increase and the increase in the base of Premium DL,
which has a strategic relevance not only for representing an important competitive advantage, but also for having monthly
tuitions significantly higher than in the once a week model. These factors offset the higher number of students enrolled in
100%-online programs (which have lower average tickets), and the increased competition in the segment. Compared to the
previous quarter, the average ticket in the DL segment increased 1.5%, in line with the trend mentioned in the last earnings
release due to the effect from late enrollments. In the six-month period, the average ticket stood at R$269.00, increasing
2.6% from 1H17, which reinforces the assertive commercial strategy adopted for the segment.
Distance Learning - Values in R$ ('000) 2Q18 2Q17 Chg.% 1Q18 Chg.%
Gross Revenue 393,010 382,814 2.7% 346,325 13.5%
Gross Revenue Deductions (102,889) (87,893) 17.1% (83,997) 22.5%
Tax (7,757) (9,081) -14.6% (7,032) 10.3%
ProUni (71,770) (56,583) 26.8% (58,579) 22.5%
Returns - - n.a. - n.a.
Total Discounts (23,363) (22,228) 5.1% (18,386) 27.1%
Net Revenue 290,121 294,922 -1.6% 262,329 10.6%
Net Revenue - Undergraduate 271,923 278,382 -2.3% 247,941 9.7%
Net Revenue - Out-of-pocket 269,138 267,842 0.5% 244,465 10.1%
Net Revenue - PMT (installment part net of APV) 2,784 10,540 -73.6% 3,476 -19.9%
Net Revenue - Graduate, LFG and Unregulated Programs 18,198 16,540 10.0% 14,388 26.5%
Distance Learning - Values in R$ 2Q18 2Q17 Chg.% 1Q18 Chg.%
Total (Student) 270.90 261.51 3.6% 266.91 1.5%

21
EARNINGS RELEASE 2Q18
Breakdown of Average Net Ticket of DL Undergraduate – Student by Product Perspective
Since the start of 2017, analyses of average ticket in the DL segment include additional information based on “student by
product perspective” for the Undergraduate business. This perspective considers the different sources of revenue for each
product separately, i.e., the DL average ticket is formed by the amounts of students paying 100% of tuition out of pocket
and those contracting the PMT plan. The combination of the Out-of-pocket and PMT average ticket is called the “DL
Undergraduate Out-Of-Pocket (ex-Prouni).” This analysis enables a better understanding of the dynamics of the average
ticket across the various types of students and of payment products offered by the Company.
¹ Revenue ex-Transfers; ² Revenue used to calculate average ticket; ³ Amounts /‘000; 4 Undergraduate Only (ex-graduate, unregulated programs, etc.)
The above analysis illustrates the impact of PMT on the performance of average ticket in the period. However, since the
offering of this product is still not that significant and was very residual this quarter, only a small difference is perceived in
the out-of-pocket average ticket ex-ProUni in relation to the consolidated figure shown in the previous table.
Furthermore, to exclude seasonality from the quarterly comparison, such as the effects from PMT and the different curve of
ProUni students, the following table presents an analysis of the DL average ticket by product in the semester:
¹ Revenue ex-Transfers; ² Revenue used to calculate average ticket; ³ Amounts /‘000; 4 Undergraduate Only (ex-graduate, unregulated programs, etc.)
Costs
Student Product Net Revenue 1 APV NR Ex-APV 2 Invoices 3 Net Ticket Net Revenue 1 APV NR Ex-APV 2 Invoices 3 Net TicketΔ Net
TicketΔ NR
Out-of-Pocket 425,166 - 425,166 1,445 294.2 424,757 - 424,757 1,502 282.9 4.0% 0.1%
PMT 4,389 (229) 4,159 12 347.5 13,380 (742) 12,639 39 320.5 - -
429,555 (229) 429,325 1,457 294.7 438,137 (742) 437,396 1,541 283.8 3.8% -1.8%
429,555 (229) 429,325 1,587 270.6 438,137 (742) 437,396 1,663 263.0 2.9% -1.8%
Chg.%
Distance
Learning
TOTAL DL UNDERGRAD. OUT-OF-POCKET⁴ Ex-ProUni
TOTAL DISTANCE LEARNING UNDERGRAD⁴
DISTANCE LEARNING UNDERGRADUATE 2Q18 2Q17
Student Product Net Revenue 1 APV NR Ex-APV 2 Invoices 3 Net Ticket Net Revenue 1 APV NR Ex-APV 2 Invoices 3 Net TicketΔ Net
TicketΔ NR
Out-of-Pocket 801,412 - 801,412 2,746 291.9 787,196 - 787,196 2,805 280.6 4.0% 1.8%
PMT 8,482 (1,163) 7,319 21 346.2 37,480 3,507 40,987 124 330.4 - -
809,895 (1,163) 808,731 2,767 292.3 824,676 3,507 828,183 2,929 282.8 3.4% -2.3%
809,895 (1,163) 808,731 3,005 269.2 824,676 3,507 828,183 3,143 263.5 2.2% -2.3%
Chg.%DISTANCE LEARNING UNDERGRADUATE 1H18 1H17
EAD
TOTAL DL UNDERGRAD. OUT-OF-POCKET⁴ Ex-ProUni
TOTAL DISTANCE LEARNING UNDERGRAD⁴
Distance Learning - Values in R$ ('000) 2Q18 2Q17 Chg.% 1Q18 Chg.%
Total of Costs (30,645) (39,295) -22.0% (22,209) 38.0%
Cost of Goods - - n.a. - n.a.
Cost of Services (30,645) (39,295) -22.0% (22,209) 38.0%
Faculty, Other Personnel and Third-Party Serv ices (23,027) (31,110) -26.0% (17,370) 32.6%
Rent (4,619) (4,119) 12.1% (3,675) 25.7%
Materials (2,367) (2,710) -12.6% (3,227) -26.6%
Maintenance (241) (866) -72.2% (184) 30.8%
Other (391) (489) -20.0% 2,247 n.a.
% of Net Revenues 2Q18 2Q17 Chg.% 1Q18 Chg.%
Total of Costs -10.6% -13.3% 2.8 p.p. -8.5% -2.1 p.p.
Cost of Goods (CG) 0.0% 0.0% 0.0 p.p. 0.0% 0.0 p.p.
Cost of Services (CS) -10.6% -13.3% 2.8 p.p. -8.5% -2.1 p.p.
Faculty, Other Personnel and Third-Party Serv ices -7.9% -10.5% 2.6 p.p. -6.6% -1.3 p.p.
Rent -1.6% -1.4% -0.2 p.p. -1.4% -0.2 p.p.
Materials -0.8% -0.9% 0.1 p.p. -1.2% 0.4 p.p.
Maintenance -0.1% -0.3% 0.2 p.p. -0.1% 0.0 p.p.
Other -0.1% -0.2% 0.0 p.p. 0.9% -1.0 p.p.
22
EARNINGS RELEASE 2Q18
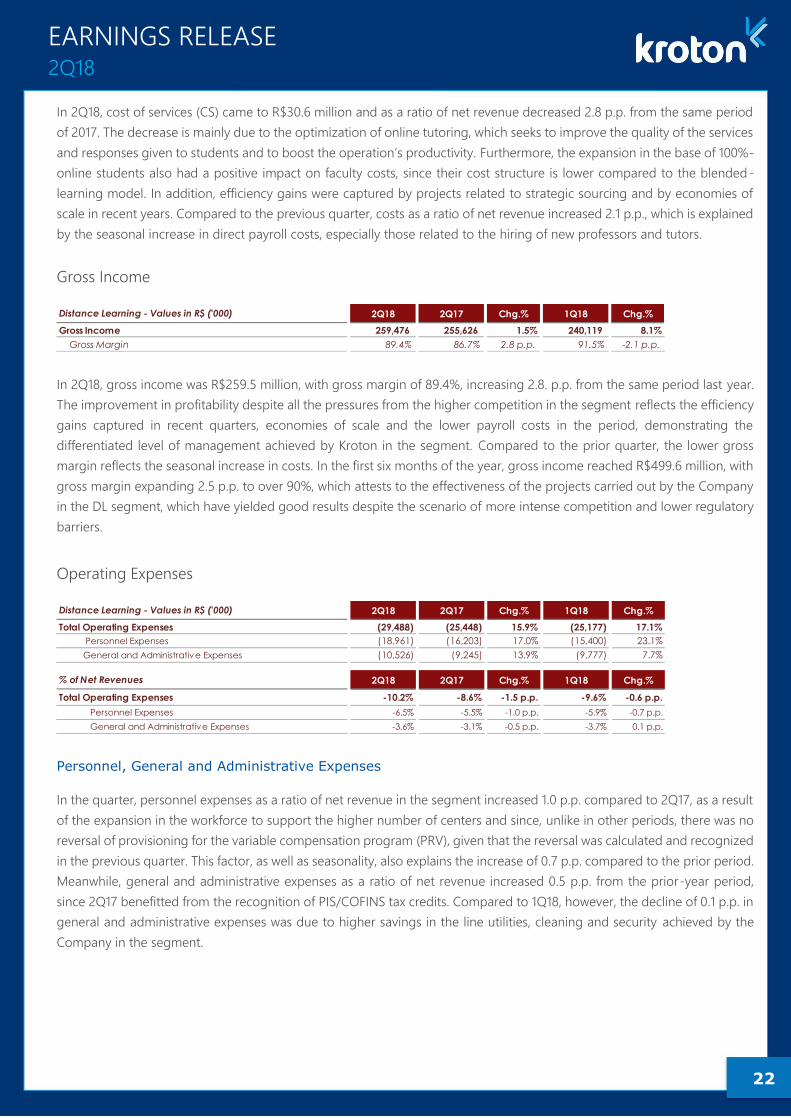
In 2Q18, cost of services (CS) came to R$30.6 million and as a ratio of net revenue decreased 2.8 p.p. from the same period
of 2017. The decrease is mainly due to the optimization of online tutoring, which seeks to improve the quality of the services
and responses given to students and to boost the operation’s productivity. Furthermore, the expansion in the base of 100%-
online students also had a positive impact on faculty costs, since their cost structure is lower compared to the blended-
learning model. In addition, efficiency gains were captured by projects related to strategic sourcing and by economies of
scale in recent years. Compared to the previous quarter, costs as a ratio of net revenue increased 2.1 p.p., which is explained
by the seasonal increase in direct payroll costs, especially those related to the hiring of new professors and tutors.
Gross Income
In 2Q18, gross income was R$259.5 million, with gross margin of 89.4%, increasing 2.8. p.p. from the same period last year.
The improvement in profitability despite all the pressures from the higher competition in the segment reflects the efficiency
gains captured in recent quarters, economies of scale and the lower payroll costs in the period, demonstrating the
differentiated level of management achieved by Kroton in the segment. Compared to the prior quarter, the lower gross
margin reflects the seasonal increase in costs. In the first six months of the year, gross income reached R$499.6 million, with
gross margin expanding 2.5 p.p. to over 90%, which attests to the effectiveness of the projects carried out by the Company
in the DL segment, which have yielded good results despite the scenario of more intense competition and lower regulatory
barriers.
Operating Expenses
Personnel, General and Administrative Expenses
In the quarter, personnel expenses as a ratio of net revenue in the segment increased 1.0 p.p. compared to 2Q17, as a result
of the expansion in the workforce to support the higher number of centers and since, unlike in other periods, there was no
reversal of provisioning for the variable compensation program (PRV), given that the reversal was calculated and recognized
in the previous quarter. This factor, as well as seasonality, also explains the increase of 0.7 p.p. compared to the prior period.
Meanwhile, general and administrative expenses as a ratio of net revenue increased 0.5 p.p. from the prior-year period,
since 2Q17 benefitted from the recognition of PIS/COFINS tax credits. Compared to 1Q18, however, the decline of 0.1 p.p. in
general and administrative expenses was due to higher savings in the line utilities, cleaning and security achieved by the
Company in the segment.
Distance Learning - Values in R$ ('000) 2Q18 2Q17 Chg.% 1Q18 Chg.%
Gross Income 259,476 255,626 1.5% 240,119 8.1%
Gross Margin 89.4% 86.7% 2.8 p.p. 91.5% -2.1 p.p.
Distance Learning - Values in R$ ('000) 2Q18 2Q17 Chg.% 1Q18 Chg.%
Total Operating Expenses (29,488) (25,448) 15.9% (25,177) 17.1%
Personnel Expenses (18,961) (16,203) 17.0% (15,400) 23.1%
General and Administrative Expenses (10,526) (9,245) 13.9% (9,777) 7.7%
% of Net Revenues 2Q18 2Q17 Chg.% 1Q18 Chg.%
Total Operating Expenses -10.2% -8.6% -1.5 p.p. -9.6% -0.6 p.p.
Personnel Expenses -6.5% -5.5% -1.0 p.p. -5.9% -0.7 p.p.
General and Administrative Expenses -3.6% -3.1% -0.5 p.p. -3.7% 0.1 p.p.

23
EARNINGS RELEASE 2Q18
Provision for Doubtful Accounts (PDA)
Provisioning in the DL business stood at 9.9% in 2Q18, down 0.1 p.p. from the same period last year, reflecting the lower
offering of PMT plans in the last student-recruiting cycle, for which, like PEP, the Company adopts the conservative
provisioning policy of accruing 50% of the tuition installments. This situation ended up offsetting the increase in out-of-
pocket PDA, given the expansion in the 100%-online student base, which has a higher dropout rate, and the still-challenging
economic environment. The same factors explain the increase of 0.2 p.p. in the level of provisioning compared to the prior
quarter.
Accounts Receivable
Net accounts receivable in the Distance Learning business amounted to R$292.4 million in 2Q18, increasing 4.1% from the
same period of 2017, reflecting the growth in the receivables-generating student base and the impact from the increase in
new enrollments of students in 100%-online programs, who are more likely to drop out, directly affecting the profile of the
delinquent student base and total agreements closed. Meanwhile, the 9.2% increase compared to the previous quarter was
driven by seasonality and the higher dropouts observed in the segment.
Average Accounts Receivable Term
In relation to the average Accounts Receivable term for the DL Postsecondary business, Kroton presents two distinct
analyses:
1. Out-of-pocket Accounts Receivable
Calculation base: net balance of short-term and long-term Accounts Receivable for out-of-pocket students in the DL business, divided by net revenue in the DL business in the
last 12 months, multiplied by 360 days.
The average receivables term of out-of-pocket DL students was 4 days higher than in the year-ago period, due to the same
factors cited above, i.e., the combination of a higher number of students from the latest admissions and re-enrollment
processes, especially in the 100%-online student base. The increase of 8 days compared to the prior quarter is due to the
seasonality of the operation, which is in line with that observed in the same period of 2017.
Distance Learning (DL) - Values in R$ ('000) 2Q18 2Q17 Chg.% 1Q18 Chg.%
Provision for Doubtful Account - PDA (28,721) (29,444) -2.5% (25,562) 12.4%
PDA / Distance Learning Net Revenues -9.9% -10.0% 0.1 p.p. -9.7% -0.2 p.p.
PDA Out-of-pocket (27,329) (24,174) 13.1% (23,824) 14.7%
PDA Out-of-pocket/ Out-of-pocket DL Net Revenues -9.5% -8.5% -1.0 p.p. -9.2% -0.3 p.p.
PCLD PMT - Installment Part (1,392) (5,270) -73.6% (1,738) -19.9%
PDA PMT/ PMT DL Net Revenues -50.0% -50.0% 0.0 p.p. -50.0% 0.0 p.p.
Distance Learning - Values in R$ ('000) net of APV and PDA 2Q18 2Q17 Chg.% 1Q18 Chg.%
Net Accounts Receiveble 292,425 280,987 4.1% 267,699 9.2%
Tuit ion and Agreements to Receive - Short term 285,016 268,044 6.3% 260,356 9.5%
PMT 7,409 12,943 -42.8% 7,343 0.9%
Distance Learning - Days 2Q18 2Q17 Chg.(Days) 1Q18 Chg.(Days)
Net Accounts Receivable (Out-of-Pocket)
Net Revenue (Out-of-Pocket)95 91 04 Days 87 08 Days

24
EARNINGS RELEASE 2Q18
2. PMT Accounts Receivable
Calculation base: net balance of short-term and long-term Accounts Receivable exclusively related to DL PMT, divided by net revenue of DL PMT tuitions in the last 12 months,
multiplied by 360 days.
The average receivables term of PMT in the DL segment was 472 days, remembering that students who opted for the
product in the last admissions cycle will repay the outstanding monthly tuitions only after they graduate from their program.
Furthermore, the low number of new enrollments with PMT plans in the last student-recruiting cycle had a direct effect on
revenue, which affected the ratio.
Operating Result
The operating result (before marketing expenses) of the DL segment in 2Q18 was R$210.9 million, with operating margin
expanding 3.7 p.p. from the same period of 2017. This margin expansion was achieved despite the scenario of more-intense
competition, highlighting the resilience of the Company and the efficiency of the operation, delivering rigorous cost control
while strongly expanding the number of centers. Compared to the prior quarter, the 4.9 p.p. decrease in operating margin
was influenced primarily by seasonality. in the six-month period, the operating result was R$414.4 million, with margin of
75.0%, up 3.9 p.p. from 1H17, which corroborates the commercial strategy adopted after the regulatory changes.
Distance Learning - Days 2Q18 2Q17 Chg.(Days) 1Q18 Chg.(Days)
Net Accounts Receivable (PMT)
Net Revenue (PMT)472 231 241 Days 242 230 Days
Distance Learning - Values in R$ ('000) 2Q18 2Q17 Chg.% 1Q18 Chg.%
Gross Income 259,476 255,626 1.5% 240,119 8.1%
(-) Total Operating Expenses (29,488) (25,448) 15.9% (25,177) 17.1%
(-) Provision for Doubtful Account - PDA (28,721) (29,444) -2.5% (25,562) 12.4%
(+) Interest and Penalt ies on Tuit ion 9,640 2,689 258.5% 14,144 -31.8%
Operating Result 210,908 203,424 3.7% 203,524 3.6%
Operat ing Margin 72.7% 69.0% 3.7 p.p. 77.6% -4.9 p.p.
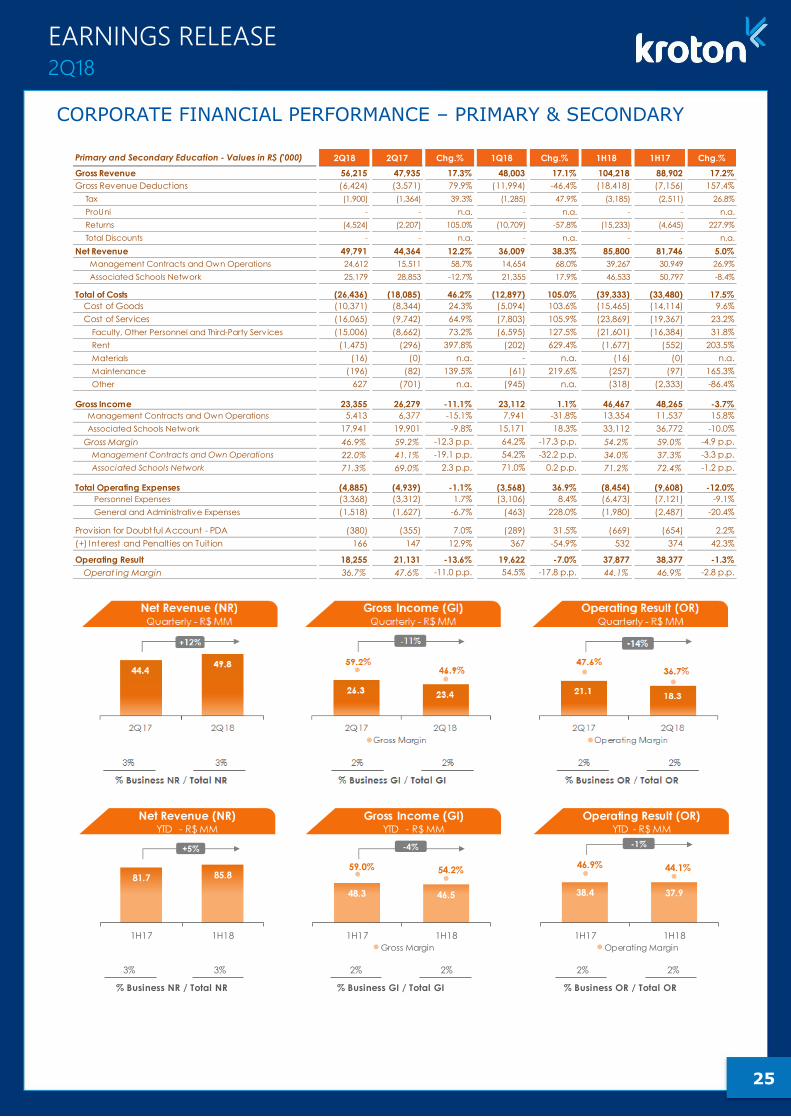
25
EARNINGS RELEASE 2Q18
CORPORATE FINANCIAL PERFORMANCE – PRIMARY & SECONDARY
Primary and Secondary Education - Values in R$ ('000) 2Q18 2Q17 Chg.% 1Q18 Chg.% 1H18 1H17 Chg.%
Gross Revenue 56,215 47,935 17.3% 48,003 17.1% 104,218 88,902 17.2%
Gross Revenue Deductions (6,424) (3,571) 79.9% (11,994) -46.4% (18,418) (7,156) 157.4%
Tax (1,900) (1,364) 39.3% (1,285) 47.9% (3,185) (2,511) 26.8%
ProUni - - n.a. - n.a. - - n.a.
Returns (4,524) (2,207) 105.0% (10,709) -57.8% (15,233) (4,645) 227.9%
Total Discounts - - n.a. - n.a. - - n.a.
Net Revenue 49,791 44,364 12.2% 36,009 38.3% 85,800 81,746 5.0%
Management Contracts and Own Operations 24,612 15,511 58.7% 14,654 68.0% 39,267 30,949 26.9%
Associated Schools Network 25,179 28,853 -12.7% 21,355 17.9% 46,533 50,797 -8.4%
Total of Costs (26,436) (18,085) 46.2% (12,897) 105.0% (39,333) (33,480) 17.5%
Cost of Goods (10,371) (8,344) 24.3% (5,094) 103.6% (15,465) (14,114) 9.6%
Cost of Services (16,065) (9,742) 64.9% (7,803) 105.9% (23,869) (19,367) 23.2%
Faculty, Other Personnel and Third-Party Serv ices (15,006) (8,662) 73.2% (6,595) 127.5% (21,601) (16,384) 31.8%
Rent (1,475) (296) 397.8% (202) 629.4% (1,677) (552) 203.5%
Materials (16) (0) n.a. - n.a. (16) (0) n.a.
Maintenance (196) (82) 139.5% (61) 219.6% (257) (97) 165.3%
Other 627 (701) n.a. (945) n.a. (318) (2,333) -86.4%
Gross Income 23,355 26,279 -11.1% 23,112 1.1% 46,467 48,265 -3.7%
Management Contracts and Own Operations 5,413 6,377 -15.1% 7,941 -31.8% 13,354 11,537 15.8%
Associated Schools Network 17,941 19,901 -9.8% 15,171 18.3% 33,112 36,772 -10.0%
Gross Margin 46.9% 59.2% -12.3 p.p. 64.2% -17.3 p.p. 54.2% 59.0% -4.9 p.p.
Management Contracts and Own Operations 22.0% 41.1% -19.1 p.p. 54.2% -32.2 p.p. 34.0% 37.3% -3.3 p.p.
Associated Schools Network 71.3% 69.0% 2.3 p.p. 71.0% 0.2 p.p. 71.2% 72.4% -1.2 p.p.
Total Operating Expenses (4,885) (4,939) -1.1% (3,568) 36.9% (8,454) (9,608) -12.0%
Personnel Expenses (3,368) (3,312) 1.7% (3,106) 8.4% (6,473) (7,121) -9.1%
General and Administrative Expenses (1,518) (1,627) -6.7% (463) 228.0% (1,980) (2,487) -20.4%
Provision for Doubtful Account - PDA (380) (355) 7.0% (289) 31.5% (669) (654) 2.2%
(+) Interest and Penalt ies on Tuit ion 166 147 12.9% 367 -54.9% 532 374 42.3%
Operating Result 18,255 21,131 -13.6% 19,622 -7.0% 37,877 38,377 -1.3%
Operat ing Margin 36.7% 47.6% -11.0 p.p. 54.5% -17.8 p.p. 44.1% 46.9% -2.8 p.p.
3% 3% 2% 2% 2% 2%
% Business NR / Total NR % Business GI / Total GI % Business OR / Total OR
Net Revenue (NR)YTD - R$ MM
Gross Income (GI)YTD - R$ MM
Operating Result (OR)YTD - R$ MM
81.7 85.8
1H17 1H18
+5%
48.3 46.5
59.0% 54.2%
1H17 1H18
Gross Margin
-4%
38.4 37.9
46.9% 44.1%
1H17 1H18
Operating Margin
-1%
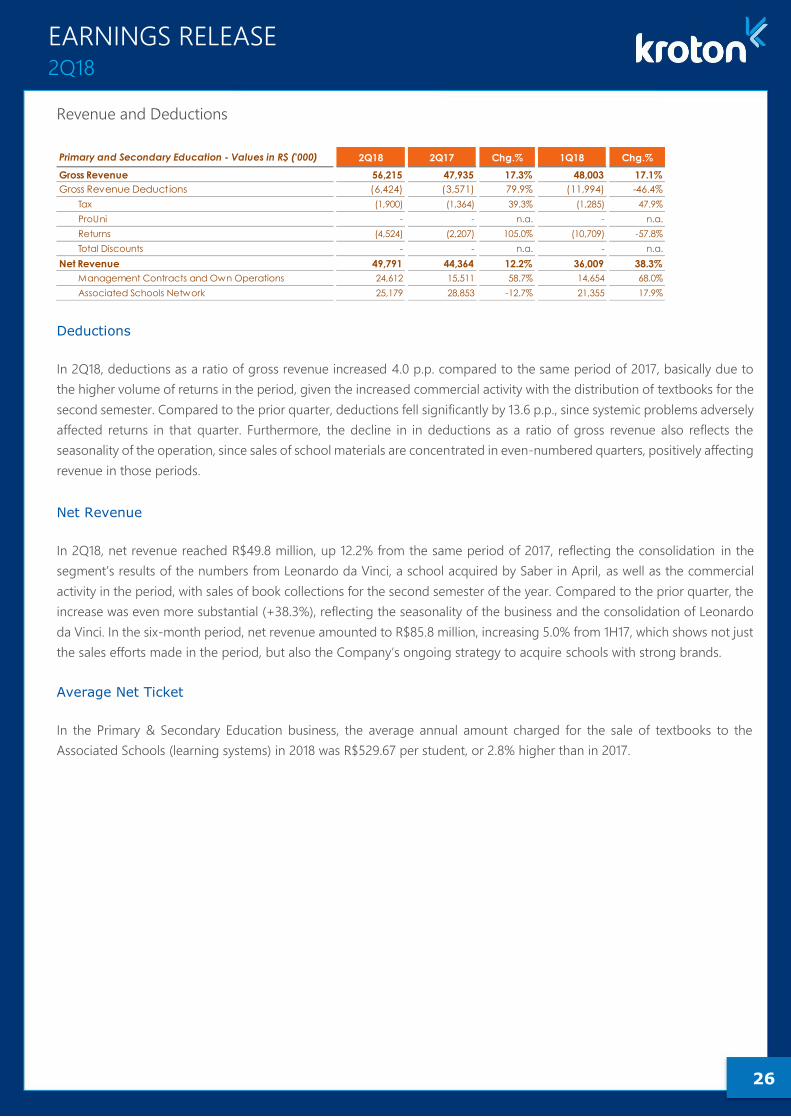
26
EARNINGS RELEASE 2Q18
Revenue and Deductions
Deductions
In 2Q18, deductions as a ratio of gross revenue increased 4.0 p.p. compared to the same period of 2017, basically due to
the higher volume of returns in the period, given the increased commercial activity with the distribution of textbooks for the
second semester. Compared to the prior quarter, deductions fell significantly by 13.6 p.p., since systemic problems adversely
affected returns in that quarter. Furthermore, the decline in in deductions as a ratio of gross revenue also reflects the
seasonality of the operation, since sales of school materials are concentrated in even-numbered quarters, positively affecting
revenue in those periods.
Net Revenue
In 2Q18, net revenue reached R$49.8 million, up 12.2% from the same period of 2017, reflecting the consolidation in the
segment’s results of the numbers from Leonardo da Vinci, a school acquired by Saber in April, as well as the commercial
activity in the period, with sales of book collections for the second semester of the year. Compared to the prior quarter, the
increase was even more substantial (+38.3%), reflecting the seasonality of the business and the consolidation of Leonardo
da Vinci. In the six-month period, net revenue amounted to R$85.8 million, increasing 5.0% from 1H17, which shows not just
the sales efforts made in the period, but also the Company’s ongoing strategy to acquire schools with strong brands.
Average Net Ticket
In the Primary & Secondary Education business, the average annual amount charged for the sale of textbooks to the
Associated Schools (learning systems) in 2018 was R$529.67 per student, or 2.8% higher than in 2017.
Primary and Secondary Education - Values in R$ ('000) 2Q18 2Q17 Chg.% 1Q18 Chg.%
Gross Revenue 56,215 47,935 17.3% 48,003 17.1%
Gross Revenue Deductions (6,424) (3,571) 79.9% (11,994) -46.4%
Tax (1,900) (1,364) 39.3% (1,285) 47.9%
ProUni - - n.a. - n.a.
Returns (4,524) (2,207) 105.0% (10,709) -57.8%
Total Discounts - - n.a. - n.a.
Net Revenue 49,791 44,364 12.2% 36,009 38.3%
Management Contracts and Own Operations 24,612 15,511 58.7% 14,654 68.0%
Associated Schools Network 25,179 28,853 -12.7% 21,355 17.9%

27
EARNINGS RELEASE 2Q18
Costs
In 2Q18, cost of goods sold as a ratio of net revenue in the business increased 2.0 p.p. compared to year-ago period,
reflecting the higher costs with logistics to distribute textbook collections for the upcoming semester. Compared to the
previous quarter, the indicator increased even more substantially, by 6.7 p.p., influenced by seasonality of the business. As
a ratio of net revenue, cost of services increased 10.3 p.p. from the prior year and 10.6 p.p. sequentially, explained by the
consolidation of the figures of Leonardo da Vinci into the Company’s results. In this respect, note that the school’s operation
has higher costs compared to Kroton’s other institutions, especially with regards to rent and faculty, since this is a 15,000-
sq.m. unit located in a premium district of Vitória, with some of the best teachers in the region.
Gross Income
Gross income amounted to R$23.4 million in 2Q18, down 11.1% from the same period last year, accompanied by gross
margin contraction of 12.3 p.p. The result reflects the consolidation of Leonardo da Vinci into the segment’s figures, since
the school has a higher cost structure compared to Kroton’s original activities. Considering separately the gross margin from
the associated schools network, the increase of 2.3 p.p. on the prior-year period attests to the Company’s ongoing efforts
to impose cost controls on its operations. The same reasons presented above explain the decline of 17.3 p.p. in gross margin
compared to the prior quarter, which even diverges from the seasonality of the business. In the six-month period, gross
income was R$46.5 million, with gross margin of 54.2%, down 4.9 p.p. from 1H17.
Primary and Secondary Education - Values in R$ ('000) 2Q18 2Q17 Chg.% 1Q18 Chg.%
Total of Costs (26,436) (18,085) 46.2% (12,897) 105.0%
Cost of Goods (CG) (10,371) (8,344) 24.3% (5,094) 103.6%
Cost of Services (CS) (16,065) (9,742) 64.9% (7,803) 105.9%
Faculty, Other Personnel and Third-Party Serv ices (15,006) (8,662) 73.2% (6,595) 127.5%
Rent (1,475) (296) 397.8% (202) 629.4%
Materials (16) (0) n.a. - n.a.
Maintenance (196) (82) 139.5% (61) 219.6%
Other 627 (701) n.a. (945) n.a.
% of Net Revenues 2Q18 2Q17 Chg.% 1Q18 Chg.%
Total of Costs -53.1% -40.8% -12.3 p.p. -35.8% -17.3 p.p.
Cost of Goods (CG) -20.8% -18.8% -2.0 p.p. -14.1% -6.7 p.p.
Cost of Services (CS) -32.3% -22.0% -10.3 p.p. -21.7% -10.6 p.p.
Faculty, Other Personnel and Third-Party Serv ices -30.1% -19.5% -10.6 p.p. -18.3% -11.8 p.p.
Rent -3.0% -0.7% -2.3 p.p. -0.6% -2.4 p.p.
Materials 0.0% 0.0% 0.0 p.p. 0.0% 0.0 p.p.
Maintenance -0.4% -0.2% -0.2 p.p. -0.2% -0.2 p.p.
Other 1.3% -1.6% 2.8 p.p. -2.6% 3.9 p.p.
Primary and Secondary Education - Values in R$ ('000) 2Q18 2Q17 Chg.% 1Q18 Chg.%
Gross Income 23,355 26,279 -11.1% 23,112 1.1%
Management Contracts and Own Operations 5,413 6,377 -15.1% 7,941 -31.8%
Associated Schools Network 17,941 19,901 -9.8% 15,171 18.3%
Gross Margin 46.9% 59.2% -12.3 p.p. 64.2% -17.3 p.p.
Management Contracts and Own Operations 22.0% 41.1% -19.1 p.p. 54.2% -32.2 p.p.
Associated Schools Network 71.3% 69.0% 2.3 p.p. 71.0% 0.2 p.p.
28
EARNINGS RELEASE 2Q18
Operating Expenses
Personnel, General and Administrative Expenses
Personnel, general and administrative expenses as a percentage of revenue decreased 1.3 p.p. from 2Q17, despite the
nominal increase with the integration of Leonardo da Vinci. The result is mainly explained by the higher revenue in the
period and by the better control of general and administrative expenses. Compared to 1Q18, operating expenses were
virtually stable, despite the seasonality of the business, which is explained by low level of general and administrative expenses
recorded in the previous quarter.
Provision for Doubtful Accounts (PDA)
This quarter, PDA stood at 0.8% of net revenue, stable compared to both the same period last year and the prior quarter,
attesting to the effective provisioning policies adopted for the Primary & Secondary Education segment.
Accounts Receivable
In 2Q18, Accounts Receivable was practically stable compared to 2Q17, which demonstrates the effectiveness of the
collection policy despite the highly challenging scenario and all the sales of textbook collections for the second semester.
Meanwhile, the decrease sequentially is explained by the fact that 1Q18 carried a portion of the average term of late 2017,
since the maturity conditions were maintained through March of this year.
Average Accounts Receivable Term
Calculation base: net balance of short-term Accounts Receivable in Primary & Secondary Education, divided by the net revenue in Primary & Secondary Education in the last 12
months, multiplied by 360 days.
As mentioned in the analysis of Accounts Receivable, the decrease of 5 days in the average accounts receivable term in the
Primary and Secondary Education business in 2Q18 compared to 2Q17 is associated with revenue growth in the period,
since Accounts Receivable was practically stable.
Primary and Secondary Education - Values in R$ ('000) 2Q18 2Q17 Chg.% 1Q18 Chg.%
Total Operating Expenses (4,885) (4,939) -1.1% (3,568) 36.9%
Personnel Expenses (3,368) (3,312) 1.7% (3,106) 8.4%
General and Administrative Expenses (1,518) (1,627) -6.7% (463) 228.0%
% of Net Revenues 2Q18 2Q17 Chg.% 1Q18 Chg.%
Total Operating Expenses -9.8% -11.1% 1.3 p.p. -9.9% 0.1 p.p.
Personnel Expenses -6.8% -7.5% 0.7 p.p. -8.6% 1.9 p.p.
General and Administrative Expenses -3.0% -3.7% 0.6 p.p. -1.3% -1.8 p.p.
Primary and Secondary Education - Values in R$ ('000) 2Q18 2Q17 Chg.% 1Q18 Chg.%
Provision for Doubtful Account - PDA (380) (355) 7.0% (289) 31.5%
PDA / Primary and Secondary Education Net Revenues -0.8% -0.8% 0.0 p.p. -0.8% 0.0 p.p.
Primary and Secondary Education 2Q18 2Q17 Chg.% 1Q18 Chg.%
Net Accounts Receivable 42,844 42,405 1.0% 69,065 -38.0%
Primary and Secondary Education - Days 2Q18 2Q17 Chg.% 1Q18 Chg.%
Net Accounts Receivable
Net Revenue 85 90 -05 Days 141 -56 Days
29
EARNINGS RELEASE 2Q18
Operating Result
In 2Q18, the operating result (before marketing expenses) was R$18.3 million, with margin of 36.7%, down 11.0 p.p. from the
year-ago period and 17.8 p.p. from 1Q18. As explained for the performance of gross income, this decline in profitability is
associated with the consolidation of the school Leonardo da Vinci, which has a higher cost and expense structure compared
to the learning system, which offset the positive revenue impact. However, bear in mind that this cost structure is fully related
to the teaching quality offered and, naturally, as Saber advances in its project to acquire strong brands, the segment's
margin should be lower than the Company’s historical margins. Another important factor is that the quality of the education
offered by these schools is critical for unleashing value through the opening of new units. In 1H18, operating income was
R$37.9 million, with operating margin contracting 2.8 p.p. from the same period of 2017.
Primary and Secondary Education - Values in R$ ('000) 2Q18 2Q17 Chg.% 1Q18 Chg.%
Gross Income 23,355 26,279 -11.1% 23,112 1.1%
(-) Total Operating Expenses (4,885) (4,939) -1.1% (3,568) 36.9%
(-) Provision for Doubtful Account - PDA (380) (355) 7.0% (289) 31.5%
(+) Interest and Penalt ies on Tuit ion 166 147 12.9% 367 -54.9%
Operating Result 18,255 21,131 -13.6% 19,622 -7.0%
Operat ing Margin 36.7% 47.6% -11.0 p.p. 54.5% -17.8 p.p.
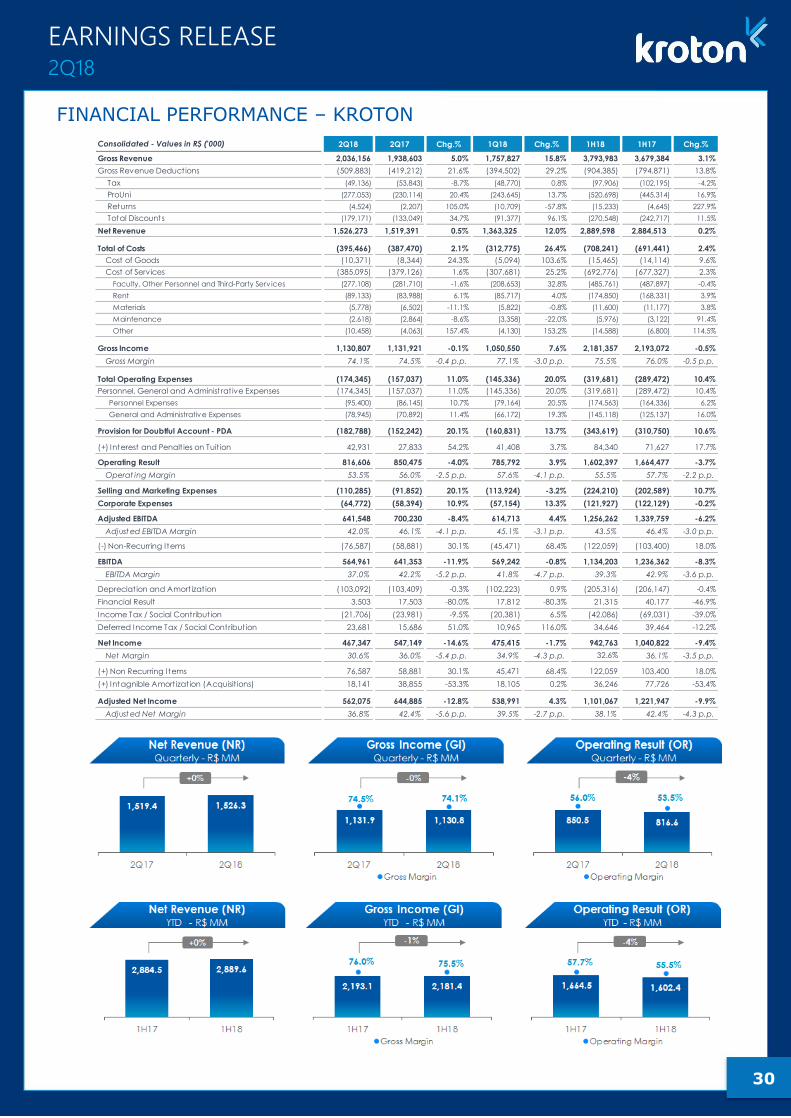
30
EARNINGS RELEASE 2Q18
FINANCIAL PERFORMANCE – KROTON
Consolidated - Values in R$ ('000) 2Q18 2Q17 Chg.% 1Q18 Chg.% 1H18 1H17 Chg.%
Gross Revenue 2,036,156 1,938,603 5.0% 1,757,827 15.8% 3,793,983 3,679,384 3.1%
Gross Revenue Deductions (509,883) (419,212) 21.6% (394,502) 29.2% (904,385) (794,871) 13.8%
Tax (49,136) (53,843) -8.7% (48,770) 0.8% (97,906) (102,195) -4.2%
ProUni (277,053) (230,114) 20.4% (243,645) 13.7% (520,698) (445,314) 16.9%
Returns (4,524) (2,207) 105.0% (10,709) -57.8% (15,233) (4,645) 227.9%
Total Discounts (179,171) (133,049) 34.7% (91,377) 96.1% (270,548) (242,717) 11.5%
Net Revenue 1,526,273 1,519,391 0.5% 1,363,325 12.0% 2,889,598 2,884,513 0.2%
Total of Costs (395,466) (387,470) 2.1% (312,775) 26.4% (708,241) (691,441) 2.4%
Cost of Goods (10,371) (8,344) 24.3% (5,094) 103.6% (15,465) (14,114) 9.6%
Cost of Services (385,095) (379,126) 1.6% (307,681) 25.2% (692,776) (677,327) 2.3%
Faculty, Other Personnel and Third-Party Serv ices (277,108) (281,710) -1.6% (208,653) 32.8% (485,761) (487,897) -0.4%
Rent (89,133) (83,988) 6.1% (85,717) 4.0% (174,850) (168,331) 3.9%
Materials (5,778) (6,502) -11.1% (5,822) -0.8% (11,600) (11,177) 3.8%
Maintenance (2,618) (2,864) -8.6% (3,358) -22.0% (5,976) (3,122) 91.4%
Other (10,458) (4,063) 157.4% (4,130) 153.2% (14,588) (6,800) 114.5%
Gross Income 1,130,807 1,131,921 -0.1% 1,050,550 7.6% 2,181,357 2,193,072 -0.5%
Gross Margin 74.1% 74.5% -0.4 p.p. 77.1% -3.0 p.p. 75.5% 76.0% -0.5 p.p.
Total Operating Expenses (174,345) (157,037) 11.0% (145,336) 20.0% (319,681) (289,472) 10.4%
Personnel, General and Administrat ive Expenses (174,345) (157,037) 11.0% (145,336) 20.0% (319,681) (289,472) 10.4%
Personnel Expenses (95,400) (86,145) 10.7% (79,164) 20.5% (174,563) (164,336) 6.2%
General and Administrative Expenses (78,945) (70,892) 11.4% (66,172) 19.3% (145,118) (125,137) 16.0%
Provision for Doubtful Account - PDA (182,788) (152,242) 20.1% (160,831) 13.7% (343,619) (310,750) 10.6%
(+) Interest and Penalt ies on Tuit ion 42,931 27,833 54.2% 41,408 3.7% 84,340 71,627 17.7%
Operating Result 816,606 850,475 -4.0% 785,792 3.9% 1,602,397 1,664,477 -3.7%
Operat ing Margin 53.5% 56.0% -2.5 p.p. 57.6% -4.1 p.p. 55.5% 57.7% -2.2 p.p.
Selling and Marketing Expenses (110,285) (91,852) 20.1% (113,924) -3.2% (224,210) (202,589) 10.7%
Corporate Expenses (64,772) (58,394) 10.9% (57,154) 13.3% (121,927) (122,129) -0.2%
Adjusted EBITDA 641,548 700,230 -8.4% 614,713 4.4% 1,256,262 1,339,759 -6.2%
Adjust ed EBITDA Margin 42.0% 46.1% -4.1 p.p. 45.1% -3.1 p.p. 43.5% 46.4% -3.0 p.p.
(-) Non-Recurring Items (76,587) (58,881) 30.1% (45,471) 68.4% (122,059) (103,400) 18.0%
EBITDA 564,961 641,353 -11.9% 569,242 -0.8% 1,134,203 1,236,362 -8.3%
EBITDA Margin 37.0% 42.2% -5.2 p.p. 41.8% -4.7 p.p. 39.3% 42.9% -3.6 p.p.
Depreciat ion and Amort izat ion (103,092) (103,409) -0.3% (102,223) 0.9% (205,316) (206,147) -0.4%
Financial Result 3,503 17,503 -80.0% 17,812 -80.3% 21,315 40,177 -46.9%
Income Tax / Social Contribut ion (21,706) (23,981) -9.5% (20,381) 6.5% (42,086) (69,031) -39.0%
Deferred Income Tax / Social Contribut ion 23,681 15,686 51.0% 10,965 116.0% 34,646 39,464 -12.2%
Net Income 467,347 547,149 -14.6% 475,415 -1.7% 942,763 1,040,822 -9.4%
Net Margin 30.6% 36.0% -5.4 p.p. 34.9% -4.3 p.p. 32.6% 36.1% -3.5 p.p.
(+) Non Recurring Items 76,587 58,881 30.1% 45,471 68.4% 122,059 103,400 18.0%
(+) Intagnible Amort izat ion (Acquisit ions) 18,141 38,855 -53.3% 18,105 0.2% 36,246 77,726 -53.4%
Adjusted Net Income 562,075 644,885 -12.8% 538,991 4.3% 1,101,067 1,221,947 -9.9%
Adjust ed Net Margin 36.8% 42.4% -5.6 p.p. 39.5% -2.7 p.p. 38.1% 42.4% -4.3 p.p.

31
EARNINGS RELEASE 2Q18
Selling and Marketing Expenses
Selling and marketing expenses as a ratio of net revenue increased by only 0.3 p.p. when compared to the same period of
2017, which reflects the more competitive scenario in the DL segment and the brand’s promotion in new regions for both
new on-campus units and new DL centers. Compared to the previous quarter, the 2.1 p.p. decline reflects seasonality, given
that the student-recruiting process at the start of the year is the most relevant.
Corporate Expenses
The ratio of personnel expenses to net revenue within corporate expenses fell 0.7 p.p. from the year-ago period, due to the
positive results of the initiatives to control expenses, even though 2Q17 benefitted from the reversal of amounts related to
the variable compensation program (PRV). Compared to the prior quarter, the decline was even sharper, of 0.9 p.p.,
reflecting the initiatives to streamline the corporate workforce, with the elimination and change in scope of positions in
certain areas. A separate analysis of general and administrative expenses as a ratio of net revenue shows that the line was
virtually stable both year on year and sequentially, reflecting the one-off increase in expenses with consulting services.
Nonrecurring Events
Non-recurring items in 2Q18 amounted to R$76.6 million, with a highlight to the line M&A and Expansion, which includes
expenses related to expansion projects, which have accelerated in recent months, in addition to the acquisitions of a
postsecondary education unit in Bacabal and Leonardo da Vinci in the primary and secondary education segment, besides
the prospecting of various other assets being analyzed in both segments. The Company also has been implementing a
series of projects related to digital transformation and working plans in its various operational segments that affected the
line other projects. Furthermore, the Company recorded fixed asset write-offs in the quarter that had a negative impact of
R$5.2 million on this line. In addition to the aforementioned items, total non-recurring items include: (i) severance charges,
Consolidated - Values in R$ ('000) 2Q18 2Q17 Chg.% 1Q18 Chg.%
Selling and Marketing Expenses (110,285) (91,852) 20.1% (113,924) -3.2%
% of Net Revenue 2Q18 2Q17 Chg.% 1Q18 Chg.%
Selling and Marketing Expenses -6.0% -5.7% -0.3 p.p. -8.1% 2.1 p.p.
Consolidated - Values in R$ ('000) 2Q18 2Q17 Chg.% 1Q18 Chg.%
Corporate Expenses (64,772) (58,394) 10.9% (57,154) 13.3%
Personnel Expenses (49,216) (45,096) 9.1% (48,739) 1.0%
General and Administrative Expenses (15,556) (13,298) 17.0% (8,416) 84.8%
% of Net Revenue 2Q18 2Q17 Chg.% 1Q18 Chg.%
Corporate Expenses -3.8% -4.5% 0.7 p.p. -4.7% 0.8 p.p.
Personnel Expenses -3.0% -3.7% 0.7 p.p. -3.9% 0.9 p.p.
General and Administrative Expenses -0.9% -0.8% -0.1 p.p. -0.8% -0.1 p.p.
Values in R$ ('000) 2Q18 2Q17 Chg.% 1Q18 Chg.%
Severance (13,104) (10,904) 20.2% (11,245) 16.5%
Restructuring of units (7,895) (9,312) -15.2% (9,418) -16.2%
M&A and expansion (38,252) (31,723) 20.6% (15,975) 139.5%
Other projects (17,336) (6,942) 149.7% (8,833) 96.3%
Total Nonrecurring (76,587) (58,881) 30.1% (45,471) 68.4%
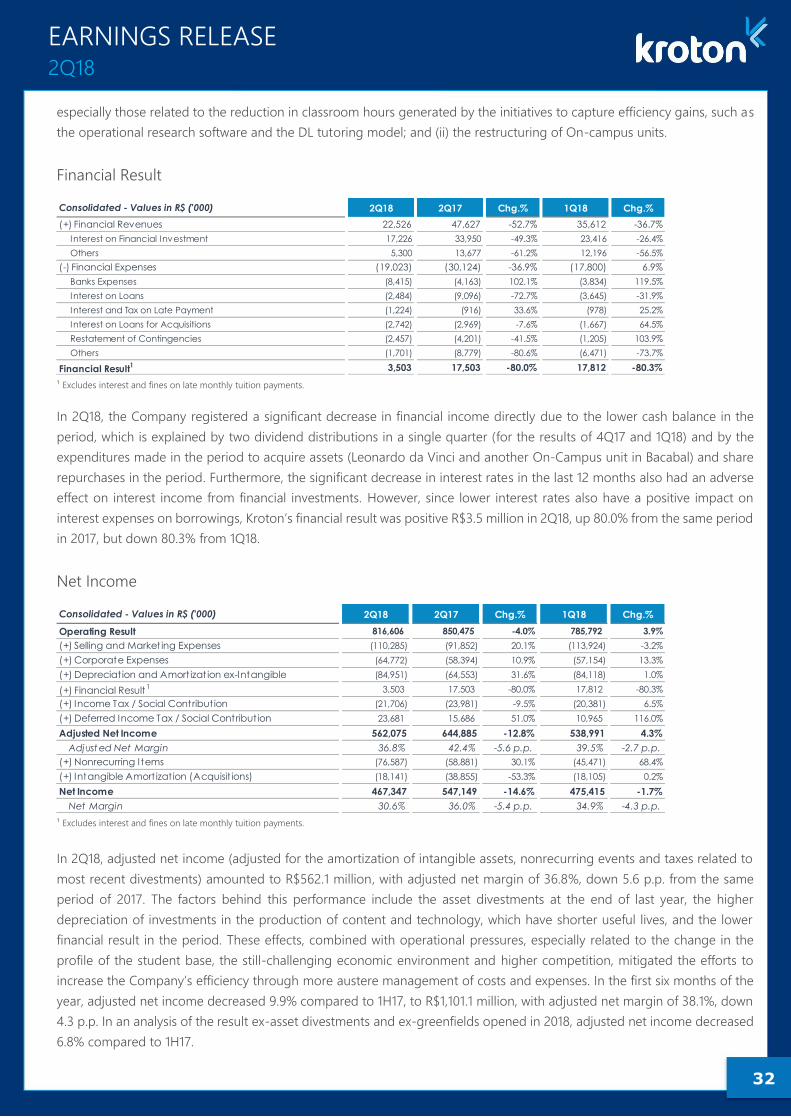
32
EARNINGS RELEASE 2Q18
especially those related to the reduction in classroom hours generated by the initiatives to capture efficiency gains, such as
the operational research software and the DL tutoring model; and (ii) the restructuring of On-campus units.
Financial Result
¹ Excludes interest and fines on late monthly tuition payments.
In 2Q18, the Company registered a significant decrease in financial income directly due to the lower cash balance in the
period, which is explained by two dividend distributions in a single quarter (for the results of 4Q17 and 1Q18) and by the
expenditures made in the period to acquire assets (Leonardo da Vinci and another On-Campus unit in Bacabal) and share
repurchases in the period. Furthermore, the significant decrease in interest rates in the last 12 months also had an adverse
effect on interest income from financial investments. However, since lower interest rates also have a positive impact on
interest expenses on borrowings, Kroton’s financial result was positive R$3.5 million in 2Q18, up 80.0% from the same period
in 2017, but down 80.3% from 1Q18.
Net Income
¹ Excludes interest and fines on late monthly tuition payments.
In 2Q18, adjusted net income (adjusted for the amortization of intangible assets, nonrecurring events and taxes related to
most recent divestments) amounted to R$562.1 million, with adjusted net margin of 36.8%, down 5.6 p.p. from the same
period of 2017. The factors behind this performance include the asset divestments at the end of last year, the higher
depreciation of investments in the production of content and technology, which have shorter useful lives, and the lower
financial result in the period. These effects, combined with operational pressures, especially related to the change in the
profile of the student base, the still-challenging economic environment and higher competition, mitigated the efforts to
increase the Company’s efficiency through more austere management of costs and expenses. In the first six months of the
year, adjusted net income decreased 9.9% compared to 1H17, to R$1,101.1 million, with adjusted net margin of 38.1%, down
4.3 p.p. In an analysis of the result ex-asset divestments and ex-greenfields opened in 2018, adjusted net income decreased
6.8% compared to 1H17.
Consolidated - Values in R$ ('000) 2Q18 2Q17 Chg.% 1Q18 Chg.%
(+) Financial Revenues 22,526 47,627 -52.7% 35,612 -36.7%
Interest on Financial Investment 17,226 33,950 -49.3% 23,416 -26.4%
Others 5,300 13,677 -61.2% 12,196 -56.5%
(-) Financial Expenses (19,023) (30,124) -36.9% (17,800) 6.9%
Banks Expenses (8,415) (4,163) 102.1% (3,834) 119.5%
Interest on Loans (2,484) (9,096) -72.7% (3,645) -31.9%
Interest and Tax on Late Payment (1,224) (916) 33.6% (978) 25.2%
Interest on Loans for Acquisitions (2,742) (2,969) -7.6% (1,667) 64.5%
Restatement of Contingencies (2,457) (4,201) -41.5% (1,205) 103.9%
Others (1,701) (8,779) -80.6% (6,471) -73.7%
Financial Result1 3,503 17,503 -80.0% 17,812 -80.3%
Consolidated - Values in R$ ('000) 2Q18 2Q17 Chg.% 1Q18 Chg.%
Operating Result 816,606 850,475 -4.0% 785,792 3.9%
(+) Selling and Marketing Expenses (110,285) (91,852) 20.1% (113,924) -3.2%
(+) Corporate Expenses (64,772) (58,394) 10.9% (57,154) 13.3%
(+) Depreciat ion and Amort izat ion ex-Intangible (84,951) (64,553) 31.6% (84,118) 1.0%
(+) Financial Result1 3,503 17,503 -80.0% 17,812 -80.3%
(+) Income Tax / Social Contribut ion (21,706) (23,981) -9.5% (20,381) 6.5%
(+) Deferred Income Tax / Social Contribut ion 23,681 15,686 51.0% 10,965 116.0%
Adjusted Net Income 562,075 644,885 -12.8% 538,991 4.3%
Adjust ed Net Margin 36.8% 42.4% -5.6 p.p. 39.5% -2.7 p.p.
(+) Nonrecurring Items (76,587) (58,881) 30.1% (45,471) 68.4%
(+) Intangible Amort izat ion (Acquisit ions) (18,141) (38,855) -53.3% (18,105) 0.2%
Net Income 467,347 547,149 -14.6% 475,415 -1.7%
Net Margin 30.6% 36.0% -5.4 p.p. 34.9% -4.3 p.p.

33
EARNINGS RELEASE 2Q18
CORPORATE:
EX ASSET DIVESTMENTS & GREENFIELD PROJECTS:
Excluding the adjustments for nonrecurring items, amortization of intangible assets and taxes on the latest divestments, net
income amounted to R$467.3 million in 2Q18 and to R$942.8 million in 1H18. Given the significant impact from these
adjustments, the Company recommends the pro-forma and adjusted result as the best metric for accompanying financial
performance.
EBITDA
¹ Excludes interest and fines on late monthly tuition payments.
Adjusted EBITDA was R$641.5 million in the quarter, down 8.4% from 2Q17, with adjusted EBITDA margin contraction of 4.1
p.p. As already discussed last quarter, the lower profitability this year reflects the pressures from the shift in the profile of
the student base, with higher provisioning to support the installment plans, the still-challenging economic scenario and the
higher costs and expenses related to the new units. The latter factor, however, is of a temporary nature, since as the units
mature, they will contribute to sustaining the high levels of performance achieved by Kroton. Note also that, despite all
these negative impacts on the result, the Company has been able to maintain high margins, especially compared to the rest
Consolidated - Values in R$ ('000) 2Q18 2Q17 Chg.% 1Q18 Chg.%
Net Income (Loss) 467,347 547,149 -14.6% 475,416 -1.7%
(+) Depreciat ion and Amort izat ion 103,092 103,409 -0.3% 102,223 0.9%
(+) Financial Result1 (3,503) (17,503) -80.0% (17,812) -80.3%
(+) Income Tax / Social Contribution 21,706 23,981 -9.5% 20,381 6.5%
(+) Deferred Income Tax / Social Contribution (23,681) (15,686) 51.0% (10,965) 116.0%
EBITDA 564,961 641,349 -11.9% 569,242 -0.8%
EBITDA Margin 37.0% 42.2% -5.2 p.p. 41.8% -4.7 p.p.
(+) Nonrecurring Items 76,587 58,881 n.a. 45,471 68.4%
Adjusted EBITDA 641,548 700,230 -8.4% 614,713 4.4%
Adjust ed EBITDA Margin 42.0% 46.1% -4.1 p.p. 45.1% -3.1 p.p.
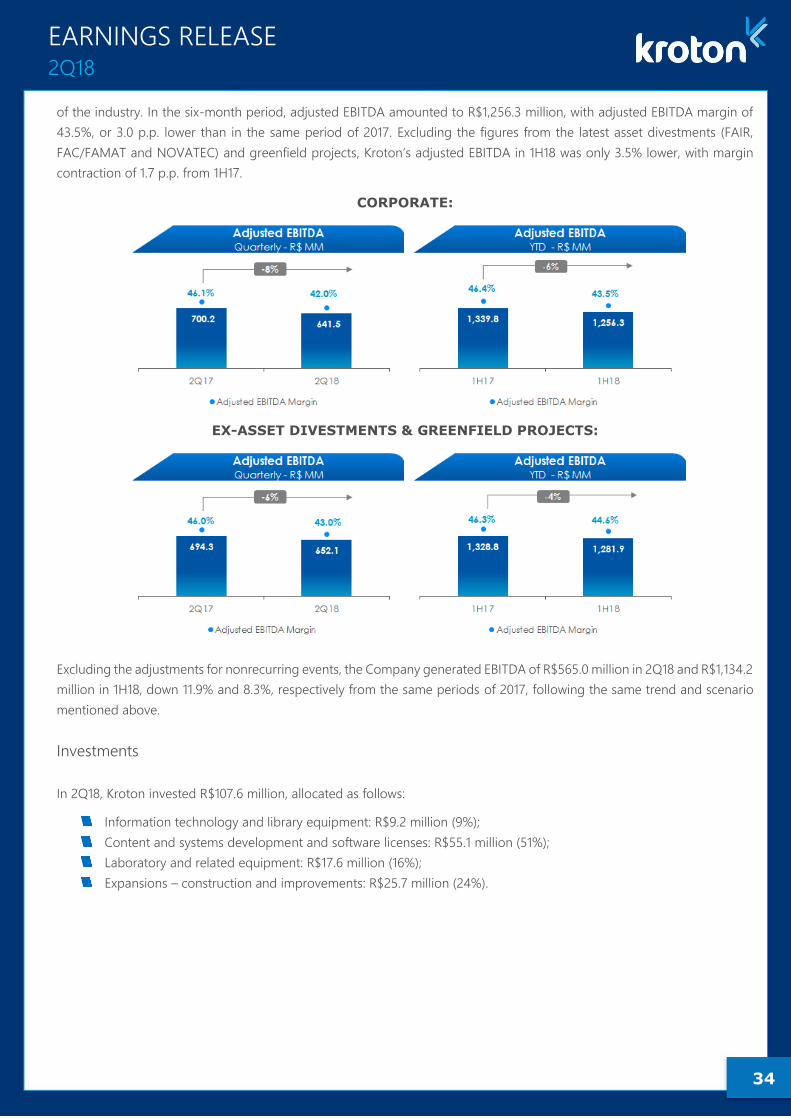
34
EARNINGS RELEASE 2Q18
of the industry. In the six-month period, adjusted EBITDA amounted to R$1,256.3 million, with adjusted EBITDA margin of
43.5%, or 3.0 p.p. lower than in the same period of 2017. Excluding the figures from the latest asset divestments (FAIR,
FAC/FAMAT and NOVATEC) and greenfield projects, Kroton’s adjusted EBITDA in 1H18 was only 3.5% lower, with margin
contraction of 1.7 p.p. from 1H17.
CORPORATE:
EX-ASSET DIVESTMENTS & GREENFIELD PROJECTS:
Excluding the adjustments for nonrecurring events, the Company generated EBITDA of R$565.0 million in 2Q18 and R$1,134.2
million in 1H18, down 11.9% and 8.3%, respectively from the same periods of 2017, following the same trend and scenario
mentioned above.
Investments
In 2Q18, Kroton invested R$107.6 million, allocated as follows:
Information technology and library equipment: R$9.2 million (9%);
Content and systems development and software licenses: R$55.1 million (51%);
Laboratory and related equipment: R$17.6 million (16%);
Expansions – construction and improvements: R$25.7 million (24%).
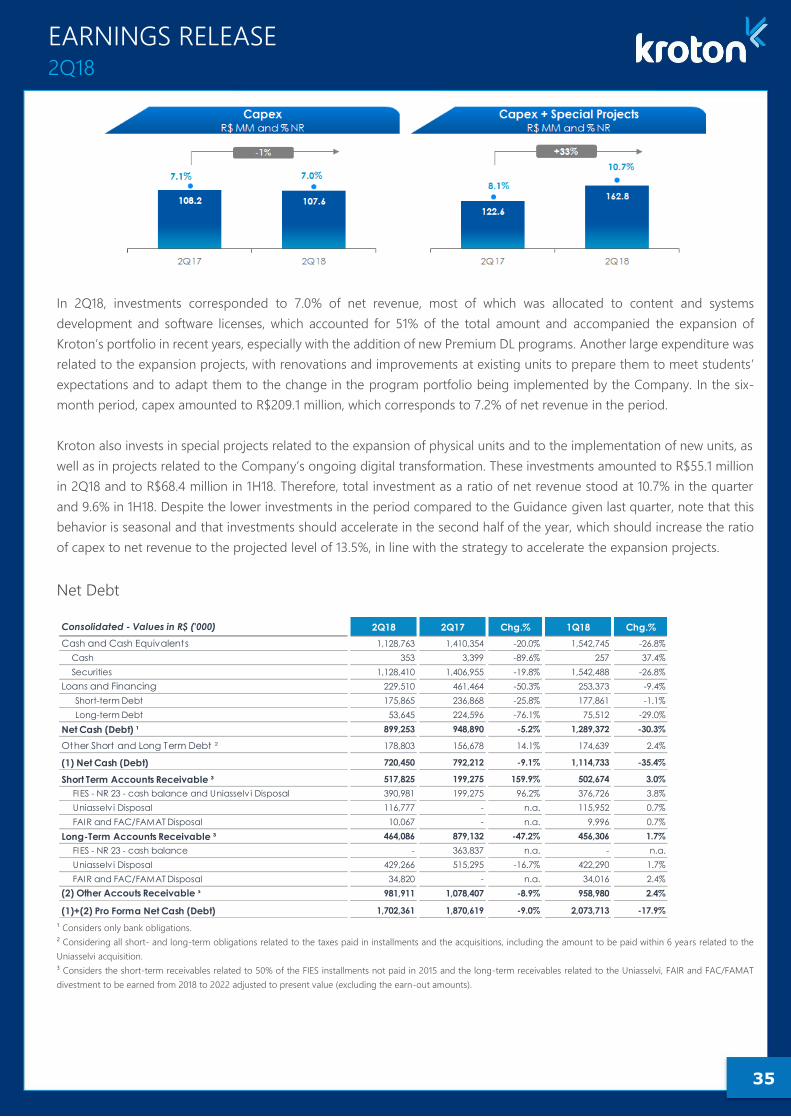
35
EARNINGS RELEASE 2Q18
In 2Q18, investments corresponded to 7.0% of net revenue, most of which was allocated to content and systems
development and software licenses, which accounted for 51% of the total amount and accompanied the expansion of
Kroton’s portfolio in recent years, especially with the addition of new Premium DL programs. Another large expenditure was
related to the expansion projects, with renovations and improvements at existing units to prepare them to meet students’
expectations and to adapt them to the change in the program portfolio being implemented by the Company. In the six-
month period, capex amounted to R$209.1 million, which corresponds to 7.2% of net revenue in the period.
Kroton also invests in special projects related to the expansion of physical units and to the implementation of new units, as
well as in projects related to the Company’s ongoing digital transformation. These investments amounted to R$55.1 million
in 2Q18 and to R$68.4 million in 1H18. Therefore, total investment as a ratio of net revenue stood at 10.7% in the quarter
and 9.6% in 1H18. Despite the lower investments in the period compared to the Guidance given last quarter, note that this
behavior is seasonal and that investments should accelerate in the second half of the year, which should increase the ratio
of capex to net revenue to the projected level of 13.5%, in line with the strategy to accelerate the expansion projects.
Net Debt
¹ Considers only bank obligations.
² Considering all short- and long-term obligations related to the taxes paid in installments and the acquisitions, including the amount to be paid within 6 years related to the
Uniasselvi acquisition.
³ Considers the short-term receivables related to 50% of the FIES installments not paid in 2015 and the long-term receivables related to the Uniasselvi, FAIR and FAC/FAMAT
divestment to be earned from 2018 to 2022 adjusted to present value (excluding the earn-out amounts).
Consolidated - Values in R$ ('000) 2Q18 2Q17 Chg.% 1Q18 Chg.%
Cash and Cash Equivalents 1,128,763 1,410,354 -20.0% 1,542,745 -26.8%
Cash 353 3,399 -89.6% 257 37.4%
Securities 1,128,410 1,406,955 -19.8% 1,542,488 -26.8%
Loans and Financing 229,510 461,464 -50.3% 253,373 -9.4%
Short-term Debt 175,865 236,868 -25.8% 177,861 -1.1%
Long-term Debt 53,645 224,596 -76.1% 75,512 -29.0%
Net Cash (Debt) ¹ 899,253 948,890 -5.2% 1,289,372 -30.3%
Other Short and Long Term Debt ² 178,803 156,678 14.1% 174,639 2.4%
(1) Net Cash (Debt) 720,450 792,212 -9.1% 1,114,733 -35.4%
Short Term Accounts Receivable ³ 517,825 199,275 159.9% 502,674 3.0%
FIES - NR 23 - cash balance and Uniasselv i Disposal 390,981 199,275 96.2% 376,726 3.8%
Uniasselv i Disposal 116,777 - n.a. 115,952 0.7%
FAIR and FAC/FAMAT Disposal 10,067 - n.a. 9,996 0.7%
Long-Term Accounts Receivable ³ 464,086 879,132 -47.2% 456,306 1.7%
FIES - NR 23 - cash balance - 363,837 n.a. - n.a.
Uniasselv i Disposal 429,266 515,295 -16.7% 422,290 1.7%
FAIR and FAC/FAMAT Disposal 34,820 - n.a. 34,016 2.4%
(2) Other Accouts Receivable ᶟ 981,911 1,078,407 -8.9% 958,980 2.4%
(1)+(2) Pro Forma Net Cash (Debt) 1,702,361 1,870,619 -9.0% 2,073,713 -17.9%
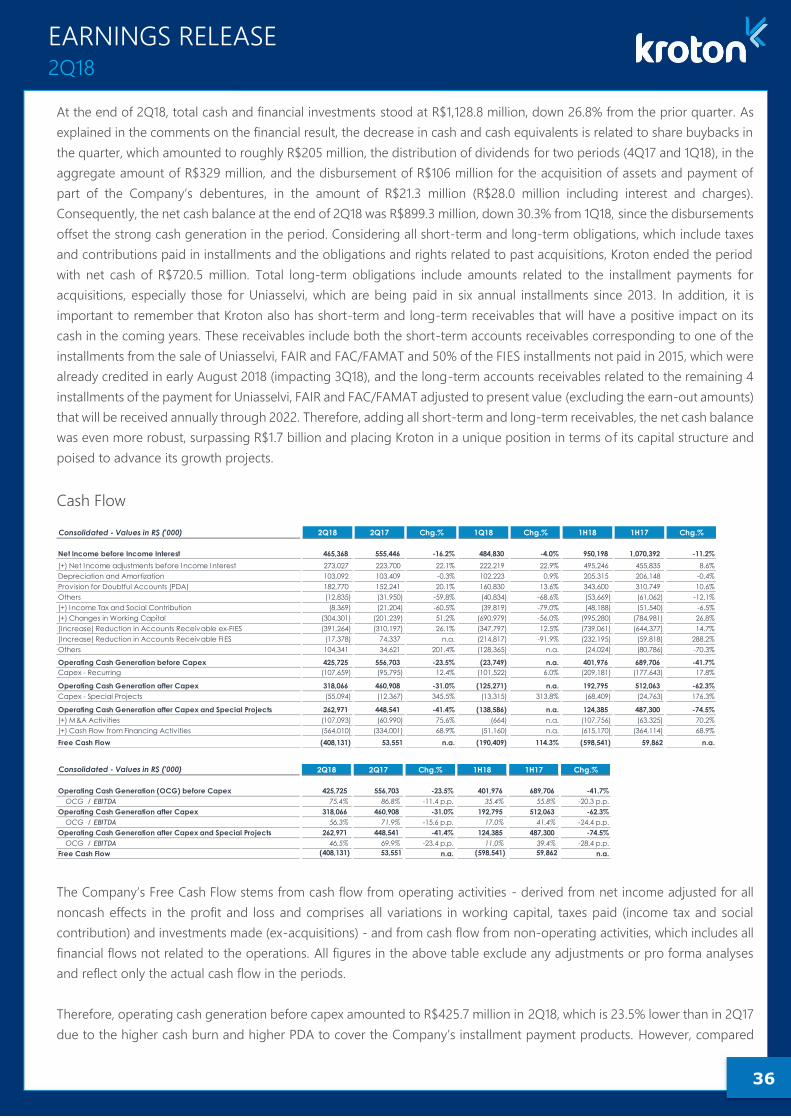
36
EARNINGS RELEASE 2Q18
At the end of 2Q18, total cash and financial investments stood at R$1,128.8 million, down 26.8% from the prior quarter. As
explained in the comments on the financial result, the decrease in cash and cash equivalents is related to share buybacks in
the quarter, which amounted to roughly R$205 million, the distribution of dividends for two periods (4Q17 and 1Q18), in the
aggregate amount of R$329 million, and the disbursement of R$106 million for the acquisition of assets and payment of
part of the Company’s debentures, in the amount of R$21.3 million (R$28.0 million including interest and charges).
Consequently, the net cash balance at the end of 2Q18 was R$899.3 million, down 30.3% from 1Q18, since the disbursements
offset the strong cash generation in the period. Considering all short-term and long-term obligations, which include taxes
and contributions paid in installments and the obligations and rights related to past acquisitions, Kroton ended the period
with net cash of R$720.5 million. Total long-term obligations include amounts related to the installment payments for
acquisitions, especially those for Uniasselvi, which are being paid in six annual installments since 2013. In addition, it is
important to remember that Kroton also has short-term and long-term receivables that will have a positive impact on its
cash in the coming years. These receivables include both the short-term accounts receivables corresponding to one of the
installments from the sale of Uniasselvi, FAIR and FAC/FAMAT and 50% of the FIES installments not paid in 2015, which were
already credited in early August 2018 (impacting 3Q18), and the long-term accounts receivables related to the remaining 4
installments of the payment for Uniasselvi, FAIR and FAC/FAMAT adjusted to present value (excluding the earn-out amounts)
that will be received annually through 2022. Therefore, adding all short-term and long-term receivables, the net cash balance
was even more robust, surpassing R$1.7 billion and placing Kroton in a unique position in terms of its capital structure and
poised to advance its growth projects.
Cash Flow
The Company’s Free Cash Flow stems from cash flow from operating activities - derived from net income adjusted for all
noncash effects in the profit and loss and comprises all variations in working capital, taxes paid (income tax and social
contribution) and investments made (ex-acquisitions) - and from cash flow from non-operating activities, which includes all
financial flows not related to the operations. All figures in the above table exclude any adjustments or pro forma analyses
and reflect only the actual cash flow in the periods.
Therefore, operating cash generation before capex amounted to R$425.7 million in 2Q18, which is 23.5% lower than in 2Q17
due to the higher cash burn and higher PDA to cover the Company’s installment payment products. However, compared
Consolidated - Values in R$ ('000) 2Q18 2Q17 Chg.% 1Q18 Chg.% 1H18 1H17 Chg.%
Net Income before Income Interest 465,368 555,446 -16.2% 484,830 -4.0% 950,198 1,070,392 -11.2%
(+) Net Income adjustments before Income Interest 273,027 223,700 22.1% 222,219 22.9% 495,246 455,835 8.6%
Depreciation and Amortization 103,092 103,409 -0.3% 102,223 0.9% 205,315 206,148 -0.4%
Provision for Doubtful Accounts (PDA) 182,770 152,241 20.1% 160,830 13.6% 343,600 310,749 10.6%
Others (12,835) (31,950) -59.8% (40,834) -68.6% (53,669) (61,062) -12.1%
(+) Income Tax and Social Contribution (8,369) (21,204) -60.5% (39,819) -79.0% (48,188) (51,540) -6.5%
(+) Changes in Working Capital (304,301) (201,239) 51.2% (690,979) -56.0% (995,280) (784,981) 26.8%
(Increase) Reduction in Accounts Receivable ex-FIES (391,264) (310,197) 26.1% (347,797) 12.5% (739,061) (644,377) 14.7%
(Increase) Reduction in Accounts Receivable FIES (17,378) 74,337 n.a. (214,817) -91.9% (232,195) (59,818) 288.2%
Others 104,341 34,621 201.4% (128,365) n.a. (24,024) (80,786) -70.3%
Operating Cash Generation before Capex 425,725 556,703 -23.5% (23,749) n.a. 401,976 689,706 -41.7%
Capex - Recurring (107,659) (95,795) 12.4% (101,522) 6.0% (209,181) (177,643) 17.8%
Operating Cash Generation after Capex 318,066 460,908 -31.0% (125,271) n.a. 192,795 512,063 -62.3%
Capex - Special Projects (55,094) (12,367) 345.5% (13,315) 313.8% (68,409) (24,763) 176.3%
Operating Cash Generation after Capex and Special Projects 262,971 448,541 -41.4% (138,586) n.a. 124,385 487,300 -74.5%
(+) M&A Activ ities (107,093) (60,990) 75.6% (664) n.a. (107,756) (63,325) 70.2%
(+) Cash Flow from Financing Activ ities (564,010) (334,001) 68.9% (51,160) n.a. (615,170) (364,114) 68.9%
Free Cash Flow (408,131) 53,551 n.a. (190,409) 114.3% (598,541) 59,862 n.a.
Consolidated - Values in R$ ('000) 2Q18 2Q17 Chg.% 1H18 1H17 Chg.%
Operating Cash Generation (OCG) before Capex 425,725 556,703 -23.5% 401,976 689,706 -41.7%
OCG / EBITDA 75.4% 86.8% -11.4 p.p. 35.4% 55.8% -20.3 p.p.
Operating Cash Generation after Capex 318,066 460,908 -31.0% 192,795 512,063 -62.3%
OCG / EBITDA 56.3% 71.9% -15.6 p.p. 17.0% 41.4% -24.4 p.p.
Operating Cash Generation after Capex and Special Projects 262,971 448,541 -41.4% 124,385 487,300 -74.5%
OCG / EBITDA 46.5% 69.9% -23.4 p.p. 11.0% 39.4% -28.4 p.p.
Free Cash Flow (408,131) 53,551 n.a. (598,541) 59,862 n.a.

37
EARNINGS RELEASE 2Q18
to the prior quarter, cash generation improved significantly, reflecting the normalization of the FIES contracting process.
Considering the disbursements for capex, operating cash flow was R$318.1 million in 2Q18. Including also capex and special
projects, operating cash generation amounted to R$263.0 million, a level which confirms the resilience of the Company in
generating strong results despite all the pressures from the changing profile of the student base and the costs with offering
installment payment products to students using own capital. Free cash flow was negative R$408.1 million in the period, due
to the non-recurring events in 2Q18, with two dividend distributions in a single quarter, the acquisition of two new assets
and a considerable volume of stock buybacks to offset the low prices the Company’s stock was traded in the period.
Operating cash flow after capex corresponded to 56.3% of EBITDA in 2Q18. In the six-month period, operating cash
generation after capex corresponded to 17.0% of EBITDA, due to all the factors involving FIES at the start of the year, such
as anticipation of the payment of an installment to 4Q17 and the delays in amending contracts. Excluding this effect and
the impacts from the disbursements made this quarter, performance was very strong and reinforced the solidity of the
Company’s operations and the good prospects for the second semester.
CAPITAL MARKETS AND SUBSEQUENT EVENTS
OWNERSHIP STRUCTURE
After the capital increases approved in the first quarter, Kroton’s share capital is divided into 1,644,248,206 common shares ,
distributed as follows:
* Position as of 7/31/2018.
STOCK PERFORMANCE
Kroton stock (KROT3) is a component of several indices, such as the Bovespa Index (Ibovespa), Special Corporate
Governance Stock Index (IGC), Special Tag-Along Stock Index (ITAG), Consumption Sector Index (ICON) and MSCI Brazil.
The stock was traded in 100% of trading sessions during 2Q18, registering financial trading volume of R$7.8 billion and
1,375,044 trades in the period, which represents average daily trading volume of R$124.7 million. On June 30, 2018, Kroton’s
market capitalization was R$15.3 billion.
In the second quarter of 2018, Kroton’s stock price fell 31.5%, while the Bovespa Index (Ibovespa) fell 14.8% in the same
period. Meanwhile, the IGC, ITAG and ICON devalued 14.2%, 16.0% and 15.8%, respectively. Kroton stock is currently covered
by research analysts at 13 different local and international institutions. In the six-month period, Kroton’s stock price declined
49.3% and registered an average daily trading volume of R$147.0 million. In the same period, the Ibovespa fell 4.8%, while
the IGC, ITAG and ICON decreased 8.4%, 8.2% and 18.2%, respectively.
Kroton Ownership Structure* Quantity %
Treasury 17,281,765 1.05%
Free Float 1,626,966,441 98.95%
Total 1,644,248,206 100.00%

38
EARNINGS RELEASE 2Q18
SHARE BUYBACK PROGRAM
On June 28, 2017, the Company approved its 6th share buyback program, which will be valid for 18 months and authorizes
the acquisition of up to 48,773,702 shares, which corresponds to 3% of the free-float on said date. Since the launch of the
program through July 31, 2018, a total of 17,412,500 common shares issued by the Company were repurchased at an average
price of R$12.61 per share, with this number of shares representing 35.7% of the limit established by the program.
CREDIT RATINGS
Kroton is currently rated triple A (brAAA) by Standard & Poor's and AA+(bra) by Fitch Rating.
DIVIDENDS
In a Meeting held on August 14, 2017, the Board of Directors approved the distribution of dividends related to the results
for the second quarter of 2018 in the amount of R$177.6 million, which will be calculated towards the minimum mandatory
dividend for 2018 and corresponds to R$0.1091546243 per common share and to 40% of adjusted net income, after
deduction of the legal reserve. Shareholders of record at the close of trading on August 20, 2018 are entitled to the dividends.
ABOUT KROTON EDUCACIONAL
Kroton Educacional S.A. is one of the largest private for-profit educational organizations in the world. Operating for over 50
years, the Company has a nationwide presence in all of Brazil’s states. At the end of 2Q18, Kroton had around 937,000
students enrolled in its On-Campus and Distance Learning Postsecondary Education programs at its 128 Postsecondary
units and its 1,210 Distance Learning centers. It also offers Preparatory Courses under the brand LFG. In Primary & Secondary
Education, its main business is offering Learning Systems, which in 2018 served 687 private schools in the country, and the
management of own schools, such as Pitágoras in Belo Horizonte and Leonardo da Vinci in Vitória.
DISCLAIMER
This document contains forward-looking statements and information. These forward-looking statements and information
are merely forecasts and not guarantees of future performance. All stakeholders are cautioned that such forward-looking
statements and information involve risks, uncertainties and factors relating to the operations and business environments of
Kroton and its subsidiaries and affiliates, and that the actual results of the companies could differ materially from the future
results anticipated explicitly or implicitly by such forward-looking statements and information.
Highlights- KROT3 2Q18 1H18
Average Daily Trade Volume (average) R$ 124.7 million R$ 147.0 million
Maximum (R$ per share) R$ 14.50 R$ 18.75
Minimum (R$ per share) R$ 9.16 R$ 9.16
Average (R$ per share) R$ 11.88 R$ 13.84
Closing Quote R$ 9.32 R$ 9.32
Variation in the period (%) -31.5% -49.3%
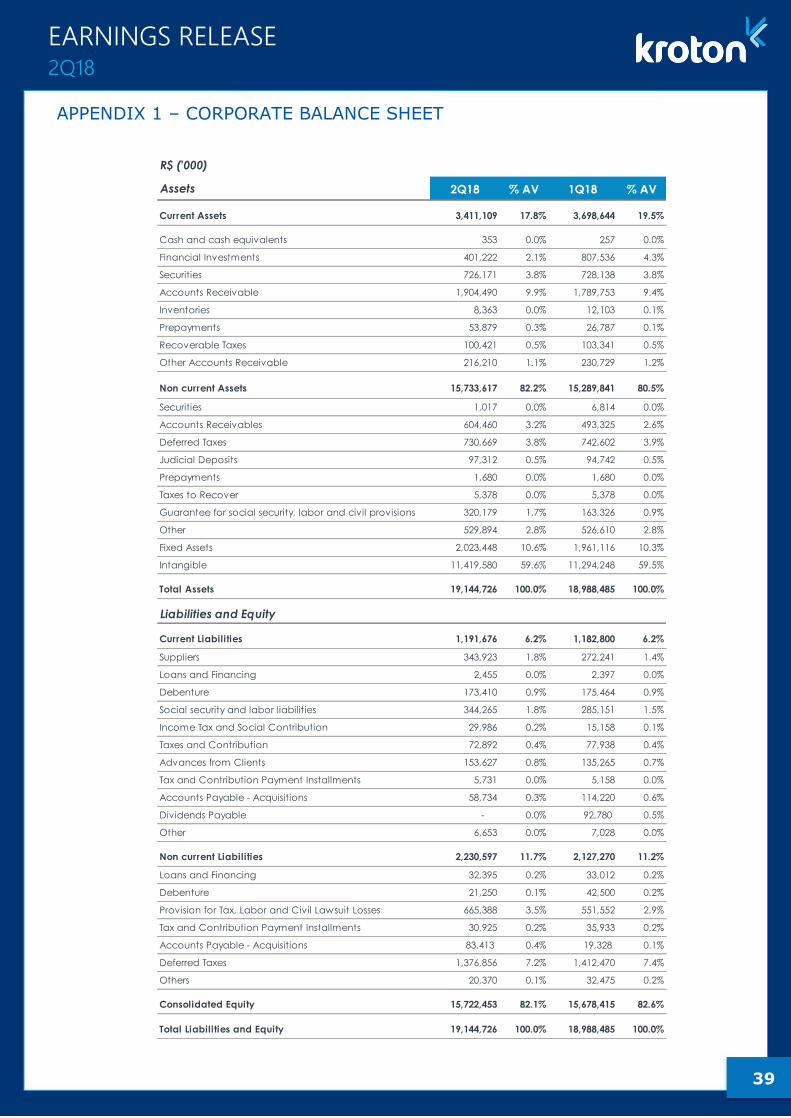
39
EARNINGS RELEASE 2Q18
APPENDIX 1 – CORPORATE BALANCE SHEET
R$ ('000)
Assets 2Q18 % AV 1Q18 % AV
Current Assets 3,411,109 17.8% 3,698,644 19.5%
Cash and cash equivalents 353 0.0% 257 0.0%
Financial Investments 401,222 2.1% 807,536 4.3%
Securities 726,171 3.8% 728,138 3.8%
Accounts Receivable 1,904,490 9.9% 1,789,753 9.4%
Inventories 8,363 0.0% 12,103 0.1%
Prepayments 53,879 0.3% 26,787 0.1%
Recoverable Taxes 100,421 0.5% 103,341 0.5%
Other Accounts Receivable 216,210 1.1% 230,729 1.2%
Non current Assets 15,733,617 82.2% 15,289,841 80.5%
Securities 1,017 0.0% 6,814 0.0%
Accounts Receivables 604,460 3.2% 493,325 2.6%
Deferred Taxes 730,669 3.8% 742,602 3.9%
Judicial Deposits 97,312 0.5% 94,742 0.5%
Prepayments 1,680 0.0% 1,680 0.0%
Taxes to Recover 5,378 0.0% 5,378 0.0%
Guarantee for social security, labor and civil provisions 320,179 1.7% 163,326 0.9%
Other 529,894 2.8% 526,610 2.8%
Fixed Assets 2,023,448 10.6% 1,961,116 10.3%
Intangible 11,419,580 59.6% 11,294,248 59.5%
Total Assets 19,144,726 100.0% 18,988,485 100.0%
Liabilities and Equity
Current Liabilities 1,191,676 6.2% 1,182,800 6.2%
Suppliers 343,923 1.8% 272,241 1.4%
Loans and Financing 2,455 0.0% 2,397 0.0%
Debenture 173,410 0.9% 175,464 0.9%
Social security and labor liabilities 344,265 1.8% 285,151 1.5%
Income Tax and Social Contribution 29,986 0.2% 15,158 0.1%
Taxes and Contribution 72,892 0.4% 77,938 0.4%
Advances from Clients 153,627 0.8% 135,265 0.7%
Tax and Contribution Payment Installments 5,731 0.0% 5,158 0.0%
Accounts Payable - Acquisitions 58,734 0.3% 114,220 0.6%
Dividends Payable - 0.0% 92,780 0.5%
Other 6,653 0.0% 7,028 0.0%
Non current Liabilities 2,230,597 11.7% 2,127,270 11.2%
Loans and Financing 32,395 0.2% 33,012 0.2%
Debenture 21,250 0.1% 42,500 0.2%
Provision for Tax, Labor and Civil Lawsuit Losses 665,388 3.5% 551,552 2.9%
Tax and Contribution Payment Installments 30,925 0.2% 35,933 0.2%
Accounts Payable - Acquisitions 83,413 0.4% 19,328 0.1%
Deferred Taxes 1,376,856 7.2% 1,412,470 7.4%
Others 20,370 0.1% 32,475 0.2%
Consolidated Equity 15,722,453 82.1% 15,678,415 82.6%
Total Liabilities and Equity 19,144,726 100.0% 18,988,485 100.0%

40
EARNINGS RELEASE 2Q18
APPENDIX 2 – QUARTERLY INCOME STATEMENT RECONCILIATION
2Q18
Results (Book)
Interest and
Penalties
on Tuition
Depre-
ciation
Intangible
Amortization
(Acquisitions)
Non-recurring
Items/ Capital
Gain
Reclassification
between Costs
and expenses
2Q18
Results
(Release)
Gross Revenue 2,036,156 - - - - - 2,036,156
Postsecondary 1,979,941 - - - - - 1,979,941
Primary and Secondary 56,215 - - - - - 56,215
Deductions from Gross Revenue (509,883) - - - - - (509,883)
Postsecondary (503,459) - - - - - (503,459)
Primary and Secondary (6,424) - - - - - (6,424)
Net Revenue 1,526,273 - - - - - 1,526,273
Postsecondary 1,476,482 - - - - - 1,476,482
Primary and Secondary 49,791 - - - - - 49,791
Costs of Goods/Services (592,377) - 84,951 - 7,566 104,395 (395,465)
Cost of Goods Sold (10,386) - - - - - (10,386)
Cost of Serv ices Rendered (581,991) - 84,951 - 7,566 104,395 (385,079)
Gross Income 933,896 - 84,951 - 7,566 104,395 1,130,807
Operating Expenses (514,904) - - 18,141 68,965 (104,394) (532,192)
Selling Expenses (303,029) - - - 9,960 182,782 (110,287)
Prov ision for Doubtful Accounts - - - - - (182,788) (182,788)
Personnel Expenses - - - - - (95,399) (95,399)
General and Administrative Expenses (206,078) - - 18,141 53,208 55,784 (78,945)
Other Operating Income (Expenses) (5,797) - - - 5,797 - 0
Corporate Expenses - - - - - (64,772) (64,772)
Income before Financial Result 418,992 - 84,951 18,141 76,531 - 598,616
Interest and Penalties on Tuition - 42,931 - - - - 42,931
Adjusted EBITDA 418,992 42,931 84,951 18,141 76,531 - 641,547
(-) Nonrecurring itens - - - - (76,587) - (76,587)
Depreciation and Amortization - - (84,951) (18,141) - - (103,092)
Financial Result 46,379 (42,931) - - 56 - 3,503
Financial Expenses (19,079) - - - - - (19,079)
Financial Revenues 65,458 (42,931) - - 56 - 22,582
Income from Operations 465,371 - - - - - 465,371
Income and Social Contribution Tax 1,976 - - - - - 1,976
Current (21,705) - - - - - (21,705)
Deferred 23,681 - - - - - 23,681
Net Income 467,347 - - - - - 467,347
Non-accounting adjustments
(In thousand reais, except otherwise indicated)

41
EARNINGS RELEASE 2Q18
APPENDIX 3 – FULL YEAR INCOME STATEMENT RECONCILIATION
1H18
Results (Book)
Interest and
Penalties on
Tuition
Depre-
ciation
Intangible
Amortization
(Acquisitions)
Non-recurring
Items/ Capital
Gain
Reclassifi-
cation
between Costs
and expenses
1H18 Results
(Release)
Gross Revenue 3,793,983 - - - - - 3,793,983
Postsecondary 3,689,765 - - - - - 3,689,765
Primary and Secondary 104,218 - - - - - 104,218
Deductions from Gross Revenue (904,385) - - - - - (904,385)
Postsecondary (885,967) - - - - - (885,967)
Primary and Secondary (18,418) - - - - - (18,418)
Net Revenue 2,889,598 - - - - - 2,889,598
Postsecondary 2,803,798 - - - - - 2,803,798
Primary and Secondary 85,800 - - - - - 85,800
Costs of Goods/Services (1,082,928) - 169,070 - 11,459 194,159 (708,241)
Cost of Goods Sold (15,480) - - - - - (15,480)
Cost of Serv ices Rendered (1,067,448) - 169,070 - 11,459 194,159 (692,761)
Gross Income 1,806,670 - 169,070 - 11,459 194,159 2,181,357
Operating Expenses (962,061) - - 36,246 110,537 (194,159) (1,009,437)
Selling Expenses (578,124) - - - 10,296 343,619 (224,209)
Prov ision for Doubtful Accounts - - - - - (343,619) (343,619)
Personnel Expenses - - - - - (174,563) (174,563)
General and Administrative Expenses (377,410) - - 36,246 93,714 102,331 (145,120)
Other Operating Income (Expenses) (6,527) - - - 6,527 - -
Corporate Expenses - - - - - (121,927) (121,927)
Income before Financial Result 844,609 - 169,070 36,246 121,996 - 1,171,920
Interest and Penalties on Tuition - 84,340 - - - - 84,340
Adjusted EBITDA 844,609 84,340 169,070 36,246 121,996 - 1,256,260
(-) Nonrecurring itens - - - - (122,058) - (122,058)
Depreciation and Amortization - - (169,070) (36,246) - - (205,315)
Financial Result 105,593 (84,340) - - 62 - 21,315
Financial Expenses (29,769) - - - - - (29,769)
Financial Revenues 135,362 (84,340) - - 62 - 51,084
Income from Operations 950,202 - - - - - 950,201
Income and Social Contribution Tax (7,440) - - - - - (7,440)
Current (42,086) - - - - - (42,086)
Deferred 34,646 - - - - - 34,646
Net Income 942,762 - - - - - 942,762
Non-accounting adjustments
(In thousand reais, except otherwise indicated)

42
EARNINGS RELEASE 2Q18
APPENDIX 4 – QUARTERLY INCOME STATEMENT
2Q18 % Net Rev. 2Q17 % Net Rev. 2Q18 / 2Q17 1Q18 % Net Rev. 2Q18 / 1Q18
Gross Revenue 2,036,155 133.4% 1,938,602 127.6% 5.0% 1,757,827 128.9% 15.8%
Postsecondary 1,979,940 129.7% 1,890,667 124.4% 4.7% 1,709,824 125.4% 15.8%
Primary and Secondary 56,215 3.7% 47,935 3.2% 17.3% 48,003 3.5% 17.1%
Deductions from Gross Revenue (509,882) -33.4% (419,210) -27.6% 21.6% (394,502) -28.9% 29.2%
Postsecondary (503,458) -33.0% (415,639) -27.4% 21.1% (382,508) -28.1% 31.6%
Primary and Secondary (6,424) -0.4% (3,571) -0.2% 79.9% (11,994) -0.9% -46.4%
Net Revenue 1,526,273 100.0% 1,519,392 100.0% 0.5% 1,363,325 100.0% 12.0%
Postsecondary 1,476,482 96.7% 1,475,028 97.1% 0.1% 1,327,316 97.4% 11.2%
Primary and Secondary 49,791 3.3% 44,364 2.9% 12.2% 36,009 2.6% 38.3%
Costs of Goods/Services (592,377) -38.8% (566,803) -37.3% 4.5% (490,551) -36.0% 20.8%
Cost of Goods Sold (10,386) -0.7% (8,344) -0.5% 24.5% (5,094) -0.4% 103.9%
Cost of Serv ices Rendered (581,991) -38.1% (558,459) -36.8% 4.2% (485,457) -35.6% 19.9%
Gross Income 933,896 61.2% 952,589 62.7% -2.0% 872,774 64.0% 7.0%
Operating Expenses (514,904) -33.7% (442,469) -29.1% 16.4% (447,157) -32.8% 15.2%
Selling Expenses (303,029) -19.9% (245,211) -16.1% 23.6% (275,095) -20.2% 10.2%
General and Administrative Expenses (206,078) -13.5% (197,626) -13.0% 4.3% (171,332) -12.6% 20.3%
Other Operating Income (Expenses) (5,797) -0.4% 368 0.0% n.a. (730) -0.1% n.a.
Income before Financial Result 418,992 27.5% 510,120 33.6% -17.9% 425,617 31.2% -1.6%
Financial Result 46,379 3.0% 45,326 3.0% 2.3% 59,214 4.3% -21.7%
Financial Expenses (19,079) -1.3% (30,134) -2.0% -36.7% (10,690) -0.8% 78.5%
Financial Revenues 65,458 4.3% 75,460 5.0% -13.3% 69,904 5.1% -6.4%
Income from Operations 465,371 30.5% 555,446 36.6% -16.2% 484,831 35.6% -4.0%
Income and Social Contribution Tax 1,976 0.1% (8,294) -0.5% n.a. (9,416) -0.7% n.a.
Current (21,705) -1.4% (23,981) -1.6% -9.5% (20,381) -1.5% 6.5%
Deferred 23,681 1.6% 15,687 1.0% 51.0% 10,965 0.8% 116.0%
Net Income 467,347 30.6% 547,152 36.0% -14.6% 475,415 34.9% -1.7%
(In thousand reais, except otherwise indicated)
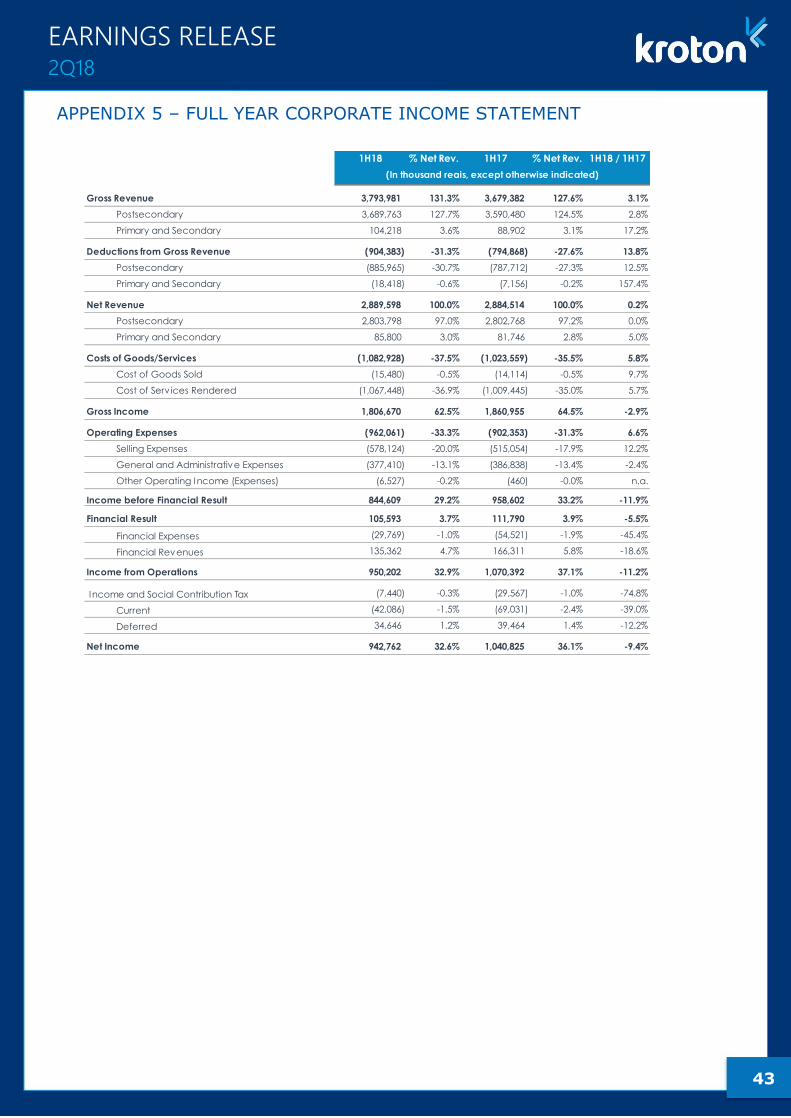
43
EARNINGS RELEASE 2Q18
APPENDIX 5 – FULL YEAR CORPORATE INCOME STATEMENT
1H18 % Net Rev. 1H17 % Net Rev. 1H18 / 1H17
Gross Revenue 3,793,981 131.3% 3,679,382 127.6% 3.1%
Postsecondary 3,689,763 127.7% 3,590,480 124.5% 2.8%
Primary and Secondary 104,218 3.6% 88,902 3.1% 17.2%
Deductions from Gross Revenue (904,383) -31.3% (794,868) -27.6% 13.8%
Postsecondary (885,965) -30.7% (787,712) -27.3% 12.5%
Primary and Secondary (18,418) -0.6% (7,156) -0.2% 157.4%
Net Revenue 2,889,598 100.0% 2,884,514 100.0% 0.2%
Postsecondary 2,803,798 97.0% 2,802,768 97.2% 0.0%
Primary and Secondary 85,800 3.0% 81,746 2.8% 5.0%
Costs of Goods/Services (1,082,928) -37.5% (1,023,559) -35.5% 5.8%
Cost of Goods Sold (15,480) -0.5% (14,114) -0.5% 9.7%
Cost of Serv ices Rendered (1,067,448) -36.9% (1,009,445) -35.0% 5.7%
Gross Income 1,806,670 62.5% 1,860,955 64.5% -2.9%
Operating Expenses (962,061) -33.3% (902,353) -31.3% 6.6%
Selling Expenses (578,124) -20.0% (515,054) -17.9% 12.2%
General and Administrative Expenses (377,410) -13.1% (386,838) -13.4% -2.4%
Other Operating Income (Expenses) (6,527) -0.2% (460) -0.0% n.a.
Income before Financial Result 844,609 29.2% 958,602 33.2% -11.9%
Financial Result 105,593 3.7% 111,790 3.9% -5.5%
Financial Expenses (29,769) -1.0% (54,521) -1.9% -45.4%
Financial Revenues 135,362 4.7% 166,311 5.8% -18.6%
Income from Operations 950,202 32.9% 1,070,392 37.1% -11.2%
Income and Social Contribution Tax (7,440) -0.3% (29,567) -1.0% -74.8%
Current (42,086) -1.5% (69,031) -2.4% -39.0%
Deferred 34,646 1.2% 39,464 1.4% -12.2%
Net Income 942,762 32.6% 1,040,825 36.1% -9.4%
(In thousand reais, except otherwise indicated)

44
EARNINGS RELEASE 2Q18
APPENDIX 6 – CASH FLOW STATEMENT
R$ 000 2Q18 2Q17 1Q18
Net Income before Income Taxes 465,371 555,446 484,830 - - -
Net Income (Loss) Adjustments before Income Taxes
Depreciation and Amortization 103,092 103,409 102,223
Provision for Doubtful Accounts 182,770 152,241 160,830
Provision for Tax, Labor and Civil Losses (14,829) (16,494) (22,779)
Provision (Reversal) for Invetories Losses (72) 112 (108)
Financial Charges 7,824 11,415 7,060
Income from Securities (12,244) (35,380) (25,273)
Grant of Stock Options 802 8,372 (4,637)
Income from disposal of subsidiaries - - -
Income from sale or disposal of assets and other investments 5,684 25 4,903 - - -
Changes in Working Capital (304,304) (201,239) (690,979) - - -
(Increase) Reduction in Accounts Receivable (ex-FIES) (391,264) (310,197) (347,797)
(Increase) Reduction in Accounts Receivable FIES (17,378) 74,337 (214,817)
(Increase) Reduction in Inventories 3,812 (1,240) (455)
(Increase) Reduction in Advances (27,044) 7,040 22,270
(Increase) Decrease in Escrow Deposits (2,571) (3,048) (24,010)
Increase (Decrease) in Other Assets (67,961) (37,250) (48,136)
Increase (Reduction) in Suppliers 196,729 48,947 (26,231)
Increase (Decrease) in Payroll and Related Taxes 58,185 41,050 (22,178)
Increase (Decrease) in Fiscal Obligations 4,995 (9,139) 22,495
Increase (Decrease) in Advances to Clients 18,362 13,863 (28,153)
(Decrease) in Taxes Installments (4,087) (830) (2,618)
(Decrease) in Provision for Tax, Labor and Civil Losses (28,188) (25,295) (18,795)
Increase (Decrease) in Other Liabilities (47,894) 524 (2,554) - - -
Income Tax and Social Contribution (8,369) (21,204) (39,819)- - -
Capex (107,659) (95,795) (101,522) - - -
Additions to Fixed Assets (44,348) (52,430) (62,274)
Additions to Intangible Assets (63,311) (43,365) (39,248) - - -
Cash Flow from Operating Activities after Capex - Recurring 318,066 460,908 (125,271)0 0 0
Capex - Special Projects (55,094) (12,367) (13,315)
Brownfields (55,094) (12,367) (13,315) 0 0 0
Cash Flow from Operating Activities after total Capex 262,971 448,541 (138,586)- - -
(+) M&A Activities (107,093) (60,990) (664)
Acquisition of subsidiaries (105,652) (58,587) (2,295)
Accounts Receivable from former owners (898) (996) 1,632
M&A Costs and Expenses (543) (1,407) -
Proceeds from sale of investments - - - - - -
(+) Cash Flow from Financing Activities (564,010) (334,001) (51,160)
Sale (Acquisition) of Treasury Shares (203,770) 7,648 (54,939)
Capital Increase, Net of Issuance Costs 1,619 - 50,000
Payments of Borrowings and Financing (22,701) (29,925) (51,582)
Interest Paid on Borrowings and Debentures (9,635) (20,555) (4,359)
Redemption (Investment) of Securities 12,410 24,736 21,099
Refis Payment (348) (796) (4,697)
Bank and Charges Fees (12,479) (1,932) (6,681)
Payment of Dividends (329,106) (313,177) - - - -
(=) Cash Flow from Non-Operating Activities (671,103) (394,991) (51,823)- - -
Total Cash Generation (408,131) 53,551 (190,409)- - -
Net Increase (Decrease) in Cash and Cash Equivalents
Cash and Cash Equivalents at the Start of the Period 1,535,877 1,350,293 1,726,287
Cash and Cash Equivalents at the End of the Period 1,127,746 1,403,843 1,535,877 - - -
Net Increase (Decrease) in Cash and Cash Equivalents (408,131) 53,551 (190,409)- - -