hiring older employees: do incentives of early retirement channels matter?
TRANSCRIPT

268
Hiring olderemployees: Doincentives of
early retirementchannelsmatter?
Pekka IlmakunnasSeija Ilmakunnas

PALKANSAAJIEN TUTKIMUSLAITOS • TYÖPAPEREITA
LABOUR INSTITUTE FOR ECONOMIC RESEARCH • DISCUSSION PAPERS
Helsinki 2011
268Hiring older employees: Do incentives of early retirement channels matter?*
Pekka Ilmakunnas**Seija Ilmakunnas***
* Earlier versions of this paper have been presented at WPEG Conference in Bristol, CAED Conference in London, Summer Meeting of Economists in Jyväskylä, Annual Meeting of Finnish Economic Association in Oulu, and seminars at ETLA and Finnish Centre for Pensions. We are
grateful to Reijo Vanne, Thomas Zwick, and the seminar participants for useful comments.
** Aalto University School of Economics ([email protected] )
*** Labour Institute for Economic Research ([email protected] )

ISBN 978–952–209–092–8ISSN 1795–1801

1
ABSTRACT
We examine the impact of a Finnish reform in the 1990s that restricted the use of particular
early retirement channels, unemployment pension and individual early retirement, and
simultaneously changed the rules of firm size related experience rating in disability pensions.
Our emphasis is on how the reforms affected the incentives of the firms to hire older
employees. In a simple model we illustrate how forward-looking behaviour of firms affects
the value of a new hire. Simulations with the model illustrate that although the reform in the
unemployment pension in principle affected particular age groups, 53-54 year olds in the case
of unemployment pension and 55-57 year olds in the case of individual early retirement, the
impacts on hiring may have been felt also in other, younger, age groups. On the other hand,
the effects of both reforms are likely to have varied by firm size. In a differences-in-
differences-in-differences analysis with firm-level data we show that the impact of the
reforms has been to increase the probability of hiring especially in the age group 51-52 and
especially in the largest firms.
Key words: early retirement, hiring, pension reform
JEL codes: J14, J26, J63

2
TIIVISTELMÄ
Tutkimuksessa tarkastellaan 1990-luvulla toteutettujen varhaiseläkeuudistusten vaikutuksia.
Muutoksilla pyrittiin rajoittamaan ns. työttömyyseläkeputken ja yksilöllisen varhaiseläkkeen
käyttöä poistumisväylinä työelämästä. Myös työnantajien maksamien omavastuiden uudista-
minen työkyvyttömyyseläkkeiden rahoituksessa tähtäsi samaan päämäärään. Tutkimuksen
päähuomio on siinä, miten nämä uudistukset vaikuttivat yritysten halukkuuteen palkata ikään-
tyneitä työntekijöitä. Kuvaamme aluksi pelkistetyn teoreettisen mallin avulla yksittäisen rek-
rytoinnin iän mukaista kannattavuutta tilanteessa, jossa yritys ottaa huomioon muun muassa
odotettavissa olevan työuran pituuden sekä työttömyys- ja työkyvyttömyysriskin. Tämän mal-
lin avulla tehdyt laskelmat osoittavat, että uudistukset vaikuttavat erityisesti sellaisissa nuo-
remmissa ikäryhmissä, joihin varhaiseläkeuudistukset eivät suoraan kohdistuneet. Välittömät
ikärajamuutokset kohdistuivat työttömyyseläkeputken kohdalla 53–54-vuotiaisiin ja yksilöl-
lisen varhaiseläkkeen kohdalla 55–57-vuotiaisiin. Reformien vaikutukset voivat poiketa myös
erikokoisten yritysten välillä näiden eläkkeiden rahoituksen omavastuujärjestelmän ja siihen
tehtyjen uudistusten johdosta. Tarkastelemme uudistusten vaikutuksia näin ollen myös yri-
tysten koon mukaan. Empiiristen tulosten mukaan uudistukset ovat lisänneet rekrytointeja eri-
tyisesti 51–52-vuotiaiden ikäryhmässä ja suurimmissa yrityksissä. Olemme käyttäneet linki-
tettyä yritys-työntekijä-aineistoa ja differences-in-differences-in-differences -estimointimene-
telmää.
Avainsanat: varhaiseläkkeet, rekrytoinnit, eläkeuudistukset

3
1. INTRODUCTION
Population ageing has increased interest in research on the labour market for older employees.
Still, the amount of research devoted to hiring of older workers is much smaller than the
amount of research on their labour market exits through various retirement channels. It is
even more striking that the role of labour market institutions, like early-retirement schemes is
very seldom tackled in the studies on hiring.
Most of the available studies on hiring concentrate on providing descriptive evidence on the
job opportunities of older employees, e.g. the age segregation of hiring compared to the age
segregation of existing employees, or on testing hypothesis derived from two underlying
mechanisms. The first puts the emphasis on training and fixed costs, which cannot be
recouped in case of old hires. The second puts stress on the nature of optimal labour contracts,
especially the so-called back-loaded compensation structures (Hutchens, 1986), which imply
that at older ages wage may exceed productivity.
There are also some studies that put more emphasis on institutional arrangements that may
affect the hiring opportunities of older employees. The relevant institutional arrangements
include health and pension insurance systems, employment protection and anti-discrimination
legislation, as well as hiring subsidies (see e.g. Scott et al. 1995; Garen et al. 1996; Daniel and
Siebert 2005; Adams 2004; Behaghel, 2007; Behaghel et al. 2008; Heywood and Siebert,
2009; Saint-Paul, 2009, Boockmann et al., forthcoming). While these policies may have well-
founded welfare motivations, some of them may introduce as by-products negative
implications for the hiring prospects of older employees. Particularly, they may increase the
costs of new potential recruits adding to the problem of wage-productivity gap among the
older employees.
The empirical work on hiring of older employees has rarely used policy changes to obtain
exogenous variation in the costs or incentives of hiring older employees. Adams (2004)
studied the effects of US age discrimination legislation using variation over time and across
states in the legislation. His dependent variable in an individual-level probit analysis was
whether an older person was recently hired. Behaghel et al. (2008) examined reforms in the
employment protection of older employees in France exploiting differences in the rules
applying to existing and newly hired old workers. Boockmann et al. (forthcoming) examined

4
the effects of hiring subsidies for older workers in Germany. Both Behaghel et al. and
Boockmann et al. examined transitions from unemployment to employment, rather than all
hirings.1 Using a Finnish pension reform in the 2000s, Hakola and Uusitalo (2005b) examined
the impact of changes in pension insurance contributions on firms’ hirings, measured by
average age of hires and share of 40+ or 50+ old hires. Recently, Martins et al. (2009) have
examined the effects of an increase in the legal retirement age in Portugal on the number of
hired employees. The results of these empirical studies generally confirm the view that the
policies in question can indeed have an effect on hiring prospects. On the other hand, the
magnitude of these effects is naturally dependent on the actual implementation of the
schemes.
The purpose of this paper is to use the Finnish policy changes as natural experiments in the
analysis of hiring behaviour of firms. Finland has witnessed a chain of restrictions in early
retirement options during the last 15 years (Ilmakunnas and Takala, 2005). The effects of
these restrictions on exit rates from work to unemployment and early retirement and on exit
routes from unemployment have been widely studied at the individual level (Hakola and
Uusitalo, 2005a, Kyyrä and Wilke, 2007, Kyyrä and Ollikainen, 2008). So far, there are no
studies available on the effects of these reforms on hiring of older, although on theoretical
grounds one can expect that these institutional changes might have an impact on the labour
demand behaviour of firms. Firstly, removal of early retirement options is likely to lengthen
the expected working careers of the potential older recruits. Since there are fixed costs
involved in hiring and training, the reforms increase the time over which the costs can be
recouped (Saint-Paul 2009). Also Hairault et al. (2010) have argued that the time to retirement
determines to a large extent the value of an employment contract. On the other hand, firms
have used the early exit options as an easy way to lay off employees in periods of declining
demand. The restrictions have hit especially those exit routes where the firms have acted as a
“gatekeeper”, i.e. where the decisions on the use of the routes have mostly been made by the
firm. These two mechanisms are likely to work in opposite directions.
In the Finnish setting there have been several elements in the early retirement system that may
affect the firms’ incentives. One element has been age-dependent pension contribution rates,
1 Kyyrä and Ollikainen (2008) examined the effects of unemployment pension eligibility reform in Finland on exits from unemployment. One exit route was exit to work, which gives indirectly evidence on hiring. However, their emphasis was on the incentives of the workers rather than those of the firms.

5
which have been highest at ages where the disability or unemployment risks are the highest.
The rates thus have had an insurance role, but they have likely influenced also the incentives
to hire workers of different ages. There has also been a system of experience rating, whereby
firms above certain size thresholds directly cover a predetermined share of pension outlays
between early retirement and start of old age pension of their employees, and pay only part of
the contribution rates. The motivation for this kind of financing structure has been to
discourage especially the larger firms from inefficiently overusing early retirement as a tool
for labour adjustment, and to encourage them to pay attention to prevention of work-related
disabilities. While experience rating may indeed have reduced exits to early retirement
channels, it may have made firms more cautious in hiring of older workers. Another policy
that has aimed at restricting the use of early retirement channels has been the introduction of
lower age limits for these schemes. These have had a direct effect on which age groups are
more easily laid off and on the expected working career of the employees. We use both
changes in the age limits related to early retirement channels and changes in firm size
thresholds related to experience rating in difference-in-differences-in-differences analysis.
To illustrate the firms’ incentives we formulate a simple model on how the value of hire at a
given age depends on the policies and the firm size. In the model the firm is forward-looking
in the sense that it takes into account the expected probability of layoff or disability of the
hired worker. This model also allows us to analyze the effects of multiple policy changes,
since in the model simulations we can decompose the impacts to the effects of separate
policies. The model gives us guidelines for the empirical analysis on what are the relevant age
groups and firm sizes to consider. It appears that in a forward-looking setting changes in age
limits will affect the value of hire also in age groups that are not directly affected by the age
limits. Our empirical results support the model calculations, as we find the strongest positive
impact of the reforms on hiring in the largest firms and in such age groups that have always
been below the lower age limits.
We discuss the institutional setting in more detail in Section 2 of the paper and present the
simple model in Section 3. Section 4 provides a data description and Section 5 presents the
estimation results. Section 6 concludes the paper.

6
2. THE INSTITUTIONAL SETTING
There are several age-dependent policies that affect the costs of hiring new employees. We
concentrate on two of them, unemployment pension and disability pension. Both policies have
witnessed changes, some of which have happened at the same time. We analyze changes that
happened in the mid 1990s. Since that period the systems have gone through further changes,
but we concentrate on these earlier reforms in this paper.
2.1. Reforming eligibility ages of early exit schemes
The unemployment pension was a system covering older unemployed persons who typically
have low prospects for re-employment. If a person whose age was above a certain age limit
became unemployed, he went to so-called unemployment pension tunnel. It consisted of
normal unemployment benefits for two years. For those who were under 60 years when the
unemployment benefits were exhausted, there was an extension to unemployment benefits
until age 60. From then on, the person was on unemployment pension until the normal
retirement age. Those who were over 60 when the unemployment compensation ended retired
directly to unemployment pension. Only those who had worked for at least 5 years during the
last 15 years2 were eligible for the unemployment pension.
We analyze a policy change that happened in 1997. Until 1996 the starting age of the tunnel
was 53 years, but in 1997 it was increased to 55 years. Table 1 illustrates the age limits that
applied to different birth cohorts in various years. The cohorts most immediately affected by
the change were those born in 1943 who would have been eligible to the unemployment
pension tunnel had they become unemployed in 1996, but after the change would not have
been eligible until in 1998. Also for the other cohorts the age of eligibility was shifted by two
years.3
The reform may have affected the firms’ incentives in various ways. The unemployment
pension pipeline has been a common way to downsize the work force. It has been argued that
it has been in the mutual benefit of the firms and the employees. The benefit for the firms has
2 Later this was changed to working at least 5 years during the last 20 years. 3 There have been further changes in the age limits. In the most recent pension reform in 2005 the age limit was raised to 57 and the unemployment pension has been gradually abolished starting from 2006.

7
been that older employees often do not strongly resist the use of this particular arrangement.
Also in public opinion, using this early withdrawal channel for the older employees has been
viewed more favourably than lay-offs of the younger ones. In this sense the availability of the
tunnel lowered the partly psychic labour adjustment costs of the employers. On the other
hand, the larger firms have paid part of the induced costs through a system of experience
rating (see section 2.3. below), so they may have had higher monetary adjustment costs from
using the unemployment pension than from lay-offs of younger workers. For the employees,
the system has offered an easy way to take an early exit with secure income for a long period
and it has been favoured especially in physically demanding occupations. The downside is
that being in the tunnel has led to an income reduction, compared to staying at work, and to a
somewhat (but not much) lower old age pension.
Table 1. The eligibility to early exit routes.
Age Birth
cohort 1991 1992 1993 1994 1995 1996 1997 1998 1999
1938 53 54 55 56 57 58 59 60 61 1939 52 53 54 55 56 57 58 59 60 1940 51 52 53 54 55 56 57 58 59 1941 50 51 52 53 54 55 56 57 58 1942 49 50 51 52 53 54 55 56 57 1943 48 49 50 51 52 53 54 55 56 1944 47 48 49 50 51 52 53 54 55
Light grey area: eligible to unemployment pension tunnel. Dark grey area: eligible to individual early retirement. One could argue that after the increase in the age limit, hiring a worker in the affected age
group 53-54 years became riskier: if a need for downsizing arose, the psychic costs of laying
off these workers were now higher as they could no longer enter the tunnel. On the other
hand, they were less risky, since the monetary cost of laying them off was lower, as the
experience rating of the tunnel did not apply to them. As a result of these opposing effects, the
total effect on hiring is a priori uncertain.
Simultaneously with the unemployment pension reform there were changes in so-called
individual early retirement. This was a form of disability pension, but with less strict criteria.
However, there have been limitations on the age of eligibility. In addition, there the decision

8
on the exit was typically based more on an individual’s own initiative, so this system did not
allow the firms as much flexibility as the unemployment pension. The age limit for eligibility
was 55 years until 1994. After that, the age limit was increased to 58 for the cohorts born in
1940 or later. For those born in 1939 there was a gradual increase until the age limit was 58 in
1997.4 This increase is illustrated in Table 1. Roughly 10 percent of all disability pensions
have been under individual early retirement.
2.2. Age-dependent pension contribution rates
The pension contribution rates depend on the age of the employee. There are several
components in the tariff rate and they have a different age profile. In addition, as will be
explained in the next section, the rate the firms actually pay depends on firm size. Figure 2
shows the components of the tariff rate in 1996-1997 for males (the rates are shown only from
age 40 onwards; the rates for females differ slightly). During the period under study the total
rate was roughly 20% until age 40, then it increased rapidly with age and finally the top rate
was approximately 30% from age 57. The rates shown in the figure include the employees’
(fixed) share which was 0.043 in 1996 and 0.045 in 1997.
The components are the old age pension contribution, which increases slowly with age, but is
no longer paid when the employee is above 54 years. This rate was lowered somewhat in
1997. The unemployment pension contribution was in the period under study paid for those
who were of the age where they were eligible for the unemployment pension. In 1997 (the
right panel of Figure 1) this rate was no longer paid for the 53-54 year olds. The rate increases
with age until ages 61-62 and then falls again.5 The disability pension contribution increases
rapidly with age and it is highest for those in their late 50s. In 1997 the disability pension rate
was lowered especially for the age groups affected by the change in the age limit of individual
early retirement. There is also a small rate “other”, which is a flat rate. Finally, so-called
balancing rate is used for balancing the difference between the total tariff rate and the other
components. Hence the balancing rate is lowest for the age groups for which high
unemployment and disability pension rates are paid.6 Part of the lowering of the other rates
4 In 2004 the system of individual early retirement was abolished, although it was still available for those born in 1943 or earlier. 5 With the abolishment of the unemployment pension in the 2000s, the tariff rates no longer include the unemployment pension contribution component. 6 The balancing rate is used for financing the pay-as-you-go part of the pensions and it is adjusted to smooth the age variation in contribution rates.
9
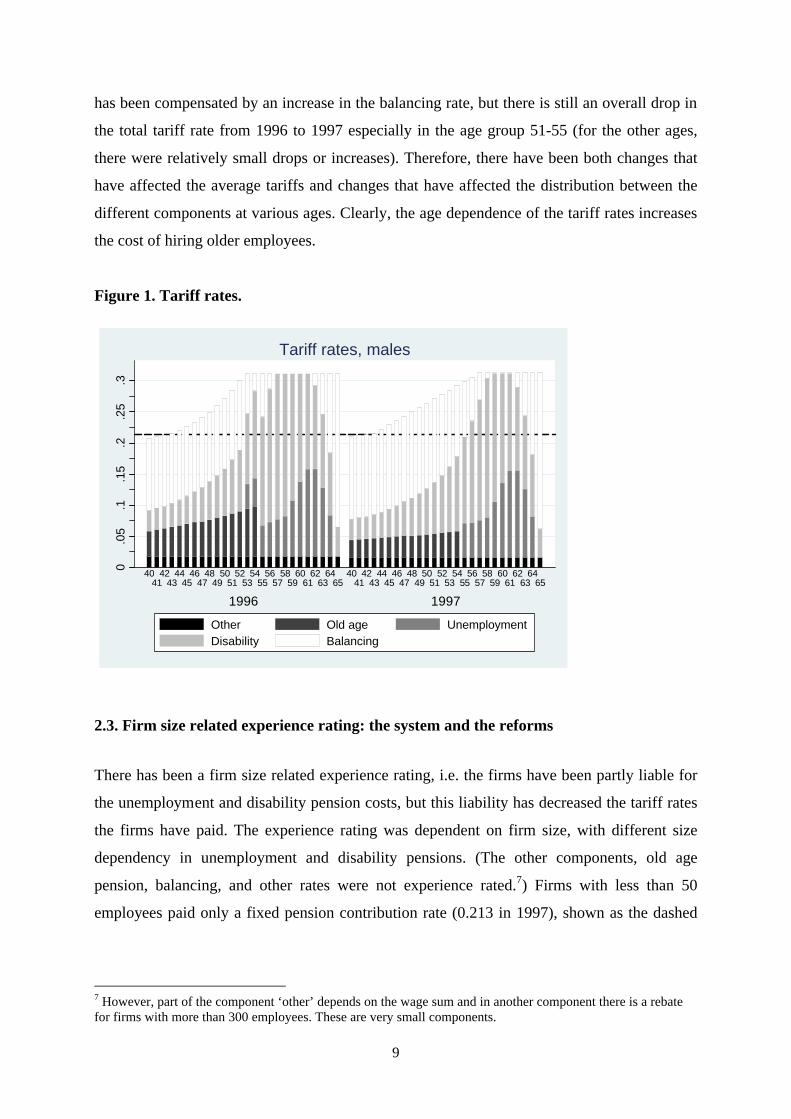
has been compensated by an increase in the balancing rate, but there is still an overall drop in
the total tariff rate from 1996 to 1997 especially in the age group 51-55 (for the other ages,
there were relatively small drops or increases). Therefore, there have been both changes that
have affected the average tariffs and changes that have affected the distribution between the
different components at various ages. Clearly, the age dependence of the tariff rates increases
the cost of hiring older employees.
Figure 1. Tariff rates.
0.0
5.1
.15
.2.2
5.3
1996 1997
4041
4243
4445
4647
4849
5051
5253
5455
5657
5859
6061
6263
6465
4041
4243
4445
4647
4849
5051
5253
5455
5657
5859
6061
6263
6465
Tariff rates, males
Other Old age UnemploymentDisability Balancing
2.3. Firm size related experience rating: the system and the reforms
There has been a firm size related experience rating, i.e. the firms have been partly liable for
the unemployment and disability pension costs, but this liability has decreased the tariff rates
the firms have paid. The experience rating was dependent on firm size, with different size
dependency in unemployment and disability pensions. (The other components, old age
pension, balancing, and other rates were not experience rated.7) Firms with less than 50
employees paid only a fixed pension contribution rate (0.213 in 1997), shown as the dashed
7 However, part of the component ‘other’ depends on the wage sum and in another component there is a rebate for firms with more than 300 employees. These are very small components.

10
horizontal line in Figure 1, so they were not subject to experience rating, nor had they age-
dependence in the contribution rates.
Above a lower size threshold and until an upper threshold the firms were partly directly liable
for the unemployment pension outlays of their former workers and partly paid the standard
contribution rate. From size 50 employees to 300 employees a firm of size N paid the share
aU=0.5*min(1,(N-50)/(300-50)) of the unemployment pension liability for the ages from 60 to
65 years and the share 1-aU of the normal unemployment pension contribution rate. Firms
with 300 or more employees were liable for 50% of the unemployment pension, and paid 50%
of the pension contribution rate (see Figure 2).8 The unemployment pension contribution, and
therefore also the experience rating, applied only to those workers who were in the age group
eligible for the unemployment pension. In case the firm had to pay the pension liabilities, the
capitalized value of the liability was paid at once.
The experience rating has interacted with the age structure of the employees. The effects of
the change in the eligibility to unemployment pension likely depend on firm size, since in
case of layoffs the monetary costs have been lower for the smaller firms due to experience
rating.
For disability pensions there was a partial experience rating which was similar to the one used
in the unemployment pension system, but with different firm size limits. Until 1995 the lower
size limit in the disability pension was 300 employees and from size 1000 the firms were fully
liable for the disability pension. The share parameter was therefore aD=min(1,(N-300)/(1000-
300)). The firms with at least 50 but less than 300 employees paid only the age-dependent
disability pension contribution rate. In 1996 the lower size limit was decreased to 50, so the
new share parameter was aD=min(1,(N-50)/(1000-50)).9
8 In late 1999 there was another reform where the upper size threshold was changed to 800 and the maximum liability share to 80%. In this case the share parameter was changed to aU=0.8*min(1,(N-50)/(800-50)). With the abolishment of the unemployment pension system, the experience rating has changed again and it has been transferred to unemployment insurance scheme. 9 In 2000 the size limits and maximum liability were harmonized with unemployment pension, so that the new share parameter was aD=0.8*min(1,(N-50)/(800-50)). In 2000 there was also another change aimed at improving the employment prospects of older workers. The firms’ disability pension liability was removed in cases where the worker had been hired at an age above 50 and the employment relationship had lasted for less than three years. From 2006 the rate the firms pay is a combination of an age-dependent basic tariff and a payment class tariff which depends on the past disability risk of the firm. The weights of the two tariffs depend on the sum of wages paid. The smallest firms pay the basic rate only and from a certain wage sum the weight of the payment class tariff increases linearly to 100 percent.

11
The disability pension liability applies to employment relationships that have lasted at least for
one year. The liability of the firms is in practice paid all at once, taking into account the interest
rate, probability of death and probability of return to work from disability. Usually the first year
of disability is covered from sickness insurance, so the pension liability typically starts from the
second year. However, in the case of individual early retirement the liability started at once.
Whether the experience rating has been beneficial for the firms or not, depends on the disability
risk of their employees. With high disability risk, experience rating is more expensive than the
pension contribution rate. Especially the larger firms have in practice been able to lower their
costs by hiring young workers who have low disability risk or by using preventive measures for
lowering the incidence of disability for the older employees. For the smallest firms the liability
for even a single disability case could be a big cost shock. They benefit from paying just a small
share of the liability, or just the basic rate in the case of the smallest firms.
Figure 2. Firm size and experience rating.
Figure 2 shows the relationship between firm size and liabilities before and after the reform in
the mid-1990s. For the smallest firms, those up to 50 employees, there has been no change.
The biggest change in experience rating of the disability pension happened for the firms
around the size 300, although all the firms from size 51 to 999 experienced a change.
Accordingly, the reform implied that the liabilities for new disability pensions became more
expensive especially for medium-size firms.
0.2
.4.6
.81
Exp
erie
nce
ratin
g
0 100 200 300 400 500 600 700 800 900 1000 1100
Firm size
Unemployment Disability -1995 Disability 1996-

12
3. THE VALUE OF HIRING
As the description above shows, there have been changes in both early exit systems at the
same time and the total impact on employees of different ages is unclear. Therefore it is
useful to analyze their effects using a simple model, which is similar to that in Behaghel et al.
(2008) in its basic structure, but it is modified to the present setting.
In this model the firm does not consider hiring a worker if the value of the hire is below the
hiring cost CH. The latter includes direct recruitment costs, but also initial training for the new
employee. The annual surplus from the employment relationship with a worker of age a is
sa = p – (1 + ta)w. (1)
The term p is productivity (value of output per one unit of annual labour), w wage, and ta the
age-dependent pension contribution rate. We assume both p and w to be constant in the
baseline model, but they could be assumed to change with age. The contribution rate is
ta = (1-aU)tUa+ (1-aD)tDa + tOa + tBa , (2)
where tUa and tDa are the unemployment and disability pension contribution rates,
respectively, and the a’s are the firm size dependent share parameters described above. tOa is
the old-age pension contribution rate and tBa is the balancing rate (which for simplicity
includes the component “other”). All the contribution rates are age-dependent, except if the
firm has less than 50 employees, in which case ta =t, a flat rate.
We assume that the worker will not become unemployed or disabled in the year when he is
hired. After that, there is an exogenous probability dU that there is a job loss e.g. because of
drop in demand. The worker of the destroyed job goes to the unemployment pension tunnel if
he is above the lower age limit LU. We assume that the person satisfies the employment
condition, i.e. he has long enough working career to be eligible. In case the worker becoming
unemployed is below the lower age limit LU, he starts to receive standard unemployment
insurance and the firm is not liable for the costs. However, we assume that in this case there is
a one-time ‘psychic’ firing cost to the firm. There is a probability dD that the worker becomes
permanently disabled and goes to disability pension and probability dI for a less severe

13
disability that leads to individual early retirement if the person is above the lower age limit
LD. The firm’s liability in both pensions is the capitalized value of its share of the annual
pension payments.
The value for the firm of hiring a worker of age a can be written as
Va = sa + (1 − dU − dD − dI1(a+1=LI))RVa+1
+ dUR{1(a+1=LU)*Unemployment pension liability}
+ dUR{1(a+1<LU)*Psychic firing cost}
+ dDR{Disability pension liability}
+ dIR{1(a+1=LI)*Individual early retirement pension liability} (3)
where R is the discount factor and 1(.) is an indicator function. The first line of equation (3)
gives the current surplus sa, i.e. productivity minus wage and pension contributions, and the
discounted future value RVa+1 in case of no unemployment or disability (but minor disabilities
are irrelevant if the person is below the age limit).
The second line of (3) is the discounted expected cost of unemployment for workers who can
go to the unemployment pension tunnel next year at age a+1. The cost is the discounted (to
age a+1) value of the annual liabilities from ages 60,…,64 until the person retires at age 65,
or from a shorter period if unemployment starts at an age 59 or higher. Because of experience
rating, the firm has to pay a share aU of the costs of the unemployment pension. We assume
that the amount of the unemployment pension the worker obtains is a share g of the wage in
each year, so the firm’s liability is the capitalized value of its share of the annual pension
payments aUgw (see the Appendix).10 The third line is the discounted expected psychic cost of
firing those who are below the age limit when they become unemployed at age a+1. The cost
is assumed to be share b of the wage, i.e. bw.
The fourth line in (3) is the expected cost of disability at age a+1, which is the expected
capitalized value of the disability pension liability from age a+2 to 64 (see the Appendix)11.
The fifth line is the corresponding expected cost of individual early retirement. This is the 10 From the point of view of the calculations it is irrelevant whether we assume that the firm pays the capitalized value of the liability at once (as is done in practice), or whether it pays annual payments which are discounted. 11 We assume that disability does not happen during the year when the worker is hired, so the condition of one year tenure is satisfied.

14
capitalized value of liabilities from age a+1 to 64. We assume the annual pension in both
types of disability to be share g of the wage (for simplicity, the same as in the unemployment
pension), so the annual liability is aDgw.
Unemployment or disability that hits at higher ages than a+1 is implicitly included in the term
(1 − dU − dD − dI1(a+1=LI))RVa+1. The worker retires at age 65 and the value of hire at that
age is zero. The value of hire one year before retirement at age 64 is just the current surplus
s64, since there is no future period to be discounted prior to retirement to old-age pension and
no unemployment or disability in the hiring year. Working backwards we can then solve the
value for all hiring ages.12
In principle when deciding whether to hire a particular worker or not, the firm would compare
the value of hire (3) to hiring costs (including training costs) to judge whether at least the
hiring cost can be covered, i.e. it has to hold that Va ≥ CH . We have not modeled the
optimization behavior of the firm, which would involve choosing the worker with the highest
value of hire net of hiring costs. In a more complete model one could also include the
determinants of the need to hire and possible substitutability of workers of different ages.
However, our purpose is just to get an understanding how the policy reforms have affected the
age-related hiring incentives.
To examine the reforms, we pick up some parameter values that reflect the situation. We
normalize the wage at w=1. Productivity is assumed to be constant p=1.3.13 The discount
factor is set at R=0.97 which roughly corresponds to the interest rate, 3 percent, used in the
Finnish pension system during the period of study. Since we assume no inflation, this is also
the real interest rate. The job loss probability is set at dU=0.05, which is close to the average
unemployment risk among the employees whose age is over 50. In practice, the probability of
12 A quit rate could easily be included in the model, but it would not change the conclusions. A quit rate falling with age would improve the relative value of hire of the older employees. 13 There is evidence that productivity growth slows down with age, or productivity may even decline at higher ages (e.g. Ilmakunnas et al., 2010). On the other hand, pay systems generally guarantee an upward sloping wage profile. Taking these features into account would make the returns from hiring older employees to decline even faster with age than in our model calculations. Another firm size related issue has been discussed in the literature on back-loaded compensation (e.g. Hu 2003; Adams and Heywood 2007). Long employment contracts are likely to be more important for large firms, since large firms typically invest more in firm-specific human capital introducing higher fixed training costs. One may also assume that in larger firms the monitoring costs rise above the similar costs in smaller firms making steeper wage-tenure profiles more likely. On theoretical grounds larger firms would therefore be less likely to hire old employees than small firms and the pension reforms might have a bigger effect on them than on smaller firms.

15
job loss increases clearly with age as the firms have been using the unemployment pension
tunnel. However, this is a choice variable for the firm. To avoid the need to model an optimal
layoff policy, we use a fixed value in the simulations. The probability of permanent disability
is assumed to be 0.005 at age 40, and thereafter it increases in a piecewise linear fashion at an
increasing rate, reaching 0.15 at age 64. These values roughly approximate the actual
development of disability risk by age. It is assumed that the probability of a mild disability
that leads to individual early retirement, if the age condition is satisfied, is 0.01. The lower
limit of the unemployment pension tunnel is set at values given by the Finnish legislation in
various years, 53 pre reform and 55 post reform. To illustrate the individual early retirement,
we use the 1994 age limit 55 years for the pre reform and 58 for the post reform period. We
assume that the workers receive half of the wage as pension, i.e. g=0.5, and the share that the
firm pays varies according to the actual firm size based rules explained above. The 50%
pension replacement rate is close to the actual one for workers with some career interruptions
and retirement in their early 60s.14 The psychic firing cost is assumed to be half of the wage,
i.e. b=0.5. There are no actual estimates of this, but we use the value 0.5 for simplicity. It has
relatively little impact in the simulations.
For the different age-dependent pension contribution rates we use the values for males in
1996-1997 (Figure 1, after deducting the employees’ share). To distinguish between the
different reforms and changes in contribution rates we conduct model calculations in several
steps. First, we assume that only a change in the unemployment pension system is introduced.
This involves an increase in the age limit and removal of the unemployment pension
contribution rate for the affected ages. However, we assume that the balancing rate is
increased correspondingly, so that the total contribution rate does not change. In practice, we
use the 1997 contribution rates for the unemployment pension, the 1996 rates for the old age
and disability components and calculate an artificial balancing rate that keeps the total rate at
the 1996 level.
Second, we assume that only changes in the disability pension system are introduced. This
involves an increase in the lower age limit to individual early retirement, a decrease in the
disability pension contribution rates, and a change in experience rating (towards more linear
cost dependence by firm size). Again, we use the 1997 values for the disability pension
14 In practice the replacement rate typically increases with retirement age as those retiring at older ages are likely to have longer work history.

16
contribution rates, 1996 values for the old age and unemployment components (including the
1996 age limits) and the total rate, and calculate an artificial balancing rate.
Third, we assume that there is no change in the unemployment and disability pension systems,
but there is a decrease in the old age pension contribution rate and in the total tariff rates,
which corresponds to the change from 1996 to 1997. Any change in the total rate not
explained by the drop in the old age pension contribution rate is assumed to be caused by a
drop in the balancing rate. Finally, we take into account all of the changes and compare the
pre and post reform situations.
In all of the model calculations we assume that the policy changes are not anticipated by the
firms, i.e. the pre-reform calculations are based on the assumption that the firms expect the
same rules to apply in the future. The model calculations are illustrated in Figures 3-6. The
solid lines show the value of hire before the reforms. The value is generally declining with
age, reflecting the shortening time span over which surplus can accrue from the employment
relationship. If there are fixed hiring costs, this means naturally that the incentives for hiring
fall with age, since the value of hire is less likely to exceed the hiring cost. The bump in the
curves is caused by the age limits to unemployment pension.15
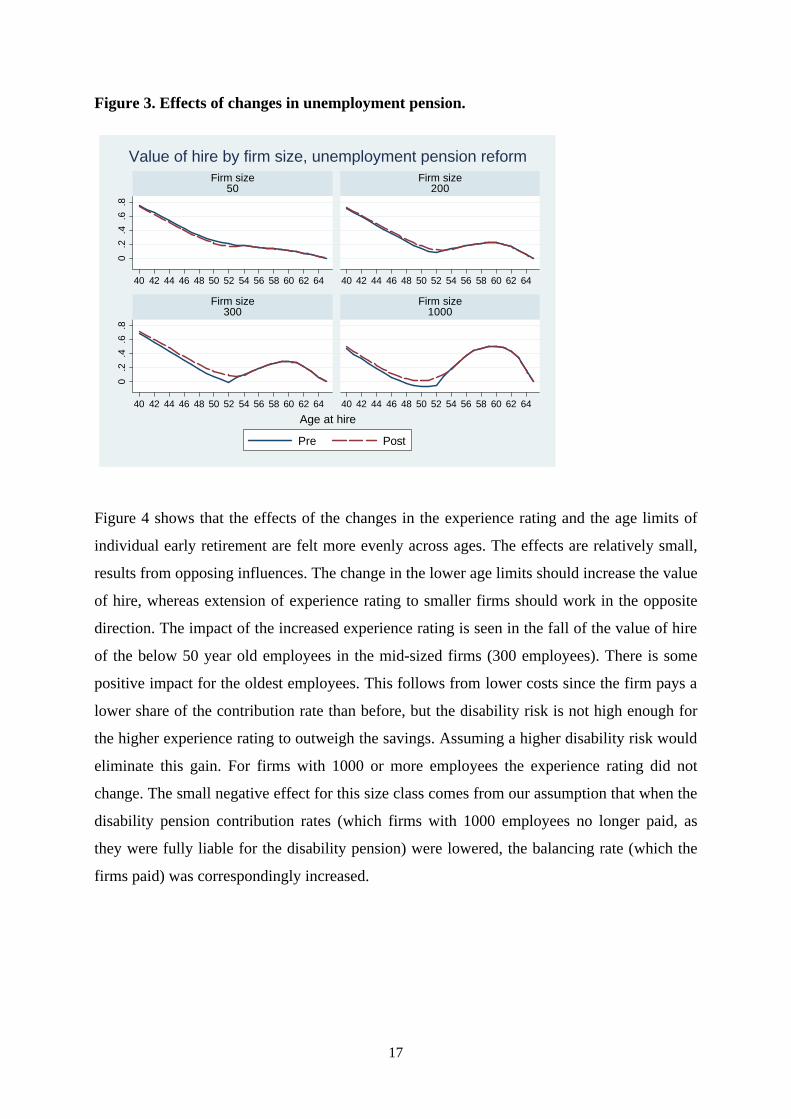
According to Figure 3, the unemployment pension reform alone has had a small negative
impact on the value of hiring in the smallest firms. Since these firms are not subject to
experience rating, the effect comes from the psychic firing cost that is now higher, as two age
groups are no longer eligible to the unemployment pension in case of layoffs. For the larger
firms the impacts are positive, since they are not subject to experience rating for the 53-54
year olds who become unemployed. In the largest firm size in the figure, 1000 employees, the
parameter values used imply a negative value of hiring for some ages, but it becomes positive
after the reform. The kink in the curve, at the age when the age limit to the tunnel starts biting,
shifts to the right by two years. The impact ceases at the age when the new age limit of the
unemployment tunnel becomes effective, but it is felt also at ages, especially 50-52, which
were not directly affected by the reform. This is a result of forward-looking behaviour of the
firms.
15 For an employee hired at age 40 the value of hire for the first year is roughly 0.1 (productivity minus wage and pension contribution). Therefore, the vertical axis of the graph shows that the expected discounted value of hire for this employee is 5-8 times the first year’s value, depending on firm size.
17
Figure 3. Effects of changes in unemployment pension.
0.2
.4.6
.80
.2.4
.6.8
40 42 44 46 48 50 52 54 56 58 60 62 64 40 42 44 46 48 50 52 54 56 58 60 62 64
40 42 44 46 48 50 52 54 56 58 60 62 64 40 42 44 46 48 50 52 54 56 58 60 62 64
Firm size50
Firm size200
Firm size300
Firm size1000
Pre Post
Age at hire
Value of hire by firm size, unemployment pension reform
Figure 4 shows that the effects of the changes in the experience rating and the age limits of
individual early retirement are felt more evenly across ages. The effects are relatively small,
results from opposing influences. The change in the lower age limits should increase the value
of hire, whereas extension of experience rating to smaller firms should work in the opposite
direction. The impact of the increased experience rating is seen in the fall of the value of hire
of the below 50 year old employees in the mid-sized firms (300 employees). There is some
positive impact for the oldest employees. This follows from lower costs since the firm pays a
lower share of the contribution rate than before, but the disability risk is not high enough for
the higher experience rating to outweigh the savings. Assuming a higher disability risk would
eliminate this gain. For firms with 1000 or more employees the experience rating did not
change. The small negative effect for this size class comes from our assumption that when the
disability pension contribution rates (which firms with 1000 employees no longer paid, as
they were fully liable for the disability pension) were lowered, the balancing rate (which the
firms paid) was correspondingly increased.

18
Figure 4. Effects of changes in disability pension.
0.5
10
.51
40 42 44 46 48 50 52 54 56 58 60 62 64 40 42 44 46 48 50 52 54 56 58 60 62 64
40 42 44 46 48 50 52 54 56 58 60 62 64 40 42 44 46 48 50 52 54 56 58 60 62 64
Firm size50
Firm size150
Firm size300
Firm size1000
Pre Post
Age at hire
Value of hire by firm size, disability pension reform
Figure 5. Effects of changes in total tariff rates.
0.2
.4.6
.80
.2.4
.6.8
40 42 44 46 48 50 52 54 56 58 60 62 64 40 42 44 46 48 50 52 54 56 58 60 62 64
40 42 44 46 48 50 52 54 56 58 60 62 64 40 42 44 46 48 50 52 54 56 58 60 62 64
Firm size50
Firm size200
Firm size300
Firm size1000
Pre Post
Age at hire
Value of hire by firm size, tariff change
Figure 5 shows the effects of the tariff changes. The value of hire increases in the ages most
affected, but also to some extent at younger ages. The impacts seem to be relatively similar
for all firm sizes. Since the firms with less than 50 employees have paid a flat rate, which
changed very little, the change in the total rate did not affect them.

19
Figure 6 shows the combined effects of all of the changes. With the parameter values chosen
the impacts of the reforms were biggest for the largest firms. For the smallest firms there was
a small positive change, which according to the other graphs is related to the tariff change.
For the mid-sized firms the impacts of the reforms were felt over a wide age range, but the
biggest positive impact is in the ages just above 50. According to the previous graphs, this is
related to tariff changes and to the increase in the age limit to unemployment pension, but the
latter effect probably dominates. The positive effects of the disability and individual early
retirement pension reforms are felt at somewhat older ages. The fact that the value of hire is
low, or even negative for some ages in the largest firms, reflects the relatively high disability
risk of the older employees.
Figure 6. Combined effect of all changes.
0.2
.4.6
.80
.2.4
.6.8
40 42 44 46 48 50 52 54 56 58 60 62 64 40 42 44 46 48 50 52 54 56 58 60 62 64
40 42 44 46 48 50 52 54 56 58 60 62 64 40 42 44 46 48 50 52 54 56 58 60 62 64
Firm size50
Firm size200
Firm size300
Firm size1000
Pre Post
Age at hire
Value of hire by firm size
To study the robustness of the simulations to the key assumptions, we have conducted some
sensitivity analyses, which are reported in the appendix. Overall, our main conclusions remain
intact when we vary the unemployment risk in a reasonable range. However, the effects of the
disability pension are more sensitive to assumptions about disability risk. With a disability
risk that increases less with age, there is more gain in the value of hire from the reforms.
However, in these cases the biggest positive effects appear at higher ages than the effects of
the unemployment pension reform.

20
4. THE DATA
In the empirical analysis we use data drawn from the Finnish Linked Employer–Employee
Data (FLEED). The FLEED data set merges comprehensive administrative records of all
labour force participants in Finland as well as all employers (firms and their plants) subject to
value added tax. The data on individuals cover the whole working age population and have
information on the employer plant and firm codes at the end of the year. The codes allow
linking of data on individuals to employers with near-perfect tractability over time. We use a
sample of FLEED, with such information on firms and plants that guarantees that the
employers cannot be identified. Every third individual in age group 16-69 years is randomly
included in the sample in the year 1990. This sample includes ca. 1 million individuals. For
these individuals, information from the subsequent years is included. Starting from 1991, in
each year a third of all 16 years old persons are selected to the sample and these individuals
are included in the sample in all subsequent years. For each individual in each year, the data
on the plant and firm that he is working in is included. In addition, data on these plants and
firms are included for all the years.
We concentrate on the private non-farm business sector. Using firms as the observation units,
we calculate the number of hired and exited workers of different ages. We define hiring and
exit on the basis of both firm and plant codes. A person is hired from non-employment
(unemployment or outside the labour market) if his firm and plant codes are missing at the
end of year t-1, but they exist at the end of year t. Similarly, exit to non-employment means
that both codes are missing in t, but existed in t-1. A job-to-job hiring (and exit) implies that
both firm and plant codes change from year t-1 to t. In these cases we can be fairly sure that a
hiring (and/or exit) has happened. There are, however, several unclear cases. If the plant code
changes, but the firm code not, the person is most likely switching from one plant to another
within the same firm, which would not be a hiring at the firm level. If the firm code changes,
but the plant code not, a likely explanation is that the plant has been sold to another firm. We
do not take this into account since these hires or exits would not be quite comparable to other
hires and exits. There may also be other explanations for the changes in firm codes like
changes in the legal form of the firm or mergers of two firms. In this kind of demographic
events the plant codes are more stable than the firm codes. Another kind of uncertain event is
such that either the firm or plant code is missing. We do not define a change in the firm code
as hiring or exit, if the plant code is missing either in year t-1 or t. Similarly, a change in plant

21
code is not defined as hiring or exit, if the firm code is missing in either period. Further, we
examine only continuing firms, leaving out the first year of entering firms and the exit of
disappearing firms. In case of gaps in the data for continuing firms, the year after the gap is
left out.
For the firm-level analysis we have information on the characteristics of the firms, e.g. size
class, productivity, employment growth rate, and industry. We also have data on the average
workforce characteristics, calculated from the total FLEED data. These variables are average
age, tenure, and education years of the employees.16
16 These explanatory variables are based on the total FLEED data and for example firm size class is based on the actual number of employees and not on their number in the sample data. The industry of a firm is based on the industry classifications of all of its establishments. A firm can therefore operate in several industries.

22
5. EMPIRICAL ANALYSIS
We concentrate on the age groups and firm sizes that according to the model predictions have
the highest changes in incentives following the policy changes. We conduct a differences-in-
differences-in-differences analysis, applying differences between age groups, between firm
sizes, and over time.
We compare firms in different size classes, 10-49 employees (reference group), 50-99, 100-
299, and 300-.17 Firms with less than 10 employees are left out, since their likelihood of
hiring is small, especially when we disaggregate hiring by age. The size classes may not
exactly correspond to the official definitions of firm size in the pension contribution
calculations. In any case, since we do not use exact information on the share parameters in the
estimation, the measurement error should not be too problematic. In the reference size group
the changes in incentives have been very small.
From the model in the previous section it is clear that the reforms have likely affected several
age groups, not only those, 53-54 year olds, who were no longer eligible for the
unemployment tunnel, or the 55-57 year olds who were no longer eligible for individual early
retirement. Therefore we cannot use methods which are based on a sharp cut-off point in
eligibility. Instead, we use alternative two-year age groups, 49-50, 51-52, 53-54, and 56-57,
and compare them to each other and to groups less likely to have been affected, 47-48 and 58-
59. In the smallest firm size class the only impact of the unemployment pension reform was
the possible psychic firing cost and changes in the disability pension had no effects, and the
change in the flat tariff was minuscule. Therefore, we can compare the affected age groups in
firms of different sizes to the 47-48 and 58-59 age groups in the smallest firms, i.e. to a
control group that has hardly been affected by the reforms. We use two-year groups to have
more non-zero observations. Those who are 55 year old are not included, since they were
eligible for individual early retirement in only some of our pre-reform years.
It is possible that the reforms have been anticipated in the firms’ and employees’ behaviour.
To examine this, we show in Figure 4 the share of firms hiring new employees in different
17 These size classes are dictated by the rules of confidentiality of Statistics Finland. We cannot directly examine the possible effects of the upper size limit 1000 in the experience rating of the disability insurance. However, the number of firms with over 1000 employees would in any case be fairly small.

23
age groups. Since we will explain a dummy for having hiring in an age group, this is the
average of the dependent variable. Different birth cohorts have different sizes, which may be
reflected in the probability of hiring. Therefore we have scaled the share of hiring firms by the
share of firms employing workers in the age group in question. There should be no cohort
effect in the ratio.
The share of hiring firms declines with age and there has been a general decline in the shares in
the earlier part of the period, with an increase in the latter part. The hiring was particularly low
during the year 1996 prior to the increase in the age limit of the eligibility to unemployment
pension. A corresponding figure for exits would show an increase in 1996. There are thus clear
anticipation effects (see also Kyyrä and Wilke, 2007). The firms have laid off workers who after
the reform would no longer have been eligible to the unemployment pension and to some extent
the workers themselves have elected to go to the unemployment pension tunnel when it was still
available for them. Correspondingly there were fewer hires just before the reform. Because of
these effects it is advisable to leave the year 1996 out of the examination. We therefore compare
in the analysis the period 1997-1998 (post reform) to the period 1994-1995 (pre reform).
Figure 4. Share of firms hiring older employees in relation to share of firms employing them.
.05
.1.1
5.2
.25
1994 1995 1996 1997 1998
47-48 49-50 51-5253-54 56-57 58-59
Share of firms hiring / Share of firms employing

24
We organize the data so that the observation unit is firm-year-age combination. In each
estimation we compare a two-year age group, say 53-54, to another two-year group, say 47-
48. The outcome variable is the probability of hiring employees in the age group under
consideration. In a particular year each firm appears four times (in this example, ages 47, 48,
53, and 54 are separate lines in the data set), but the explanatory variables are the same for the
firm in that year.
We estimate linear probability models of the following form:
yijt = α + τt + βREFORMt + ΣjγjSIZEjt + φTREATi + ΣjρjREFORMt*SIZEjt +
ϕREFORMt*TREATi + ΣjλjSIZEjt*TREATi + ΣjδjREFORMt*SIZEjt*TREATi + Xjtθ+ εijt
where yijt equals 1 if there has been hiring of age i in firm j in year t, REFORMt is 1 in 1997-
1998 and zero in 1994-1995, SIZEjt are dummies for the firm size classes, TREATi is an
indicator for the two-year age group examined as the treatment group (there are always two
different values of i in the treatment and two in the comparison group), τt are year dummies,
and Xjt is a vector of control variables.
The coefficients of interest are the δj’s, which tell the impact of the reforms in different firm
size classes. The identifying assumption is that the exogenous reforms have different impacts
on the costs of firms of different sizes, and the firms do not determine their size on the basis
of the costs. The assumption of exogenous size seems reasonable, since small changes in firm
size do not lead to big savings in costs, and large changes would involve other additional
costs. The biggest change would be growth from just below 50 to 50 employees. Since we use
fairly wide firm size classes the likelihood of switching size class is in any case low.
The year dummies are included to account for cyclical changes. The year dummies and the
treatment period dummy and its interaction with the treatment group dummy also take care of
differences between the cohort sizes. In the vector of control variables we include industry
dummies for 24 two-digit industries, characteristics of the work force (average age, education,
and tenure lagged by one period), lagged employment change, and an indicator for having
used the unemployment pension tunnel in the previous year. The last variable is based on exit
to unemployment of such employees that are according to their age eligible to the

25
unemployment pension tunnel. The standard errors are corrected for clustering at the firm
level.18
Table 2 shows the results. The four two-year age groups that are examined as alternative
treatment groups are in separate columns and the comparison age groups and firm size classes
appear in the rows. When the group 53-54 is compared to the age group 47-48, it appears that
there is no difference in the probability of hiring. For the largest size class, 300-, there is an
increase of 3.1 percentage points compared to the reference group, 10-49 employees, but it is
significant only at the 10.7 percent level. The comparison to the 58-59 year olds gives an
otherwise similar result, except that now the 3.0 percentage point increase in the largest size
class is significant. In the age group 56-57 there is no significant change in hiring. In contrast
to these age groups which were directly affected by the reforms, we find more significant
effects in the younger age groups. There is a significant increase in the probability of hiring
51-52 year olds. Furthermore, this effect increases with firm size, exactly as the model
simulations predict for the unemployment pension reform (and the combined effects of all of
the reforms). The increase is 4.6 percentage points in the size class 300- and 1.2 percentage
points in the class 50-99 employees, compared to the reference size class. The result is fairly
similar irrespective of the comparison age group. There is an increase even in the probability
of hiring 49-50 olds, but these effects are significant only in the largest firms, where the
probability of hiring has increased by 3.5 percentage points in comparison to the smallest
firms.
Overall, the results are consistent with our expectations. They also confirm that using only
those directly affected by the reform, i.e. 53-54 year olds and 55-57 year olds, is not a quite
appropriate choice for a treatment group, if the firms are forward-looking in their hiring
behaviour. The fact that the results are consistent with the model simulations for the
unemployment pension reform, but less with those for the disability pension reform or the
tariff decrease (which implied more neutral results) shows that the effects of the former
reform dominate the results.
18 The number of firm-year-age observations is 156 744 from 14 599 separate firms. The panel is not balanced, as firms may have missing values in some of the years.

26
Table 2. Reform effects on the probability of hiring by age group and firm size, 1997-1998 vs. 1994-1995. Comparison Firm size Treatment group group 49-50 51-52 53-54 56-57 47-48 50-99 0.003 0.012 -0.004 -0.003 (0.008) (0.007)* (0.007) (0.006) 100-299 0.017 0.036 0.009 0.001 (0.011) (0.011)*** (0.010) (0.010) 300- 0.035 0.046 0.031 0.010 (0.020)* (0.020)** (0.019) (0.019) 58-59 50-99 0.004 0.014 -0.003 -0.001 (0.006) (0.005)** (0.005) (0.004) 100-299 0.014 0.032 0.005 -0.003 (0.009) (0.008)*** (0.007) (0.004) 300- 0.034 0.045 0.030 0.009 (0.017)** (0.016)*** (0.015)** (0.013)
Note: Standard errors in parentheses, corrected for clustering at firm level. Significance: * 10%, ** 5%, *** 10%.
We briefly describe the results on the control variables without presenting them in the
tables. Firms with a high average age of employees have a higher probability of hiring, but
high educational level and high average tenure are negatively related to hiring. Some firms
may have a policy of having a relatively old work force, which then is reflected also in their
hiring patterns. Growing firms (in the previous period) are more likely to hire, as expected,
and firms that have used the unemployment tunnel in the past are more likely to hire. The
latter result may be related to the fact that when a firm typically hires and has older
employees, it also tends to have their exits, some of which are exits to unemployment. Since
the age groups used in the estimations are fairly narrow, these results do not give a complete
picture of the factors associated with hiring a broadly defined group of old workers, e.g. 50-
64 year olds.
As a robustness check we estimated the model with fixed effects. Most of the coefficients
were fairly similar to those in Table 2, but their significance dropped. We still got the result
that there are significant effects on hiring in the age group 51-52 years, but the most
significant results were for firm size 100-299. As another robustness check we estimated the
model using 1993-1994 instead of 1994-1995 as the pre-reform period, since there may have
been anticipation effects already 1995. (On the other hand, 1993 was still a recessionary year,
so this period is not completely ideal either.) The results again showed that there were
significant hiring effects in the age group 51-52 in large firms. However, in this case the

27
largest (and significant) effects were for 49-50 year olds in firms with over 300 employees,
where the probability of hiring increased by 4.9 percentage points compared to 47-48 year
olds and 6.3 percentage points compared to 57-58 year olds.
28
6. CONCLUSIONS
We have examined the effects of pension reforms on the incentives of firms to hire older
employees. The particular reforms studied were changes in the eligibility age to
unemployment pension and individual early retirement in the 1990s in Finland. In principle,
this should have affected the age groups directly in question, i.e., 53-54 year olds and 55-57
year olds who were no longer eligible to early exit, but because there was firm-size related
experience rating, the impacts should vary by firm size. The evaluation of the impacts of the
reform is challenging, since at the same time there was a change in the firm size limits in the
experience rating of disability insurance. To get an a priori idea of what kind of impacts to
expect, we formulated a simple model for the value of a new hire for a firm. The model uses
parameter values that are close to those used in the pension insurance at that time. The model
shows that in forward-looking firms the impact of the reforms is felt already in worker age
groups that are below those directly affected by the reforms and the impacts vary by firm size.
In addition, the impacts of the disability pension reform are more evenly spread across ages.
The conclusion is that it is not possible to use sharp age limits in the evaluation of the reform.
In the empirical analysis we found, using linked employer-employee data, that there was an
increase in the probability of hiring of older employees, especially in age groups 51-52 year
old that were just below those directly affected by the eligibility change. The reform effects
are strongest in larger firms. All in all, our findings confirm to the predictions of the model,
especially in case of the unemployment pension reform.
The policy conclusion from the analysis is that the hiring side of the older workers’ labour
market has received too little attention. Most analyses of policy changes concentrate on the
impacts on retirement behaviour or unemployment risk. It is true that among the older
workers, exits are the predominant form of mobility. Indeed, in related work (Ilmakunnas and
Ilmakunnas, 2010), we show that the share of older employees in exits is comparable to their
share of all employed, but they are underrepresented in hires. As in most industrialized
countries there are both increasing pressures to lengthen the working careers and at the same
time increasing volatility in the labour market due to globalization, the incentives for hiring
older workers should play an important role. Our results show that these incentives can be
affected by changes in the early retirement systems.

29
REFERENCES
Adams, S.J., “Age discrimination legislation and the employment of older workers”, Labour
Economics 11, 2004, 219-241.
Adams, S.J. and Heywood, J.S., “The age of hiring and deferred compensation: evidence from
Australia”, Economic Record 83, 2007, 174-190.
Behaghel, L., “La protection de l’emploi des travailleurs âgés en France: une évaluation ex ante de la
contribution Delalande”, Annales d’Economie et de Statistique, No. 85, 2007, 41-80.
Behaghel, L., Crépon, B., and Sédillot, B., “The perverse effects of partial employment protection
reform: The case of French older workers”, Journal of Public Economics 92, 2008, 696-721.
Boockmann, B., Zwick, T., Ammermüller, A., and Maier, M., “Do hiring subsidies reduce
unemployment among older workers? Evidence from two natural experiments”, Journal of the
European Economic Association, forthcoming.
Daniel, K. and Siebert, W.S., “Does employment protection reduce the demand for unskilled labour?”,
International Economic Journal 19, 2005, 197-222.
Garen, J., Berger, M., and Scott, F., “Pensions, non-discrimination policies, and the employment of
older workers”, Quarterly Review of Economics and Finance 36, 1996, 417-429.
Hairault, J.-O., Langot, F., and Sopraseuth, T., “Distance to retirement and older workers’
employment: The case for delaying the retirement age”, Journal of the European Economic
Association 8, 2010, 1034-1076.
Hakola, T. and Uusitalo, R., “Not so voluntary retirement decisions”, Journal of Public Economics 89,
2005, 2121-2136 (a).
Hakola, T. and Uusitalo, R., “Eläkevakuutusmaksujen vaikutus rekrytointeihin ja irtisanomisiin” (The
effect of pension insurance fees on hiring and lay-offs; in Finnish), Finnish Center for Pensions,
Reports No. 2, 2005 (b).
Heywood, J.S. and Siebert, W.S., “Understanding the labour market for older workers: A survey”, IZA
Discussion Paper No. 4033, 2009.
Hu, L., “The hiring decisions and compensation structures of large firms”, Industrial and Labor
Relations Review 56, 2003, 663-681.
Hutchens, R., ”Delayed payment contracts and a firm’s propensity to hire older workers”, Journal of
Labor Economics 4, 1986, 439-457.
Ilmakunnas, P. and Ilmakunnas, S., ”Age segregation and hiring of older employees”, mimeo, 2010.

30
Ilmakunnas, P., Skirbekk, V., van Ours, J., and Weiss, M., “Age and productivity”, in P. Garibaldi,
J.O. Martins, and J. van Ours, eds., Ageing, Health, and Productivity: The Economics of Increased
Life Expectancy, Oxford: Oxford University Press, 2010, 133-240.
Ilmakunnas, S. and Takala, M., ”Promoting employment among ageing workers: Lessons from
successful policy changes in Finland”, Geneva Papers on Risk and Insurance – Issues and Practice
30, 2005, 674–692.
Kyyrä, T. and Ollikainen, V., “To search or not to search? The effects of UI benefit extension for the
older unemployed”, Journal of Public Economics 92, 2008, 2048-2070.
Kyyrä, T. and Wilke, R., “Reduction in the long-term unemployment of the elderly: A success story
from Finland”, Journal of the European Economic Association 5, 2007, 154-182.
Martins, P.S., Novo, A.A., and Portugal, P., “Increasing the legal retirement age: The impact on
wages, worker flows and firm performance”, IZA Discussion Paper 4187, 2009.
Saint-Paul, G., “Does the welfare state make older workers unemployable?”, IZA Discussion Paper
No. 4440, 2009.
Scott, F.A., Berger, M.C., and Garen, J.E., “Do health insurance and pension costs reduce the job
opportunities of older workers?”, Industrial and Labor Relations Review 48, 1995, 775-791.

31
Appendix A1. Derivation of the pension liabilities
The actual pension liabilities are based on detailed actuarial calculations. We approximate
them in the simulations in the way explained in this appendix. If age a+1 at which
unemployment occurs is above the lower limit of the tunnel LU, the person is on
unemployment compensation and its extension from age at which unemployment starts and
thereafter on unemployment pension from age 60 to age 64, and finally obtains normal
pension at age 65. The cost to the firm is the capitalized value (discounted to age a+1) value
of the annual liabilities from ages 60,…,64. This can be written as the difference of infinite
sequences
(R60-(a+1)+…+R64-(a+1))aUgw = {(R60-(a+1)+…) – (R65-(a+1)+…)}aUgw
= {R60-(a+1)/(1-R) – R65-(a+1)/(1-R)}aUgw = {R60-(a+1)(1-R65-(a+1)-(60-(a+1)))/(1-R)}aUgw
= {R60-(a+1)(1-R5)/(1-R)}aUgw. (A1)
If unemployment starts at age 59 or above the person is first on unemployment compensation
for two years and then on unemployment pension the rest of the time until age 64. Therefore
the period over which liabilities accrue is shorter. For example, if a+1=59, discounting is
from ages 61,…,64, and the capitalized value of the liabilities is (R61-59+…+R64-59)aUgw,
where the term in the parentheses is equal to R2(1-R4)/(1-R). In the general case we can write
the present value in a compact form as
Rmax(2,60-(a+1)){(1-R(65-(a+1)-max(2,60-(a+1)))/(1-R)}aUgw, (A2)
which incorporates all starting ages of unemployment (which are above LU). If a+1≥59,
max(2,60-(a+1)) equals 2, the time spent on unemployment compensation.
In case of permanent disability at age a+1, the firm’s liability starts after one year. The
disability pension liability is the discounted (to age a+1) sum of the annual liability from the
ages a+2,…,64. This can be written as
(R(a+2)-(a-1)+…+R64-(a+1))aDgw = {(R(a+2)-(a-1)+…) – (R65-(a+1)+…)}aDgw
= {R/(1-R) - R65-(a+1)/(1-R)}aDgw = {R(1-R65-(a+2))/(1-R)}aDgw. (A3)

32
In case of a milder disability that leads to individual early retirement (and age above the limit
LI) the firm’s liability starts at once, so the liability is {R(1-R65-(a+1))/(1-R)}aDgw.
Appendix A2. Sensitivity analysis of the simulations
To examine the sensitivity of the simulations, we examine in Figure A1 how the results for a
firm with 300 employees are affected by different unemployment risks. The base value is 0.05
in the upper right hand panel of the figure. Lower unemployment risk essentially makes the
effects of the unemployment pension reform insignificant, whereas increasing the risk, either
using a higher, but constant value or an unemployment risk that increases linearly with age,
give results that are fairly similar to the base case. Note that a high unemployment risk shifts
the curves down and makes the value of hire practically zero for those just before the age of
eligibility to the unemployment tunnel.
Figure A1. Sensitivity analysis, unemployment risk.
-.5
0.5
1-.
50
.51
40 42 44 46 48 50 52 54 56 58 60 62 64 40 42 44 46 48 50 52 54 56 58 60 62 64
40 42 44 46 48 50 52 54 56 58 60 62 64 40 42 44 46 48 50 52 54 56 58 60 62 64
Unemployment risk0.03
Unemployment risk0.05
Unemployment risk0.07
Unemployment risklinear;0.02-0.10
Pre Post
Age at hire
Value of hire by unemployment risk; firm size 300
Figure A2 shows a sensitivity analysis with respect to disability risk. The base case used in
the simulations is in the lower left hand panel of the figure. Using a constant disability risk
lowers the value of hire after the disability pension reform for those in their 40s, since in the
base case they have a fairly low risk, and increases the value for the older ones. Decreasing

33
the rate at which the disability risk rises increases the gains from the reform relatively evenly
for all ages below 60. In the lower right hand panel the risk is the risk in the base case plus
0.01. This has the result of lowering the value especially for the younger ones.
Figure A2. Sensitivity analysis, disability risk.
0.2
.4.6
.80
.2.4
.6.8
40 42 44 46 48 50 52 54 56 58 60 62 64 40 42 44 46 48 50 52 54 56 58 60 62 64
40 42 44 46 48 50 52 54 56 58 60 62 64 40 42 44 46 48 50 52 54 56 58 60 62 64
disability riskconstant;0.05
disability riskincreasing;0.005-0.11
disability riskincreasing;0.005-0.15
disability riskincreasing;0.015-0.16
Pre Post
Age at hire
Value of hire by disability risk; firm size 300