hispanic market overview
TRANSCRIPT

LOCAL MEDIAKIT
HispanicMarket Overview
ARIZONA DAILY STAR RETAIL ADVERTISING DEPARTMENT
4850 S . PARK AVE. TUCSON, AZ 85714 • (520) 573-4366

Arizona Daily Star—Helping you build brand familiarity with the vital and growing Hispanic market.
At one million people, the Tucson Metropolitan Area has become a greater factor in the national economy in the past year. Representing the 52nd largest metropolitan area in the country, coupled with hitting the magic million mark, affords Tucson much national attention. Much of the growth to reach that mark has been due to the burgeoning Hispanic population.
Hispanic Market GrowthSouthern Arizona benefits from a strong sense of culture and represents the 29th largest Hispanic market in the country. As a top 30 market based on Hispanic population, the Tucson area has an even greater national presence than when considering the general population. Hispanics are a vital and growing part of our economy. In fact, the Hispanic market is expected to comprise 36% of Pima County’s population in 2015 – that’s 15% growth in the next five years compared with 9% growth for Pima County’s total population.
Sou
rces
: C
lari
tas
20
10
Rank CBSA 2010 HispanicPopulation
2015 HispanicPopulation
5 Year Growth
5 Year % Growth
1 Los Angeles-Long Beach, CA 5,930,639 6,404,431 473,792 8%
2 New York, NY-NJ-PA 4,170,858 4,446,585 275,727 7%
3 Miami-Fort Lauderdale, FL 2,226,330 2,512,361 286,031 13%
4 Houston-Sugar Land-Baytown, TX 2,037,341 2,418,169 380,828 19%
5 Riverside, CA 1,981,374 2,433,042 451,668 23%
6 Chicago, IL-IN-WI 1,959,600 2,198,542 238,942 12%
7 Dallas-Fort Worth-Arlington, TX 1,823,849 2,225,634 401,785 22%
8 Phoenix-Mesa-Glendale, AZ 1,400,447 1,731,401 330,954 24%
9 San Antonio-New Braunfels, TX 1,115,757 1,245,873 130,116 12%
10 San Diego-Carlsbad, CA 974,390 1,103,610 129,220 13%
11 San Francisco-Oakland, CA 905,840 1,005,451 99,611 11%
12 Washington, DC-VA-MD-WV 690,491 832,755 142,264 21%
13 McAllen-Edinburg-Mission, TX 682,048 769,603 87,555 13%
14 El Paso, TX 627,800 675,843 48,043 8%
15 Denver-Aurora-Broomfield, CO 589,705 692,621 102,916 17%
16 Las Vegas-Paradise, NV 555,810 690,881 135,071 24%
17 Atlanta-Sandy Springs, GA 551,469 721,921 170,452 31%
18 Austin-Round Rock-San Marcos, TX 520,305 628,410 108,105 21%
19 Orlando-Kissimmee-Sanford, FL 508,217 652,966 144,749 28%
20 San Jose-Sunnyvale, CA 507,140 552,910 45,770 9%
21 Fresno, CA 461,669 524,970 63,301 14%
22 Tampa-St. Petersburg, FL 421,823 522,997 101,174 24%
23 Sacramento--Arden, CA 418,630 501,181 82,551 20%
24 Philadelphia, PA-NJ-DE-MD 411,652 473,860 62,208 15%
25 Bakersfield-Delano, CA 400,207 487,792 87,585 22%
26 Albuquerque, NM 389,511 433,851 44,340 11%
27 Boston-Cambridge-Quincy, MA-NH 378,758 425,624 46,866 12%
28 Brownsville-Harlingen, TX 350,633 384,175 33,542 10%
29 Tucson, AZ 346,545 399,974 53,429 15%
Hispanic M
arket G
row
th
HISPANIC MEDIAKIT

With the Mexican state of Sonora only 63 miles away, Tucson benefits from a global economy. 2.7 million Sonoran visitors travel to Tucson each year, spending more than $360 million. And, three out of four of these visitors are in Tucson to shop.
Did You Know...
• Residents from Mexico spend $990,000 on goods and services in Tucson every day – is your business getting its share?
• 95% of Mexican consumers who come to Tucson cross the border in Nogales.
• Each day, 1,300 vehicles make their way from Nogalesto Tucson, bringing 3,500 potential customers to your business.
• 87% of Mexican visitors to Tucson stay at least one night.
• Mexican consumers make an average of 1.3 visits to Tucson each year.
Sources: The Economic Impact of Mexican Visitors to Arizona 2007-2008
Tucson MSAand DMA
Sources: The Economic Impact of Mexican Visitors to Arizona 2007-2008
Sources: The Economic Impact of Mexican Visitors to Arizona 2007-2008
HISPANIC MEDIAKIT
Pro
ximity to
Mexico
What MexicanVisitors BuyWhen Shoppingin Tucson
Sources: The Economic Impact of Mexican Visitors to Arizona 2007-2008
HISPANIC MEDIAKIT
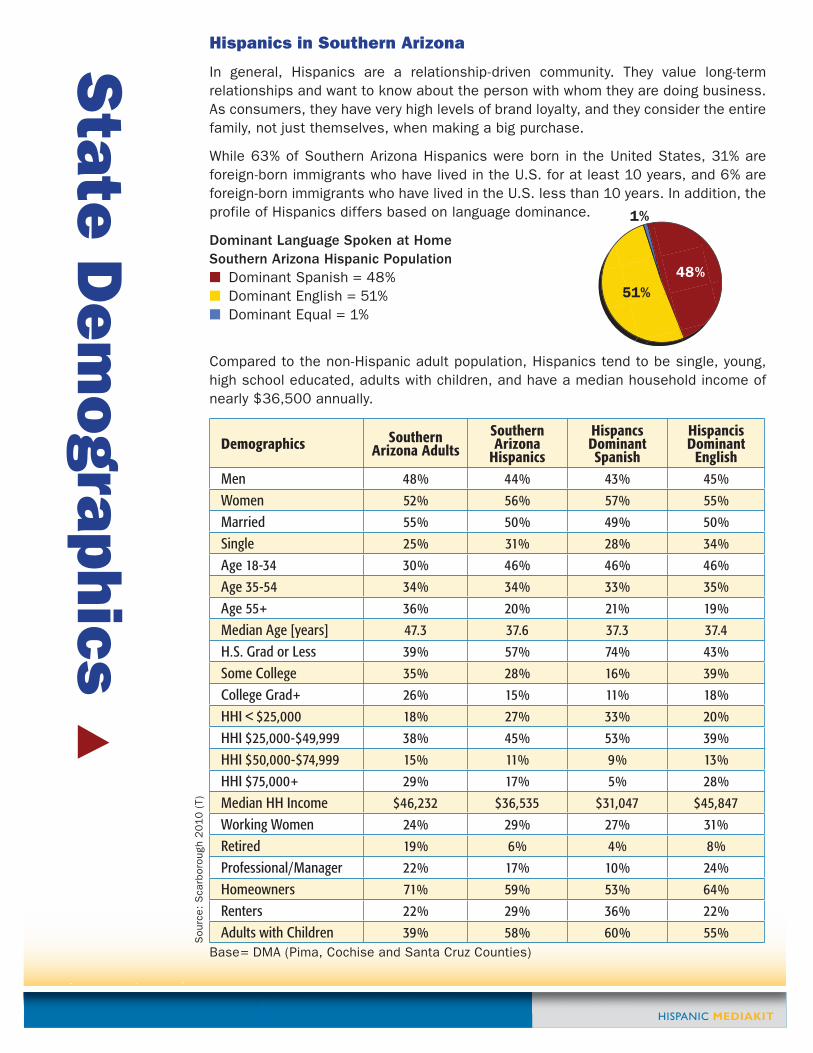
Hispanics in Southern Arizona
In general, Hispanics are a relationship-driven community. They value long-term relationships and want to know about the person with whom they are doing business. As consumers, they have very high levels of brand loyalty, and they consider the entire family, not just themselves, when making a big purchase.
While 63% of Southern Arizona Hispanics were born in the United States, 31% are foreign-born immigrants who have lived in the U.S. for at least 10 years, and 6% are foreign-born immigrants who have lived in the U.S. less than 10 years. In addition, the profile of Hispanics differs based on language dominance.
Dominant Language Spoken at HomeSouthern Arizona Hispanic Population■ Dominant Spanish = 48%■ Dominant English = 51%■ Dominant Equal = 1%
Compared to the non-Hispanic adult population, Hispanics tend to be single, young, high school educated, adults with children, and have a median household income of nearly $36,500 annually.
Demographics Southern Arizona Adults
Southern Arizona
Hispanics
HispancsDominant Spanish
Hispancis Dominant
EnglishMen 48% 44% 43% 45%Women 52% 56% 57% 55%Married 55% 50% 49% 50%Single 25% 31% 28% 34%Age 18-34 30% 46% 46% 46%Age 35-54 34% 34% 33% 35%Age 55+ 36% 20% 21% 19%Median Age [years] 47.3 37.6 37.3 37.4H.S. Grad or Less 39% 57% 74% 43%Some College 35% 28% 16% 39%College Grad+ 26% 15% 11% 18%HHI < $25,000 18% 27% 33% 20%HHI $25,000-$49,999 38% 45% 53% 39%HHI $50,000-$74,999 15% 11% 9% 13%HHI $75,000+ 29% 17% 5% 28%Median HH Income $46,232 $36,535 $31,047 $45,847 Working Women 24% 29% 27% 31%Retired 19% 6% 4% 8%Professional/Manager 22% 17% 10% 24%Homeowners 71% 59% 53% 64%Renters 22% 29% 36% 22%Adults with Children 39% 58% 60% 55%
Base= DMA (Pima, Cochise and Santa Cruz Counties)
Sou
rce:
Sca
rbor
ough
20
10
(T)
48%51%
1%
State
Dem
ographics

Sources: The Economic Impact of Mexican Visitors to Arizona 2007-2008
HISPANIC MEDIAKIT
Hispanics purchasing power will outpace that of the total U.S. population through 2020.• Between 2002 and 2020, personal consumption spending by Hispanics is projected
to increase at an annual rate of 9.1%, far exceeding the national growth rate of 6%.
• Hispanic buying power was estimated at $736 billion in 2005 and projected to be nearly $1.1 trillion in 2010.
• Hispanics in Arizona account for $31.1 billion, or 16 percent of the state’s total buying power.
How Southern Arizona Hispanics Spend Their Money
Hispanics vs Non-Hispanics MarketIndex Hispanics vs Non-Hispanics Market
Index
Shopping Habits Past 12 Months Household OwnsAny Audio/Video Store 98 SmartPhone 119Any Toy Store 123 Digital Video Recorder [DVR] 81Any Home Accessory Store 102 Satellite Radio System 75Any Jewelry Store 78 MP3 Player 103Any Pet Supply Store 99 Video Game System 115Any Furniture Store 101 Wireless/Cellular Service 95
Any Florist 86 Sports and Entertainment
Shopping Habits Past 3 months Visited Sea Word [San Diego} 133
Any Clothing Store 104 Attended R&B/Hip Hop Concert 133Any Sporting Good Store 105 Visited Disneyland 134Any Shoe Store 107 Casino Gambling 118
Plan to Buy in Next 12 Months Visited Nogales 217
Home 154 Ate at a Chinese Restaurant Past Month 131New Vehicle 140 Ate at Seafood Restaurant Past Month 105Used Vehicle 137 Ate at Fast-Food Restaurant Past Month 102Wireless/Cellular Service 62 Ate at Mexican Restaurant Past Month 95Smartphone 135 Play Basketball 89eReader(Kindle, Sony Reader) 186 Enjoy Bowling 102Furniture 154 Enjoy Jogging 132All-Terrain Vehicle [ATV] 172 Went to Spa 62
Digital Camera 146 Computers and TechnologyVideo Game System 140 HH Owns Computer 89RV 144 HH Has Internet Access 88Major Appliance 151 HH Subscribes to Cable TV 102Mattress 132 HH Subscribes to Satellite TV 102Computer 110Pool or Spa 153
Base= DMA (Pima, Cochise and Santa Cruz Counties)
Market Index= Demonstrates what is above average (101 or greater), average (100), and below average (99 or less) of a given demographic.
Sou
rce:
Sca
rbor
ough
20
10
(T)
Hispanic P
urchasing P
ow
er

Nineteen percent of our website users are Hispanic. Our Hispanic website users are more educated and more affluent than the general Hispanic population — a lucrative consumer group with more disposable income.
Demographics Star Website Users Hispanics Star Website Users
who are HispanicMen 49% 44% 40%Women 51% 56% 60%Married 33% 50% 62%Single 20% 31% 22%Median Age 45.6 37.6 40.5Some College 37% 28% 36%College Grad+ 40% 15% 28%HH Income 50K+ 60% 28% 47%Median HH Income $61,641 $36,535 $44,491 Working Women 33% 29% 43%Families 46% 58% 68%Homeowners 78% 59% 69%
Base= DMA (Pima, Cochise and Santa Cruz Counties)
Sou
rce:
Sca
rbor
ough
20
10
(T)
39,34314%
71,05726%
74,46527%
83,92630%
102,29437%
106,78038%
- 20,000 40,000 60,000 80,000 100,000 120,000
Daily
Daily + Online
Sunday Star
Daily + Sunday
Sunday + Online
Daily + Sunday + Online
Reach of Hispanics
Source: Scarborough 2010 (T)
Arizona Daily Star –Advertising solutions for the nation’s 29th largest Hispanic market
The Arizona Daily Star can help you get your share of the growing Hispanic market with print, online and Spanish-language pub-lications that reaches 50% of Hispanic adults each week in Southern Arizona.
Reach Of Hispanics
Star A
dvertising S
olu
tions
Sources: The Economic Impact of Mexican Visitors to Arizona 2007-2008
Homeowners 78% 59% 69%Base= DMA (Pima, Cochise and Santa Cruz Counties)
Sou
rce:
Sca
rbor
ough
20
10
(T)
Star A
dvertising S
olu
tions
HISPANIC MEDIAKIT

Sources: The Economic Impact of Mexican Visitors to Arizona 2007-2008
HISPANIC MEDIAKIT
laestrella.azstarnet.com
La Estrella is the largest, local Spanish-language publication in Southern Arizona.
La Estrella’s readership has grown – due, in part, to the dedication of its editorial team to reporting the positive impact of the Hispanic community, including family, traditions, pride and culture. Through its six chapters, La Estrella provides important local information that touches the hearts and minds of Hispanics.
Gente – Featuring fresh news from “El Mundo del Espectáculo” – Art and Entertainment news – movies, music, telenovelas and everything that is going on within Hispanic and Non-Hispanic celebrities.
Calendario – Weekly guide for local events on how best to enjoy the weekend with the family, sharing information on cultural and bilingual happenings in Tucson Metro area.
Ciudad – A window to Tucson’s Hispanic vibrant community. The Hispanic rich culture is seen and described through its positive contributions to Society by presenting local stories on people, events and current issues.
Sociales – Social rendezvous in the Old Pueblo – Photos of Hispanic community entertaining during concerts, parades, festivals and many weekly events.
Opinión – The voices of high-profile Hispanics expressing their points of views and opinions on an array of contemporary issues and topics and their effect on the Hispanic Community in Tucson and nationwide.
Clasificados – The largest Spanish classified section for the Tucson market to obtain the best deals in the market – autos, employment and much more every week.
Deportes – A review of the week’s actions of sports in Latin America, the US and all over the world and Tucson.
TV Horarios – A listing of weekly primetime programs, Friday through Thursday.
La Estre
lla De Tu
csón

Sources: The Economic Impact of Mexican Visitors to Arizona 2007-2008
HISPANIC MEDIAKIT
Arizona Daily Star offers the most cost-effective way to extend your reach to Tucson’s growing Hispanic audience with La Estrella.
La Estrella de Tucson, the Arizona Daily Star’s weekly Spanish-language general interest and news publication with weekly distribution of 31,000, is a key vehicle for connecting with the Hispanic community.
Why is this so important? Hispanics in Arizona account for $31.1 billion, or 16 percent of the state’s total buying power. Also take into account that residents from Mexico spend $990,000 on goods and services in Tucson every day, and it adds up to a need for your business to communicate effectively with Spanish-speaking audiences living and shopping in southern Arizona.
Category La EstrellaSpanish Language Yes
Editorial Content General Interest and news in printand online
Publish Date Weekly on Fridays
Distribution
31,000 distribution free-28% inserted inArizona Daily Star home delivery andsingle copy sales and 72% available in
400+ racks throughout Arizona
Readership Demographics
87% female
47% married
39% between ages of 18-34
Median age of 39 years
45% home owners
70% familiesSou
rce:
Sca
rbor
ough
20
10
(T)
Exte
nd Your R
each

Demographics Southern Arizona Hispanics
Hispanic Daily Star
Readers
Hispanic Sunday Star
Readers
HispanicStar Websites
ViewersMen 44% 51% 49% 40%Women 56% 48% 51% 60%Married 50% 63% 62% 62%Single 31% 20% 22% 22%Age 18-34 46% 25% 30% 29%Age 35-54 34% 45% 41% 56%Age 55+ 20% 30% 29% 15%Median Age [years] 37.6 46.2 46.2 40.6H.S> Grad or Less 57% 35% 38% 37%Some College 28% 34% 40% 36%College Grad+ 15% 31% 22% 27%HHI <$25,000 27% 15% 17% 19%HHI $25,000-49,999 45% 42% 43% 34%HHI $50,000-74,999 11% 19% 16% 16%HHI $75,000+ 17% 24% 24% 31%Median HH Income $36,535 $44,782 $43,437 $44,491 Working Women 29% 34% 30% 43%Retired 6% 16% 12% 6%Professional/Manager 17% 23% 23% 38%Homeowners 59% 85% 69% 69%Renters 29% 12% 21% 22%Adults with Children 58% 38% 52% 68%
Base= DMA (Pima, Cochise and Santa Cruz Counties)
Sources: Scarborough 2010(T)
Hispanic Reader DemographicsOn average, Hispanics who read our products are slightly older than the total Hispanic market and earn 21% more in household income.Hispanic R
eader Dem
ographicsDid You Know...
• 68% of Southern Arizona Hispanics have access to the Internet.
• Nationally, 70% of Hispanics regard the Internet as the best source for comparing prices.
• Internet access among Hispanics is expected to grow 33% in the next five years.
Source: Scarborough 2010 (T); Claritas 2010; Datos 2009; Global Insights Snapshot of the Hispanic Market
Sources: The Economic Impact of Mexican Visitors to Arizona 2007-2008
Hispanic R
eader Dem
ographics Source: Scarborough 2010 (T); Claritas 2010; Datos 2009; Global Insights Snapshot of the Hispanic Market
HISPANIC MEDIAKIT

“Local”La Estrella Retail Rates and Deadlines
CommitmentLevel
RevenueContract Level
Rates perColumn Inch
1x - 5x Open $20.356x - 12x A $18.3513x - 25x B $14.2526x - 51x C $12.2552x C $12.25Retail Group Page $10.25Restaurant $13.25Non Profit $13.25Auto, Homebuilder, Real Estate $10.25
Church Rate $13.25Pickup from ROP $12.25Restaurant pickup from ROP $10.25
*Rates are agency commissionable.
Individual Section Strip Ad Rates
Ad size is 6 columns x 1.75”. Ads must be approved by the publisher prior to publication. Full color included. 6x non-consecutive frequency contract in 13 weeks. 13x, 26x, non-consecutive frequency contracts in 52 weeks. No other discounts apply.
Other advertising opportunities are available:• Pre-prints
• Post-It Notes
• Online
Contact Kristyn Meza 520-806-7717 or [email protected]
• Times listed are “in” Ad services.
• No guaranteed proof for ads submitted after printed deadlines. No proofs for digital PDF ads.
• All color ads and double-trucks are due 24 hours in advance of printed deadlines.
• All non-PDF digital ads must meet typeset ad materials due deadline.
• Complete ads include layout, artwork and copy. Incomplete ads will be held until all components have been received.
• No cancellations accepted after space reservation deadline.
• Classified rates are $1.60 per line pick-up out of Azstarnet.com Classifieds
Color Rate
Spot Color 20% of ad costFull Color 30% of ad cost
Front Strip Ad Rates
Commitment Level Rate
1x - 5x $4106x - 12x $41013x - 25x $30526x - 51x $25552x $255Auto, Homebuilder, Real Estate $255
La Estre
lla Retail R
ates
Sources: The Economic Impact of Mexican Visitors to Arizona 2007-2008
HISPANIC MEDIAKIT
Day of Publication Section
Space Reservations & Cancellations
Friday La Estrella
5pm(1 wk. prior)

Mechanical Specifications
• Tabloid Sizes• Minimum depth 1 inch• Ads over 11 inches in depth on
1, 2, 3, 4, or 5 columns will becharged full column depth of 11.625”.
Width of Ad Inches
1 column 1.7982 columns 3.7503 columns 5.7154 columns 7.6875 columns 9.658
Mechanical NotesAdvertising design and layout are providedto display advetisers at no extra charge.
Deadlines
La Estrella:
Space reservation is Friday one week prior to publication
Mechanical S
pecs and Notes
Did You Know...
• 40% of Southern Arizona Hispanics bought children’s clothing in the past year, compared with 29% for the total market.
• 30% of Hispanics spend $150 or more at the grocery store each week, comparedto 27% of total adults.
• Hispanics are 7% more likely to purchase a lottery ticket each month than the total general market.
• Arizona ranks fourth among all states for its Hispanic Consumer Market
• Arizona is fifth among all states for total Hispanic population (2.1 million).
• The Hispanic population in Tucson has grown 153% since 1980.
• The Hispanic market is expected to grow 15% in the next five years compared with 9% growth for Pima County’s total population.
• 90% of English-dominant Hispanics were born in the United States, compared to only 34% of Spanish-dominant Hispanics.
Sources: Datos, 2009; Scarborough 2010 (T); Claritas 2010
Sources: The Economic Impact of Mexican Visitors to Arizona 2007-2008
Mechanical S
pecs and Notes
Sources: Datos, 2009; Scarborough 2010 (T); Claritas 2010
HISPANIC MEDIAKIT