history of funded status - edr.state.fl.us
TRANSCRIPT
The Florida Legislature
Office of Economic and
Demographic Research
850.487.1402
http://edr.state.fl.us
Presented by:
FRS: History of Funded Status
February 4, 2021
In General… The Florida Retirement System (FRS) Pension Plan is currently the fifth largest state
retirement system in the US with a total membership of more than 1.0 million active, retired,
terminated vested and DROP members and $164 billion in assets.
Public Pension Plans tend to focus on long term costs and the ability to meet them (fiscal
health).
Key question is: what level of assets today would be needed to pay projected benefit
payments?
The FRS regularly undergoes evaluation of its financial condition. This complex process has
many participants—the most directly involved are the Department of Management Services’
Division of Retirement and its actuary (currently Milliman); the State Board of Administration
and its consultant (currently Aon Investments), and the statutorily-based Actuarial Assumption
Estimating Conference.
(10) FLORIDA RETIREMENT SYSTEM ACTUARIAL ASSUMPTION CONFERENCE.—
The Florida Retirement System Actuarial Assumption Conference shall develop official
information with respect to the economic and noneconomic assumptions and funding
methods of the Florida Retirement System necessary to perform the system actuarial
study undertaken pursuant to s. 121.031(3). Such information shall include: an analysis of
the actuarial assumptions and actuarial methods used in the study and a determination of
whether changes to the assumptions or methods need to be made due to experience
changes or revised future forecasts. Section 216.136(10), F.S.
1
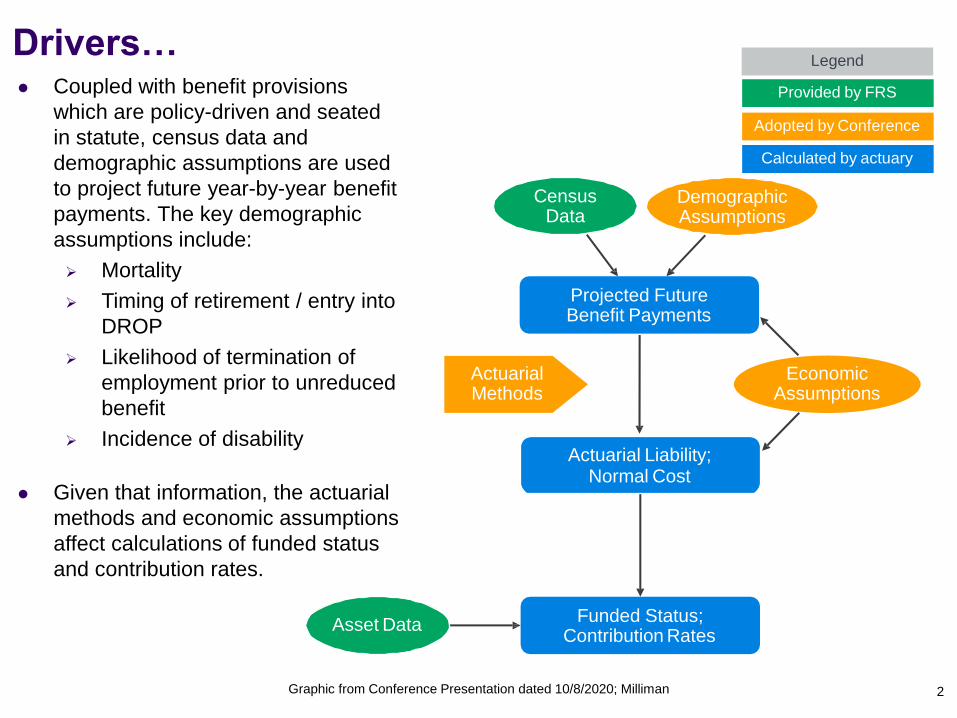
Projected Future Benefit Payments
Census Data
Demographic Assumptions
Funded Status; Contribution Rates
Actuarial Liability; Normal Cost
Asset Data
Actuarial Methods
Legend
Provided by FRS
Adopted by Conference
Calculated by actuary
Economic Assumptions
Graphic from Conference Presentation dated 10/8/2020; Milliman 2
Coupled with benefit provisions
which are policy-driven and seated
in statute, census data and
demographic assumptions are used
to project future year-by-year benefit
payments. The key demographic
assumptions include:
Mortality
Timing of retirement / entry into
DROP
Likelihood of termination of
employment prior to unreduced
benefit
Incidence of disability
Given that information, the actuarial
methods and economic assumptions
affect calculations of funded status
and contribution rates.
Drivers…
Contribution Rates…
Each year’s valuation determines the System’s current financial position,
projected costs for benefits, and the contribution rates needed to ensure the
System’s long-term funding. The contribution rates potentially take two forms.
They are both conceptually described below, but the actual calculations are much
more complex:
Normal Cost Rate: Each year, active employees earn another increment of
pension benefits. The annual contribution necessary to provide these benefits
at a future time is actuarially calculated and known as the normal cost. In
technical terms, the normal cost represents a single valuation year’s portion of
the value of actuarial liabilities.
UAL Contribution Rate: When it exists, the unfunded actuarial liability
reflects the portion of the cost of promised future benefits that is greater than
the amount the assets of the pension plan can reasonably generate over the
same period. Generally, the UAL rate is calculated as the rate needed to
amortize the entire unfunded actuarial liability over 30 years.
3
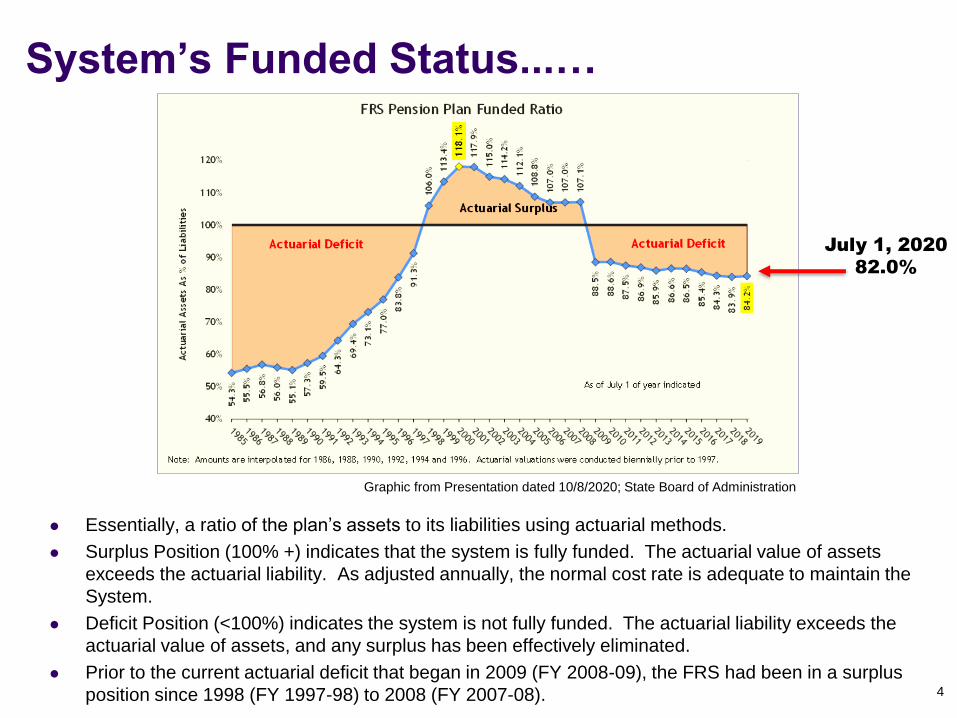
System’s Funded Status...…
Essentially, a ratio of the plan’s assets to its liabilities using actuarial methods.
Surplus Position (100% +) indicates that the system is fully funded. The actuarial value of assets
exceeds the actuarial liability. As adjusted annually, the normal cost rate is adequate to maintain the
System.
Deficit Position (<100%) indicates the system is not fully funded. The actuarial liability exceeds the
actuarial value of assets, and any surplus has been effectively eliminated.
Prior to the current actuarial deficit that began in 2009 (FY 2008-09), the FRS had been in a surplus
position since 1998 (FY 1997-98) to 2008 (FY 2007-08). 4
Graphic from Presentation dated 10/8/2020; State Board of Administration
July 1, 2020
82.0%
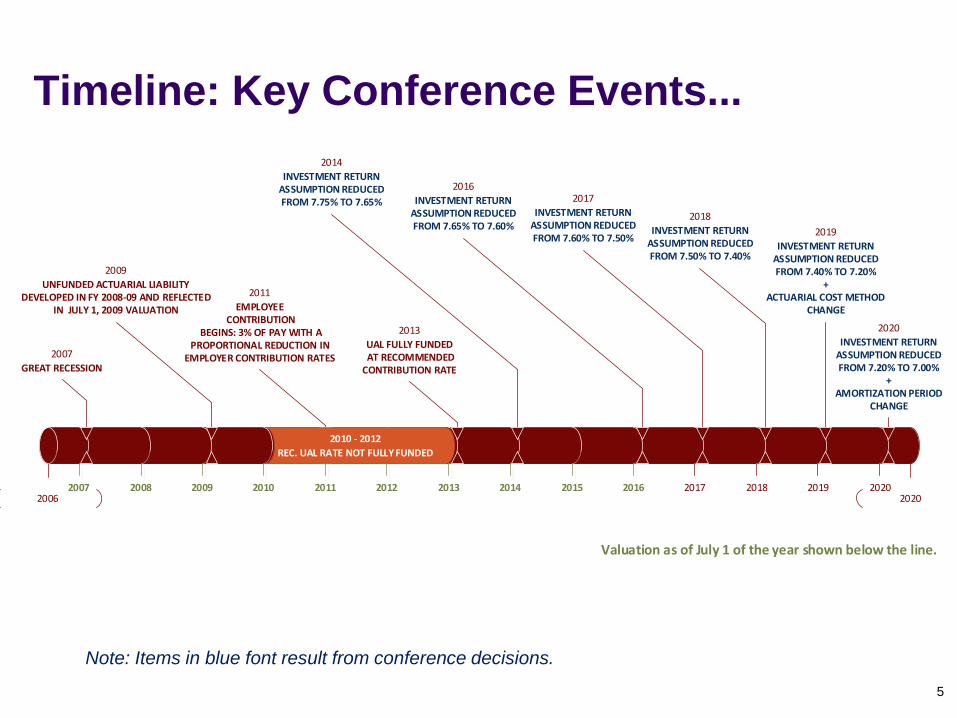
Timeline: Key Conference Events...
5
Note: Items in blue font result from conference decisions.
2006 20202007 2008 2009 2010 2011 2012 2013 2014 2015 2016 2017 2018 2019 2020
2011
EMPLOYEE CONTRIBUTION
BEGINS: 3% OF PAY WITH A PROPORTIONAL REDUCTION IN
EMPLOYER CONTRIBUTION RATES
Valuation as of July 1 of the year shown below the line.
2009
UNFUNDED ACTUARIAL LIABILITY DEVELOPED IN FY 2008-09 AND REFLECTED
IN JULY 1, 2009 VALUATION
2013
UAL FULLY FUNDED AT RECOMMENDED CONTRIBUTION RATE
2010 - 2012
REC. UAL RATE NOT FULLY FUNDED
2014
INVESTMENT RETURN ASSUMPTION REDUCED FROM 7.75% TO 7.65% 2017
INVESTMENT RETURN ASSUMPTION REDUCED FROM 7.60% TO 7.50%
2016
INVESTMENT RETURN ASSUMPTION REDUCED FROM 7.65% TO 7.60%
2018
INVESTMENT RETURN ASSUMPTION REDUCED FROM 7.50% TO 7.40%
2019
INVESTMENT RETURNASSUMPTION REDUCEDFROM 7.40% TO 7.20%
+ ACTUARIAL COST METHOD
CHANGE
2020
INVESTMENT RETURNASSUMPTION REDUCEDFROM 7.20% TO 7.00%
+AMORTIZATION PERIOD
CHANGE
2007
GREAT RECESSION
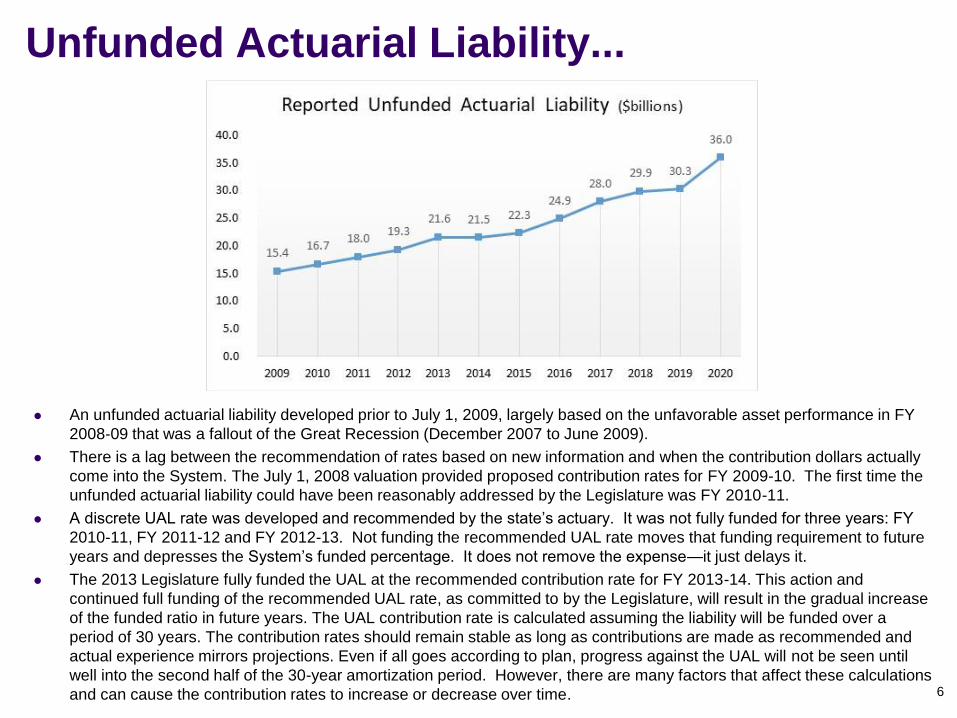
Unfunded Actuarial Liability...
An unfunded actuarial liability developed prior to July 1, 2009, largely based on the unfavorable asset performance in FY
2008‐09 that was a fallout of the Great Recession (December 2007 to June 2009).
There is a lag between the recommendation of rates based on new information and when the contribution dollars actually
come into the System. The July 1, 2008 valuation provided proposed contribution rates for FY 2009-10. The first time the
unfunded actuarial liability could have been reasonably addressed by the Legislature was FY 2010-11.
A discrete UAL rate was developed and recommended by the state’s actuary. It was not fully funded for three years: FY
2010-11, FY 2011-12 and FY 2012-13. Not funding the recommended UAL rate moves that funding requirement to future
years and depresses the System’s funded percentage. It does not remove the expense—it just delays it.
The 2013 Legislature fully funded the UAL at the recommended contribution rate for FY 2013-14. This action and
continued full funding of the recommended UAL rate, as committed to by the Legislature, will result in the gradual increase
of the funded ratio in future years. The UAL contribution rate is calculated assuming the liability will be funded over a
period of 30 years. The contribution rates should remain stable as long as contributions are made as recommended and
actual experience mirrors projections. Even if all goes according to plan, progress against the UAL will not be seen until
well into the second half of the 30-year amortization period. However, there are many factors that affect these calculations
and can cause the contribution rates to increase or decrease over time. 6
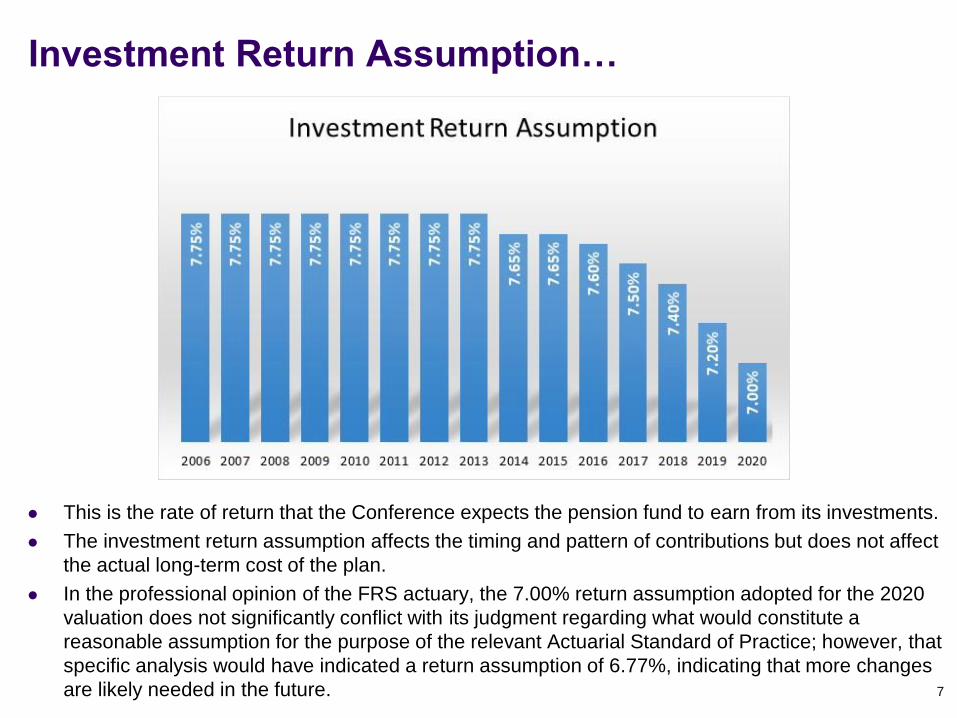
Investment Return Assumption…
This is the rate of return that the Conference expects the pension fund to earn from its investments.
The investment return assumption affects the timing and pattern of contributions but does not affect
the actual long-term cost of the plan.
In the professional opinion of the FRS actuary, the 7.00% return assumption adopted for the 2020
valuation does not significantly conflict with its judgment regarding what would constitute a
reasonable assumption for the purpose of the relevant Actuarial Standard of Practice; however, that
specific analysis would have indicated a return assumption of 6.77%, indicating that more changes
are likely needed in the future. 7
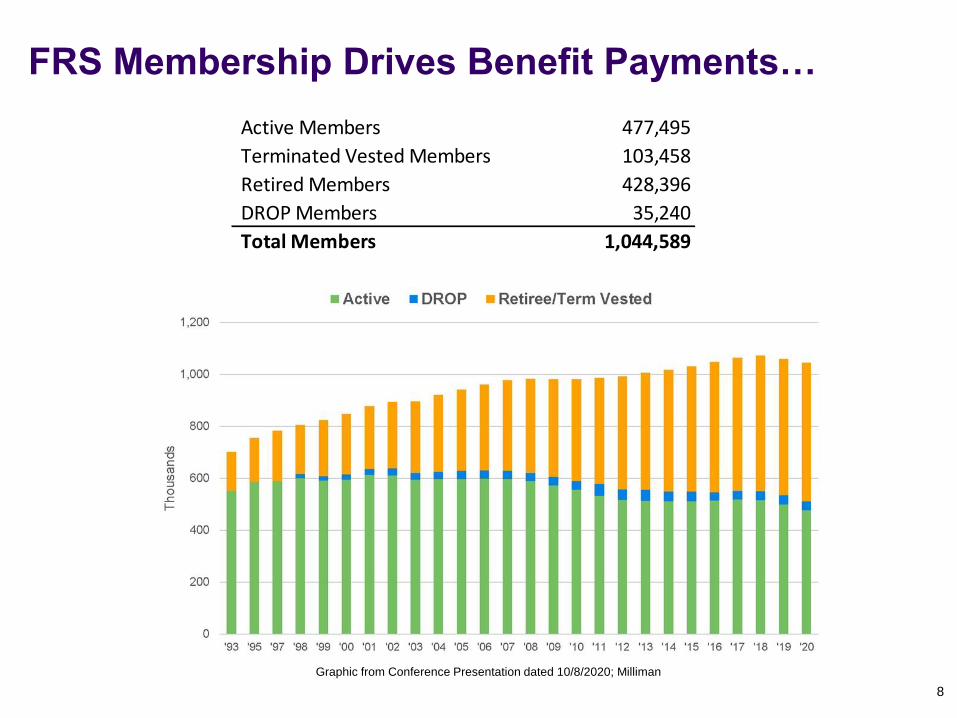
Active Members 477,495
Terminated Vested Members 103,458
Retired Members 428,396
DROP Members 35,240
Total Members 1,044,589
FRS Membership Drives Benefit Payments…
8
Graphic from Conference Presentation dated 10/8/2020; Milliman
9
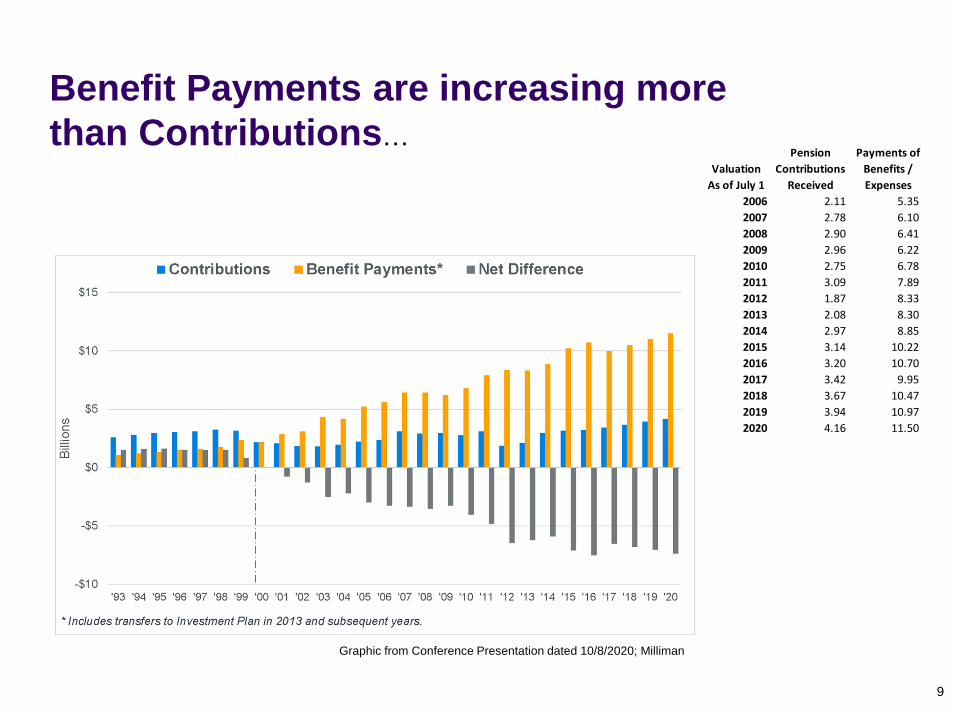
Benefit Payments are increasing more
than Contributions…
Graphic from Conference Presentation dated 10/8/2020; Milliman
Valuation
As of July 1
Pension
Contributions
Received
Payments of
Benefits /
Expenses
2006 2.11 5.35
2007 2.78 6.10
2008 2.90 6.41
2009 2.96 6.22
2010 2.75 6.78
2011 3.09 7.89
2012 1.87 8.33
2013 2.08 8.30
2014 2.97 8.85
2015 3.14 10.22
2016 3.20 10.70
2017 3.42 9.95
2018 3.67 10.47
2019 3.94 10.97
2020 4.16 11.50