an analysis of connecticut’s state · o today’s funded status if sers had been adequately...
TRANSCRIPT

Jean-Pierre Aubry and Anek Belbase
Center for Retirement Research at Boston College
Connecticut Pension Analysis
Oct 28th, 2015
Hartford, CT
An Analysis of Connecticut’s State
Employees Retirement System:
Final Report

1
Overview
• Looking back
o SERS’ historical funded status
o The source of SERS’ unfunded liability (UAAL)
o Today’s funded status if SERS had been adequately funded
• Looking forward
o Funded level and cost under status-quo and alternative
funding methods
o Other ways to address the UAAL
o A better system for handling risk going forward

2
Looking back….

Over the past 2 decades, SERS’ funded status
has lagged behind the national average.
3
Sources: Various actuarial valuations for Connecticut SERS; PENDAT (1990-2000); and Public Plans Database (2001-2014).
Funded Ratio, 1969-2014
0%
20%
40%
60%
80%
100%
120%
1969 1974 1979 1984 1989 1994 1999 2004 2009 2014
Connecticut SERS
National average

SERS provided benefits as far back as 1939,
but did not pre-fund benefits until 1971.
4
Percentage of State and Local Plans Established or Significantly Restructured, by Date
Sources: Various actuarial valuations for Connecticut SERS; PENDAT (1990-2000); and Public Plans Database (2001-2014).
6.1%
3.0%1.8%
5.3% 5.0%
16.1%
29.6%
14.6%15.6%
5.8%
0%
10%
20%
30%
40%
SERS

5
But today’s poor funded ratio has to do with
more than SERS’ late start.
Methodology for UAAL Analysis
• Each SERS valuation provides data on the UAAL, the change
in the UAAL from the prior year, and some information on
factors behind the change.
• We combine the factors into meaningful groups and sum the
data from 1985-2014 to highlight the factors that have played a
role in the development of the UAAL over the past 29 years.

Since 1985, actuarial experience, returns, and
contributions have driven UAAL growth.
6
Source: Authors’ calculations based on various actuarial valuations for Connecticut SERS.
Sources of Change to UAAL, 1985-2014
1.3
-0.5 -0.5
1.1
4.1
0.11.4
12.5
-$4
$0
$4
$8
$12
$16B
illi
ons Contributions < ARC, 3.2
ARC < UAAL growth, 2.3

But not much happened before 2000.
7
Sources of Change to UAAL, 1985-1999
Source: Authors’ calculations based on various actuarial valuations for Connecticut SERS.
-1.9
0.0 0.0
-0.9
0.90.1
1.6 1.5
-$4
$0
$4
$8
$12
$16B
illi
ons
ARC < UAAL growth, 0.1
Contributions < ARC growth, 1.8

Since 2000, the UAAL has grown by $11
billion.
8
Sources of Change to UAAL, 2000-2014
Source: Authors’ calculations based on various actuarial valuations for Connecticut SERS.
3.2
-0.5 -0.5
2.03.1
0.0
-0.2
11.0
-$4
$0
$4
$8
$12
$16B
illi
ons
ARC < UAAL growth, 2.2
Contributions < ARC, 1.4
9
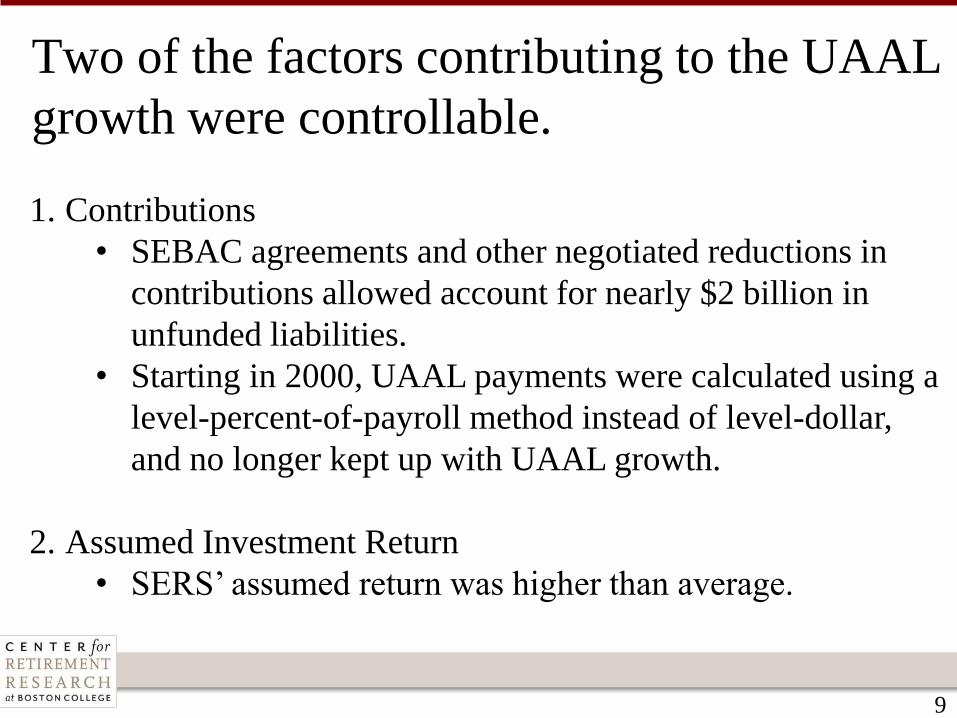
Two of the factors contributing to the UAAL
growth were controllable.
1. Contributions
• SEBAC agreements and other negotiated reductions in
contributions allowed account for nearly $2 billion in
unfunded liabilities.
• Starting in 2000, UAAL payments were calculated using a
level-percent-of-payroll method instead of level-dollar,
and no longer kept up with UAAL growth.
2. Assumed Investment Return
• SERS’ assumed return was higher than average.

Actual contributions fell short of required
amounts.
10
Contributions to CT SERS, 1985-2014, in Billions
Source: Authors’ calculations based on various actuarial valuations for Connecticut SERS.
$0
$400
$800
$1,200
$1,600
1985 1989 1993 1997 2001 2005 2009 2013
Mil
lions
Minimum required contribution to prevent UAAL growthAnnual Required ContributionActual Contribution

Also, the assumed rate of return was
unusually high.
11
Assumed Investment Return, 1990-2014
Sources: Actuarial valuations for Connecticut SERS; PENDAT (1990-2000); and Public Plans Database (2001-2014).
6.0%
6.5%
7.0%
7.5%
8.0%
8.5%
9.0%
1990 1993 1996 1999 2002 2005 2008 2011 2014
Connecticut SERS
National average
12
Two of the factors contributing to the UAAL
growth were less controllable.
• Deviations from actuarial experience
• Actual investment returns

13
Key demographic assumptions were
continually off.
Annual Impact of Actuarial Experience on Unfunded Liabilities, 1990-2014
Sources: Authors’ calculations based on CT SERS actuarial valuations; and the 1996 and 2002 Gain/Loss Studies for Connecticut SERS.
$0.3
$0.8
$1.0
-$0.4
$0.0
$0.4
$0.8
$1.2
1990 1994 1998 2002 2006 2010 2014
Bil
lions

14
Recently, retirement assumptions have
accounted for much of the poor experience.
Impact of Specific Actuarial Assumptions on Unfunded Liabilities, 2009-2014
Sources: Authors’ calculations based on 2009-2014 actuarial valuations for CT SERS;
$1.21
$0.00
-$0.09
$0.05
$0.38
-$0.5
$0.0
$0.5
$1.0
$1.5
Retirement Separation Salary Mortality Other
Bil
lions

15
Up to 2000, SERS’ actual investment returns
were above the assumed return.
Actual vs. Assumed Investment Return, 1983-2000
Sources: Actuarial valuations for Connecticut SERS; and Census of Governments (1983-2000).
8.5%
11.3%
0%
5%
10%
15%
2000 Assumed return
Average return from 1983-2000

16
But since 2000, investment returns have
fallen considerably short of the assumed.
Actual vs. Assumed Investment Return, 2001-2014
Sources: Actuarial valuations for Connecticut SERS; and Census of Governments (2001-2014).
8.0%
5.4%
0%
5%
10%
15%
2014 Assumed return
Average return from 2001-2014
17
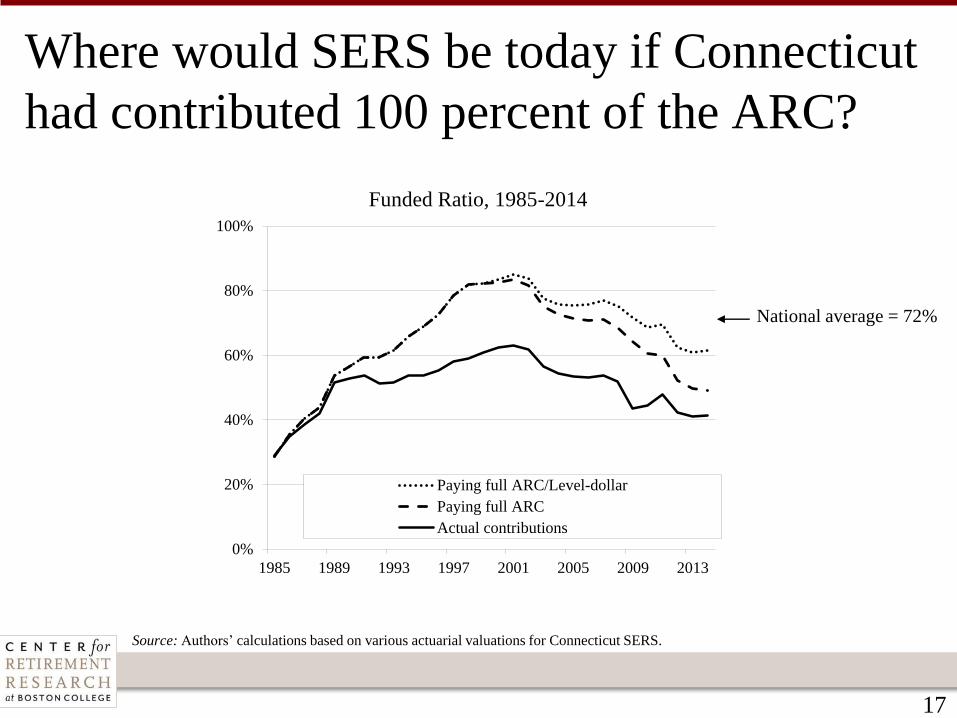
Where would SERS be today if Connecticut
had contributed 100 percent of the ARC?
Funded Ratio, 1985-2014
Source: Authors’ calculations based on various actuarial valuations for Connecticut SERS.
National average = 72%
0%
20%
40%
60%
80%
100%
1985 1989 1993 1997 2001 2005 2009 2013
Paying full ARC/Level-dollar
Paying full ARC
Actual contributions

18
Looking forward….

19
The key question is how to deal with the
existing UAAL.
2014 Actuarial Costs as a Percent of Payroll, by Element
Sources: Actuarial valuation for Connecticut SERS; and Public Plans Database (2014).
2.2%6.6%
8.0%
7.0%
35.4%
9.0%
0%
10%
20%
30%
40%
50%
Connecticut SERS National average
Employer UAAL payment
Employer normal cost
Employee contribution

20
Three factors determine the trajectory of
UAAL amortization payments.
1. Payment schedule:
• Level dollar: front-loaded payments
• Level percent of pay: back-loaded payments
2. Funding period
• Closed amortization period: fixed date for full funding
• Open amortization period: no fixed date
3. Length of amortization period

21
Projection methodology
• We begin with data from SERS 2014 actuarial valuation.
• The Actuary provides projection for payroll, normal costs, and
benefit payments.
• We calculate the UAAL and amortization payment in each year.
• We assume the plan pays its full projected ARC (normal cost +
amortization payment) and achieves its assumed return.
• Market assets in each year equal the prior year’s assets plus
contributions and investment earnings, minus benefit payments.
• SERS’ actuarial smoothing method is used for actuarial assets.

22
One way forward is pay off the UAAL by
2032 (current law)...
SERS Funded Ratio under Alternative Funding Methods, 2014-2046
Source: Authors’ calculations based on various actuarial valuations for Connecticut SERS.
0%
20%
40%
60%
80%
100%
120%
2014 2019 2024 2029 2034 2039 2044
Current Law
Level-dollar
23
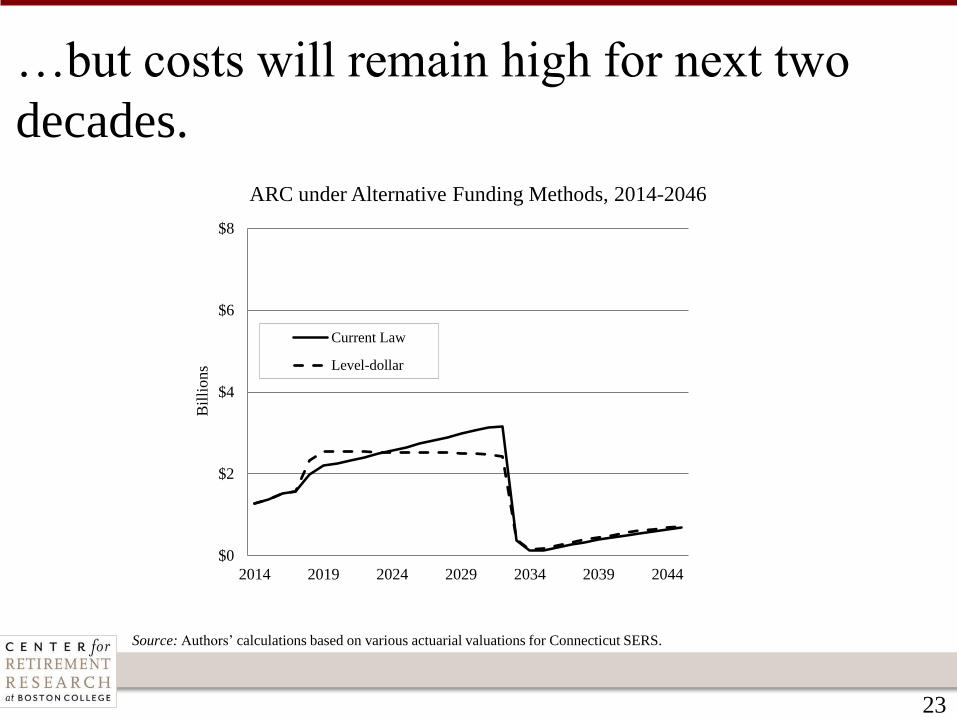
…but costs will remain high for next two
decades.
ARC under Alternative Funding Methods, 2014-2046
Source: Authors’ calculations based on various actuarial valuations for Connecticut SERS.
$0
$2
$4
$6
$8
2014 2019 2024 2029 2034 2039 2044
Bil
lion
s
Current Law
Level-dollar
24
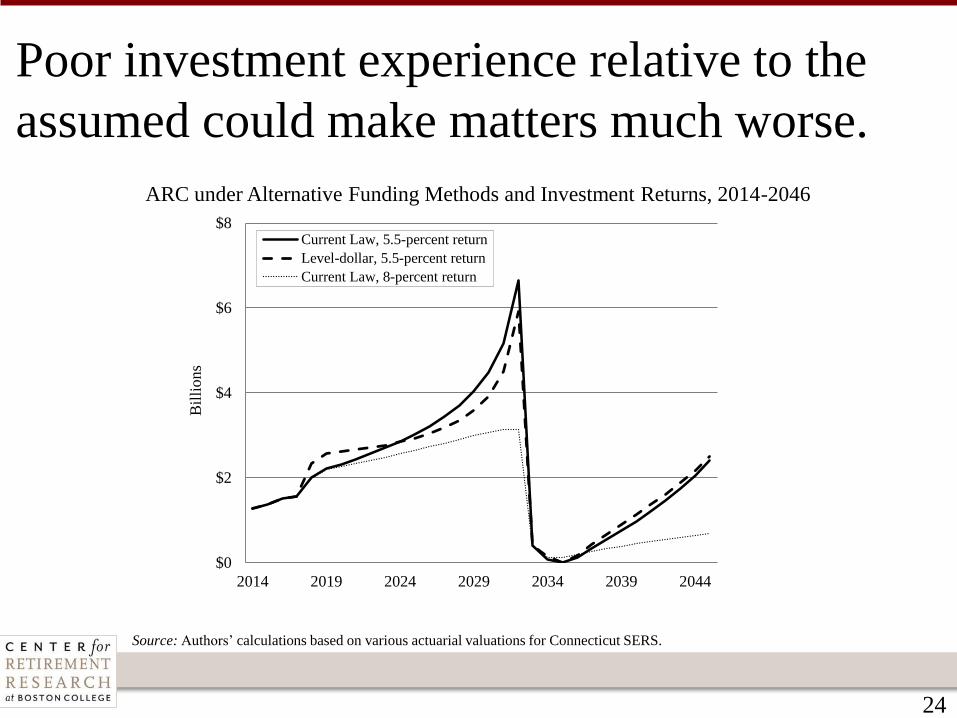
Poor investment experience relative to the
assumed could make matters much worse.
ARC under Alternative Funding Methods and Investment Returns, 2014-2046
Source: Authors’ calculations based on various actuarial valuations for Connecticut SERS.
$0
$2
$4
$6
$8
2014 2019 2024 2029 2034 2039 2044
Bil
lions
Current Law, 5.5-percent return
Level-dollar, 5.5-percent return
Current Law, 8-percent return

25
Relaxing the requirement to pay off the
UAAL by 2032 will delay full funding...
SERS Funded Ratio under Alternative Funding Methods, 2014-2046
Source: Authors’ calculations based on various actuarial valuations for Connecticut SERS.
0%
20%
40%
60%
80%
100%
120%
2014 2019 2024 2029 2034 2039 2044
Level-dollar, 15-yr open, 8-percent return
Current Law, 8-percent return

26
…but will reduces annual costs significantly
over the next 20 years.
ARC under Alternative Funding Methods, 2014-2046
Source: Authors’ calculations based on various actuarial valuations for Connecticut SERS.
$0
$2
$4
$6
$8
2014 2019 2024 2029 2034 2039 2044
Bil
lion
s
Level-dollar, 15-yr open, 8-percent return
Current Law, 8-percent return

27
Even with a more conservative investment
return assumption, costs remain lower.
ARC under Alternative Funding Methods and Assumed Returns, 2014-2046
Source: Authors’ calculations based on various actuarial valuations for Connecticut SERS.
$0
$2
$4
$6
$8
2014 2019 2024 2029 2034 2039 2044
Bil
lions
Current Law, 8% Discount Rate
Level Dollar, 15-yr open, 8% Discount Rate
Level Dollar, 15-yr open, 7% Discount Rate
28
Can Connecticut address the UAAL in other
ways?
Separate the funding of the UAAL from ongoing plan financing
to clarify the cost of benefits for current workers vs. legacy costs.
• Issue a POB or establish a dedicated tax/revenue stream.
• This is NOT an arbitrage or cost-saving mechanism. In fact, to
ensure policy goals are met, it requires valuing the UAAL with
a conservative interest rate.

29
What about the less controllable factors?
• Investment risk can be shared equitably among the plan
stakeholders through a predetermined pattern of contribution
increases and benefit cuts.
• Incremental increases to the normal cost due to revised actuarial
assumptions can be shared evenly between employees and
employers.

Conclusions
30
• SERS’ current troubles are mainly the result of three things:
1. Inadequate contributions
2. Poor investment performance compared to the assumed
investment return.
3. Actuarial Experience
• The key to the future is making full required contributions.
• But paying off the UAAL by 2032 comes at a significant cost.
• Extending the payment horizon or issuing a POB could spread
out the pain over a longer period.
• Lowering the assumed return and instituting procedures that
automatically respond to bad outcomes would mitigate risk.

31
• The Center for Retirement Research at Boston College
http://crr.bc.edu
• Public Plans Database (PPD)
http://publicplansdata.org
• State and Local Pension Research
http://crr.bc.edu/special-projects/state-local-pension-plans/
Jean-Pierre Aubry
Assistant Director of State and Local Research