hitting our sweet spot … in europe
TRANSCRIPT
Hitting Our Sweet Spot
… in Europe
Deutsche Bank
Global Consumer Conference
June 15, 2011
Kraft Foods
Forward-looking statements
This presentation contains a number of forward-looking statements. The words “believe,” “expect,”“anticipate,” “intend,” “plan,” “goals,” “may,” “aim,” “will” and similar expressions are intended to identifyour forward-looking statements. Examples of forward-looking statements include, but are not limited to,statements we make regarding our portfolio; the virtuous cycle; top-tier growth; long-term targets; ourstrategies; delivering guidance; margin goals; well positioned to succeed; five key priorities in 2011;productivity growth; overheads; pricing; cost management; and top-tier performance. These forward-looking statements involve risks and uncertainties, many of which are beyond our control, and importantfactors that could cause actual results to differ materially from those in the forward-looking statementsinclude, but are not limited to, increased competition, pricing actions, continued volatility in and increasein commodity costs, risks from operating globally and tax law changes. For additional information onthese and other factors that could affect our forward-looking statements, see our risk factors, as theymay be amended from time to time, set forth in our filings with the SEC, including our most recently filedAnnual Report on Form 10-K and subsequent reports on Forms 10-Q and 8-K. We disclaim and do notundertake any obligation to update or revise any forward-looking statement in this presentation, exceptas required by applicable law or regulation.

Chris Jakubik
Vice President, Investor Relations
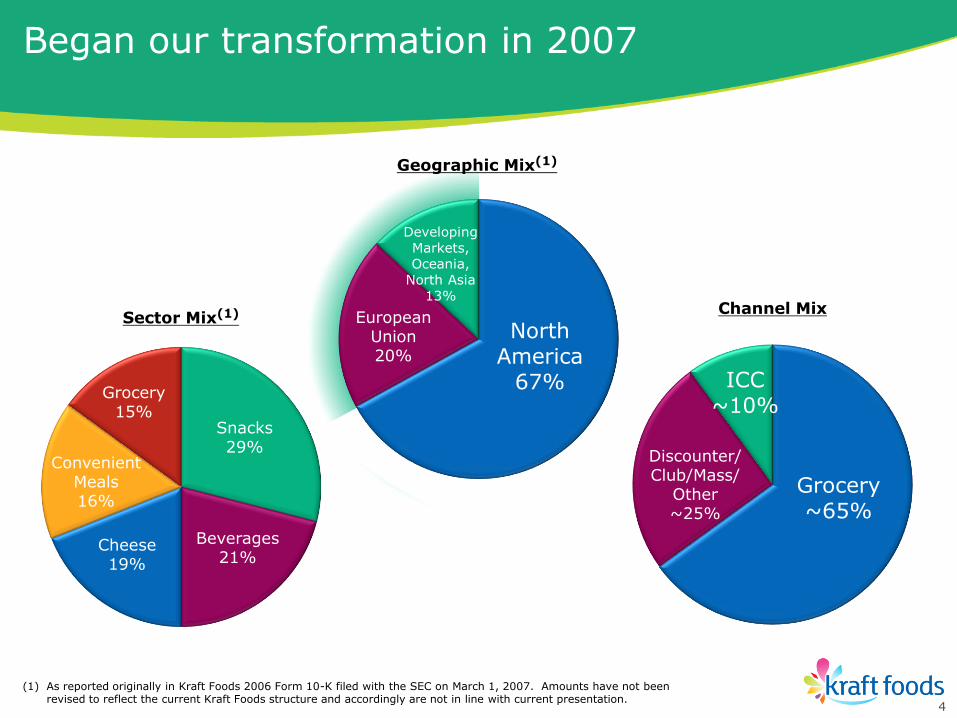
Began our transformation in 2007
Grocery~65%
ICC~10%
Discounter/Club/Mass/
Other~25%
(1) As reported originally in Kraft Foods 2006 Form 10-K filed with the SEC on March 1, 2007. Amounts have not been revised to reflect the current Kraft Foods structure and accordingly are not in line with current presentation.
Snacks29%
Convenient Meals16%
Cheese19%
Beverages21%
Grocery15%
Sector Mix(1)
Geographic Mix(1)
Channel Mix
4
North America
67%
Developing Markets, Oceania,
North Asia13%
EuropeanUnion20%
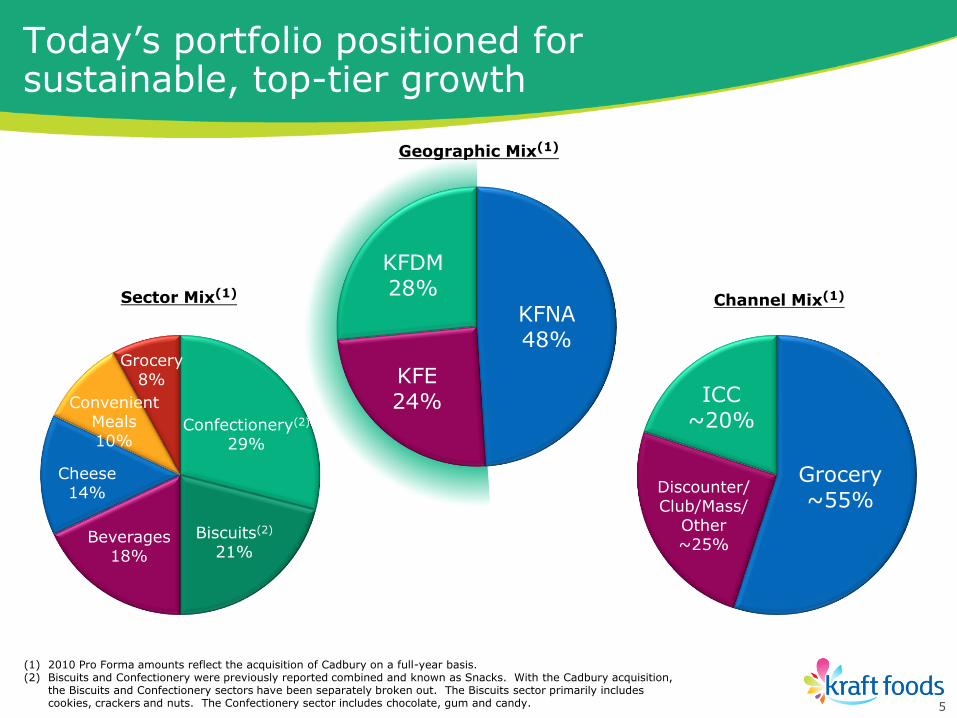
Today‟s portfolio positioned for sustainable, top-tier growth
Geographic Mix(1)
Grocery~55%
ICC~20%
Discounter/Club/Mass/
Other~25%
Channel Mix(1)
Confectionery(2)
29%
Convenient Meals10%
Cheese14%
Beverages18%
Grocery8%
Biscuits(2)
21%
Sector Mix(1)
(1) 2010 Pro Forma amounts reflect the acquisition of Cadbury on a full-year basis.(2) Biscuits and Confectionery were previously reported combined and known as Snacks. With the Cadbury acquisition,
the Biscuits and Confectionery sectors have been separately broken out. The Biscuits sector primarily includes cookies, crackers and nuts. The Confectionery sector includes chocolate, gum and candy. 5
KFNA48%
KFDM28%
KFE24%
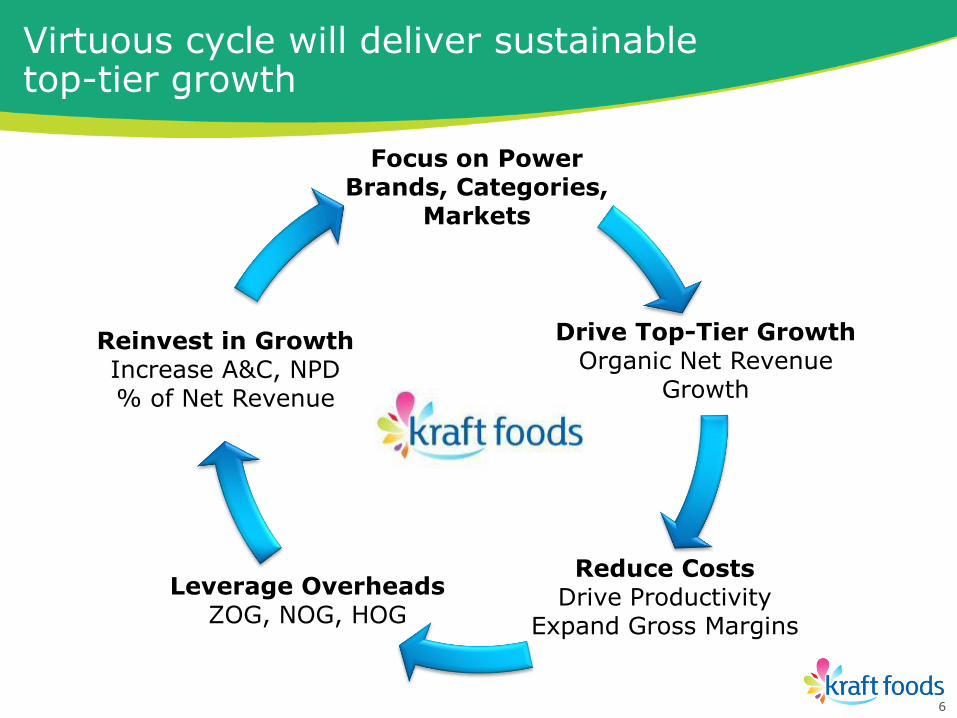
Virtuous cycle will deliver sustainable top-tier growth
Focus on Power Brands, Categories,
Markets
Drive Top-Tier GrowthOrganic Net Revenue
Growth
Reduce CostsDrive Productivity
Expand Gross Margins
Leverage OverheadsZOG, NOG, HOG
Reinvest in GrowthIncrease A&C, NPD % of Net Revenue
6
Michael Clarke
President, Kraft Foods Europe
•Kraft Foods Europe has transformed
• Strategies are working, building momentum
•Well positioned to deliver within guidance
Becoming Europe‟s favorite snacking company
8
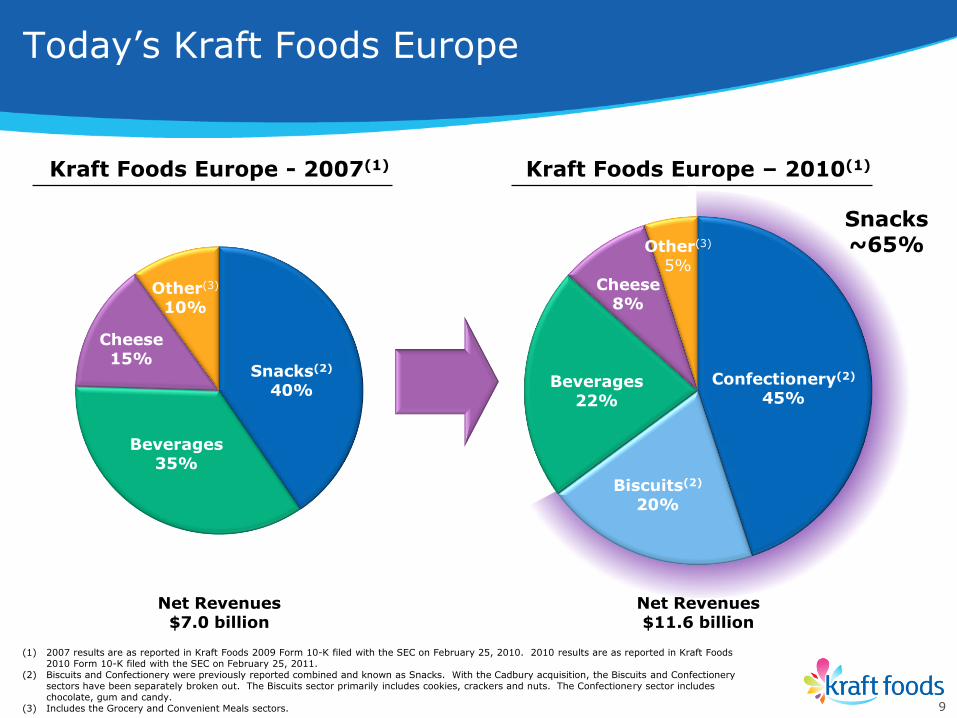
(1) 2007 results are as reported in Kraft Foods 2009 Form 10-K filed with the SEC on February 25, 2010. 2010 results are as reported in Kraft Foods 2010 Form 10-K filed with the SEC on February 25, 2011.
(2) Biscuits and Confectionery were previously reported combined and known as Snacks. With the Cadbury acquisition, the Biscuits and Confectionery sectors have been separately broken out. The Biscuits sector primarily includes cookies, crackers and nuts. The Confectionery sector includes chocolate, gum and candy.
(3) Includes the Grocery and Convenient Meals sectors.
Today‟s Kraft Foods Europe
Net Revenues$7.0 billion
Kraft Foods Europe - 2007(1)
Beverages14%
Snacks24%
Grocery19%
ConvenientMeals22%
Cheese &Foodservice
21%
Beverages35%
Snacks(2)
40%
Other(3)
10%
Cheese15%
Net Revenues$11.6 billion
Kraft Foods Europe – 2010(1)
Snacks~65%
Beverages22%
Biscuits(2)
20%
Confectionery(2)
45%
Cheese8%
Other(3)
5%
9
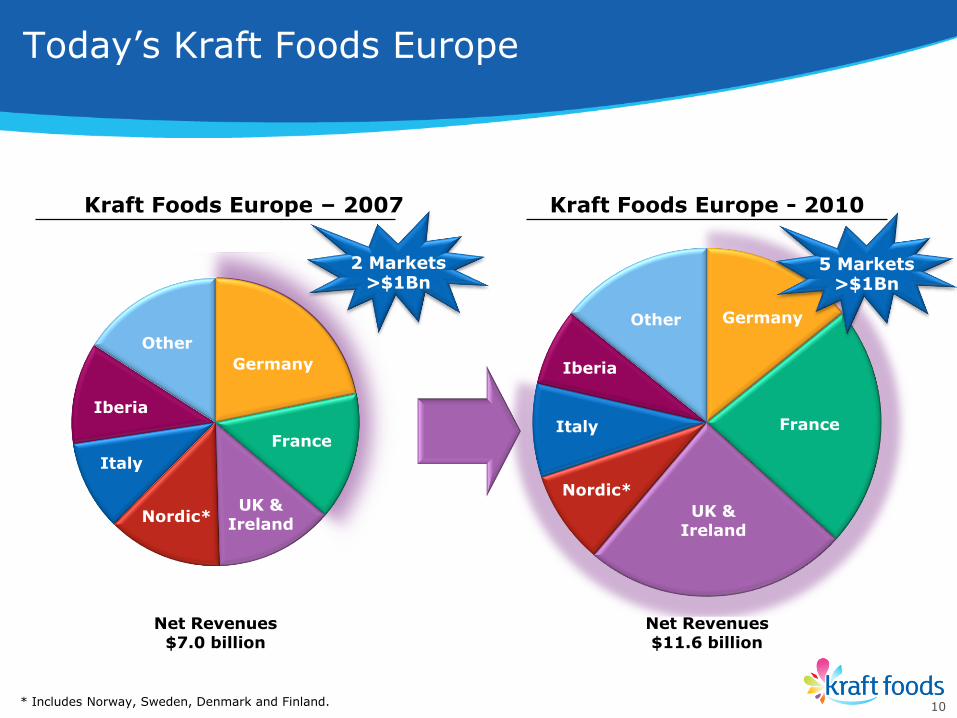
Germany
France
UK &Ireland
Nordic*
Italy
Other
Net Revenues$7.0 billion
11%
23%
23%
Kraft Foods Europe – 2007 Kraft Foods Europe - 2010
14%
14%
Net Revenues$11.6 billion
Germany
France
UK &Ireland
Nordic*
Italy
Other
Today‟s Kraft Foods Europe
Iberia
Iberia
2 Markets>$1Bn
5 Markets>$1Bn
10* Includes Norway, Sweden, Denmark and Finland.
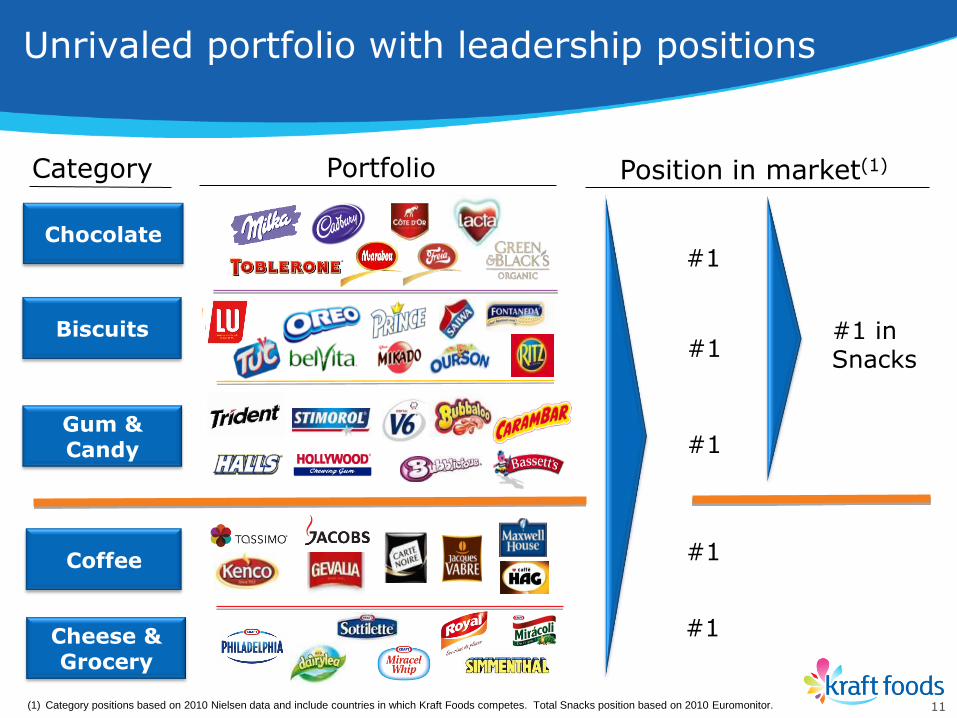
Category Portfolio Position in market(1)
#1
#1
#1
#1
#1
#1 in Snacks
Chocolate
Biscuits
Gum &Candy
Cheese & Grocery
Coffee
(1) Category positions based on 2010 Nielsen data and include countries in which Kraft Foods competes. Total Snacks position based on 2010 Euromonitor.
Unrivaled portfolio with leadership positions
11
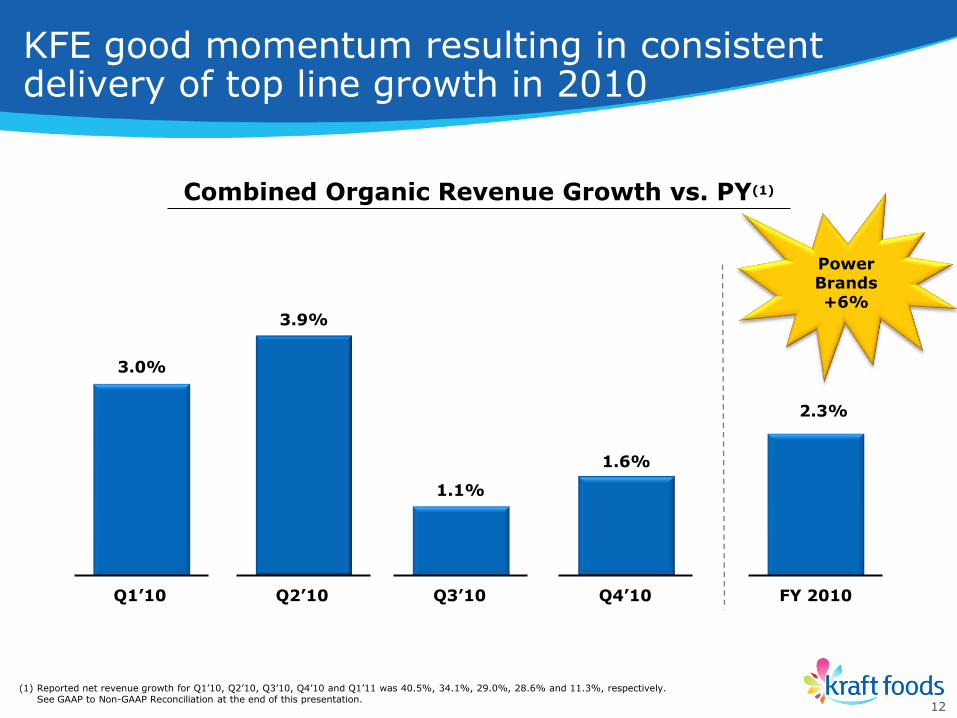
1.1%
Q1’10 Q2’10 Q3’10 Q4’10 FY 2010
3.9%
3.0%
1.6%
2.3%
KFE good momentum resulting in consistentdelivery of top line growth in 2010
(1) Reported net revenue growth for Q1‟10, Q2‟10, Q3‟10, Q4‟10 and Q1‟11 was 40.5%, 34.1%, 29.0%, 28.6% and 11.3%, respectively. See GAAP to Non-GAAP Reconciliation at the end of this presentation.
12
Combined Organic Revenue Growth vs. PY(1)
PowerBrands+6%

Growth accelerated in Q1 2011
(1) Reported Net Revenues increased 11.3%. See GAAP to Non-GAAP reconciliation at the end of this presentation.
• Power Brands +6%
• Good balance of vol/mix, pricing
− Priced earlier than competitors
− Easter shift impact to vol/mix ~(2.5)pp, primarily in Chocolate
+4.4%
Pricing+2.4 pp
Vol/Mix+2.0 pp
Organic NetRevenue Growth(1)
Q1‟11
13
5th
consecutive quarter of top
line growth
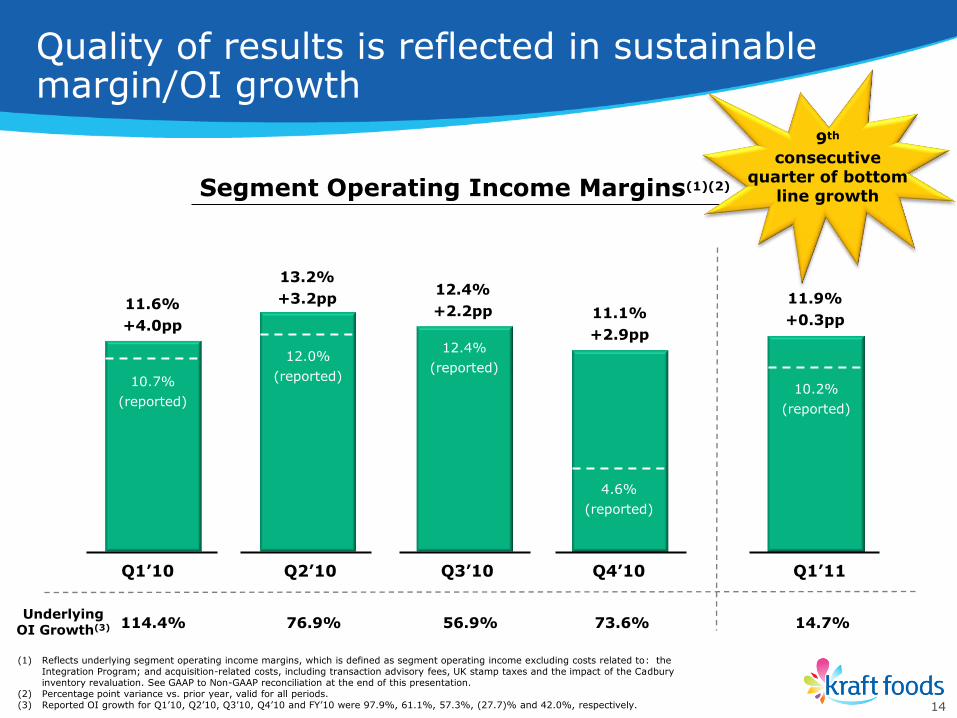
Quality of results is reflected in sustainable margin/OI growth
(1) Reflects underlying segment operating income margins, which is defined as segment operating income excluding costs related to: the Integration Program; and acquisition-related costs, including transaction advisory fees, UK stamp taxes and the impact of the Cadbury inventory revaluation. See GAAP to Non-GAAP reconciliation at the end of this presentation.
(2) Percentage point variance vs. prior year, valid for all periods.(3) Reported OI growth for Q1‟10, Q2‟10, Q3‟10, Q4‟10 and FY‟10 were 97.9%, 61.1%, 57.3%, (27.7)% and 42.0%, respectively.
Segment Operating Income Margins(1)(2)
114.4% 76.9% 56.9% 73.6% 14.7%Underlying
OI Growth(3)
Q1’10 Q2’10 Q3’10 Q4’10 Q1’11
11.6%
+4.0pp
13.2%
+3.2pp12.4%
+2.2pp 11.1%
+2.9pp
11.9%
+0.3pp
14
10.7%
(reported)
12.0%
(reported)
12.4%
(reported)
4.6%
(reported)
10.2%
(reported)
9th
consecutive quarter of bottom
line growth
•Stepping-up top-line growth
•On-track to deliver margin goals
•LU and Cadbury integration progressing well
Strategies are working
15
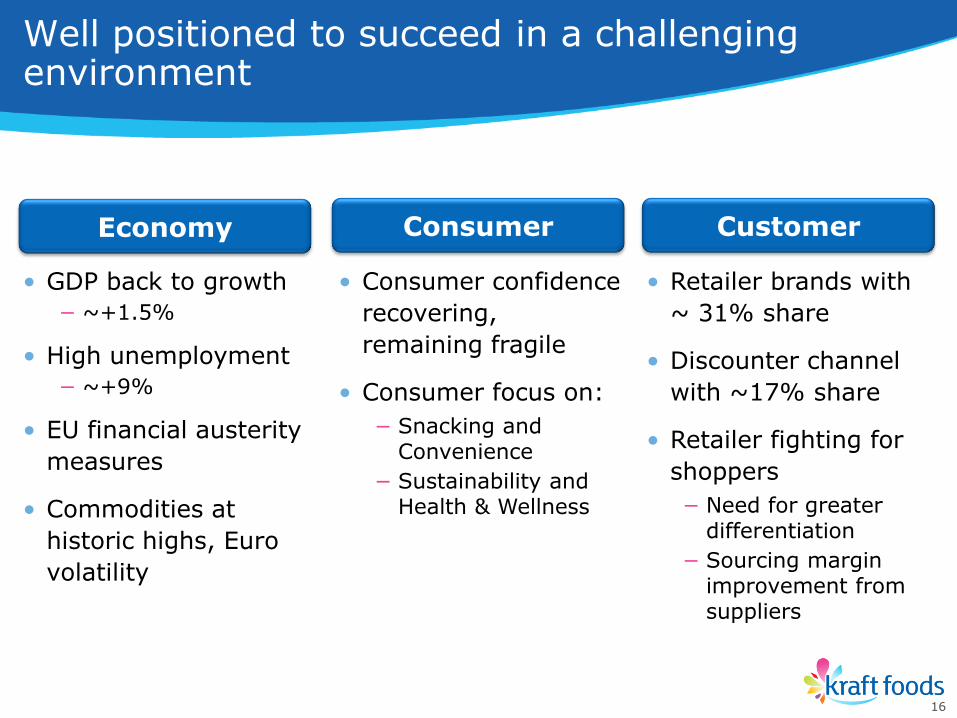
• Consumer confidence
recovering,
remaining fragile
• Consumer focus on:
− Snacking and Convenience
− Sustainability and Health & Wellness
• Retailer brands with
~ 31% share
• Discounter channel
with ~17% share
• Retailer fighting for
shoppers
− Need for greater differentiation
− Sourcing margin improvement from suppliers
Well positioned to succeed in a challengingenvironment
16
• GDP back to growth
− ~+1.5%
• High unemployment
− ~+9%
• EU financial austerity
measures
• Commodities at
historic highs, Euro
volatility
Economy Consumer Customer
•Power Brands driving sustainable growth
•Cross category sales leverage
•World-class Cost Management
•Pricing to cover cost inflation
•Building a winning organization
Five key priorities in 2011
17
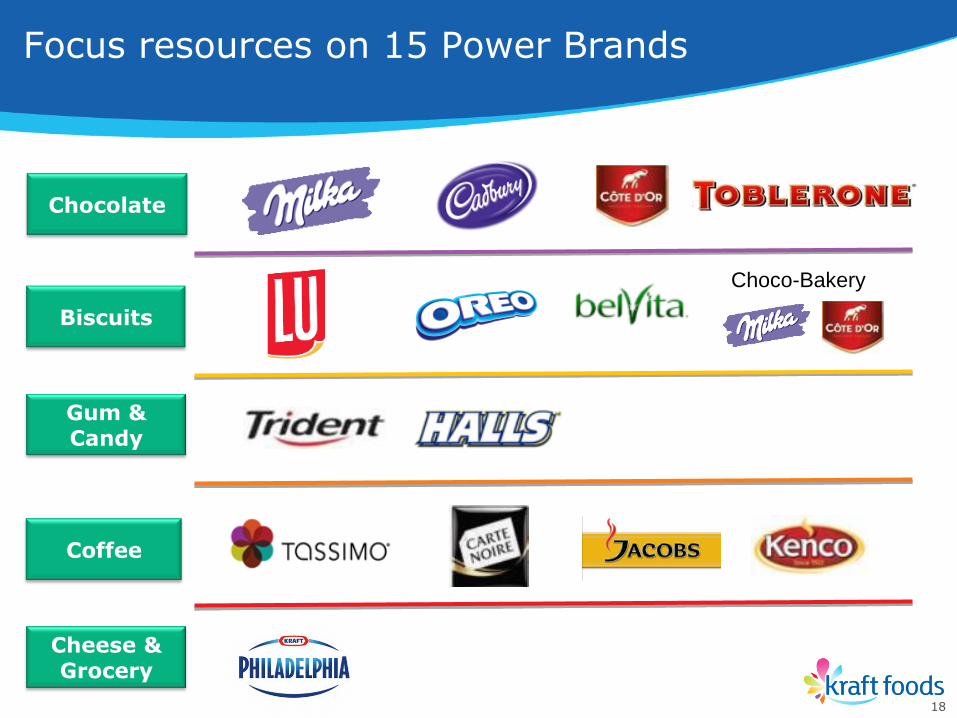
Chocolate
Biscuits
Gum &Candy
Cheese & Grocery
Coffee
Choco-Bakery
Focus resources on 15 Power Brands
18
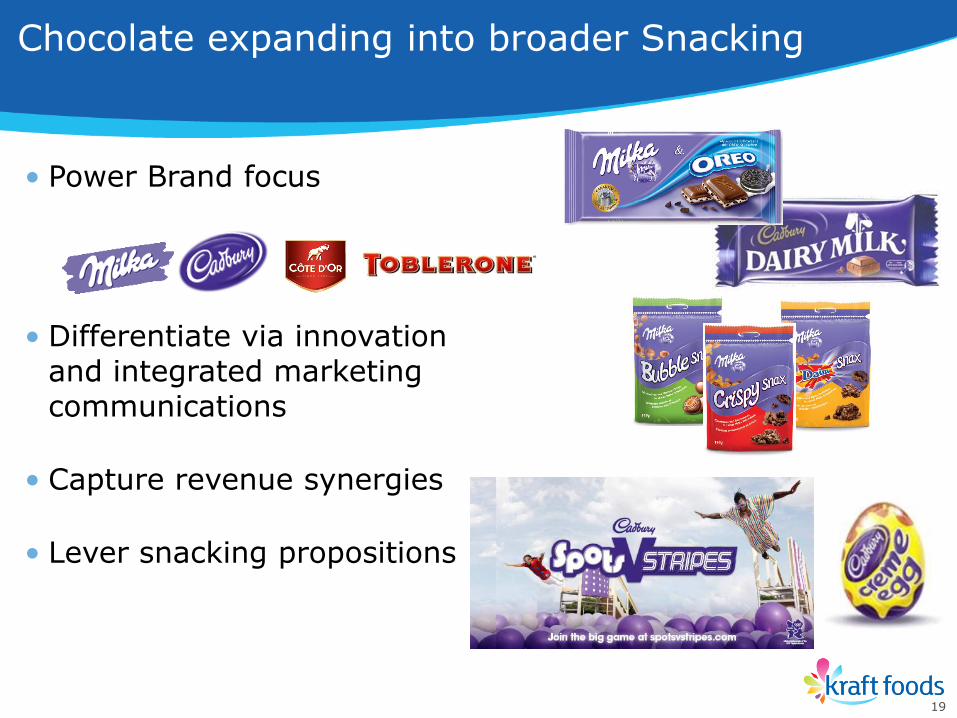
• Power Brand focus
• Differentiate via innovation and integrated marketing communications
• Capture revenue synergies
• Lever snacking propositions
Chocolate expanding into broader Snacking
19
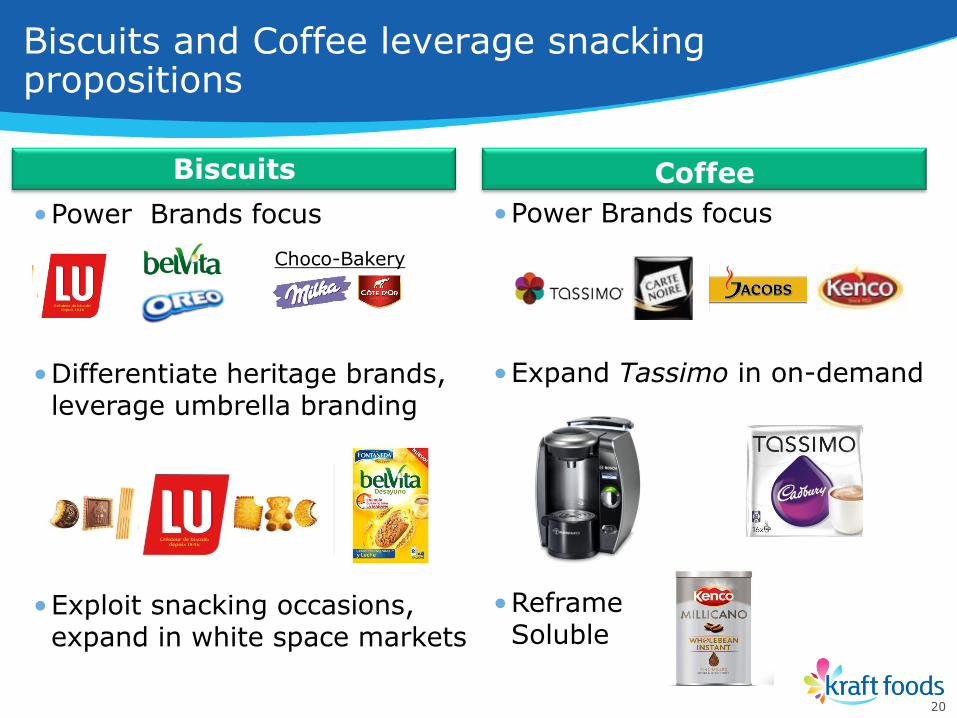
Biscuits
Biscuits and Coffee leverage snackingpropositions
Choco-Bakery
Spain Q1
2 Plain
UK Q1 Sandwich
UK/ Port Q3
•Power Brands focus
•Differentiate heritage brands, leverage umbrella branding
•Exploit snacking occasions, expand in white space markets
•Power Brands focus
•Expand Tassimo in on-demand
•Reframe Soluble
Coffee
20
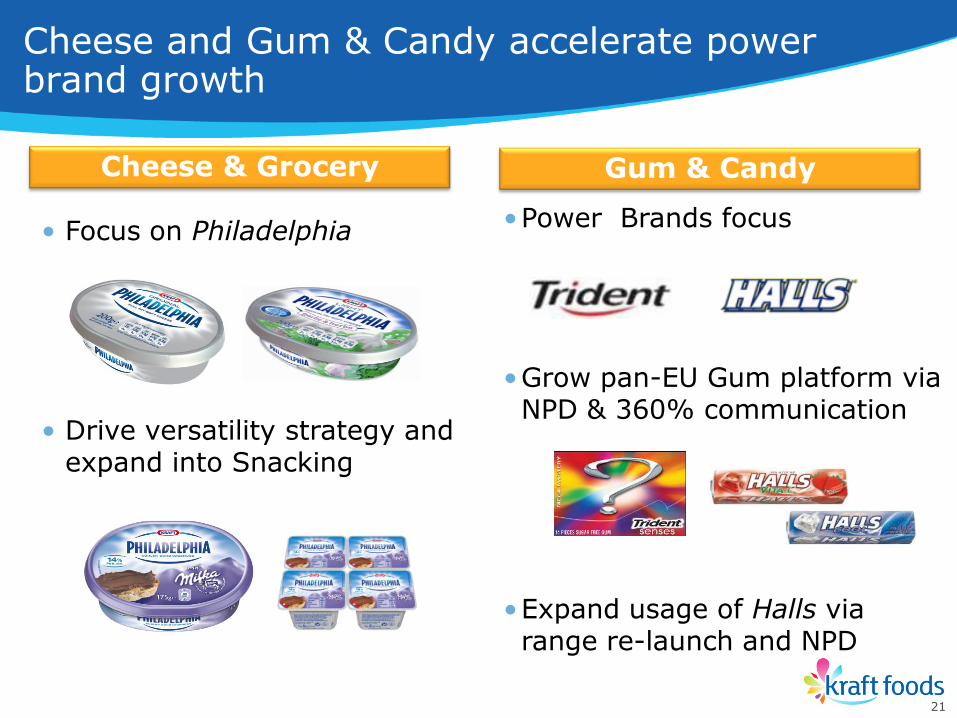
Gum & Candy
Cheese and Gum & Candy accelerate power brand growth
21
•Power Brands focus
•Grow pan-EU Gum platform via NPD & 360% communication
•Expand usage of Halls via range re-launch and NPD
• Focus on Philadelphia
• Drive versatility strategy and expand into Snacking
Cheese & Grocery
Gum
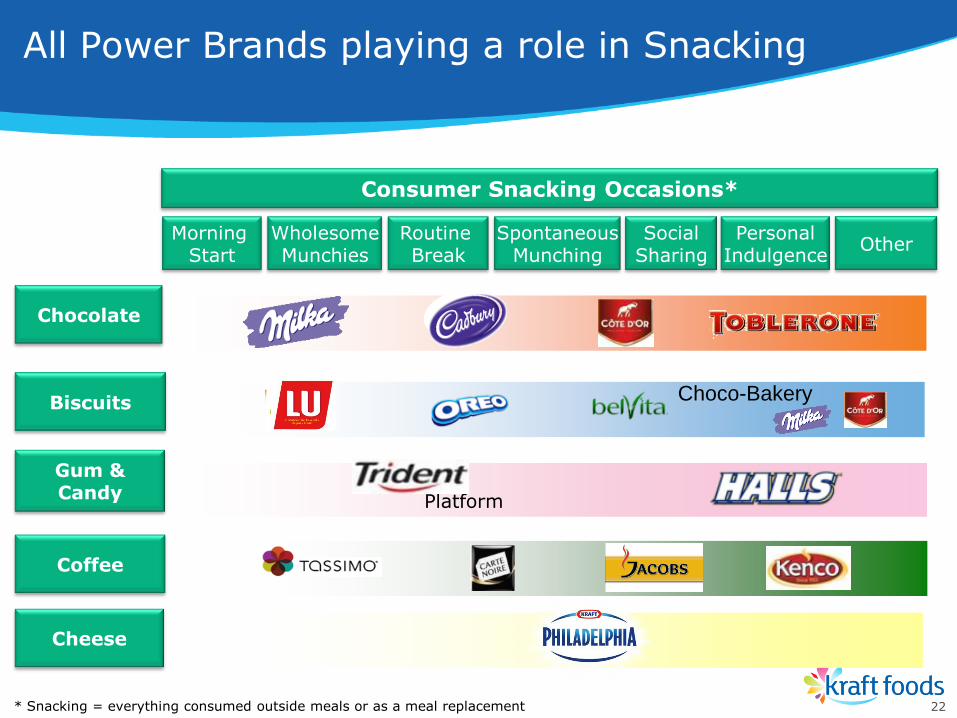
Chocolate
Biscuits
Gum & Candy
Cheese
Coffee
Morning Start
Choco-Bakery
Platform
WholesomeMunchies
Routine Break
SpontaneousMunching
SocialSharing
PersonalIndulgence
Consumer Snacking Occasions*
Other
All Power Brands playing a role in Snacking
* Snacking = everything consumed outside meals or as a meal replacement 22
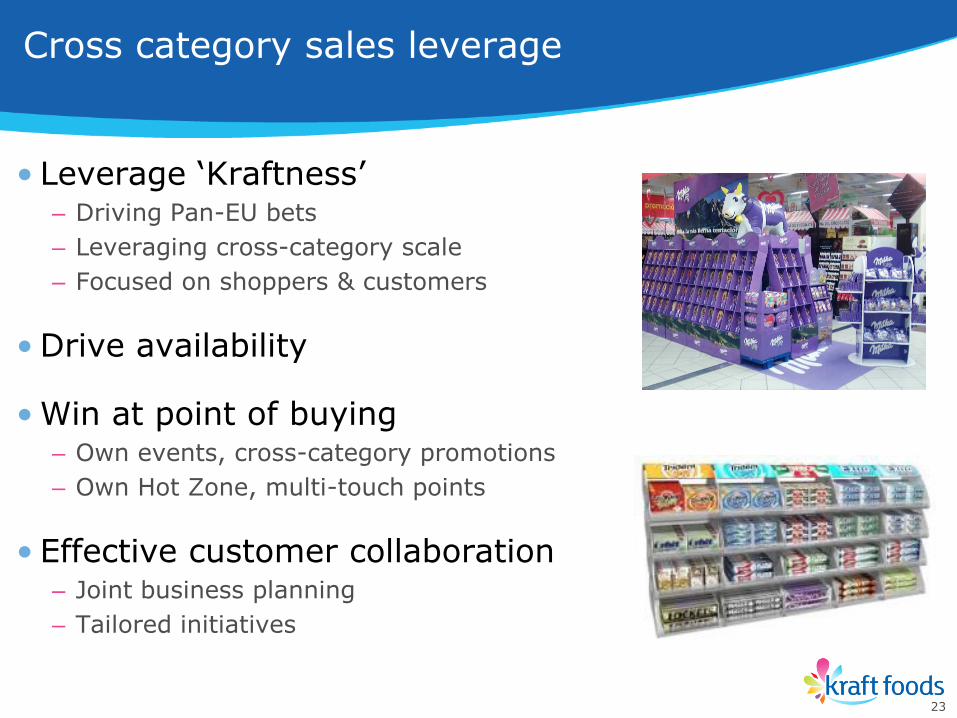
• Leverage „Kraftness‟– Driving Pan-EU bets
– Leveraging cross-category scale
– Focused on shoppers & customers
• Drive availability
• Win at point of buying– Own events, cross-category promotions
– Own Hot Zone, multi-touch points
• Effective customer collaboration– Joint business planning
– Tailored initiatives
Cross category sales leverage
23
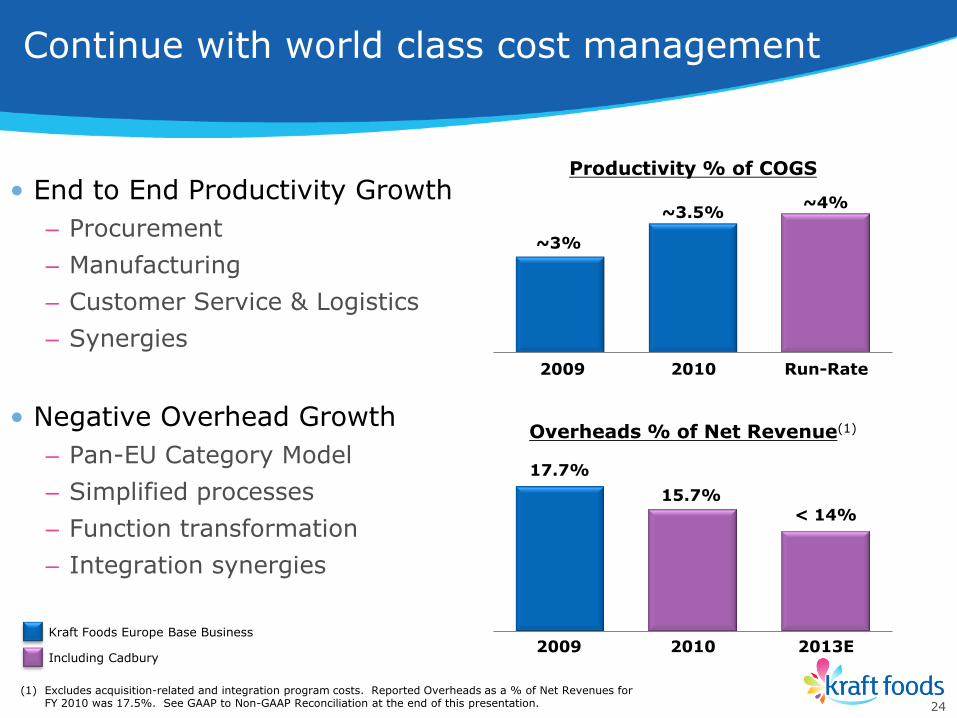
• End to End Productivity Growth
– Procurement
– Manufacturing
– Customer Service & Logistics
– Synergies
• Negative Overhead Growth
– Pan-EU Category Model
– Simplified processes
– Function transformation
– Integration synergies
Productivity % of COGS
Overheads % of Net Revenue(1)
~3%
~4%~3.5%
2009 Run-Rate2010
< 14%
2009 2013E2010
15.7%
17.7%
Continue with world class cost management
Including Cadbury
Kraft Foods Europe Base Business
(1) Excludes acquisition-related and integration program costs. Reported Overheads as a % of Net Revenues for FY 2010 was 17.5%. See GAAP to Non-GAAP Reconciliation at the end of this presentation. 24
•2010 – Announced pricing actions on majority of portfolio
– Not fully recovering rising input costs
– Strong cost management
•2011 – Commodities spikes continuing
– Additional pricing to cover majority of cost inflation
– Accelerated cost management and Cadbury integration synergies to deliver margin expansion
– Equity building paying off
Countering input cost inflation
25
•Our organization: „Fit to Win‟– Category model in place
– Integration on-track
– Pan-EU initiatives
•Our people: „Passion to Win‟– Build performance-driven, value-led culture
– Pride in our brands, external orientation
– Invest in Marketers and Sales teams
Building a winning organization
26
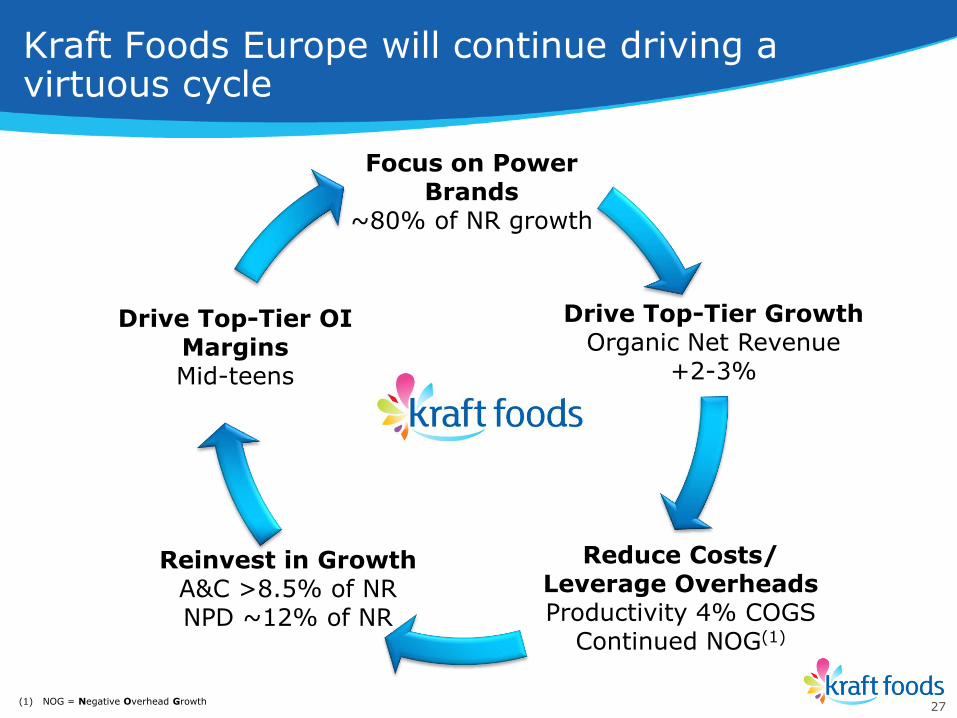
Focus on Power Brands
~80% of NR growth
Drive Top-Tier GrowthOrganic Net Revenue
+2-3%
Reduce Costs/Leverage OverheadsProductivity 4% COGS
Continued NOG(1)
Reinvest in GrowthA&C >8.5% of NRNPD ~12% of NR
Kraft Foods Europe will continue driving a virtuous cycle
27(1) NOG = Negative Overhead Growth
Drive Top-Tier OI MarginsMid-teens
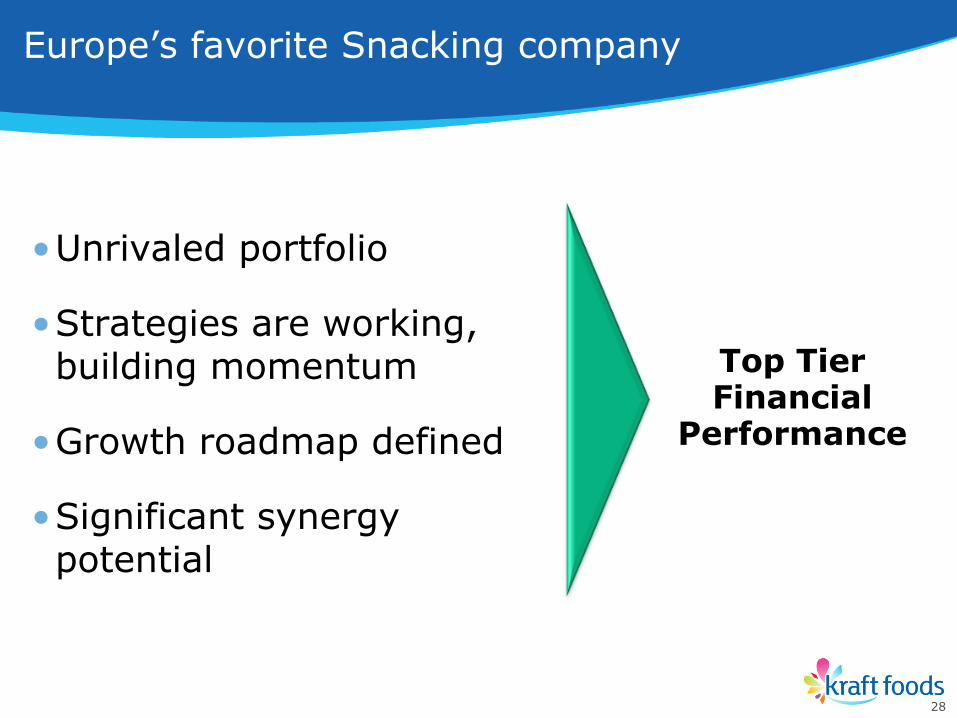
•Unrivaled portfolio
•Strategies are working, building momentum
•Growth roadmap defined
•Significant synergy potential
Top Tier Financial
Performance
Europe‟s favorite Snacking company
28
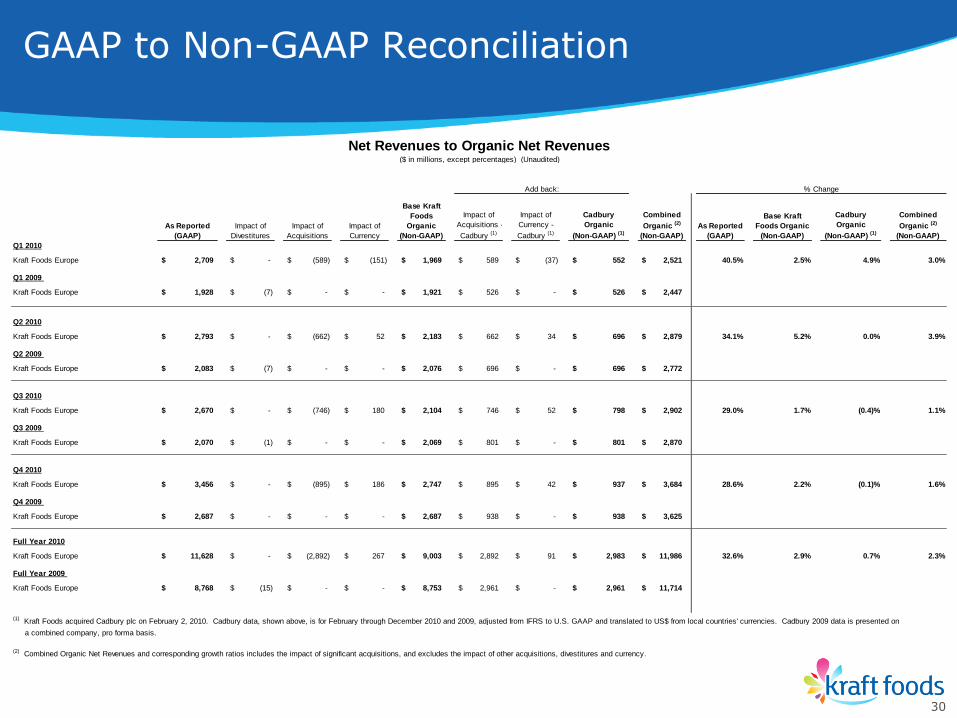
GAAP to Non-GAAP Reconciliation
30
As Reported
(GAAP)
Impact of
Divestitures
Impact of
Acquisitions
Impact of
Currency
Base Kraft
Foods
Organic
(Non-GAAP)
Impact of
Acquisitions -
Cadbury (1)
Impact of
Currency -
Cadbury (1)
Cadbury
Organic
(Non-GAAP) (1)
Combined
Organic (2)
(Non-GAAP)
As Reported
(GAAP)
Base Kraft
Foods Organic
(Non-GAAP)
Cadbury
Organic
(Non-GAAP) (1)
Combined
Organic (2)
(Non-GAAP)
Q1 2010
Kraft Foods Europe 2,709$ -$ (589)$ (151)$ 1,969$ 589$ (37)$ 552$ 2,521$ 40.5% 2.5% 4.9% 3.0%
Q1 2009
Kraft Foods Europe 1,928$ (7)$ -$ -$ 1,921$ 526$ -$ 526$ 2,447$
Q2 2010
Kraft Foods Europe 2,793$ -$ (662)$ 52$ 2,183$ 662$ 34$ 696$ 2,879$ 34.1% 5.2% 0.0% 3.9%
Q2 2009
Kraft Foods Europe 2,083$ (7)$ -$ -$ 2,076$ 696$ -$ 696$ 2,772$
Q3 2010
Kraft Foods Europe 2,670$ -$ (746)$ 180$ 2,104$ 746$ 52$ 798$ 2,902$ 29.0% 1.7% (0.4)% 1.1%
Q3 2009
Kraft Foods Europe 2,070$ (1)$ -$ -$ 2,069$ 801$ -$ 801$ 2,870$
Q4 2010
Kraft Foods Europe 3,456$ -$ (895)$ 186$ 2,747$ 895$ 42$ 937$ 3,684$ 28.6% 2.2% (0.1)% 1.6%
Q4 2009
Kraft Foods Europe 2,687$ -$ -$ -$ 2,687$ 938$ -$ 938$ 3,625$
Full Year 2010
Kraft Foods Europe 11,628$ -$ (2,892)$ 267$ 9,003$ 2,892$ 91$ 2,983$ 11,986$ 32.6% 2.9% 0.7% 2.3%
Full Year 2009
Kraft Foods Europe 8,768$ (15)$ -$ -$ 8,753$ 2,961$ -$ 2,961$ 11,714$
(1) Kraft Foods acquired Cadbury plc on February 2, 2010. Cadbury data, shown above, is for February through December 2010 and 2009, adjusted from IFRS to U.S. GAAP and translated to US$ from local countries' currencies. Cadbury 2009 data is presented on
a combined company, pro forma basis.
(2) Combined Organic Net Revenues and corresponding growth ratios includes the impact of significant acquisitions, and excludes the impact of other acquisitions, divestitures and currency.
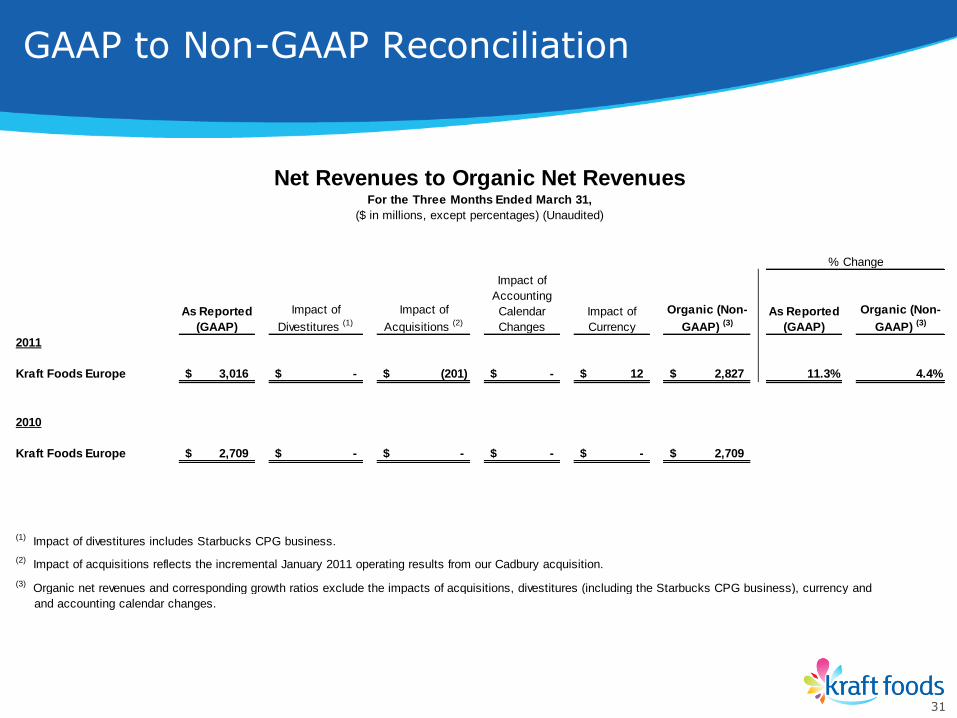
Net Revenues to Organic Net Revenues($ in millions, except percentages) (Unaudited)
Add back: % Change
GAAP to Non-GAAP Reconciliation
31
As Reported
(GAAP)
Impact of
Divestitures (1)
Impact of
Acquisitions (2)
Impact of
Accounting
Calendar
Changes
Impact of
Currency
Organic (Non-
GAAP) (3)
As Reported
(GAAP)
Organic (Non-
GAAP) (3)
2011
Kraft Foods Europe 3,016$ -$ (201)$ -$ 12$ 2,827$ 11.3% 4.4%
2010
Kraft Foods Europe 2,709$ -$ -$ -$ -$ 2,709$
(1) Impact of divestitures includes Starbucks CPG business.
(2) Impact of acquisitions reflects the incremental January 2011 operating results from our Cadbury acquisition.
(3) Organic net revenues and corresponding growth ratios exclude the impacts of acquisitions, divestitures (including the Starbucks CPG business), currency and
and accounting calendar changes.
Net Revenues to Organic Net RevenuesFor the Three Months Ended March 31,
($ in millions, except percentages) (Unaudited)
% Change
GAAP to Non-GAAP Reconciliation
32
As Reported
(GAAP)
Integration
Program Costs (1)
Acquisition-
Related Costs (2)
Underlying
(Non-GAAP)
As Reported
(GAAP)
Integration
Program Costs (1)
Acquisition-
Related Costs (2)
Underlying
(Non-GAAP)
As Reported
(GAAP)
Underlying
(Non-GAAP)
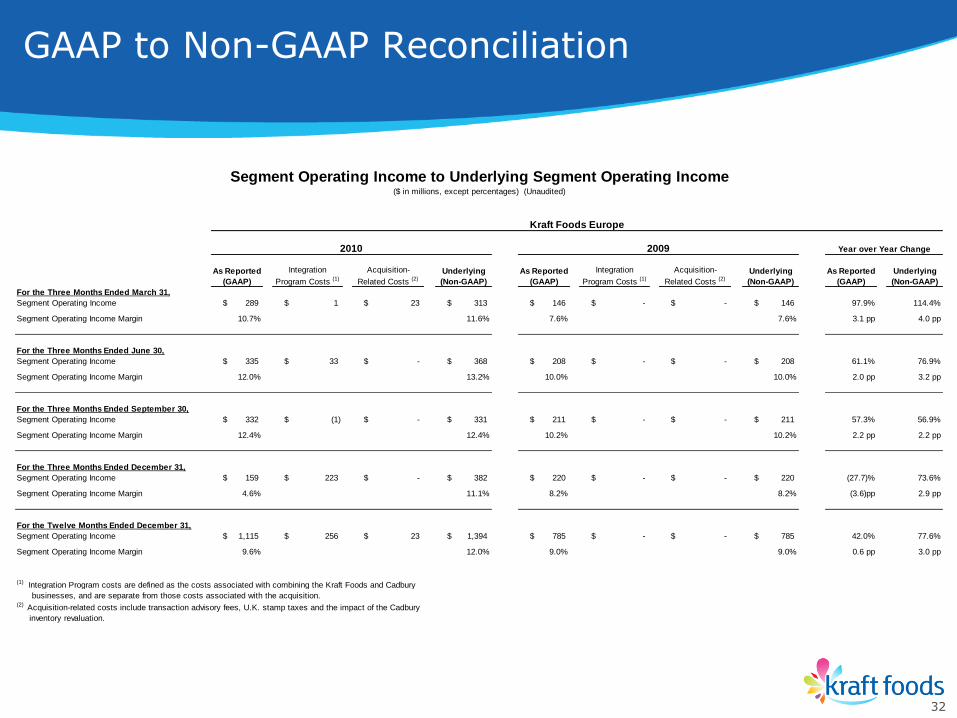
For the Three Months Ended March 31,
Segment Operating Income 289$ 1$ 23$ 313$ 146$ -$ -$ 146$ 97.9% 114.4%
Segment Operating Income Margin 10.7% 11.6% 7.6% 7.6% 3.1 pp 4.0 pp
For the Three Months Ended June 30,
Segment Operating Income 335$ 33$ -$ 368$ 208$ -$ -$ 208$ 61.1% 76.9%
Segment Operating Income Margin 12.0% 13.2% 10.0% 10.0% 2.0 pp 3.2 pp
For the Three Months Ended September 30,
Segment Operating Income 332$ (1)$ -$ 331$ 211$ -$ -$ 211$ 57.3% 56.9%
Segment Operating Income Margin 12.4% 12.4% 10.2% 10.2% 2.2 pp 2.2 pp
For the Three Months Ended December 31,
Segment Operating Income 159$ 223$ -$ 382$ 220$ -$ -$ 220$ (27.7)% 73.6%
Segment Operating Income Margin 4.6% 11.1% 8.2% 8.2% (3.6)pp 2.9 pp
For the Twelve Months Ended December 31,
Segment Operating Income 1,115$ 256$ 23$ 1,394$ 785$ -$ -$ 785$ 42.0% 77.6%
Segment Operating Income Margin 9.6% 12.0% 9.0% 9.0% 0.6 pp 3.0 pp
(1) Integration Program costs are defined as the costs associated with combining the Kraft Foods and Cadbury
businesses, and are separate from those costs associated with the acquisition.(2) Acquisition-related costs include transaction advisory fees, U.K. stamp taxes and the impact of the Cadbury
inventory revaluation.
Year over Year Change
Kraft Foods Europe
Segment Operating Income to Underlying Segment Operating Income($ in millions, except percentages) (Unaudited)
2010 2009
GAAP to Non-GAAP Reconciliation
33
As Reported
(GAAP)
Integration
Program Costs (1)
Acquisition-
Related Costs (2)
Underlying
(Non-GAAP)
As Reported
(GAAP)
Integration
Program Costs (1)
Acquisition-
Related Costs (2)
Underlying
(Non-GAAP)
As Reported
(GAAP)
Underlying
(Non-GAAP)
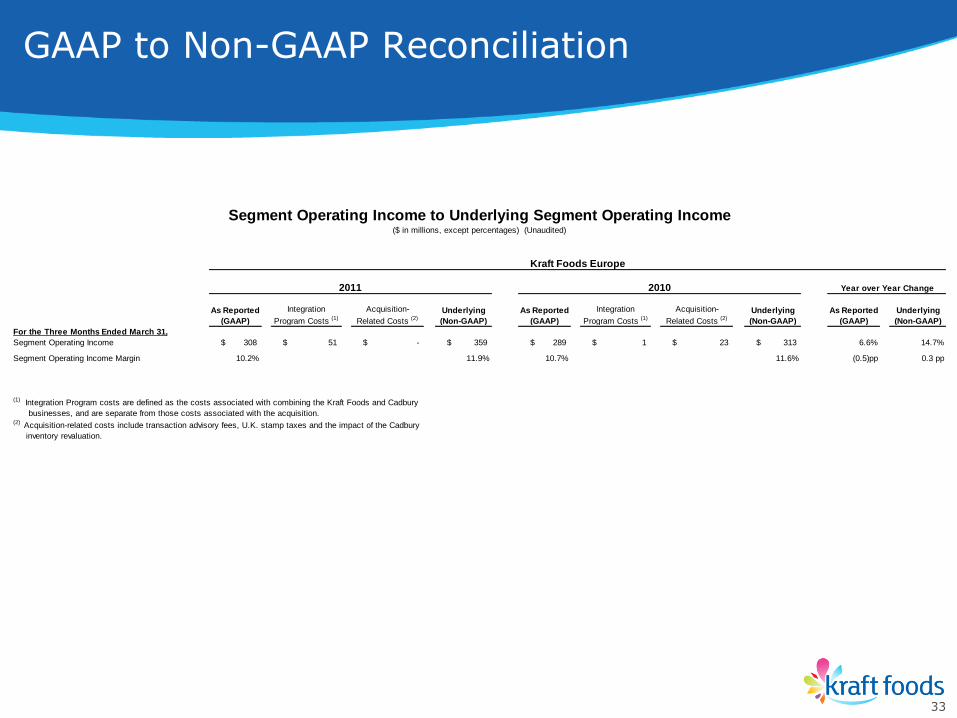
For the Three Months Ended March 31,
Segment Operating Income 308$ 51$ -$ 359$ 289$ 1$ 23$ 313$ 6.6% 14.7%
Segment Operating Income Margin 10.2% 11.9% 10.7% 11.6% (0.5)pp 0.3 pp
(1) Integration Program costs are defined as the costs associated with combining the Kraft Foods and Cadbury
businesses, and are separate from those costs associated with the acquisition.(2) Acquisition-related costs include transaction advisory fees, U.K. stamp taxes and the impact of the Cadbury
inventory revaluation.
Segment Operating Income to Underlying Segment Operating Income($ in millions, except percentages) (Unaudited)
Kraft Foods Europe
2011 2010 Year over Year Change
GAAP to Non-GAAP Reconciliation
34
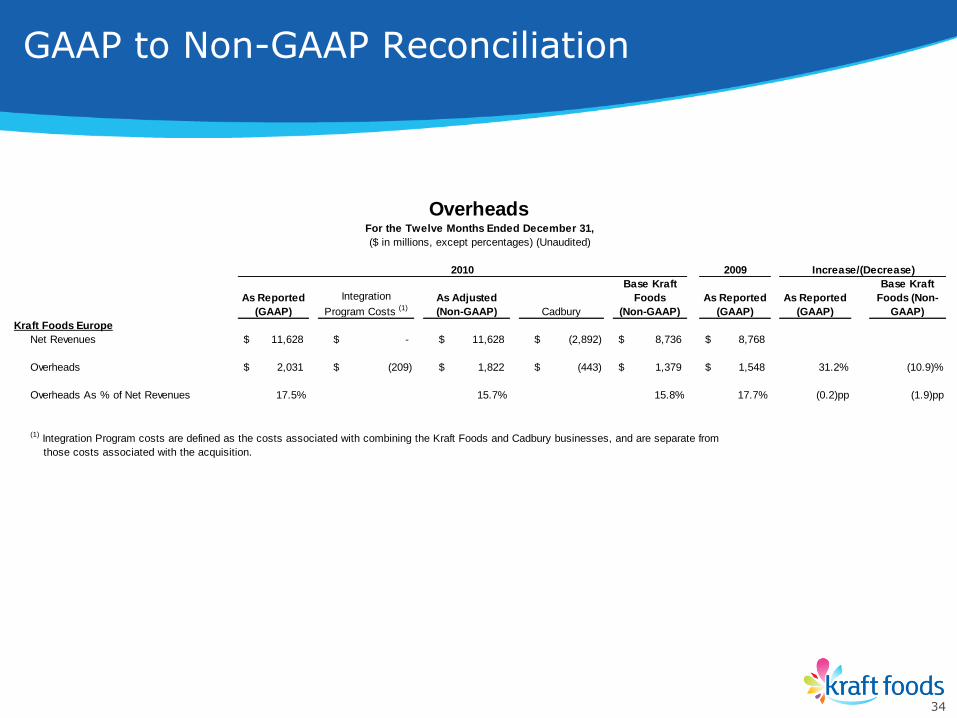
2009
As Reported
(GAAP)
Integration
Program Costs (1)
As Adjusted
(Non-GAAP) Cadbury
Base Kraft
Foods
(Non-GAAP)
As Reported
(GAAP)
As Reported
(GAAP)
Base Kraft
Foods (Non-
GAAP)
Kraft Foods Europe
Net Revenues 11,628$ -$ 11,628$ (2,892)$ 8,736$ 8,768$
Overheads 2,031$ (209)$ 1,822$ (443)$ 1,379$ 1,548$ 31.2% (10.9)%
Overheads As % of Net Revenues 17.5% 15.7% 15.8% 17.7% (0.2)pp (1.9)pp
(1) Integration Program costs are defined as the costs associated with combining the Kraft Foods and Cadbury businesses, and are separate from
those costs associated with the acquisition.
OverheadsFor the Twelve Months Ended December 31,
($ in millions, except percentages) (Unaudited)
2010 Increase/(Decrease)